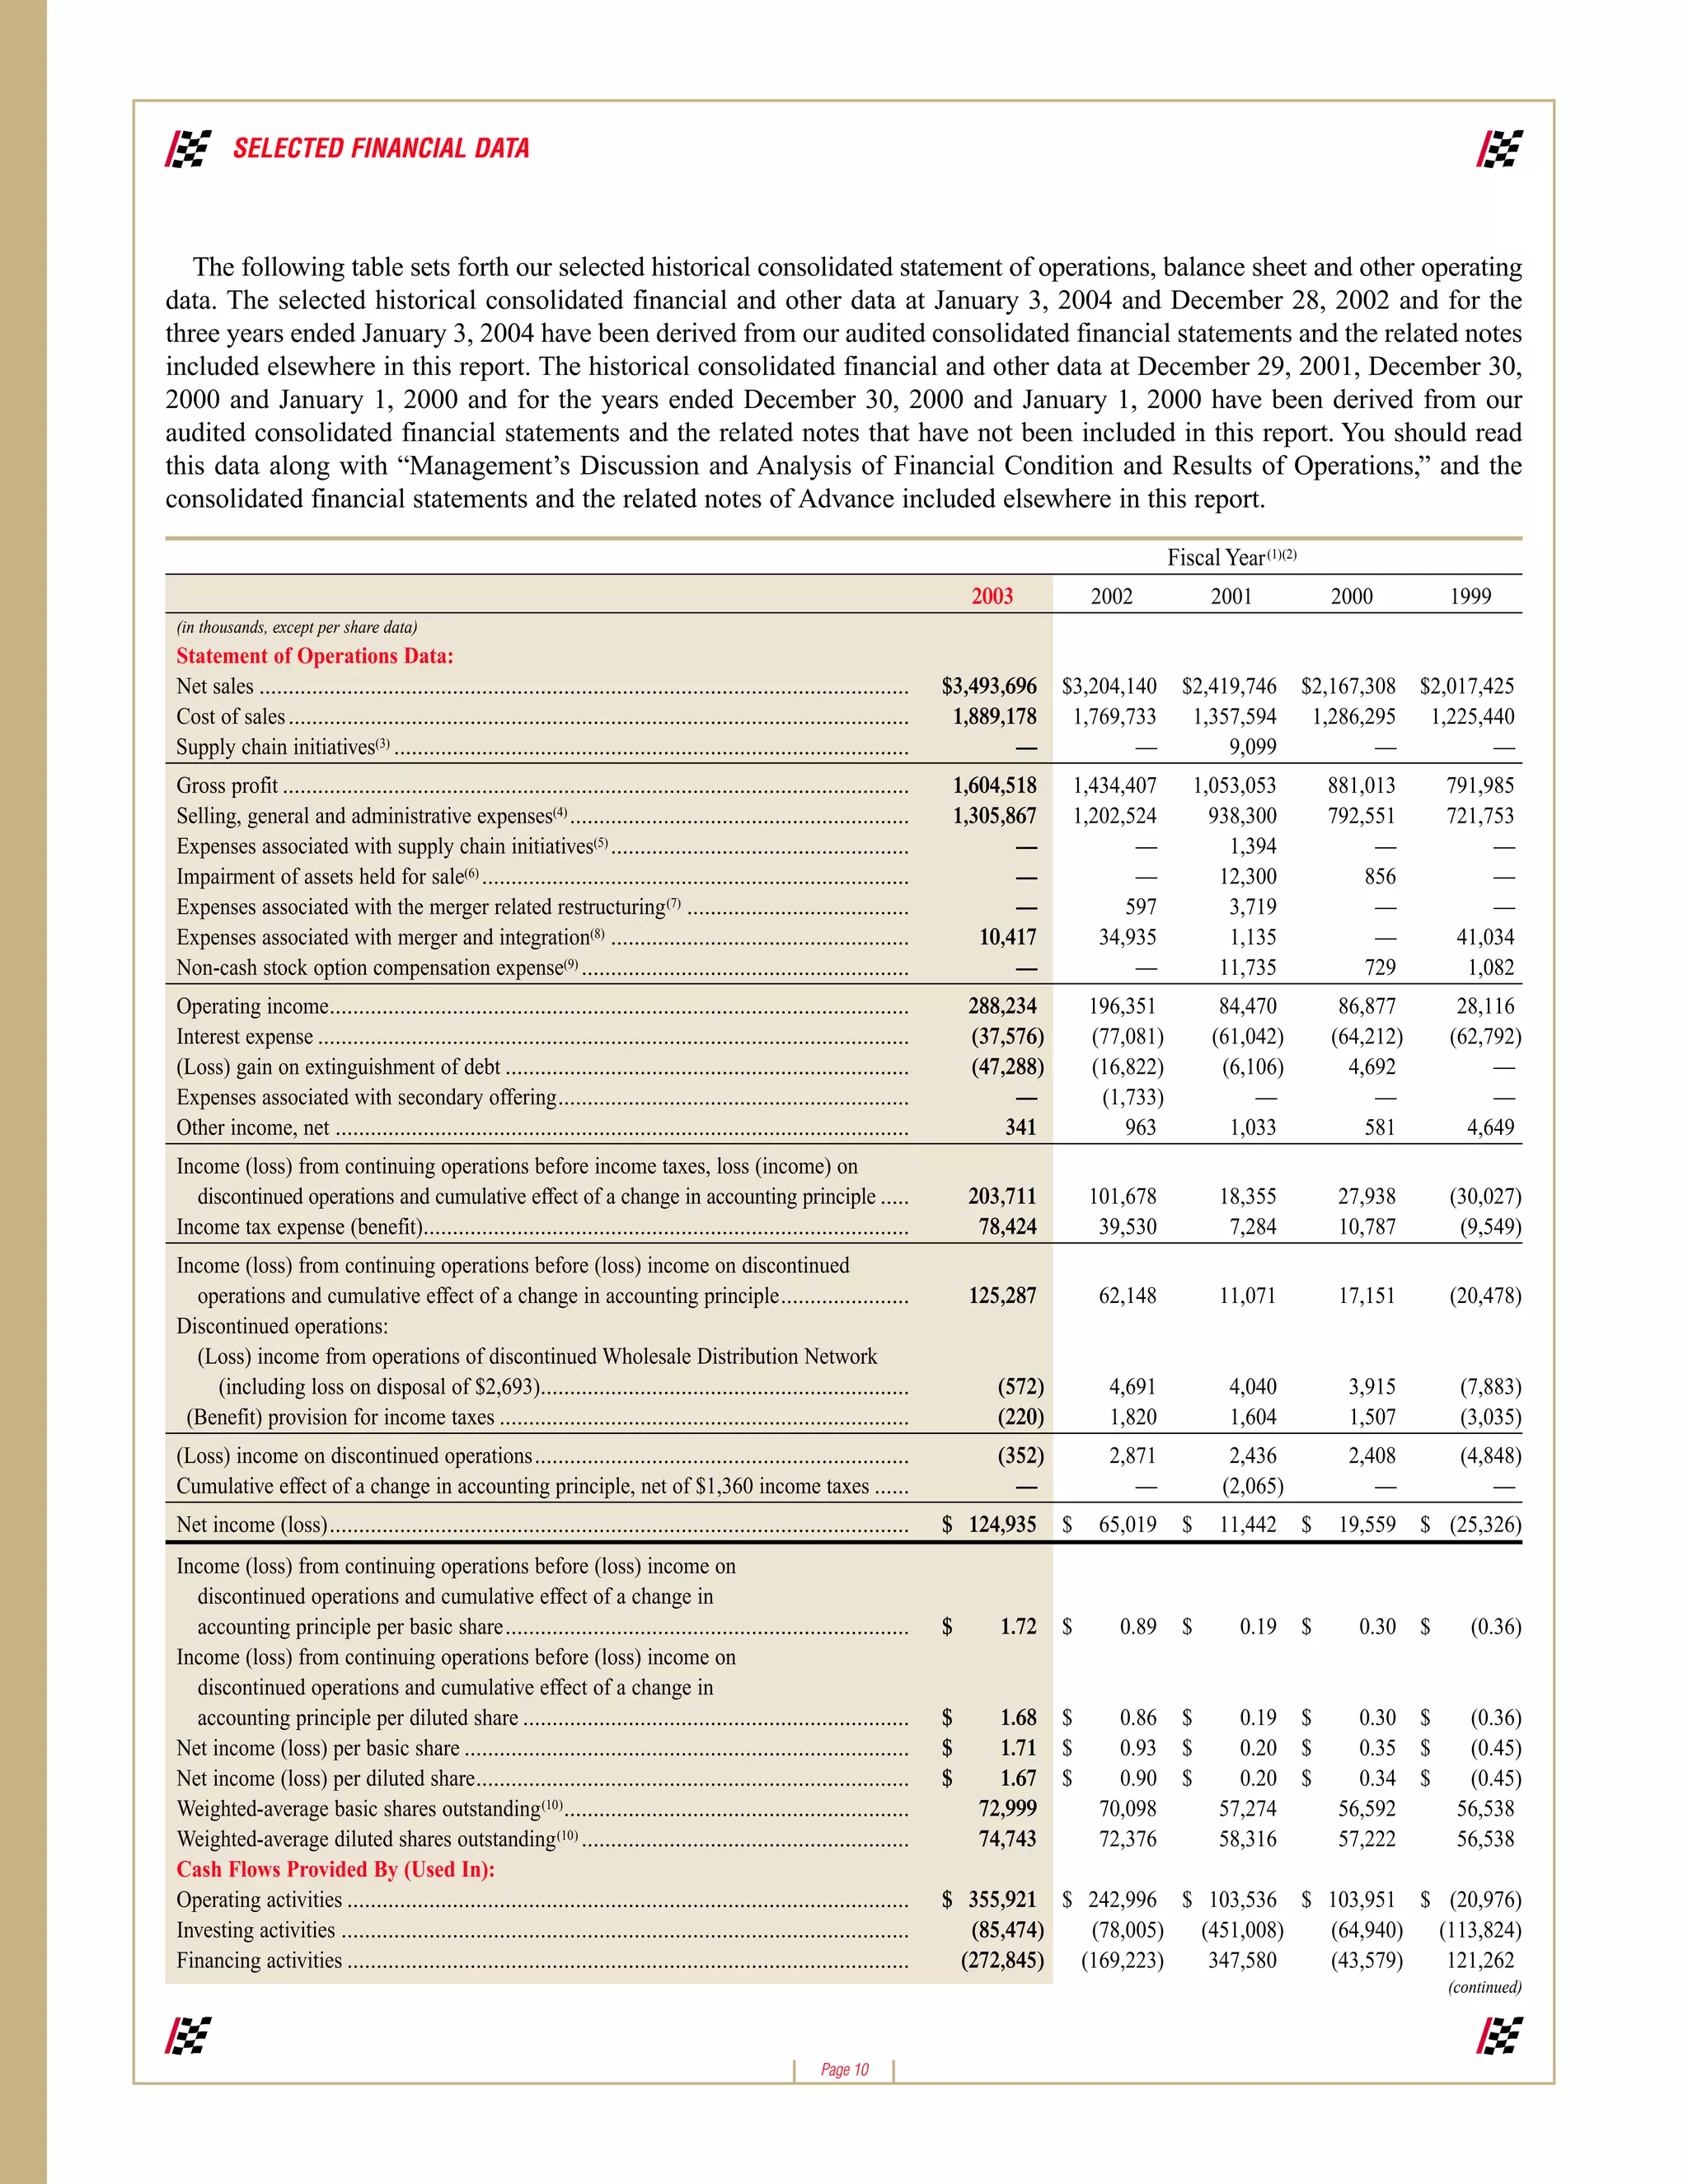
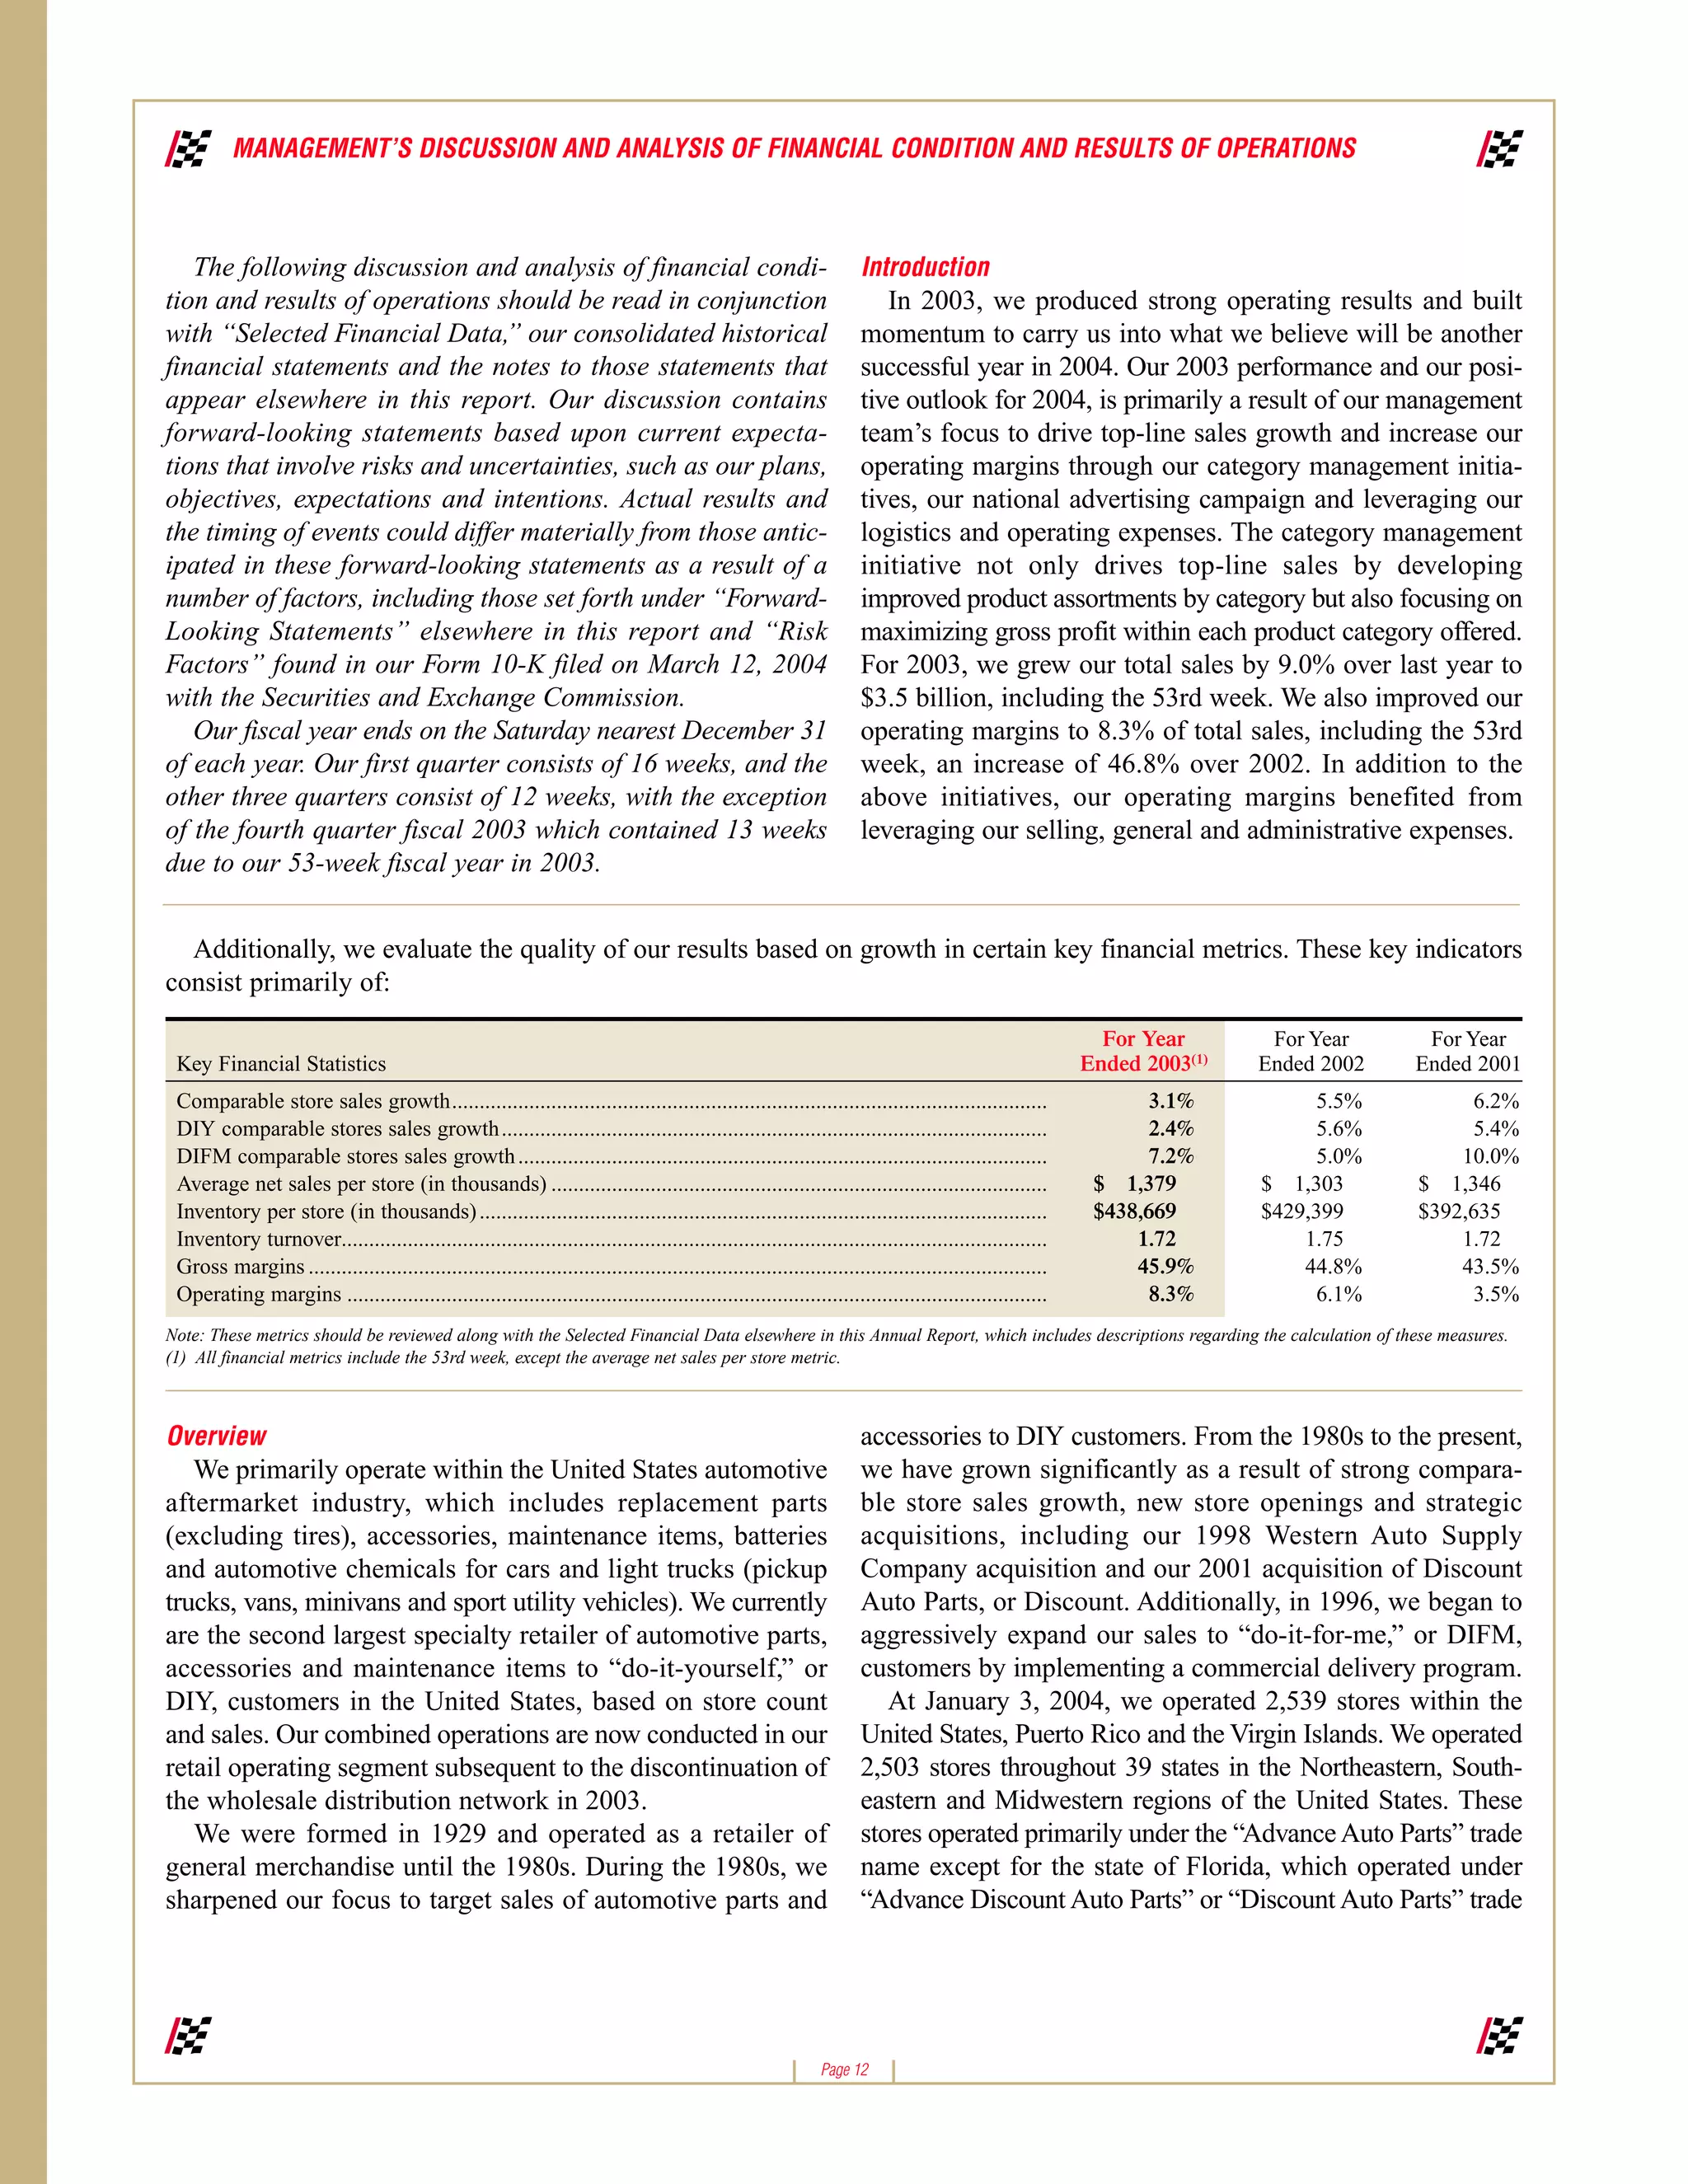
Advance Auto Parts experienced strong growth in 2003, building momentum across key metrics. With over 2,500 stores in 39 states, Puerto Rico and the Virgin Islands, the company served over 200 million customers in 2003. Same store sales grew 3.1% as initiatives like expanded private brands and improved supply chain efficiencies increased the number of customers and average transaction size. Operating margins increased to 8.3% of sales, up from 7.2% the prior year. Earnings per share also grew substantially.
Danaher Corporation reported its fourth quarter and full year 2001 results. For the fourth quarter, net earnings excluding restructuring charges were $76.6 million compared to $87.8 million in 2000. Full year 2001 net earnings excluding restructuring charges were $341.2 million, a 5% increase over 2000. However, Danaher recorded a $69.7 million restructuring charge in the fourth quarter related to manufacturing facility consolidations. For the full year, net earnings including restructuring charges were $297.7 million. Despite difficult economic conditions, Danaher was able to grow earnings in 2001 through aggressive cost reductions and restructuring actions.
This document provides supplemental financial information for SLM Corporation for the first quarter of 2007. It includes key statements of income figures for the quarters ending March 31, 2007, December 31, 2006, and March 31, 2006. Net income for the quarter increased significantly from the previous quarter due to higher gains on student loan securitizations. The company's net income was also up compared to the same quarter last year, driven by growth in interest income from its student loan portfolios.
This document provides financial information for SLM Corporation for the quarters ending March 31, 2007, December 31, 2006, and March 31, 2006. Some key details include:
- Net income for the quarters was $116 million, $18 million, and $152 million respectively.
- "Core Earnings" net income, which excludes certain items, was $251 million, $326 million, and $287 million respectively.
- Average managed student loans increased from $124.9 billion to $146.2 billion.
- Total assets increased from $97.8 billion to $126.9 billion over the period reported.
This document provides condensed financial statements for Qwest Communications International Inc. as of June 30, 2008. It includes statements of operations, balance sheets, and cash flows. For the six months ended June 30, 2008, Qwest reported total operating revenues of $3,382 million and net income of $188 million. Total assets as of June 30, 2008 were $21,894 million, with total liabilities of $21,391 million resulting in total stockholders' equity of $503 million. For the six months ended June 30, 2008, cash provided by operating activities was $1,297 million and cash used for investing activities, primarily capital expenditures, was $950 million.
This document provides supplemental financial information for SLM Corporation for the fourth quarter of 2006. It includes statements of income for the fourth quarter of 2006, the third quarter of 2006, and the fourth quarter of 2005, as well as for the full years 2006 and 2005. It also summarizes certain income statement items that were separately disclosed in the Company's earnings press releases and conference calls for each period. Key figures include net income of $18 million for Q4 2006, $263 million for Q3 2006, and $431 million for Q4 2005. For full year 2006, net income was $1.16 billion compared to $1.38 billion for 2005.
- Unisys Corporation reported consolidated financial results for the second quarter and first half of 2004, with total revenue of $1.38 billion and $2.85 billion respectively.
- Net income for the quarter was $19.4 million compared to $52.5 million for the same period in 2003. Net income for the first half was $48.3 million compared to $91 million the prior year.
- Services revenue was relatively flat at $1.16 billion for the quarter but increased to $2.32 billion for the first half, while technology revenue declined for both the quarter and six months.
Altria Group reported financial results for the first quarter of 2006 compared to 2005. Net revenues increased slightly to $24.4 billion from $23.6 billion, while operating companies income decreased to $4.2 billion from $4.4 billion. Earnings from continuing operations increased to $3.5 billion from $2.6 billion. On a per share basis, diluted earnings from continuing operations increased to $1.65 per share from $1.24 per share. The results were impacted by several factors including acquisitions, currency effects, asset impairment charges, and tax items.
This document provides an SEC quarterly report filed by Illinois Tool Works Inc. for the third quarter of 2004. It includes:
- Condensed income statements and balance sheets for the periods ended September 30, 2004 and 2003.
- A statement of cash flows for the nine month periods ended September 30, 2004 and 2003.
- Notes to the financial statements regarding stock-based compensation, inventories, comprehensive income, and investments.
The financial statements show the company's revenues, expenses, assets, liabilities, cash flows, and notes for the periods.
The document is Illinois Tool Works Inc.'s Form 10-Q filing for the quarterly period ended June 30, 2003. It includes Illinois Tool Works' unaudited financial statements, including their statement of income and statement of financial position for the periods. The statement of income shows that revenues increased but net income decreased in the first six months of 2003 compared to the same period in 2002. The statement of financial position lists their assets, liabilities, and stockholders' equity as of June 30, 2003 and December 31, 2002.
This document is Illinois Tool Works Inc.'s quarterly report filed with the SEC for the quarter ended June 30, 2004. It includes the company's unaudited financial statements, including statements of income, financial position, and cash flows for the quarter and year to date. Key highlights include total revenues of $3 billion for the quarter and $5.7 billion year to date, net income of $360 million for the quarter and $651 million year to date, and total assets of $11.9 billion and stockholders' equity of $8.2 billion as of June 30, 2004.
This document provides a summary of Bank of America's consolidated financial highlights for the second quarter of 2006 compared to previous periods. Some key points:
- Net income for the first half of 2006 was $10.5 billion, up from $9.1 billion for the same period of 2005. Revenue increased to $35.9 billion from $28.1 billion.
- Returns remained strong with a return on average assets of 1.47% and return on average common shareholders' equity of 16.34% for the first half of 2006.
- Book value per share of common stock increased to $28.17 at the end of the second quarter from $25.16 for the same period in 2005
This document is Gannett's 2003 annual report. It discusses Gannett's financial results for 2003, which included record operating revenues of $6.7 billion and net income of $1.21 billion, up 4% from 2002. It provides an overview of Gannett's business segments, which include newspapers, broadcasting stations, and digital media. The letter to shareholders discusses some of the challenges Gannett faced in 2003 from economic conditions and regulatory changes, but also highlights areas of growth such as new youth-oriented newspaper publications and increased online revenues. Acquisitions that expanded Gannett's operations in the U.S. and U.K. are also summarized.
The 2002 annual report summarizes Gannett Co.'s financial performance for the year. Key highlights include operating revenues of $6.4 billion, a 1.9% increase over 2001, operating income of $1.9 billion, a 21.2% increase over 2001, and net income of $1.16 billion, a 39.6% increase over 2001. The CEO notes that while the economy remained weak, Gannett performed well due to its preparations and success-focused culture, with operating cash flow increasing 5.7% and diluted earnings per share increasing 10% after adjusting for new accounting rules.
This document provides financial highlights and key metrics for MGM Mirage for the years 1998-2002. It summarizes that in 2002, MGM Mirage achieved record net revenues of over $4 billion and record earnings per share of $1.83, up 73% from 2001. It also reduced its debt by $314 million through repayments and repurchased $208 million of its own stock. MGM Mirage invested $295 million back into its properties for expansion and development projects.
This document provides financial information for SLM Corporation for the quarter ending June 30, 2007 and comparisons to previous periods. Some key details include:
- Net income for the quarter was $966 million compared to $116 million in the previous quarter and $724 million in the same quarter last year.
- "Core earnings" which is a non-GAAP measure of profitability was $189 million for the quarter compared to $251 million in the previous quarter and $320 million in the same quarter last year.
- Average managed student loans for the quarter were $152.3 billion compared to $146.2 billion in the previous quarter and $128.4 billion in the same quarter last year.
Qwest Communications International Inc. reported financial results for the first quarter of 2008. Total operating revenue declined 1.4% year-over-year to $3.4 billion. Net income decreased 34.6% to $157 million compared to $240 million in the first quarter of 2007. Basic earnings per share fell 30.8% to $0.09 from $0.13 in the previous year.
This document provides financial information for SLM Corporation for quarters ending December 31, 2006, September 30, 2006, and December 31, 2005 and years ending December 31, 2006 and December 31, 2005. It includes selected financial information such as net income, earnings per share, and return on assets calculated on a GAAP and "Core Earnings" basis. It also provides details on average and ending loan balances, interest income and expense, net interest income, and provisions for losses.
plains all american pipeline 2005 10-K part 2finance13
- The document provides financial and operating data for Plains All American Pipeline, L.P. for the years 2001-2005, including revenues, expenses, assets, liabilities, net income, cash flows, and common unit price and distribution information.
- It discusses that Plains All American's common units are publicly traded on the NYSE and provides unit price and distribution data for 2004-2005.
- It also summarizes Plains All American's cash distribution policy to unitholders and incentive distribution rights for its general partner.
DTE Energy filed its second quarter 2003 Form 10-Q with the SEC, reporting a loss of $39 million compared to an unaudited loss of $23 million previously announced. This was due to less insurance coverage than expected for an April ice storm. Operating earnings for the quarter were $70 million, in line with the company's full-year 2003 operating earnings guidance of $3.10-$3.30 per share. The earnings revision did not impact the company's operating earnings outlook or internal performance measures.
This document contains financial statements and information for Unisys Corporation for the three and six month periods ending June 30, 2008 and June 30, 2007. It shows that for the three month period ending June 30, 2008, Unisys had a net loss of $14.0 million compared to a net loss of $65.5 million for the same period in 2007. For the six month period ending June 30, 2008, Unisys had a net loss of $37.4 million compared to a net loss of $61.9 million for the same period in 2007. Cash and cash equivalents decreased by $358.8 million during the first six months of 2008.
Employees want to feel their work matters and connects to broader goals. Providing measurable goals and allowing employees to track their own progress independently can increase job satisfaction. Taking personal interest in employees, showing understanding of their challenges, and giving credit for their successes helps them feel valued rather than invisible.
This document discusses the use of videoconferencing in education. It outlines benefits such as allowing different classes to learn together virtually, building community between schools, and exposing students to other cultures. However, it also notes drawbacks like the costs of equipment and training and some teachers feeling overwhelmed by the new technology. After weighing both the positives and negatives, the document ultimately concludes that the benefits of videoconferencing outweigh the drawbacks and it can have a positive impact on education.
You are invited to attend a weekend event called "Play it Forward" from Friday April 17 to Sunday April 19 at the Schoenstatt Training Centre in Constantia. The event is free with an optional R1400 investment if you want to support the initiative. The event will explore concepts of disobedience, radical obedience, and flow through interactive exercises and discussions. Participants can expect to slow down, reflect on challenges in the world, and work on personal and collective obstacles. The goal is to support individuals in following their dreams and co-creating a community of like-minded people. Attendance is by invitation only from existing community members.
The annual report summarizes Advance Auto Parts' strong financial results for 2004. Some key points:
- 2004 was another record year, with sales reaching $3.77 billion and comparable operating income growing 38.8% to $328.8 million.
- The company executed well on customer-focused initiatives and took advantage of the strong automotive industry.
- Advance Auto Parts operates over 2,650 stores across 39 states and territories, with over 37,000 employees.
- Leadership is committed to continued growth and improving operating margins through initiatives like new store openings and supply chain efficiencies.
The 2001 Annual Report for Adolph Coors Company discusses:
1) Coors made progress in key areas like reducing operating costs despite challenges from a tough market environment, helping profits grow over 5% despite falling short of goals.
2) Initiatives to improve efficiency and productivity started showing benefits, while investments in branding helped strengthen the Coors portfolio.
3) Volume was down 1.2% from the previous year due to an extra week in 2000, but excluding that week volume was only down 0.1% and sales to retail were down 0.5%. Net sales grew 0.6% and earnings per share grew over 5%.
4) The acquisition of Carling in the UK significantly
This 3 slide slide show provides an introduction and is presented by Soonee. It begins with a welcoming message and introduces the topic of the slide show and its presenter Soonee. An invocation to Lord Ganesha is also included.
The document is a collection of photos from various wedding photography websites and does not contain any accompanying text. It consists solely of photo credits to different photographers and does not provide any other information about the photos.
This document summarizes the financial performance of a company for the third quarter and fiscal year ending June 30, 2005 compared to the prior year. It shows that net sales increased 6% for the quarter and 5% for the year. Earnings from continuing operations were $156 million for the quarter and $517 million for the year. The company also had significant earnings from discontinued operations of $579 million for the year from the sale of a business unit.
Omnicom reported strong financial results for 2007, with revenue increasing 11.6% to $12.7 billion and net income growing 13% to $976 million. Earnings per share rose 18% to $2.95. The company continued to invest in its businesses, expanding capabilities in digital and new markets. Omnicom agencies received numerous awards for creative excellence. Looking ahead, Omnicom is well positioned with a diverse portfolio but economic challenges may impact some clients. The company will focus on consistent long-term results and building capabilities around client needs through organic growth and acquisitions.
This document summarizes Clorox's focus on four megatrends - health and wellness, convenience, environmental sustainability, and a more multicultural marketplace - to drive their business growth. It provides examples of how Clorox is bringing these megatrends to life through new products, marketing campaigns, and insights into consumer behaviors. Clorox aims to meet everyday consumer needs through innovation that improves health, reduces environmental impact, saves time, and resonates across cultures.
Stories like Zendesk Alternative highlight something that B2B technology companies all know: marketers need creative content that tells delightful, human stories that connects the user to the product.
For B2B technology companies, compelling content is becoming an increasingly critical tool to continuously engage customers over longer buying cycles.
These marketers are not just in the business of promoting, they are in the business of educating customers too.
B2B tech marketers are being tasked to not only tell interesting, visual stories about their products that capture attention, but also provide a curriculum to educate prospective buyers.
In this report, we’ll take a look at the emerging content trends in the B2B technology industry, examine case studies of brands taking content to a whole new level, and analyze where the industry is headed in 2015.
This document is Omnicom Group's 1996 annual report. It provides financial highlights and key metrics for 1996 compared to 1995, showing growth in areas like worldwide billings (up 19%), revenues (up 17%), and net income (up 26%). It also discusses the performance of Omnicom's major subsidiaries - BBDO Worldwide, DDB Needham Worldwide, TBWA International, and others. Overall, 1996 was another strong year for Omnicom with continued global expansion and growth.
This document is the annual report for Omnicom for 1998. It provides financial highlights and comparisons for 1998 versus 1997, showing increases in billings, commissions and fees, operating expenses, and net income both domestically and internationally. The report discusses record results for the 12th consecutive year, with worldwide revenues from commissions and fees increasing 31% to $4.1 billion. Net income reached $285 million, a 28% increase. The report also provides an overview of Omnicom's advertising agency brands and their performance in 1998, including new business wins and awards received. It discusses acquisitions and growth across Omnicom's network of marketing services companies.
Code Reviews - developer conference 2013Frank Sons
Peer review is a process where subject experts evaluate research or work to assess its suitability, accuracy, and validity. It involves having multiple experts review and critique a work to establish its credibility before being accepted and disseminated. Peer review aims to ensure high standards through evaluation by others working in the same field.
The document summarizes the financial performance of a company for the third quarter and first nine months of fiscal years 2007 and 2006. It shows that net sales increased 7% for the quarter and 5% year-to-date. Earnings from continuing operations increased 15% for the quarter and 14% year-to-date. The Household and Specialty segments saw increased sales and earnings growth while International saw moderate growth. Total assets were $3.69 billion with total liabilities of $3.60 billion, leaving stockholders' equity of $159 million.
Liz Claiborne Inc. designs and markets fashion apparel and accessories across multiple brands, channels, and geographies. This multi-brand, multi-channel, multi-geography portfolio provides flexibility to address trends and changes in consumer behavior, helping to protect shareholder value. In 2003, Liz Claiborne Inc. saw sales increase 14.1% to $4.24 billion due in part to organic growth and acquisitions, as well as conservative inventory management and expense controls. The company's diverse portfolio strategy allows it to appeal to a wide range of consumer tastes and adapt to an unpredictable fashion industry.
Ball Corporation is a provider of metal and plastic packaging for beverages, foods, and household products. In 2006:
- Ball acquired U.S. Can, making it the largest manufacturer of aerosol cans in North America. It also acquired plastic bottle assets from Alcan Packaging.
- Financial highlights included a 10.9% annual return for shareholders and $6.6 billion in net sales. However, free cash flow was lower than expected at $183 million.
- A fire destroyed one of Ball's beverage can plants in Germany, but the company has plans to rebuild it and add capacity elsewhere to compensate.
1) Ball Corporation is a provider of metal and plastic packaging for beverages, foods and household products, as well as aerospace technologies and services.
2) In 2006, Ball expanded its product portfolio and global footprint through acquisitions but faced challenges from inflationary pressures and a plant fire in Germany.
3) While free cash flow was lower than expected in 2006 due to high raw material inventories, Ball expects free cash flow to reach at least $350 million in 2007 as materials are drawn down and strategic actions from 2006 provide benefits.
The Crown Holdings 2004 Annual Report provides financial highlights and a letter to shareholders from the CEO. Key details include:
- Net sales grew 8.6% to $7.2 billion in 2004, with segment income up 31.3% and net income of $51 million compared to a net loss in 2003.
- Free cash flow was $266 million in 2004, down from $314 million in 2003 but supporting ongoing debt reduction.
- All operating divisions saw sales, segment income, and margin growth in 2004 despite currency impacts.
- Research and development efforts continued to bring new products to market.
- 2004 marked the conclusion of an initial turnaround phase with ongoing progress expected in 2005.
The 2004 annual report of Crown Holdings, Inc. provides financial highlights and a letter to shareholders. Key details include:
- Net sales grew 8.6% to $7.2 billion in 2004, with segment income up 31.3% and net income of $51 million compared to a loss of $32 million in 2003.
- Free cash flow was $266 million in 2004, down from $314 million in 2003 but supporting debt reduction.
- All operating divisions saw sales, segment income, and margin growth in 2004 both with and without currency effects.
- Research and development led to numerous new product innovations helping drive further business improvements.
- The report outlines goals to continue strengthening operations and pursuing growth opportunities
The 2004 Annual Report of Crown Holdings, Inc. provides key financial highlights and information about the company. Net sales increased 8.6% to $7.2 billion in 2004. Segment income, a measure of operational performance, grew 31.3% to $537 million. Net income was $51 million compared to a net loss of $32 million in 2003. The company invites shareholders to attend its annual meeting on April 28, 2005 to review the annual report, financial statements, and vote on shareholder proposals.
The 2004 annual report of Crown Holdings, Inc. provides financial highlights for the year including an 8.6% increase in net sales to $7.2 billion and a 31.3% increase in segment income to $537 million. The report notes continued progress in line with the company's turnaround plan established in 2001 including a $266 million free cash flow. Each of the company's divisions saw sales, segment income, and margin growth for the year. The report discusses new product innovations and growth opportunities in emerging markets that position the company for further advances in 2005.
The document is Crown's 2003 annual report which includes:
- An invitation for shareholders to attend Crown's annual meeting on April 22, 2004.
- Financial highlights showing Crown's sales, losses, assets, debt, and other financial metrics for 2003 and 2002.
- A letter to shareholders detailing Crown's strategic focus on metal packaging and plastic closures, debt refinancing in 2003, improvements across divisions in 2003, and goals for continued performance improvements.
- Information on Crown's board of directors and corporate officers.
The document is Crown's 2003 annual report which includes:
- An invitation to shareholders to attend the annual meeting on April 22, 2004.
- Financial highlights showing improved performance from 2002 to 2003 including reduced losses.
- A letter to shareholders detailing strategic changes making the company more focused on metal packaging and plastic closures, improved financial guidelines, debt restructuring, and performance improvements across divisions.
- Information on the board of directors and corporate officers.
The document is Crown's 2003 annual report which includes:
- An invitation for shareholders to attend Crown's annual meeting on April 22, 2004.
- Financial highlights showing Crown's sales, losses, assets, debt, and other financial metrics for 2003 and 2002.
- A letter to shareholders detailing Crown's strategic focus on metal packaging and plastic closures, debt refinancing in 2003, operating improvements across divisions, new product developments, and outlook.
- Information on Crown's board of directors and corporate officers.
The document is Crown's 2003 Annual Report. It announces the date and location of the upcoming annual shareholder meeting on April 22, 2004 and that proxy statements will be mailed on or around March 19, 2004. It includes the financial highlights from 2003 including a net loss of $32 million and loss per share of $0.19. It also provides information on assets, debt, cash flow, number of employees and shareholders.
This annual report summarizes the financial performance of Circuit City Stores, Inc. and its subsidiaries Circuit City and CarMax for the fiscal year 2000. Some key highlights include:
- Circuit City Stores saw net sales of $12.6 billion in 2000, up from $10.8 billion in 1999. Earnings from continuing operations were $327.8 million.
- The Circuit City Group, which includes Circuit City retail stores and CarMax, had net sales of $10.6 billion in 2000, up from $9.3 billion in 1999. Earnings from continuing operations before interest in CarMax were $326.7 million.
- CarMax operated 40 used car superstores and franchises
This annual report summarizes the financial performance of Circuit City Stores, Inc. and its subsidiaries Circuit City and CarMax for the fiscal year 2000. Some key highlights include:
- Circuit City Stores saw net sales of $10.8 billion in fiscal year 2000, up from $8.87 billion in 1999. Earnings from continuing operations were $211 million.
- The Circuit City Group, which includes Circuit City retail stores and CarMax, had net sales of $9.34 billion in 2000, up from $8 billion in 1999. Earnings from continuing operations before interest in CarMax were $235 million.
- CarMax operated 40 used car superstores and franchises in 2000, up
- Crown Holdings, Inc. is a packaging company that experienced strong financial results in 2007, with net sales increasing 10.7% to $7.7 billion and income from continuing operations growing 554.4% to $528 million.
- The company focuses on sustainable rigid metal packaging for beverages, food, personal care and household products globally. It saw organic volume growth in international beverage cans.
- Crown Holdings invested in new production facilities in regions with fast growing demand, such as the Middle East, Europe, Vietnam, Cambodia and Brazil, and expects continued momentum in 2008 with additional new capacity planned or under construction.
- Crown Holdings, Inc. is a packaging company that experienced strong financial results in 2007, with net sales increasing 10.7% to $7.7 billion and income from continuing operations growing 554.4% to $528 million.
- The company focuses on sustainable rigid metal packaging for beverages, food, personal care and household products globally. It saw organic volume growth in international beverage cans.
- Crown Holdings invested in new production facilities in regions with fast growing demand, such as the Middle East, Europe, Vietnam, Cambodia and Brazil, and expects continued momentum in 2008.
- Crown Holdings, Inc. is a packaging company that experienced strong financial results in 2007, with net sales increasing 10.7% to $7.7 billion and income from continuing operations growing 554.4% to $528 million.
- The company focuses on sustainable rigid metal packaging and has operations in the Americas, Europe, and Asia-Pacific regions.
- For 2008, Crown Holdings expects continued momentum as demand remains strong and recently added production capacity in various regions comes online.
This document contains condensed consolidated financial statements for Qwest Communications International Inc. as of September 30, 2008. It includes statements of operations, balance sheets, and cash flows for quarterly and annual periods between 2006 and 2008. The statements show that in 2007 Qwest reported a net income of $2.9 billion compared to $593 million in 2006, driven largely by a one-time $2.1 billion tax benefit recognized in the third quarter of 2007. Total operating revenues have remained relatively steady between $13-14 billion annually over this period.
This document provides financial information for SLM Corporation for the quarters ending March 31, 2008, December 31, 2007 and March 31, 2007. Some key details include:
- For the quarter ending March 31, 2008, SLM Corporation reported a net loss of $104 million compared to a net loss of $1.6 billion for the quarter ending December 31, 2007 and net income of $116 million for the quarter ending March 31, 2007.
- "Core earnings" which excludes certain items, was a net income of $188 million for the quarter ending March 31, 2008, a net loss of $139 million for the quarter ending December 31, 2007 and a net income of $251 million for the quarter ending
plains all american pipeline 2004 10-K part 2finance13
This document provides an overview and financial data for Plains All American Pipeline, L.P. It discusses the company's operations in crude oil transportation, gathering, marketing, terminalling and storage. Key details include:
- The company owns approximately 15,000 miles of crude oil pipelines and 37 million barrels of storage capacity, handling over 2.4 million barrels per day.
- For 2004, revenues were $20.975 billion and net income was $133.1 million, up from $59.4 million in 2003.
- The document provides historical financial and operating data from 2000-2004, including revenue, expenses, pipeline volumes, capital expenditures, and cash flow statements.
- It discusses
This document contains condensed consolidated financial statements and notes for Qwest Communications International Inc. for quarters ending March 31, 2005 through September 30, 2007. Some key details include:
- Operating revenue ranged from $3.4 to $3.5 billion per quarter while operating expenses ranged from $3.1 to $3.3 billion per quarter.
- Net income/loss fluctuated each quarter from a loss of $528 million in Q4 2005 to a gain of $2.065 billion in Q3 2007.
- Total assets ranged from $21.1 to $24.1 billion while total liabilities ranged from $24.1 to $26.7 billion.
The document provides an overview of Lender Processing Services (LPS) and its end-to-end mortgage solutions. LPS offers a comprehensive suite of technology solutions, data services, and processing services to support the origination, servicing, and default portions of the mortgage lifecycle. LPS has leading market positions and long-term relationships with the largest financial institutions in the country.
Fidelity National Information Services held an investor day on May 28, 2008 to discuss strategic initiatives and the planned spin-off of its Lender Processing Services segment. The presentation discussed the rationale for separating LPS, including that they have distinct businesses, limited ability to leverage each other, and competing investment needs. A timeline for the spin-off was also presented, with an estimated effective date of July 1.
1) Fidelity National Information Services presented an investor presentation in June 2008 that discussed their planned spin-off of the Lender Processing Services segment. The spin-off was intended to create two pure play companies that could better focus resources and have improved investment profiles.
2) FIS overview highlighted their leadership in payments processing and core banking software, with $2.9 billion in annual revenues and significant scale across the US and international markets.
3) Financial highlights showed strong revenue growth, expanding margins, and increasing free cash flow that could be used to invest in growth, reduce debt, pursue acquisitions and return capital to shareholders.
Lender Processing Services (LPS) provides technology, data, analytics and outsourced services to mortgage lenders. It has two business segments: Technology, Data & Analytics which includes mortgage processing services and software applications; and Loan Transaction Services which includes loan facilitation, default management and property services. LPS has a diversified revenue mix across these segments and services that provides stability across mortgage market cycles. It has long-standing relationships with the largest financial institutions and continues to gain market share through its comprehensive solutions and scale advantages.
FIS Bank of America Conference September 2008finance48
Fidelity National Information Services is a leading global provider of payment processing and core banking services. It generates $2.9 billion in annual revenue, with 86% coming from recurring sources. It has a large diverse customer base including community banks, mid-sized and large U.S. banks, and financial institutions in over 80 countries. The company has the most comprehensive product portfolio in the industry and strong positions across various market segments.
1) The document discusses Fidelity National Information Services, a leading global payment and core processing services provider. It presents information on FIS's business segments, revenue breakdown, competitive positioning, and technology platform.
2) Key metrics highlighted include $3.47 billion in total revenue, $839 million in adjusted EBITDA, serving over 13,000 financial institutions clients in more than 80 countries.
3) The presentation also reviews FIS's diverse and recurring revenue streams, strong operating leverage and customer service, and execution through organic revenue growth and improving EBITDA margins.
This presentation provides an overview of Fidelity National Information Services:
- It is a leading global provider of payment processing and core banking services, with $3.47 billion in annual revenue.
- Its services include payment processing, which accounts for 56% of revenue, as well as core banking and risk management services.
- It expects full year 2008 adjusted earnings per share to be between $1.51-$1.57, an increase over 2007, demonstrating strong execution and earnings growth.
The 2005 Annual Report summarizes the merger between Fidelity National Information Services and Certegy to form one of the largest financial institution technology processing companies. The new company, called FIS, has combined annual revenues of $4 billion and provides core banking, payments processing, and risk management services to over 60 countries. FIS is organized into two business segments: Transaction Processing Services and Lender Processing Services. The report discusses FIS' product offerings and leadership positions across various markets.
fidelity national information 1st Quarter 2006 10Qfinance48
- The document is a Form 10-Q quarterly report filed with the SEC by Fidelity National Information Services for the quarter ended March 31, 2006.
- It provides consolidated financial statements and management discussion/analysis of the company's financial condition and operating results for the quarter.
- Key details include total revenues of $901 million for the quarter, net earnings of $39 million, and total assets of $7.4 billion as of March 31, 2006.
fidelity national information 2nd Quarter 2006 10Qfinance48
This document is a Form 10-Q quarterly report filed with the SEC by Fidelity National Information Services for the quarter ended June 30, 2006. It includes consolidated financial statements and notes for the company and its subsidiaries. The financial statements show that for the quarter, Fidelity reported processing and services revenues of over $1 billion, gross profit of $302 million, net earnings of $66 million, and earnings per share of $0.34. Total assets exceeded $7.3 billion as of June 30, 2006, with the majority of the increase coming from acquisitions completed during the period.
Fidelity National Information Services (FIS) is a leading provider of financial services technology. In 2006, FIS achieved strong revenue growth of 8.8% through its core processing, card issuer, and transaction processing services. Notable events included the successful integration of Certegy to expand FIS's product offerings, and new large contracts signed with banks such as Chase and BB&T. Looking ahead, FIS aims to continue growing revenue through strengthening relationships with existing customers and expanding its global presence.
fidelity national information 2nd Quarter 2007 10Qfinance48
This document is Fidelity National Information Services' Form 10-Q quarterly report filed with the SEC for the quarter ending June 30, 2007. It includes the company's consolidated balance sheets, statements of earnings, comprehensive earnings, stockholders' equity and cash flows for the periods ended June 30, 2007 and 2006. Some highlights include total revenues of $1.18 billion for the quarter and $2.3 billion for the six months, net earnings of $148 million for the quarter and $207.5 million for the six months, and total assets of $7.8 billion and stockholders' equity of $3.4 billion as of June 30, 2007.
Fidelity National Information Services reported strong financial results for 2007, with revenue increasing 15.1% to a record $4.8 billion and adjusted earnings per share growing 16.2% to $2.44. The company's Transaction Processing Services and Lender Processing Services divisions both experienced double-digit revenue growth. International revenues increased over 40% driven by expansions in Europe, Asia, and Brazil. Successful implementations of new systems and platforms contributed to organic revenue growth of 11%, exceeding projections.
Stockholders and other interested parties may communicate with the Board or individual members by writing to the Company's Corporate Secretary at the company address or emailing them. The Corporate Secretary will review all communications and forward them or a summary to the appropriate Directors. Any issues related to accounting, controls, or auditing will be brought to the attention of the Audit Committee Chair.
This document outlines the by-laws of Liz Claiborne, Inc., a Delaware corporation. It establishes provisions for stockholder meetings, the board of directors, officers, capital stock, and general matters. Key details include establishing an annual stockholder meeting, requirements for a board quorum, powers of corporate officers, rules for stock certificates and transfers, and allowing board amendments to the by-laws.
The document outlines the by-laws of Liz Claiborne, Inc., a Delaware corporation. It discusses matters such as locations of stockholder meetings, requirements for notices of meetings, procedures for electing directors and officers, and rules regarding vacancies on the board of directors. It also allows directors to participate in board meetings by teleconference.
OJP data from firms like Vicinity Jobs have emerged as a complement to traditional sources of labour demand data, such as the Job Vacancy and Wages Survey (JVWS). Ibrahim Abuallail, PhD Candidate, University of Ottawa, presented research relating to bias in OJPs and a proposed approach to effectively adjust OJP data to complement existing official data (such as from the JVWS) and improve the measurement of labour demand.
Seminar: Gender Board Diversity through Ownership NetworksGRAPE
Seminar on gender diversity spillovers through ownership networks at FAME|GRAPE. Presenting novel research. Studies in economics and management using econometrics methods.
Abhay Bhutada Leads Poonawalla Fincorp To Record Low NPA And Unprecedented Gr...Vighnesh Shashtri
Under the leadership of Abhay Bhutada, Poonawalla Fincorp has achieved record-low Non-Performing Assets (NPA) and witnessed unprecedented growth. Bhutada's strategic vision and effective management have significantly enhanced the company's financial health, showcasing a robust performance in the financial sector. This achievement underscores the company's resilience and ability to thrive in a competitive market, setting a new benchmark for operational excellence in the industry.
1. Elemental Economics - Introduction to mining.pdfNeal Brewster
After this first you should: Understand the nature of mining; have an awareness of the industry’s boundaries, corporate structure and size; appreciation the complex motivations and objectives of the industries’ various participants; know how mineral reserves are defined and estimated, and how they evolve over time.
Vicinity Jobs’ data includes more than three million 2023 OJPs and thousands of skills. Most skills appear in less than 0.02% of job postings, so most postings rely on a small subset of commonly used terms, like teamwork.
Laura Adkins-Hackett, Economist, LMIC, and Sukriti Trehan, Data Scientist, LMIC, presented their research exploring trends in the skills listed in OJPs to develop a deeper understanding of in-demand skills. This research project uses pointwise mutual information and other methods to extract more information about common skills from the relationships between skills, occupations and regions.
^%$Zone1:+971)581248768’][* Legit & Safe #Abortion #Pills #For #Sale In #Duba...mayaclinic18
Whatsapp (+971581248768) Buy Abortion Pills In Dubai/ Qatar/Kuwait/Doha/Abu Dhabi/Alain/RAK City/Satwa/Al Ain/Abortion Pills For Sale In Qatar, Doha. Abu az Zuluf. Abu Thaylah. Ad Dawhah al Jadidah. Al Arish, Al Bida ash Sharqiyah, Al Ghanim, Al Ghuwariyah, Qatari, Abu Dhabi, Dubai.. WHATSAPP +971)581248768 Abortion Pills / Cytotec Tablets Available in Dubai, Sharjah, Abudhabi, Ajman, Alain, Fujeira, Ras Al Khaima, Umm Al Quwain., UAE, buy cytotec in Dubai– Where I can buy abortion pills in Dubai,+971582071918where I can buy abortion pills in Abudhabi +971)581248768 , where I can buy abortion pills in Sharjah,+97158207191 8where I can buy abortion pills in Ajman, +971)581248768 where I can buy abortion pills in Umm al Quwain +971)581248768 , where I can buy abortion pills in Fujairah +971)581248768 , where I can buy abortion pills in Ras al Khaimah +971)581248768 , where I can buy abortion pills in Alain+971)581248768 , where I can buy abortion pills in UAE +971)581248768 we are providing cytotec 200mg abortion pill in dubai, uae.Medication abortion offers an alternative to Surgical Abortion for women in the early weeks of pregnancy. Zone1:+971)581248768’][* Legit & Safe #Abortion #Pills #For #Sale In #Dubai Abu Dhabi Sharjah Deira Ajman Fujairah Ras Al Khaimah%^^%$Zone1:+971)581248768’][* Legit & Safe #Abortion #Pills #For #Sale In #Dubai Abu Dhabi Sharjah Deira Ajman Fujairah Ras Al Khaimah%^^%$Zone1:+971)581248768’][* Legit & Safe #Abortion #Pills #For #Sale In #Dubai Abu Dhabi Sharjah Deira Ajman Fujairah Ras Al Khaimah%^^%$Zone1:+971)581248768’][* Legit & Safe #Abortion #Pills #For #Sale In #Dubai Abu Dhabi Sharjah Deira Ajman Fujairah Ras Al Khaimah%^^%$Zone1:+971)581248768’][* Legit & Safe #Abortion #Pills #For #Sale In #Dubai Abu Dhabi Sharjah Deira Ajman Fujairah Ras Al Khaimah%^^%$Zone1:+971)581248768’][* Legit & Safe #Abortion #Pills #For #Sale In #Dubai Abu Dhabi Sharjah Deira Ajman Fujairah Ras Al Khaimah%^^%$Zone1:+971)581248768’][* Legit & Safe #Abortion #Pills #For #Sale In #Dubai Abu Dhabi Sharjah Deira Ajman Fujairah Ras Al Khaimah%^^%$Zone1:+971)581248768’][* Legit & Safe #Abortion #Pills #For #Sale In #Dubai Abu Dhabi Sharjah Deira Ajman Fujairah Ras Al Khaimah%^^%$Zone1:+971)581248768’][* Legit & Safe #Abortion #Pills #For #Sale In #Dubai Abu Dhabi Sharjah Deira Ajman Fujairah Ras Al Khaimah%^^%$Zone1:+971)581248768’][* Legit & Safe #Abortion #Pills #For #Sale In #Dubai Abu Dhabi Sharjah Deira Ajman Fujairah Ras Al Khaimah%^^%$Zone1:+971)581248768’][* Legit & Safe #Abortion #Pills #For #Sale In #Dubai Abu Dhabi Sharjah Deira Ajman Fujairah Ras Al Khaimah%^^%$Zone1:+971)581248768’][* Legit & Safe #Abortion #Pills #For #Sale In #Dubai Abu Dhabi Sharjah Deira Ajman Fujairah Ras Al Khaimah%^^%$Zone1:+971)581248768’][* Legit & Safe #Abortion #Pills #For #Sale In #Dubai Abu Dhabi Sharjah Deira Ajman Fujairah Ras Al Khaimah%^^%$Zone1:+971)581248768’][* Legit & Safe #Abortion #Pills #For #Sale In #Dubai Abu Dhabi Sharjah Deira Ajman
The Rise of Generative AI in Finance: Reshaping the Industry with Synthetic DataChampak Jhagmag
In this presentation, we will explore the rise of generative AI in finance and its potential to reshape the industry. We will discuss how generative AI can be used to develop new products, combat fraud, and revolutionize risk management. Finally, we will address some of the ethical considerations and challenges associated with this powerful technology.
BONKMILLON Unleashes Its Bonkers Potential on Solana.pdfcoingabbar
Introducing BONKMILLON - The Most Bonkers Meme Coin Yet
Let's be real for a second – the world of meme coins can feel like a bit of a circus at times. Every other day, there's a new token promising to take you "to the moon" or offering some groundbreaking utility that'll change the game forever. But how many of them actually deliver on that hype?
Abhay Bhutada, the Managing Director of Poonawalla Fincorp Limited, is an accomplished leader with over 15 years of experience in commercial and retail lending. A Qualified Chartered Accountant, he has been pivotal in leveraging technology to enhance financial services. Starting his career at Bank of India, he later founded TAB Capital Limited and co-founded Poonawalla Finance Private Limited, emphasizing digital lending. Under his leadership, Poonawalla Fincorp achieved a 'AAA' credit rating, integrating acquisitions and emphasizing corporate governance. Actively involved in industry forums and CSR initiatives, Abhay has been recognized with awards like "Young Entrepreneur of India 2017" and "40 under 40 Most Influential Leader for 2020-21." Personally, he values mindfulness, enjoys gardening, yoga, and sees every day as an opportunity for growth and improvement.
2. Almost 35,000 Team Members at Advance Auto Parts took servicing our customers to a new level
in 2003. As the second largest aftermarket retailer in the United States, with over 2,500 stores in
39 states, Puerto Rico and the Virgin Islands, we are building momentum.
It’s momentum that our customers experience each time they walk into our stores. We are truly
“ready in Advance.” SO BRING IT ON!
Region of Operations
5 Distribution Centers
Puerto Rico 33
Virgin Islands 2
3. Advance Auto Parts, Inc. and Subsidiaries
5-Year Financial 5-Year
Fiscal Year (1)
Compounded
Growth 2003 2002 2001 2000 1999
(in thousands, except per share data)
Statement of Operations Data:
Net sales...................................................... 14.7% $3,493,696 $3,204,140 $2,419,746 $2,167,308 $2,017,425
Gross profit (2)............................................ 19.3% 1,604,518 1,434,407 1,062,152 881,013 791,985
Comparable operating income (3) ............... 43.6% 298,651 231,883 119,127 88,462 70,232
Comparable income from continuing
operations (4) .......................................... 138.0% 160,529 94,267 35,652 15,188 5,002
Comparable income from continuing
operations per diluted share (4) .............. $ 2.15 $ 1.30 $ 0.61 $ 0.27 $ 0.09
Weighted average diluted shares
outstanding.............................................. 74,743 72,376 58,316 57,222 56,538
Selected Store Data:
Comparable store sales growth ................... 3.1% 5.5% 6.2% 4.4% 10.3%
Number of stores, end of period.................. 2,539 2,435 2,484 1,729 1,617
Total store square footage,
end of period (in thousands) ................... 18,875 18,108 18,717 13,325 12,476
Average net sales per store (5) .................... $ 1,379 $ 1,303 $ 1,346 $ 1,295 $ 1,267
Average net sales per square foot (6) .......... $ 186 $ 174 $ 175 $ 168 $ 164
Balance Sheet Data:
Inventory...................................................... $1,113,781 $1,048,803 $ 982,000 $ 788,914 $ 749,447
Net working capital...................................... 372,509 462,896 442,099 318,583 355,608
Total assets.................................................. 1,983,071 1,965,225 1,950,615 1,356,360 1,348,629
Total net debt (7) ......................................... 464,598 722,506 972,368 582,539 627,467
Total stockholders’ equity ............................ 631,244 468,356 288,571 156,271 133,954
(1) Our fiscal year consists of 52 or 53 weeks ending on the Saturday nearest to December 31. All fiscal years presented consist of 52 weeks, with the exception of 2003, which
consists of 53 weeks.
(2) Gross profit for fiscal 2001 excludes the non-recurring charge of $9,099 associated with our supply chain initiatives recorded in the fourth quarter.
(3) Comparable operating income excludes certain charges as included in the following reconciliation of this measurement to our operating income presented under generally accepted
accounting policies in our financial statements contained in the Financial Review section of this annual report.
2003 2002 2001 (a) 2000 1999
Comparable operating income .......................................................... $298,651 $231,883 $119,127 $88,462 $ 70,232
Supply chain initiatives..................................................................... — — (10,492) — —
Impairment of assets held for sale .................................................... — — (10,700) (856) —
Recapitalization expenses.................................................................. — — — — —
Merger related restructuring.............................................................. — (597) (3,719) — —
Merger and integration...................................................................... (10,417) (34,935) (1,135) — (41,034)
Stock option compensation............................................................... — — (8,611) (729) (1,082)
Operating income.............................................................................. $288,234 $196,351 $ 84,470 $86,877 $ 28,116
(a) The fiscal 2001 charges represent only those taken during the fourth quarter. For more information see the fiscal 2001 financial statements and accompanying footnotes.
(4) Comparable income from continuing operations excludes the items in footnote (3) above and the early extinguishment of debt and cumulative effect of a change in accounting principle.
The following is a reconciliation of comparable income from continuing operations to income from continuing operations presented under generally accepted accounting policies in our
financial statements contained in the Financial Review section of this annual report.
2003 2002 2001 (a) 2000 1999
Comparable income from continuing operations .............................. $160,529 $ 94,267 $ 35,652 $15,188 $ 5,002
Add back items from footnote (3) (a) ................................................ (10,417) (35,532) (34,657) (1,585) (42,116)
Loss on extinguishment of debt ........................................................ (46,887) (16,822) (6,106) 4,692 —
Tax impact of above items................................................................. 22,062 20,235 16,182 (1,144) 16,636
Income (loss) from continuing operations ........................................ $125,287 $ 62,148 $ 11,071 $17,151 $(20,478)
Income (loss) from continuing operations per diluted share............. $ 1.68 $ 0.86 $ 0.19 $ 0.30 $ (0.36)
(a) The fiscal 2001 charges represent only those taken during the fourth quarter. For more information see the fiscal 2001 financial statements and accompanying footnotes.
(5) Average net sales per store is calculated as net sales divided by the average of beginning and ending number of stores for the respective period. The fiscal 2003 net sales exclude the
effect of the 53rd week in the amount of $63.0 million. The fiscal 2001 amounts were calculated by reducing the number of Discount stores by one-thirteenth to reflect our ownership of
Discount from December 2, 2001 (the acquisition date) through December 29, 2001.
(6) Average net sales per square foot is calculated as net sales divided by the average of the beginning and ending total store square footage for the respective period. The fiscal 2003 net
sales exclude the effect of the 53rd week in the amount of $63.0 million. The fiscal 2001 amounts were calculated by reducing the number of Discount stores by one-thirteenth to reflect
our ownership of Discount from December 2, 2001 (the acquisition date) through December 29, 2001.
(7) Net debt includes total debt and bank overdrafts, less cash and cash equivalents as presented on the accompanying financial statements.
Page 1
4. Letter to Our Stockholders
We are pleased to report 2003 was another record year for Advance Although our team has achieved much, we are hardly satisfied.
Auto Parts. We have tremendous opportunities to serve our customers more
efficiently, enhance our profitability and further increase our return
Our Company built momentum in a number of ways this year. We
on invested capital.
raised the sales productivity of our stores, increased our operating
margins, generated strong free cash flow, and increased our return on In 2004, we will continue to build momentum by remaining focused on
invested capital. the same objectives that generated our past success and by having the
best parts, people, and prices:
Once again, our hard working team took our operating initiatives and
executed at an even higher level than they did in 2002. These initiatives Parts—We are committed to having the right parts available for our
include category management, an expanded store brands program, customers. In 2004, we will launch the next wave of our custom mix
improved supply chain efficiencies, and heightened emphasis on program, further refine our category management initiatives, and com-
commercial sales. We also focused on refining our customer-driven plete the rollout of our new store system.
technology systems, including our point-of-sale and electronic catalog
People—Our team’s dedication to customer service is the primary
system (APAL) and our Management Planning and Training system
reason our customers keep coming back to us. In 2004, we will con-
(MPT). Together, these initiatives have increased the number of cus-
tinue to emphasize training to equip our Team Members with the
tomers who visit our stores and raised the average transaction size.
knowledge and skills to enhance our customers’ shopping experience.
In 2003: We also plan to open 125–135 new locations, which will bring our team
• We served over 200 million customers. exciting advancement opportunities.
• We opened 125 new stores for a total of 2,539 stores. Prices—In 2004, we will continue to bring savings to our customers
by offering great value on quality parts and products.
• We increased our gross margin by 116 basis points to 45.9%.
As stockholders, we hope that you agree that we are serving our
• Our GAAP operating margin increased to 8.3% and we raised our
customers better than ever and invite you to visit one of our over
comparable operating margin to 8.5% from 7.2% last year.
2,500 conveniently located stores. Then you will see that “We’re ready
• Our GAAP earnings per share rose to $1.67 from $0.90 last year and in Advance.”
we grew comparable earnings per share from continuing operations
Advance Auto Parts was built on integrity and an unwavering commit-
65% to $2.15 from $1.30 last year.
ment to our customers. As guardians of this legacy, we commit to you
(The Company uses non-GAAP measures as an indication of its earnings from its that these values will remain at the core of everything we do.
core operations and believes it is important to the Company’s stockholders due to
As we begin another year, we would like to thank our stockholders for
the nature and significance of the excluded expenses. Please see our reconciliation
their confidence, our Team Members for their dedication to serving our
of comparable operating income and comparable earnings per share included on
customers, and our families for their support.
page 1 of this annual report.)
During 2003, we also further strengthened our balance sheet. At the end
of our first quarter, we retired our high yield bonds and debentures, low-
Jim Wade
ering the weighted average interest rate of our debt from 8.7% to 3.2%. President
We paid down $291 million in debt, ending the year with a total debt to
capitalization rate of 41% compared to 61% in 2002, and 77% in 2001.
Larry Castellani
Chairman and Chief Executive Officer
5. Carta para nuestros Accionistas
Nos complace informarles que el año 2003 fue otro año récord para Si bien nuestro equipo ha alcanzado grandes logros, todavía no estamos
Advance Auto Parts. totalmente satisfechos. Tenemos muchísimas oportunidades para brindar
una atención más eficiente a nuestros clientes, mejorar nuestra rentabili-
Este año, nuestra Compañía logró un fuerte impulso de diferentes
dad y aumentar aún más nuestro retorno sobre el capital invertido.
maneras. Incrementamos la productividad de ventas de nuestras
tiendas, elevamos nuestros márgenes operativos, generamos un sólido En 2004, continuaremos con nuestro impulso y nos seguiremos concen-
flujo de efectivo de libre disponibilidad y aumentamos nuestras trando en los mismos objetivos que generaron nuestro éxito en el pasado,
ganancias sobre el capital invertido. con las mejores piezas, los mejores empleados y los mejores precios:
Una vez más, nuestro dedicado equipo tomó nuestras iniciativas ope- Piezas—Nos comprometemos a tener las piezas correctas disponibles
rativas y las llevó a cabo a un nivel incluso superior al que había para nuestros clientes. En el 2004, lanzaremos la nueva edición de
alcanzado en 2002. Estas iniciativas incluyen gestión por categorías, nuestro programa de variedad de productos adaptada a los clientes,
un programa ampliado de marcas propias, una cadena de suministros perfeccionaremos nuestras iniciativas de gestión por categorías y
más eficiente y más énfasis en las ventas comerciales. También nos completaremos la implementación de nuestro nuevo sistema de tiendas.
concentramos en perfeccionar nuestros sistemas de tecnología orien-
Empleados—La dedicación de nuestro equipo es el de brindar un
tados a los clientes, incluyendo nuestro sistema de catálogo de piezas
mejor servicio a nuestros clientes. Ese es el principal motivo por el
en el punto de venta y electrónico (APAL), y nuestro sistema de
cual los clientes vuelven a nuestras tiendas. En 2004, seguiremos
Planificación y Capacitación de Gestión (Management Planning and
haciendo hincapié en la capacitación para brindar a nuestros Miembros
Training, MPT). En conjunto, estas iniciativas han aumentado la canti-
del Equipo los conocimientos y las habilidades que necesitan para
dad de clientes que visitan nuestras tiendas y han incrementado el
mejorar atención de servicio al cliente. También planeamos abrir entre
tamaño promedio de nuestras transacciones.
125 y 135 tiendas nuevas, lo cual dará a nuestro equipo interesantes
oportunidades de trabajo y progreso.
tremendous opportunities
We have to serve our customers more
efficiently, enhance our profitability, and increase our return on invested capital.
En 2003: Precios—En 2004, nuestros clientes podrán seguir ahorrando, ya que
• Atendimos a más de 200 millones de clientes. ofreceremos piezas y productos de calidad a un valor excepcional.
• Abrimos 125 tiendas nuevas y llegamos a un total de 2,539 tiendas. Como accionistas, esperamos que coincidan con nosotros en que esta-
mos atendiendo a nuestros clientes mejor que nunca, y los invitamos a
• Aumentamos nuestro margen bruto en 116 puntos básicos a un 45.9%.
visitar una de nuestras más de 2,500 tiendas de fácil acceso. De esa
• Nuestro margen operativo de acuerdo con los principios contables manera, podrán ver que “Siempre listos en Advance.”
GAAP subió a 8.3%, y aumentamos nuestro margen operativo com-
Advance Auto Parts fue fundada sobre la base de la integridad y un
parable a 8.5% contra el 7.2% registrado el año pasado.
férreo compromiso hacia nuestros clientes. Para preservar este legado,
• Nuestras ganancias por acción de acuerdo con los principios conta- nos comprometemos con ustedes a mantener estos valores en el cen-
bles GAAP subieron a $1.67 en comparación con los $0.90 del año tro de todo lo que hacemos.
anterior, e hicimos crecer nuestras ganancias por acción compara-
Al comenzar este nuevo año, nos gustaría agradecer a nuestros
bles provenientes de operaciones continuas un 65%, de $1.30 regi-
accionistas por su confianza, a nuestros Miembros del Equipo por su
strado el año pasado a $2.15.
dedicación para brindar un mejor servicio a nuestros clientes, y a
(La Compañia utiliza medidas no GAAP como un indicador de sus ganancias nuestras familias por su apoyo.
provenientes de sus operaciones principales, y considera que esto es importante
para los accionistas de la Compañia debido a la naturaleza e importancia de los
gastos excluidos. Consulte nuestra conciliación de los ingresos operativos com-
parables y las ganancias por acción comparables incluida en la página 1 de este
Jim Wade
informe anual.)
Presidente
Durante 2003, también logramos fortalecer aún más nuestro balance
general. Al final del primer trimestre, retiramos nuestros bonos y pagarés
(debentures) de alto rendimiento, con lo cual redujimos el cargado
promedio de la tasa de interés de nuestra deuda de 8.7% a 3.2%.
Larry Castellani
Pagamos $291 millones de la deuda, lo cual nos permitió finalizar el año
Presidente de la Junta Directiva y Director Ejecutivo
con una relación deuda-capitalización total del 41%, en comparación con
el 61% en 2002, y el 77% en 2001.
Page 2 Photo: Executive Committee, pictured from left to right:
1. Robert E. Hedrick, Senior Vice President, Human Resources 2. Paul W. Klasing, Executive Vice President, Stores
3. Lawrence P. Castellani, Chairman and Chief Executive Officer 4. Michael N. Coppola, Executive Vice President and Chief Operating Officer
5. Jimmie L. Wade, President 6. Jeffrey T. Gray, Senior Vice President and Chief Financial Officer
Page 3
6. right people doing the
Advance has the
right thing at the right time—satisfying our customers.
7. Advance Auto Parts, Inc. and Subsidiaries
2,500 Stores Strong and Building Momentum
Building Opportunity Creating Stores that Look Great—
for Our Team and Function Efficiently
On October 2, 2003, we opened our 2,500th store in Parma, Ohio, in the Our 2,500th store is also an example of the groundbreaking new 2010 store
Cleveland market. This was a significant milestone for our Company for a format that we are rolling out across our chain. We call it 2010 because it is
number of reasons. It is a confirmation that people in thousands of towns the store that is taking Advance Auto Parts into the future.
and cities around the country value the services that we provide—that our
In our previous format, a long parts counter divides the selling floor from the
parts, people, and prices fulfill a real need. It is a reflection of our growing
parts shelves. In our 2010 stores, we’ve replaced this barrier with a series of
leadership in our industry and the success of our operating initiatives. And it
workstations, opening up movement between the parts area and the selling
is an indication of the opportunities we can offer our Team Members, our
floor. Our 2010 stores also feature high-impact signage highlighting quality
most valuable asset.
parts and products at a value price and a
It is vital to our success to have a stable, more logical merchandise layout.
productive team. We encourage our
In 2003, we began converting stores on a
Team Members to view their work at
market by market basis including the
Advance Auto Parts, not as a job, but as
Charlotte, North Carolina and Richmond,
a career in a flourishing company. The
Virginia markets. At year’s end, 714 stores
more we grow, the more opportunities
boasted this new format, and we expect to
there are for advancement and for
have over one thousand 2010 stores by the
enhanced job satisfaction.
end of 2004.
But it is not enough simply to provide
Our Management Planning and Training
opportunity. One of our most important
(MPT) system is also a key part of our
initiatives is to provide Team Members
success. Using store-specific data analyzed
with the right training to enhance their
at 15-minute intervals, MPT helps man-
professional and personal development.
agers appropriately staff their stores to
In 2003, we implemented a new per-
ensure that customers receive friendly,
formance appraisal system to assess
knowledgeable help during peak hours.
the development needs of each Team
During low traffic periods, it helps managers prioritize tasks to ensure that
Member and to tailor classroom and online training programs specific to his
their store is properly cleaned, maintained, and stocked. MPT has been instru-
or her needs. By focusing on developing each individual, we are increasing
mental in driving our sales and leveraging our labor expense-to-sales ratio.
our retention rates and enhancing our customer service levels.
The MPT system not only increases team productivity, but it also encourages
These efforts have been greeted enthusiastically. Our Team Members are
the growth of motivated, independent managers to become strong Company
excited about building their skills. In fact, the number of Team Members who
leaders. With MPT, we can be assured that Advance Auto Parts has the right
received their Automotive Service Excellence (ASE) certification nearly dou-
people doing the right thing at the right time—satisfying our customers.
bled from last year and now, we employ the largest number of certified
parts specialists in the automotive aftermarket retail industry. At Advance
Auto Parts, we know that investing in our team’s future is the key to continu-
ing to provide legendary customer service.
Page 4 Photo: Pictured from left to right:
1. Sandy Mabry, customer 2. John Hunter, Division Commercial Sales Manager, Division #1404
Page 5 Photo: Pictured from left to right:
1. Laurie Crawford, customer 2. Keith Wade, Assistant Manager, Store #6256
Page 5
8. Building Momentum through Enhanced Merchandising and Technology
Managing Our Categories Gaining Traction at the Point of Sale
Meeting our customers’ demand for the best selection of value-priced Our leading edge APAL system quite literally places all the information our
automotive parts and products is at the heart of our category management Team Members need to deliver excellent customer service right at their fin-
initiative, which we launched in 2002. Partnering with our vendors, we gertips. APAL, which stands for Advance Parts and Accessories Look-Up,
analyzed consumer data to identify the demand levels for each of our parts is a state-of-the-art electronic catalog and point-of-sale system that
and products. We then adjusted our merchandise mix to better meet cus- includes technical information, features and benefits, and product graphics
tomer demands and developed more targeted merchandising. for the parts that we carry.
Our category management program has already yielded important benefits In addition, APAL suggests “good, better, best” product alternatives so cus-
for the Company in the form of higher sales, reduced returns and warranty tomers can weigh the tradeoffs between quality and cost and select the
expenses, enhanced margins, and more product that most meets their needs. And, to
productive inventory utilization. In ensure that customers have everything they
2003, our gross margin improved 116 need to complete a repair project, Team
basis points to 45.9%, mostly due to Members can generate a list of related items.
category management. In 2004, cate-
At year-end 2003, we had introduced APAL
gory management will drive our sales
in 2,166 stores, or 87% of our chain.
and gross margins as we continually
Already, it has produced higher average
find opportunities to meet our cus-
sales and lower returns, while increasing
tomers’ needs.
customer confidence in our Team Members
and driving repeat business. We expect to
Offering Customers
complete the APAL rollout during the sec-
a Choice
ond quarter of 2004.
At Advance Auto Parts, our goal is to
Marketing to
offer a wide selection of high-quality,
Professional Installers
high-value products. One way we do
this is through our Private Label brand,
Although serving the do-it-yourself cus-
which provides quality that is compara-
tomer is our primary business, we continue
ble to the leading national brand at a value price. Our name on each prod-
to grow our sales to professional installers. In fact, the qualities that make
uct represents the ideals Advance was built on—Quality, Value, and Trust.
our do-it-yourself approach so compelling—our knowledgeable sales
Our store brands are a source of great pride for our Team Members, both staff, our broad selection of quality parts, and our sophisticated supply
for their exceptional quality and for their ability to meet our customers’ chain that guarantees fast deliveries—make serving the professional
needs. We are committed to store brand development because that is what installer a natural extension of our business.
our customers want, and the positive feedback we have received tells us
Our commercial sales in comparable stores rose 7.2% in 2003. Currently,
our hard work is paying off.
64% of our stores have a commercial delivery program and as we move
In 2003, we rolled out our Private Label antifreeze, chemicals, freon, oil fil- into 2004, we see tremendous opportunities to increase our penetration of
ters, and wash and wax programs. In 2004, we will roll out expanded the commercial segment, especially in the Advance Discount Auto Parts
chemical, transmission fluid, and wash and wax programs. stores in the Florida market.
Page 6 Photo: Pictured from left to right:
1. Herman Word, Jr., Manager, Store #2610 2. Barry Stacy, customer
Page 7 Photo: Pictured from left to right:
1. Jeff Hobson, Director of Store Brands 2. Ricardo Cuesta, Assistant Manager in Training, Store #2610
Page 6
9. Our name on our Private Label products represents the ideals
Value, and Trust.
Advance was built on—Quality,
10. serve our customers, always
We build our systems to
soliciting input from the frontline—our stores.
11. Advance Auto Parts, Inc. and Subsidiaries
Financial Review
FINANCIAL CONTENTS
10 Selected Financial Data
12 Management’s Discussion and Analysis of Financial Condition
and Results of Operations
23 Consolidated Balance Sheets
24 Consolidated Statements of Operations
25 Consolidated Statements of Changes in Stockholders’ Equity
26 Consolidated Statements of Cash Flows
28 Notes to Consolidated Financial Statements
46 Independent Auditors’ Report
47 Management’s Responsibility for Financial Statements
47 Audit Committee’s Statement
48 Market for Registrant’s Common Equity and Related
Stockholder Matters
Page 8 Photo: Pictured from left to right:
1. Karen Taylor, Team Leader, Store Systems Development 2. W. Randall Ferguson, Manager, Store #2010 3. Craig Anderton, Director of Strategic Store Systems
4. Margrit Musselman, Senior Programmer/Analyst, Store Systems Development 5. Jennie Hodges, Manager, Store #2280
Page 9
12. SELECTED FINANCIAL DATA
The following table sets forth our selected historical consolidated statement of operations, balance sheet and other operating
data. The selected historical consolidated financial and other data at January 3, 2004 and December 28, 2002 and for the
three years ended January 3, 2004 have been derived from our audited consolidated financial statements and the related notes
included elsewhere in this report. The historical consolidated financial and other data at December 29, 2001, December 30,
2000 and January 1, 2000 and for the years ended December 30, 2000 and January 1, 2000 have been derived from our
audited consolidated financial statements and the related notes that have not been included in this report. You should read
this data along with “Management’s Discussion and Analysis of Financial Condition and Results of Operations,” and the
consolidated financial statements and the related notes of Advance included elsewhere in this report.
Fiscal Year (1)(2)
2003 2002 2001 2000 1999
(in thousands, except per share data)
Statement of Operations Data:
$3,493,696
Net sales ............................................................................................................... $3,204,140 $2,419,746 $2,167,308 $2,017,425
1,889,178
Cost of sales .......................................................................................................... 1,769,733 1,357,594 1,286,295 1,225,440
—
Supply chain initiatives(3) ........................................................................................ — 9,099 — —
1,604,518
Gross profit ........................................................................................................... 1,434,407 1,053,053 881,013 791,985
1,305,867
Selling, general and administrative expenses(4) .......................................................... 1,202,524 938,300 792,551 721,753
—
Expenses associated with supply chain initiatives(5) ................................................... — 1,394 — —
—
Impairment of assets held for sale(6) ......................................................................... — 12,300 856 —
—
Expenses associated with the merger related restructuring (7) ...................................... 597 3,719 — —
10,417
Expenses associated with merger and integration(8) ................................................... 34,935 1,135 — 41,034
—
Non-cash stock option compensation expense(9) ........................................................ — 11,735 729 1,082
288,234
Operating income................................................................................................... 196,351 84,470 86,877 28,116
(37,576)
Interest expense ..................................................................................................... (77,081) (61,042) (64,212) (62,792)
(47,288)
(Loss) gain on extinguishment of debt ..................................................................... (16,822) (6,106) 4,692 —
—
Expenses associated with secondary offering............................................................ (1,733) — — —
341
Other income, net .................................................................................................. 963 1,033 581 4,649
Income (loss) from continuing operations before income taxes, loss (income) on
203,711
discontinued operations and cumulative effect of a change in accounting principle ..... 101,678 18,355 27,938 (30,027)
78,424
Income tax expense (benefit)................................................................................... 39,530 7,284 10,787 (9,549)
Income (loss) from continuing operations before (loss) income on discontinued
125,287
operations and cumulative effect of a change in accounting principle...................... 62,148 11,071 17,151 (20,478)
Discontinued operations:
(Loss) income from operations of discontinued Wholesale Distribution Network
(572)
(including loss on disposal of $2,693)............................................................... 4,691 4,040 3,915 (7,883)
(220)
(Benefit) provision for income taxes ...................................................................... 1,820 1,604 1,507 (3,035)
(352)
(Loss) income on discontinued operations................................................................ 2,871 2,436 2,408 (4,848)
—
Cumulative effect of a change in accounting principle, net of $1,360 income taxes ...... — (2,065) — —
$ 124,935
Net income (loss)................................................................................................... $ 65,019 $ 11,442 $ 19,559 $ (25,326)
Income (loss) from continuing operations before (loss) income on
discontinued operations and cumulative effect of a change in
$ 1.72
accounting principle per basic share..................................................................... $ 0.89 $ 0.19 $ 0.30 $ (0.36)
Income (loss) from continuing operations before (loss) income on
discontinued operations and cumulative effect of a change in
$ 1.68
accounting principle per diluted share .................................................................. $ 0.86 $ 0.19 $ 0.30 $ (0.36)
$ 1.71
Net income (loss) per basic share ............................................................................ $ 0.93 $ 0.20 $ 0.35 $ (0.45)
$ 1.67
Net income (loss) per diluted share.......................................................................... $ 0.90 $ 0.20 $ 0.34 $ (0.45)
72,999
Weighted-average basic shares outstanding (10) ........................................................... 70,098 57,274 56,592 56,538
74,743
Weighted-average diluted shares outstanding (10) ........................................................ 72,376 58,316 57,222 56,538
Cash Flows Provided By (Used In):
$ 355,921 $ 242,996 $ 103,536 $ 103,951 $ (20,976)
Operating activities ................................................................................................
(85,474)
Investing activities ................................................................................................. (78,005) (451,008) (64,940) (113,824)
(272,845)
Financing activities ................................................................................................ (169,223) 347,580 (43,579) 121,262
(continued)
Page 10
13. Advance Auto Parts, Inc. and Subsidiaries
Fiscal Year (1)(2)
2003 2002 2001 2000 1999
(in thousands, except store data and ratios)
Balance Sheet and Other Financial Data:
$ 11,487
Cash and cash equivalents.............................................................................. $ 13,885 $ 18,117 $ 18,009 $ 22,577
$1,113,781
Inventory ...................................................................................................... $1,048,803 $ 982,000 $ 788,914 $ 749,447
1.72
Inventory turnover (11) ..................................................................................... 1.75 1.72 1.69 1.69
$ 438,669
Inventory per store(12) ..................................................................................... $ 429,399 $ 392,635 $ 451,281 $ 456,624
51.0%
Accounts payable to inventory ratio(13) ............................................................ 44.9% 43.7% 49.2% 45.5%
$ 372,509
Net working capital (14) ................................................................................... $ 462,896 $ 442,099 $ 318,583 $ 355,608
$ 101,177
Capital expenditures (15) .................................................................................. $ 98,186 $ 63,695 $ 70,566 $ 105,017
$1,983,071
Total assets ................................................................................................... $1,965,225 $1,950,615 $1,356,360 $1,348,629
$ 445,000
Total debt ..................................................................................................... $735,522 $ 955,737 $ 586,949 $ 638,329
$ 464,598
Total net debt (16) ............................................................................................ $ 722,506 $ 972,368 $ 582,539 $ 627,467
$ 631,244
Total stockholders’ equity .............................................................................. $ 468,356 $ 288,571 $ 156,271 $ 133,954
Selected Store Data:
3.1%
Comparable store sales growth(17).................................................................... 5.5% 6.2% 4.4% 10.3%
2,435
Number of stores at beginning of year ............................................................ 2,484 1,729 1,617 1,567
125
New stores ................................................................................................ 110 781 140 102
(21)
Closed stores(18) ......................................................................................... (159) (26) (28) (52)
2,539
Number of stores, end of period ..................................................................... 2,435 2,484 1,729 1,617
32
Relocated stores ............................................................................................ 39 18 10 13
1,625
Stores with commercial delivery program, end of period .................................. 1,411 1,370 1,210 1,094
15.8%
Total commercial sales, as a percentage of total sales ....................................... 15.0% 16.8% 16.5% 12.1%
18,875
Total store square footage, end of period ......................................................... 18,108 18,717 13,325 12,476
$ 1,379 $
Average net sales per store (19) ......................................................................... 1,303 $ 1,346 $ 1,295 $ 1,267
$ 186 $
Average net sales per square foot (20) ................................................................ 174 $ 175 $ 168 $ 164
(1) Our fiscal year consists of 52 or 53 weeks ending on the Saturday nearest to December 31. All fiscal years presented are 52 weeks, with the exception of 2003, which
consists of 53 weeks.
(2) The statement of operations data for each of the years presented reflects the operating results of the wholesale segment as discontinued operations.
(3) Represents restocking and handling fees associated with the return of inventory as a result of our supply chain initiatives.
(4) Selling, general and administrative expenses exclude certain charges disclosed separately and discussed in notes (5), (6), (7), (8) and (9) below.
(5) Represents costs of relocating certain equipment held at facilities closed as a result of our supply chain initiatives.
(6) Represents the devaluation of certain property held for sale, including the $1.6 million charge taken in the first quarter of 2001 and a $10.7 million charge taken in the
fourth quarter of 2001.
(7) Represents expenses related primarily to lease costs associated with 31 of our stores closed in overlapping markets in connection with the Western merger and 27 Advance
Auto Parts stores identified to be closed at December 29, 2001 as a result of the Discount acquisition.
(8) Represents certain expenses related to the Western merger and the Discount acquisition.
(9) Represents non-cash compensation expense related to stock options granted to certain of our team members, including a charge of $8.6 million in the fourth quarter of
2001 related to variable provisions of our stock option plans that were in place when we were a private company and eliminated in 2001.
(10) Shares outstanding for each of the years presented gives effect to a 2-for-1 stock split effectuated by us in the form of a 100% stock dividend distributed on January 2, 2004.
(11) Inventory turnover is calculated as cost of sales divided by the average of beginning and ending inventories. The fiscal 2003 cost of sales excludes the effect of the 53rd
week in the amount of $34.3 million. The fiscal 2001 amounts were calculated by reducing the Discount inventory balances by one-thirteenth to reflect our ownership of
that inventory from December 2, 2001 (the acquisition date) through December 29, 2001.
(12) Inventory per store calculated as ending inventory divided by ending store count. Ending inventory used in this calculation excludes certain inventory related to the
wholesale segment with the exception of fiscal 2003.
(13) Accounts payable to inventory ratio is calculated as ending accounts payable divided by ending inventory.
(14) Net working capital is calculated by subtracting current liabilities from current assets.
(15) Capital expenditures for 2001 exclude $34.1 million for our November 2001 purchase of Discount’s Gallman, Mississippi distribution facility from the lessor in
connection with the Discount acquisition.
(16) Net debt includes total debt and bank overdrafts, less cash and cash equivalents.
(17) Comparable store sales is calculated based on the change in net sales starting once a store has been open for 13 complete accounting periods (each period represents four
weeks). Relocations are included in comparable store sales from the original date of opening. Stores acquired in the Discount acquisition are included in the comparable
sales calculation beginning in December 2002, which was 13 complete accounting periods after the acquisition date of November 28, 2001. We do not include net sales
from the 36 Western Auto retail stores in our comparable store calculation as a result of their unique product offerings, including specialty merchandise and service. In
2003, the comparable store sales calculation included sales from our 53rd week compared to our first week of operation in 2003 (the comparable calendar week).
(18) Closed stores in 2002 include 133 Discount and Advance stores closed as part of the integration of Discount.
(19) Average net sales per store is calculated as net sales divided by the average of beginning and ending number of stores for the respective period. The fiscal 2003 net sales
exclude the effect of the 53rd week in the amount of $63.0 million. The fiscal 2001 amounts were calculated by reducing the number of Discount stores by one-thirteenth
to reflect our ownership of Discount from December 2, 2001 (the acquisition date) through December 29, 2001.
(20) Average net sales per square foot is calculated as net sales divided by the average of the beginning and ending total store square footage for the respective period. The
fiscal 2003 net sales exclude the effect of the 53rd week in the amount of $63.0 million. The fiscal 2001 amounts were calculated by reducing the number of Discount
stores by one-thirteenth to reflect our ownership of Discount from December 2, 2001 (the acquisition date) through December 29, 2001.
Page 11
14. MANAGEMENT’S DISCUSSION AND ANALYSIS OF FINANCIAL CONDITION AND RESULTS OF OPERATIONS
Introduction
The following discussion and analysis of financial condi-
tion and results of operations should be read in conjunction In 2003, we produced strong operating results and built
with “Selected Financial Data,” our consolidated historical momentum to carry us into what we believe will be another
financial statements and the notes to those statements that successful year in 2004. Our 2003 performance and our posi-
appear elsewhere in this report. Our discussion contains tive outlook for 2004, is primarily a result of our management
forward-looking statements based upon current expecta- team’s focus to drive top-line sales growth and increase our
tions that involve risks and uncertainties, such as our plans, operating margins through our category management initia-
objectives, expectations and intentions. Actual results and tives, our national advertising campaign and leveraging our
the timing of events could differ materially from those antic- logistics and operating expenses. The category management
ipated in these forward-looking statements as a result of a initiative not only drives top-line sales by developing
number of factors, including those set forth under “Forward- improved product assortments by category but also focusing on
Looking Statements” elsewhere in this report and “Risk maximizing gross profit within each product category offered.
Factors” found in our Form 10-K filed on March 12, 2004 For 2003, we grew our total sales by 9.0% over last year to
with the Securities and Exchange Commission. $3.5 billion, including the 53rd week. We also improved our
Our fiscal year ends on the Saturday nearest December 31 operating margins to 8.3% of total sales, including the 53rd
of each year. Our first quarter consists of 16 weeks, and the week, an increase of 46.8% over 2002. In addition to the
other three quarters consist of 12 weeks, with the exception above initiatives, our operating margins benefited from
of the fourth quarter fiscal 2003 which contained 13 weeks leveraging our selling, general and administrative expenses.
due to our 53-week fiscal year in 2003.
Additionally, we evaluate the quality of our results based on growth in certain key financial metrics. These key indicators
consist primarily of:
For Year For Year For Year
Ended 2003(1)
Key Financial Statistics Ended 2002 Ended 2001
3.1%
Comparable store sales growth............................................................................................................ 5.5% 6.2%
2.4%
DIY comparable stores sales growth................................................................................................... 5.6% 5.4%
7.2%
DIFM comparable stores sales growth ................................................................................................ 5.0% 10.0%
$ 1,379
Average net sales per store (in thousands) .......................................................................................... $ 1,303 $ 1,346
$438,669
Inventory per store (in thousands) ....................................................................................................... $429,399 $392,635
1.72
Inventory turnover................................................................................................................................ 1.75 1.72
45.9%
Gross margins ...................................................................................................................................... 44.8% 43.5%
8.3%
Operating margins ............................................................................................................................... 6.1% 3.5%
Note: These metrics should be reviewed along with the Selected Financial Data elsewhere in this Annual Report, which includes descriptions regarding the calculation of these measures.
(1) All financial metrics include the 53rd week, except the average net sales per store metric.
Overview accessories to DIY customers. From the 1980s to the present,
we have grown significantly as a result of strong compara-
We primarily operate within the United States automotive
ble store sales growth, new store openings and strategic
aftermarket industry, which includes replacement parts
acquisitions, including our 1998 Western Auto Supply
(excluding tires), accessories, maintenance items, batteries
Company acquisition and our 2001 acquisition of Discount
and automotive chemicals for cars and light trucks (pickup
Auto Parts, or Discount. Additionally, in 1996, we began to
trucks, vans, minivans and sport utility vehicles). We currently
aggressively expand our sales to “do-it-for-me,” or DIFM,
are the second largest specialty retailer of automotive parts,
customers by implementing a commercial delivery program.
accessories and maintenance items to “do-it-yourself,” or
At January 3, 2004, we operated 2,539 stores within the
DIY, customers in the United States, based on store count
United States, Puerto Rico and the Virgin Islands. We operated
and sales. Our combined operations are now conducted in our
2,503 stores throughout 39 states in the Northeastern, South-
retail operating segment subsequent to the discontinuation of
eastern and Midwestern regions of the United States. These
the wholesale distribution network in 2003.
stores operated primarily under the “Advance Auto Parts” trade
We were formed in 1929 and operated as a retailer of
name except for the state of Florida, which operated under
general merchandise until the 1980s. During the 1980s, we
“Advance Discount Auto Parts” or “Discount Auto Parts” trade
sharpened our focus to target sales of automotive parts and
Page 12
15. Advance Auto Parts, Inc. and Subsidiaries
names. Our stores offer a broad selection of brand name and wholesale distribution network, or Wholesale, consisted of
proprietary automotive replacement parts, accessories and independently owned and operated dealer locations, for
maintenance items for domestic and imported cars and light which we supplied merchandise inventory and certain serv-
trucks, with no significant concentration in any specific area. In ices. Due to the wide variety of products supplied to the
addition, we operated 36 stores under the “Western Auto” trade dealers and the reduced concentration of stores spread over
name, located primarily in Puerto Rico and the Virgin Islands, a wide geographic area, it had become difficult to serve
which offer certain home and garden merchandise in addition these dealers effectively. This component of our business
to automotive parts, accessories and service. operated in the wholesale segment and excluding certain
allocated and team member benefit expenses of $2.4 mil-
Fiscal
lion, $3.3 million and $5.5 million for fiscal years 2003,
2003 2002 2001
2002 and 2001, represented the entire results of operations
2,435
Number of stores at beginning of year....... 2,484 1,729 previously reported in that segment. We have classified
125
New stores .............................................. 110 781
these operating results as discontinued operations in the
(21)
Closed stores........................................... (159) (26)
accompanying consolidated statements of operations for the
2,539
Number of stores, end of period................. 2,435 2,484
fiscal year ended January 3, 2004, December 28, 2002 and
32
Relocated stores.......................................... 39 18
December 29, 2001 to reflect this decision.
In addition to our DIY business, we serve DIFM customers
Critical Accounting Policies
via sales to commercial accounts. Sales to DIFM cus-
Our financial statements have been prepared in accord-
tomers represented approximately 16% of our retail sales in
ance with accounting policies generally accepted in the
2003 and consisted of sales to both walk-in commercial
United States of America. Our discussion and analysis of
customers and sales delivered to our commercial customers’
the financial condition and results of operations are based
places of business, including independent garages, service
on these financial statements. The preparation of these
stations and auto dealers. At January 3, 2004, we had 1,625
financial statements requires the application of accounting
stores with commercial delivery programs.
policies in addition to certain estimates and judgments by
We also provide our customers online shopping and
our management. Our estimates and judgments are based on
access to over 1 million stock keeping units, or SKUs. Our
currently available information, historical results and other
online site allows our customers to pick up merchandise at a
assumptions we believe are reasonable. Actual results could
conveniently located store or have their purchase shipped
differ from these estimates.
directly to their home or business.
The preparation of our financial statements included the
Our Internet address is www.advanceautoparts.com. We
following significant estimates.
make available free of charge through our Internet website our
annual reports on Form 10-K, quarterly reports on Form 10-Q, Vendor Incentives
current reports on Form 8-K and amendments to those reports As discussed further elsewhere in this report, we recog-
filed or furnished pursuant to the Securities Act of 1934 as nize certain vendor incentives earned related to long-term
soon as reasonably practicable after we electronically file such supply agreements as a reduction to cost of sales over the
material with, or furnish it to, the SEC. life of the agreement based on the timing of purchases, not
as reductions to inventory. The functional amounts earned
Stock Split under long-term arrangements are based on our estimate of
On October 29, 2003, our Board of Directors declared a total purchases that will be made over the life of the con-
two-for-one stock split of our common stock, effected as tracts and the amount of incentives that will be earned. The
a 100% stock dividend. The dividend was distributed on incentives are generally recognized based on the cumulative
January 2, 2004 to holders of record as of December 11, purchases as a percentage of total estimated purchases over
2003 and began trading on a post-split basis on January 5, the life of the contract. The estimate of total purchases are
2004. All references to share and per share amounts in this highly sensitive to market demand for certain product and
discussion and analysis reflect the effect of the stock split. could positively or negatively impact our gross margins if
actual purchases or results from any one year differ from
Discontinued Operations our estimates, however, incentives earned over the life of
On December 19, 2003, we discontinued the supplying the contract would be the same.
of merchandise to our wholesale distribution network. The
Page 13
16. MANAGEMENT’S DISCUSSION AND ANALYSIS OF FINANCIAL CONDITION AND RESULTS OF OPERATIONS (continued)
Inventory Reserves Self-Insured Reserves
We establish reserves for inventory shrink for our stores We are self-insured for general and automobile liability,
and distribution centers based on our extensive and frequent workers’ compensation and the health care claims of our
cycle counting program. Our estimates of these shrink team members. Therefore, we record estimated reserve
reserves depend on the accuracy of the program, which is amounts for the settlement of such claims below our stop-loss
dependent on compliance rates of our facilities and the limits. These estimates are developed based on information
execution of the required procedures. We evaluate the accu- obtained through our claims management procedures, from
racy of this program on an ongoing basis and believe it actual claims reported to us and an estimate for claims
provides reasonable assurance for the established reserves. incurred but not reported. This information is obtained
If the effectiveness of the program declines management through a collaboration of both our internal and external
estimates will be required to ensure the accuracy of the claims professionals and third-party administrators. The
overall shrink reserves. estimated claim cost is actively reviewed for changes in
Reserves for potentially excess and obsolete inventories claim facts or action plans and negative trends related to
are recorded as well based on current inventory levels of claims incurred but not reported. Accordingly, our esti-
discontinued product and historical analysis of the liquida- mated reserves may require an adjustment to previously
tion of discontinued inventory below cost. The nature of our recorded amounts.
inventory is such that the risk of obsolescence is minimal
Restructuring and Closed Store Liabilities
and excess inventory has historically been returned to our
We recognize a provision for future obligations at the
vendors for credit. We provide reserves where less than full
time a store location closes. The provision includes future
credit will be received for such returns and where we antic-
minimum lease payments and common area maintenance
ipate that items will be sold at retail prices that are less than
and taxes all reduced by management’s estimate of potential
recorded cost. We develop these estimates based on the
subleases and lease buyouts. These estimates are based on
determination of return privileges with vendors, the level of
current market and our experience of executing subleases or
credit provided by the vendor and management’s estimate
buyouts on similar properties. However, our inability to
of the discounts to recorded cost, if any, required by market
enter into the subleases or obtain buyouts due to a change
conditions. Future changes by vendors in their policies or
in the economy or prevailing real estate markets for
willingness to accept returns of excess inventory could
these properties within the estimated timeframe may
require us to revise our estimates of required reserves for
result in increases or decreases to these reserves and could
excess and obsolete inventory.
negatively impact our result of operations and cash flows.
Warranty Reserves
Components of Statement of Operations
Our vendors are primarily responsible for warranty
claims. Merchandise and services sold under warranty,
Net Sales
which are not covered by vendors’ warranties, include bat-
Net sales consist primarily of comparable store sales,
teries, tires, roadside assistance and Craftsman products.
new store net sales, and finance charges on installment
We record accruals for future warranty claims based on
sales. Comparable store sales is calculated based on the
current sales of the warranted products and historical claim
change in net sales starting once a store has been opened for
experience. If claims experience differs from historical lev-
13 complete accounting periods (each accounting period
els, revisions in our estimates may be required. We have
represents four weeks). Relocations are included in compa-
seen positive trends in the defective rates of our batteries
rable store sales from the original date of opening. Our
sold, which have offset historically higher trends used to
2003 comparable store sales results include the 53rd week
develop our battery warranty accrual resulting in overall
of operation compared to our first week of operation in
lower warranty expense on our consolidated statement of
2003 (the comparable calendar week). Stores acquired in
operations. We believe these positive trends are a result of
the Discount acquisition were included in the comparable
quality enhancements of our currently offered battery line
store sales calculation beginning in December 2002, which
and better policies and procedures surrounding the testing
was 13 complete accounting periods after the acquisition
and defecting of batteries by our store personnel. While we
date of November 28, 2001. We do not include net sales
expect these positive trends to continue, an increase in
from the 36 Western Auto retail stores in our comparable
defective rates would have a negative impact on our
store sales calculation as a result of their unique product
consolidated statement of operations.
offerings, including specialty merchandise.
Page 14