Download to read offline
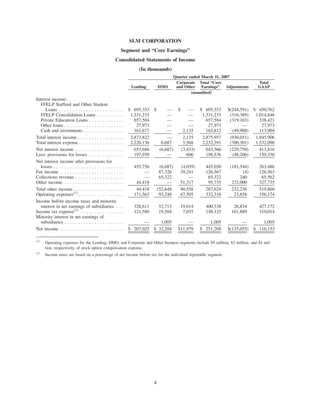
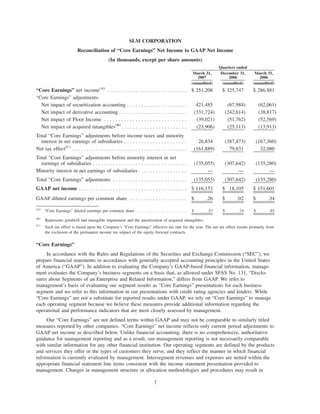
This document provides financial information for SLM Corporation for the quarters ending March 31, 2007, December 31, 2006, and March 31, 2006. Some key details include: - Net income for the quarters was $116 million, $18 million, and $152 million respectively. - "Core Earnings" net income, which excludes certain items, was $251 million, $326 million, and $287 million respectively. - Average managed student loans increased from $124.9 billion to $146.2 billion. - Total assets increased from $97.8 billion to $126.9 billion over the period reported.


