The Fastmind, a mobile gaming studio, uses Fabric, Twitter’s mobile development platform, to continuously grow their ad revenue, user base, and user experience for their top app, Apensar.
State of Supply Quality in Mobile ProgrammaticMoPub
In our recent whitepaper series on the state of supply quality, we investigate three particularly salient topics to marketers today: fraud, viewability, and ad blocking. While these issues aren’t new to digital advertising, they are a new issue for mobile — particularly because they manifest in mobile differently than other digital advertising supply sources.
Global Mobile Programmatic Trends: Q1 2016 TrendsMoPub
This report examines trends in mobile programmatic advertising observed on MoPub Marketplace -- the world's leading mobile programmatic exchange -- in Q1 2016. Key themes include advertising spend around major events, the use of high impact ad formats, and growth in EMEA and APAC.
MoPub's quarterly Mobile Programmatic Trends report explores the current state of the mobile programmatic landscape. The report provides market data from real-time bidded auctions for mobile ad impressions, aggregated from mobile applications, advertisers, and demand side platforms on MoPub Marketplace, one of the world’s leading advertising exchanges for mobile apps.
The Q3 2015 report focuses on the uncharted inventory opportunity, Q4 holiday outlook, and the idea that moments continue to matter on mobile.
Global Mobile Programmatic Trends: Q4 2015 TrendsMoPub
This report examines trends in mobile programmatic in the last quarter of 2015. Key themes include brand spend on mobile programmatic, engaging formats driving increased demand and publisher monetization, and trends in EMEA and APAC.
Why [Mobile] [In-app] Programmatic? A Marketer's GuideMoPub
What do buyers need to know about how RTB works, what "premium" means for mobile inventory, mobile attribution, and more? It's all here in our handy guide.
Thomvest Mobile Advertising Overview - February 2016Thomvest Ventures
This is an overview of the mobile adtech ecosystem. Research was conducted by Thomvest Ventures. It covers topics including mobile advertising spend, programmatic advertising, key mobile advertising vendors (i.e DSP, SSP, exchanges & networks), and key trends.
programmatic Buying in Mobile Advertising Sumit Roy
74% of marketers are now using programmatic media buying on mobile for retargeting users, 62% use it for performance marketing and 61% for branding. • This represents a huge opportunity for the industry to build targeting and measurement solutions that deliver greater effectiveness and efficiency for upper-funnel campaigns. Of those not using programmatic, the biggest barriers for adoption are complexity of the ecosystem (58%), skills shortage (42%) and lack of education (33%).
Q4 2016 Benchmark Report: The Holidays Deliver Higher Returns on Facebook Ad ...Nanigans
The holidays delivered higher return on ad spend on Facebook in Q4 2016
This report highlights key trends seen by companies leveraging Nanigans advertising automation software to grow the revenue impact of their direct response ad campaigns on Facebook.
This report highlights:
-CTR, CPM, and CPC trends for Facebook ads by vertical and geographic market
-Insights on how ecommerce advertisers are achieving higher returns
-Data on skyrocketing adoption of Facebook’s dynamic and mobile video ads
Facebook Video Advertising Rewind: Benchmarks and Trends from 2016Nanigans
Direct response advertisers in all industries are harnessing the power of video ads to drive meaningful actions. Whether they aim to increase purchases, app downloads, or lead form submissions, marketers benefiting by increasing their video ad spend on Facebook, Audience Network and Instagram.
As CMOs scale investment in video advertising, it's important to understand how the market is trending. This SlideShare features data and insights from our recent report of 2016 video advertising benchmarks in order to provide you with the knowledge you need to create successful campaigns this year and beyond.
Q3 2016 Benchmark Report: Advertisers on Facebook Scale Revenue Through Video...Nanigans
To arm online marketing teams with essential aggregate insights, today we’re releasing our latest Global Facebook Advertising Trends Report. This report examines key trends seen by companies leveraging Nanigans advertising automation software to manage, optimize, and measure their performance marketing ad campaigns on Facebook during Q3 2016.
Our latest advertising report highlights:
- CTR, CPM, and CPC trends for Facebook ads by vertical and geographic market
- Insights on how marketers are generating higher return on ad spend
- Global growth in adoption of Facebook’s Audience Network
This benchmark report highlights key trends seen by companies leveraging Nanigans advertising automation software to grow the revenue impact of their direct response advertising campaigns on Facebook.
Q2 2017 Benchmark Report: Marketers Deepen Facebook Ad Investments as Mobile ...Nanigans
Mobile advertising skyrocketed on Facebook in Q2 2017. According to Facebook's recent revenue report, mobile advertising now commands an 87% share of all ad revenue.
What's driving this massive increase in mobile ad spend? Nanigans recently explored this shift in its Q2 2017 Facebook Advertising Benchmark report. Learn how advertisers are maximizing revenue growth on Facebook with the findings in this SlideShare.
Today’s marketers must embrace a new engagement strategy to adapt, anticipate, and deliver in mobile moments. Placing mobile bets solely on ads or one-off purchases isn’t enough to secure revenue and engagement—marketers have to embrace continual cycles of real-time, two-way consumer engagement.
This webinar will show marketers how to create and deliver these experiences and campaigns.
Ad networks mediation is an ad-tracking platform that is integrated with multiple ad networks. It can facilitate ad networks management and ads optimization. By employing it, you can add unlimited ad networks and efficiently manage them to enrich the content and form of mobile advertising and optimize the fill rate and eCPM.
State of mobile mobile developers:ecosystem and marketing mixSumit Roy
InMobi undertook a survey of mobile developers across the world in an attempt to understand the ever growing
ecosystem better. The Mobile app developer survey from InMobi drawn from over 1000+ respondents across 155
countries showcases some insightful data on the latest trends in the mobile app ecosystem, including developer
mindshare, platform of choice , revenue models, challenges and motivations and mobile ad network preferences.
Q1 2016 Global Facebook Advertising Benchmark Report Nanigans
Q1 2016 delivers higher return on Facebook ad spend for retailers, and sees continued global growth in video ads.
This slide deck examines key trends seen by companies leveraging Nanigans advertising automation software to manage, optimize, and measure their performance marketing ad campaigns on Facebook during Q1 2016.
This slide deck highlights:
-CTR, CPM, and CPC trends for Facebook ads by vertical and geographic market
-Insights on how marketers are generating higher return on ad spend
-Global growth in adoption of mobile and video ads
For more information, see the full Q1 2016 Facebook Advertising Benchmark Report here: http://nani.gs/1USSepm
Our Marketplace Report explores mobile programmatic trends. This edition covers Q1 2015 and discusses:
--Moments (such as the Super Bowl) matter on mobile
--Interstitial and native ad formats increase popularity and performance
--Video produces strong results
All You Need To Know About Ad Network MediationInMobi
The mobile advertising ecosystem has exploded. With hundreds of mobile ad networks out there - each with a unique set of advertisers, mobile app entrepreneurs find that to maximize yield, they must work with multiple ad networks concurrently. Ad Network Mediation is the technology that is used to accomplish this.
This presentation will cover the key components developers need to know in order to fully understand ad network mediation, its benefits and how to choose the right mediation platform.
The Marketplace report is a quarterly update that takes an in-depth look at trends in monetization and ad performance across the mobile programmatic ecosystem.
In this quarter’s report, publishers and demand partners found that personal relationships can maximize the benefits of programmatic through private marketplaces.
Things to Consider When Choosing An Ad Network for your AppTaniyaCA1
Choosing the right mobile ad network for your publishing business is crucial for its success. This PowerPoint presentation highlights the important factors to consider when choosing the best mobile ad network for publishers.
The presentation covers key metrics such as fill rate, eCPM, advertiser demand, ad formats, user experience, integration, reporting and analytics, and payment terms.
The goal of the presentation is to provide publishers with a comprehensive guide to help them make informed decisions and choose a mobile ad network that meets their specific needs and maximizes their earning potential.
Whether you're a seasoned publisher or just starting out, this presentation will help you understand the key considerations when choosing a mobile ad network and ensure that you make the right choice for your business.
How do you make a living from apps? Here’s our list of the top 27 app monetization solution providers to help developers earn a profit via advertising.
An original research report on the use of channel marketing automation software by a global audience.
To download the full report, visit www.StateofInboundChannelMarketing.com.
2019 Mobile Growth Handbook - AbridgedMada Seghete
A preview of the 2019 Mobile Growth Handbook. To unlock the additional 127 pages of frameworks, trends, insights, and tips, download the complete handbook: https://branch.app.link/mgh
This playbook tells you all you need to know about app marketing from the experienced team at Performance Revenues. Covering how to get ROI on app marketing, choosing the right ad network and how to avoid fraud this is an indispensable guide for any app marketer.
• Stating the case for display as a relevant advertising strategy
• Campaign planning and KPIs to measure
• Pricing and ad units to consider
• Targeting tactics and retargeting overview
• Mobile web and app campaigns
• Campaign optimization strategies
• A tour of the Google Display Network platform
• B2B topics; lead nurturing, native advertising, LinkedIn advertising
• Display measurement; View-throughs, attribution modeling
Deconstructing the In-App Bidding Landscape [White Paper]PubNative
The white paper is based on internal data and research by PubNative along with data from external resources, with contributions from industry partners such as BidMachine, Coda, Kayzen, and Verve Group, as well as quotes from Chartboost and Timehop.
Topics of the white paper include:
- The traditional waterfall setup
- The history of header bidding on desktop
- The largest players in header bidding
- When “header” bidding came to mobile
- How in-app bidding works
- In-depth analysis of the in-app bidding market and players
- Looking ahead towards the future of in-app bidding
- Partner quotes and industry insights
Download a free high res version of the white paper here: https://pubnative.net/blog/white-paper-in-app-bidding/
An Introduction to Mobile Ad Networking Platforms for Beginners.pdf7searchppc
By 20227, it's anticipated that mobile advertising spending will increase from $5.3 billion to $25.6 billion. The rising number of people switching to smartphones and swiftly becoming accustomed to mobile apps and mobile surfing is a key factor in this assumption.
The tracemobi system provides powerful marketing analytics metrics for mobile app marketers worldwide, these metrics enable you to create an informed strategy based on user engagement, in-app events and retention.
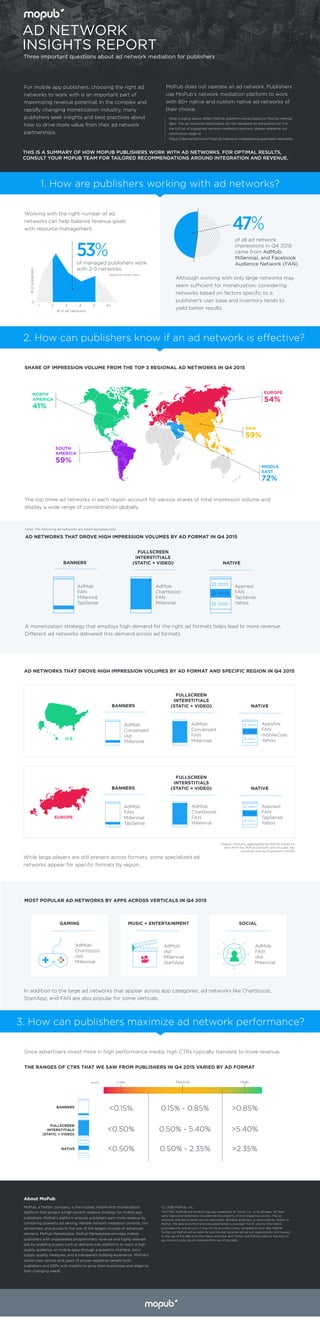
1. AD NETWORK
INSIGHTS REPORT
Three important questions about ad network mediation for publishers
For mobile app publishers, choosing the right ad
networks to work with is an important part of
maximizing revenue potential. In the complex and
rapidly changing monetization industry, many
publishers seek insights and best practices about
how to drive more value from their ad network
partnerships.
MoPub does not operate an ad network. Publishers
use MoPub’s network mediation platform to work
with 60+ native and custom native ad networks of
their choice.
Note: Insights below reflect MoPub platform trends based on MoPub internal
data. The ad networks listed below do not represent an exhaustive list. For
the full list of supported network mediation partners, please reference our
certification page at
https://dev.twitter.com/mopub/network-mediation/supported-networks.
(c) 2016 MoPub, Inc.
TWITTER, MOPUB and the Bird logo are trademarks of Twitter, Inc. or its affiliates. All third
party logos and trademarks included are the property of their respective owners. The ad
networks referred to herein are not associated, affiliated, endorsed, or sponsored by Twitter or
MoPub. The data and information provided herein is provided "AS IS" and for information
purposes only, and as such, it may not be accurate, timely, complete or error-free. Neither
Twitter nor MoPub will be liable for and the user assumes all risk and responsibility with respect
to any use of the data and information provided, and Twitter and MoPub make no warranty of
any kind as to any results obtained from use of the data.
About MoPub
MoPub, a Twitter company, is the trusted, mobile-first monetization
platform that powers a high-growth revenue strategy for mobile app
publishers. MoPub’s platform ensures publishers earn more revenue by
combining powerful ad serving, flexible network mediation controls, rich
ad formats, and access to the one of the largest sources of advertiser
demand, MoPub Marketplace. MoPub Marketplace provides mobile
publishers with unparalleled programmatic revenue and highly relevant
ads by enabling buyers such as demand side platforms to reach a high
quality audience on mobile apps through a powerful interface, strict
supply quality measures, and a transparent bidding experience. MoPub’s
world-class service and years of proven expertise benefit both
publishers and DSPs with insights to grow their businesses and adapt to
their changing needs.
THIS IS A SUMMARY OF HOW MOPUB PUBLISHERS WORK WITH AD NETWORKS. FOR OPTIMAL RESULTS,
CONSULT YOUR MOPUB TEAM FOR TAILORED RECOMMENDATIONS AROUND INTEGRATION AND REVENUE.
Although working with only large networks may
seem sufficient for monetization, considering
networks based on factors specific to a
publisher’s user base and inventory tends to
yield better results.
of all ad network
impressions in Q4 2015
came from AdMob,
Millennial, and Facebook
Audience Network (FAN)
1 2 3 4 5 6+
0
#ofpublishers
53%of managed publishers work
with 2-5 networks.
Working with the right number of ad
networks can help balance revenue goals
with resource management. 47%
*based on recent data
1. How are publishers working with ad networks?
2. How can publishers know if an ad network is effective?
Appnext
FAN
TapSense
Yahoo
EUROPE
54%
A monetization strategy that employs high demand for the right ad formats helps lead to more revenue.
Different ad networks delivered this demand across ad formats.
SHARE OF IMPRESSION VOLUME FROM THE TOP 3 REGIONAL AD NETWORKS IN Q4 2015
In addition to the large ad networks that appear across app categories, ad networks like Chartboost,
StartApp, and FAN are also popular for some verticals.
*region: manually aggregated by MoPub based on
data from the MoPub platform and includes top
countries only by impression volume
AdMob
Chartboost
iAd
Millennial
AdMob
Chartboost
FAN
Millennial
AdMob
FAN
Millennial
TapSense
NORTH
AMERICA
41%
SOUTH
AMERICA
59%
AdMob
FAN
iAd
Millennial
AdMob
iAd
Millennial
StartApp
AD NETWORKS THAT DROVE HIGH IMPRESSION VOLUMES BY AD FORMAT IN Q4 2015
Appsfire
FAN
mobileCore
Yahoo
AdMob
Conversant
FAN
Millennial
AdMob
Conversant
iAd
Millennial
U.S.
While large players are still present across formats, some specialized ad
networks appear for specific formats by region.
Appnext
FAN
TapSense
Yahoo
AdMob
Chartboost
FAN
Millennial
AdMob
FAN
Millennial
TapSense
EUROPE
GAMING MUSIC + ENTERTAINMENT SOCIAL
MIDDLE
EAST
72%
MOST POPULAR AD NETWORKS BY APPS ACROSS VERTICALS IN Q4 2015
AD NETWORKS THAT DROVE HIGH IMPRESSION VOLUMES BY AD FORMAT AND SPECIFIC REGION IN Q4 2015
The top three ad networks in each region account for various shares of total impression volume and
display a wide range of concentration globally.
NATIVE
FULLSCREEN
INTERSTITIALS
(STATIC + VIDEO)BANNERS
NATIVE
FULLSCREEN
INTERSTITIALS
(STATIC + VIDEO)BANNERS
NATIVE
FULLSCREEN
INTERSTITIALS
(STATIC + VIDEO)BANNERS
Quality
Since advertisers invest more in high performance media, high CTRs typically translate to more revenue.
3. How can publishers maximize ad network performance?
NATIVE
FULLSCREEN
INTERSTITIALS
(STATIC + VIDEO)
BANNERS
THE RANGES OF CTRS THAT WE SAW FROM PUBLISHERS IN Q4 2015 VARIED BY AD FORMAT
High
>0.85%
>5.40%
>2.35%
Neutral
0.15% - 0.85%
0.50% - 5.40%
0.50% - 2.35%
Low
<0.15%
<0.50%
<0.50%
Note: The following ad networks are listed alphabetically.
ASIA
59%
# of ad networks