Download to read offline

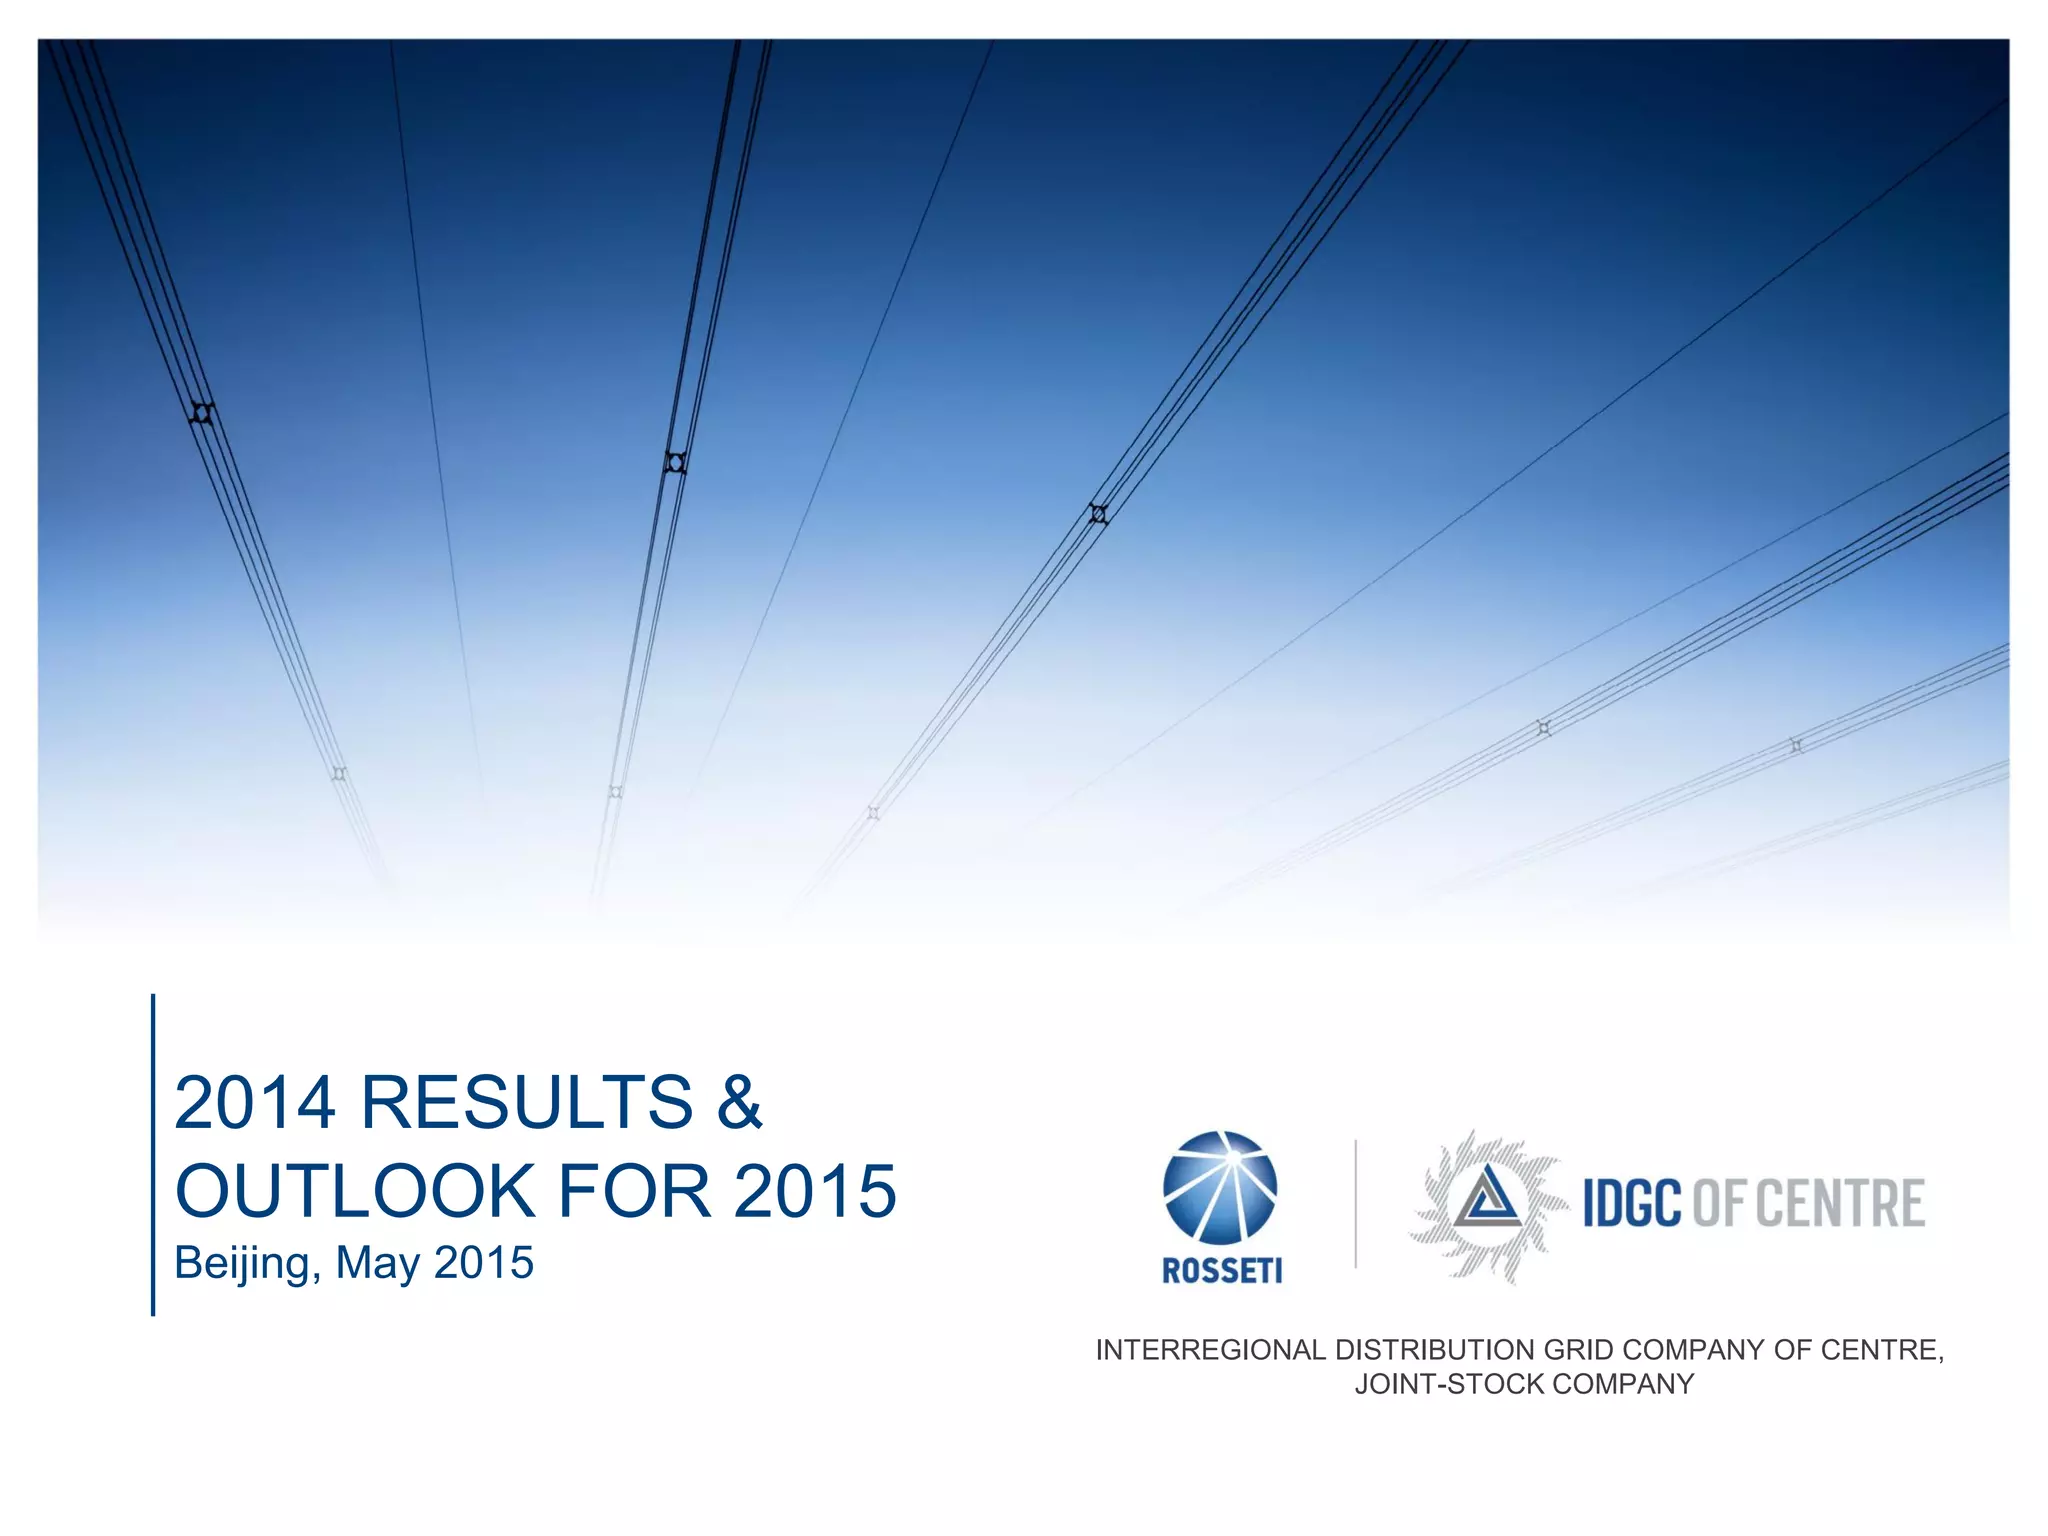
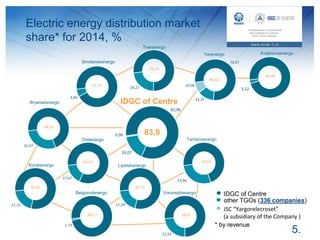
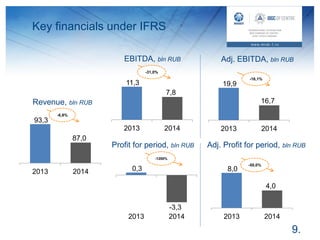
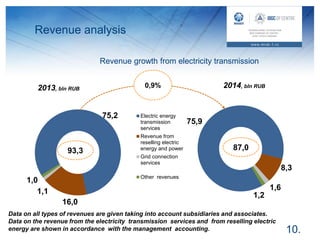
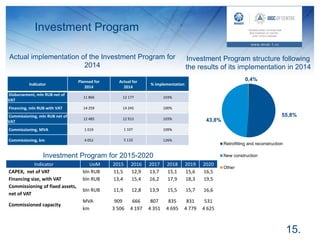
![Key financials under IFRS for
2014
8.
Indicators 12M 2013 12M 2014 Change, %
Revenue 93,3 87,0 -6,8%
Operating expenses -91,2 -88,9 -2,5%
Other income 1,3 1,2 -7,7%
Operating income 3,4 -0,7 -120,6%
EBITDA1 11,3 7,8 -31,0%
Adj. EBITDA2 19,9 16,7 -16,1%
Profit for period 0,3 -3,3 -1200,0%
Adj. Profit for period3 8,0 4,0 -50,0%
[1] EBITDA is calculated as follows: profit for period + profit tax + financial costs – financial income + depreciation charges;
[2] Adjusted EBITDA is calculated as EBITDA except for the provisions for impairment of accounts receivable and impairment of fixed assets;
[3] Adjusted Profit for the period is calculated as Profit for the period except for the provisions for impairment of accounts receivable, impairment of fixed
assets and related deferred profit tax charges.
Data in bln RUB, unless specified otherwise](https://image.slidesharecdn.com/2-150924073939-lva1-app6891/85/IDGC-of-Cente-presentation-Investment-road-show-AccEssMeeting-China-Russia-Beijing-28-29-May-2015-8-320.jpg)
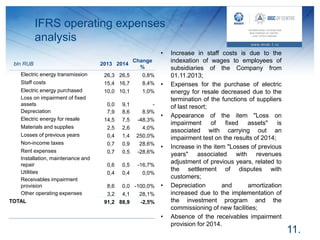
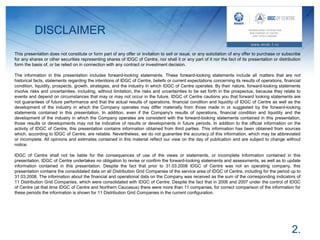
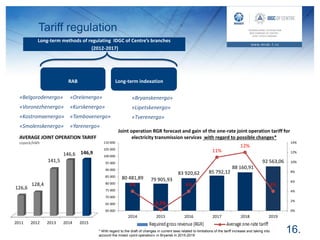
![Key financials under RAS for 2014
12.
Indicators 12M 2013 12M 2014 Change, %
Revenue (total), including: 92,9 86,7 -6,7%
Revenue from electric energy transmission 61,4 69,2 12,7%
Revenue from grid connection 0,9 1,5 66,7%
Revenue from resale of electric energy and
power
29,8 15,1 -49,3%
Other revenue 0,8 0,9 12,5%
Cost of sales 78,1 73,9 -5,4%
Sales profit1 11,5 10,0 -13,0%
EBITDA2 11,5 15,6 35,7%
EBITDA margin, % 12,4% 18,0% 5,6 p.p.
Net profit 0,3 3,3 1000,0%
Net profit margin, % 0,3% 3,8% 3,5 p.p.
[1] Revenue net of cost of sales, selling and administrative expenses
[2] EBITDA is calculated as follows: net profit + profit tax and other similar mandatory payments + interest payable - interest receivable + depreciation charges
Data in bln RUB, unless specified otherwise](https://image.slidesharecdn.com/2-150924073939-lva1-app6891/85/IDGC-of-Cente-presentation-Investment-road-show-AccEssMeeting-China-Russia-Beijing-28-29-May-2015-12-320.jpg)
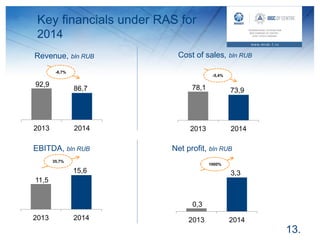
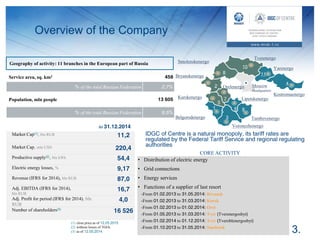
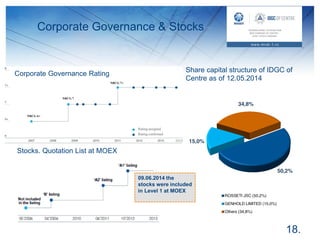
![Indicators of the Business Plan
of the Company for 2015
17.
Indicators
Actual for
2014
Planned for
2015
Change, %
Revenue (total), including: 86,7 78,7 -9,2%
Revenue from electric energy
transmission1
75,9 76,5 0,8%
Revenue from grid connection 1,5 1,4 -6,7%
Revenue from resale of electric energy
and power1
8,3 0,0 -
Other revenue 1,0 0,8 -20,0%
Cost of sales1 73,9 70,1 -5,1%
EBITDA2 15,6 13,9 -10,9%
Net profit 3,3 -0,5 -115,2%
Amount of electric energy transmitted3,
billion kWh
54,4 54,4 0,0%
Electric energy losses, % 9,17% 9,44% 0,27 p.p.
Electric energy losses, % (under
comparable conditions)
9,17% 9,10% -0,07 p.p.
[1] According to management accounting (revenues and cost of sales without internal business volume)
[2] EBITDA is calculated as follows: net profit + profit tax and other similar mandatory payments + interest payable - interest receivable + depreciation charges
[3] Joint operation productive supply without taking into account losses of TGOs
Data in bln RUB, unless specified otherwise](https://image.slidesharecdn.com/2-150924073939-lva1-app6891/85/IDGC-of-Cente-presentation-Investment-road-show-AccEssMeeting-China-Russia-Beijing-28-29-May-2015-17-320.jpg)

In 2014: - IDGC of Centre's electric energy distribution market share was 83.9% across its service regions. Revenue was 87 billion rubles but operating income declined to -0.7 billion rubles. - Capital expenditures totaled 12.2 billion rubles, commissioning 5,110 km of lines and 1,107 MVA of capacity. Electric energy losses decreased to 9.17%. - The company transferred supplier of last resort functions to other companies in 5 regions, reducing consumer debt by 3.1 billion rubles or 41%. - Adjusted EBITDA declined 16.1% to 16.7 billion rubles on reduced revenue from transferring supplier functions and lower energy losses provisions.


