Download as PDF, PPTX


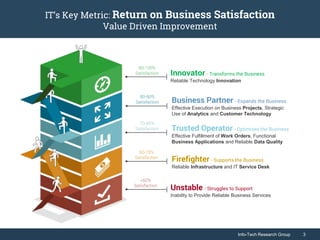
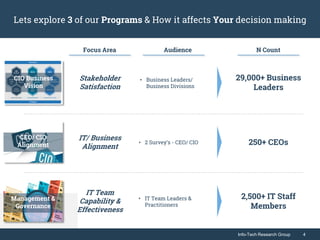

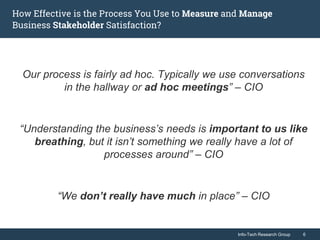
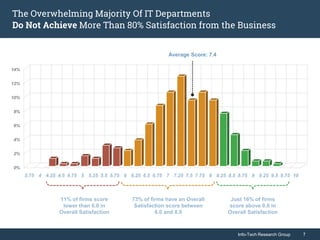
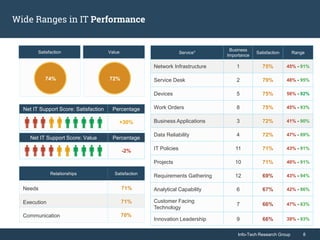
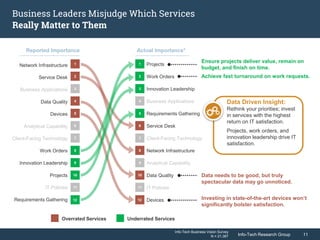
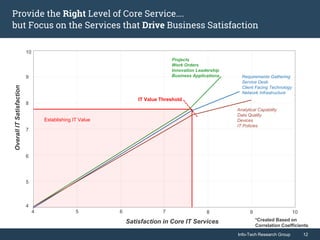
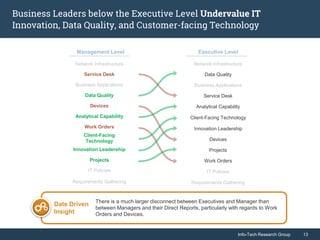
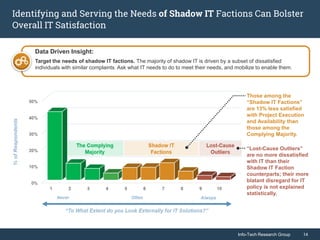
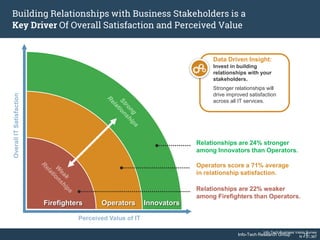

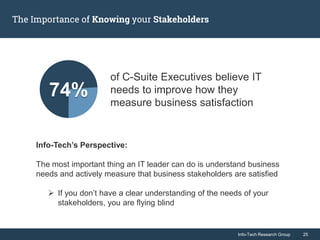

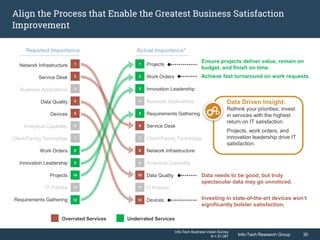

The document discusses the relationship between IT departments and business stakeholders, highlighting the low satisfaction scores (average score: 7.4) and the need for IT to better align with business needs. It emphasizes the importance of investing in services that drive satisfaction, such as project execution and innovation leadership, while also addressing the disconnect between CIOs and CEOs regarding IT's role and performance expectations. Key insights suggest that building relationships and understanding stakeholder needs are crucial for improving overall IT satisfaction.