ACA Replacement Plans and the Individual Market
•
1 like•3,782 views

ACA Replacement Plans and the Individual Market

Recommended
Recommended
More Related Content
What's hot
What's hot (20)
Similar to ACA Replacement Plans and the Individual Market
Similar to ACA Replacement Plans and the Individual Market (20)
More from KFF
More from KFF (20)
Recently uploaded
Recently uploaded (20)
ACA Replacement Plans and the Individual Market
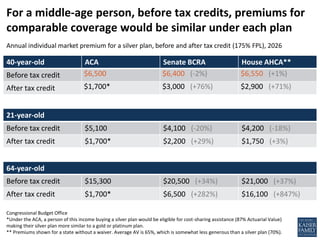
- 1. 40-year-old ACA Senate BCRA House AHCA** Before tax credit $6,500 $6,400 (-2%) $6,550 (+1%) After tax credit $1,700* $3,000 (+76%) $2,900 (+71%) Congressional Budget Office *Under the ACA, a person of this income buying a silver plan would be eligible for cost-sharing assistance (87% Actuarial Value) making their silver plan more similar to a gold or platinum plan. ** Premiums shown for a state without a waiver. Average AV is 65%, which is somewhat less generous than a silver plan (70%). For a middle-age person, before tax credits, premiums for comparable coverage would be similar under each plan 21-year-old Before tax credit $5,100 $4,100 (-20%) $4,200 (-18%) After tax credit $1,700* $2,200 (+29%) $1,750 (+3%) 64-year-old Before tax credit $15,300 $20,500 (+34%) $21,000 (+37%) After tax credit $1,700* $6,500 (+282%) $16,100 (+847%) Annual individual market premium for a silver plan, before and after tax credit (175% FPL), 2026
- 2. Monthly Premium for a Silver Plan Among Exchange Enrollees (By Income and Age), 2020 Income Below 200% of Poverty Income 200% of Poverty or Above Age ACA Premium After Tax Credit BCRA Premium After Tax Credit % Change ACA Premium After Tax Credit BCRA Premium After Tax Credit % Change < 18 $26 $58 121% $176 $170 -4% 18-34 $57 $103 82% $247 $247 0% 35-44 $69 $149 117% $296 $369 25% 45-54 $67 $215 223% $323 $556 72% 55-64 $69 $272 294% $399 $782 96% 65 + $76 $296 288% $439 $862 96% Overall $61 $168 177% $311 $489 57% Source: Kaiser Family Foundation Kaiser Family Foundation. Premiums under the Senate Better Care Reconciliation Act, Jun 26 2017 http://www.kff.org/health- reform/issue-brief/premiums-under-the-senate-better-care-reconciliation-act/ Low-income, older adults would face highest premium increases under Senate BCRA
- 3. 12% 14% 21% 22% 33% 74% 108% 111% 140% 142% 164% 0% 20% 40% 60% 80% 100% 120% 140% 160% 180% New York Mass. Vermont DC Washington US Average West Virginia South Dakota Oklahoma Alaska Alabama Percent Difference in Average Monthly Silver Premiums After Tax Credits under BCRA vs. ACA, 2020 Kaiser Family Foundation. Premiums under the Senate Better Care Reconciliation Act, Jun 26 2017 http://www.kff.org/health- reform/issue-brief/premiums-under-the-senate-better-care-reconciliation-act/ States with older, lower-income, rural populations would see average premiums more than 100% higher under the BCRA than current law
- 4. 12% 74% 164% NY MA VT DC WA NH IN ME KY NJ OH AZ OR IL NM AR DE RI CO MN SC VA UT FL MI GA ID PA NV US MD CT IA ND MO TX WI MS KS WY TN HI MT NE CA LA WV NC SD OK AK AL Kaiser Family Foundation. Premiums under the Senate Better Care Reconciliation Act, Jun 26 2017 http://www.kff.org/health- reform/issue-brief/premiums-under-the-senate-better-care-reconciliation-act/ Some states would see higher average premium increases than others under the Senate BCRA Percent Difference in Average Monthly Silver Premiums After Tax Credits under BCRA vs. ACA, 2020
- 5. Source: Kaiser Family Foundation analysis of data from Healthcare.gov. Note: Under the ACA, people purchasing silver plans on- exchange who have incomes below 250% of the poverty level (about $30,000 for a single individual or $60,000 for a family of four) receive reduced cost-sharing, meaning their plans have lower deductibles. Typically, silver plans have an actuarial value of 70%, meaning that on average the plan pays 70% of the cost of covered benefits for a standard population of enrollees, with the remaining 30% of total costs being covered by the enrollees in the form of deductibles, copayments, and coinsurance. Average Deductible in Marketplace Plans with Combined Medical and Prescription Drug Deductibles, 2017 $6,105 $3,609 $2,904 $809 $255 $0 $1,000 $2,000 $3,000 $4,000 $5,000 $6,000 $7,000 Bronze (60% Actuarial Value) Silver Income Over 250% of Poverty (70% AV) Income 200-250% of Poverty (73% AV) 150-200% of Poverty (87% AV) 150% of Poverty or Below (94% AV) Silver Plans with Cost-Sharing Reductions for Lower-Income Enrollees