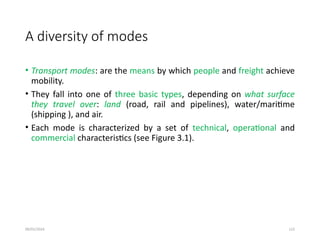
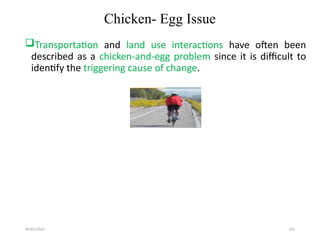
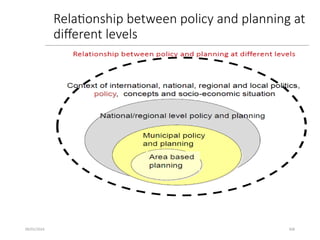
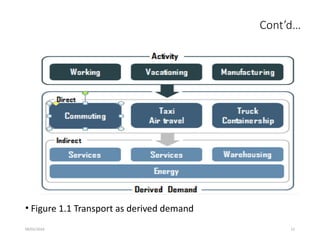
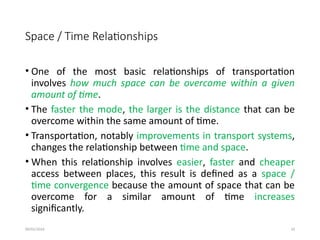
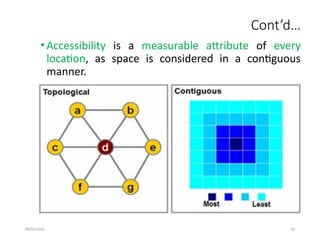
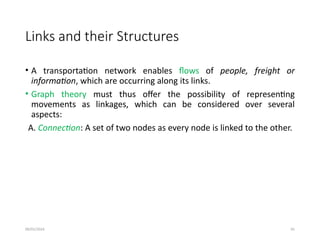
The document covers transport geography, defining it as the study of the mobility of people, freight, and information along with the spatial organization involved. It details various aspects including transport systems, modes, principles, accessibility, and the historical evolution of transportation technologies, emphasizing the importance of transport in overcoming spatial barriers and fulfilling mobility demands. Additionally, it discusses concepts like transportability, derived demand, and the infrastructural requirements essential for effective transportation networks.


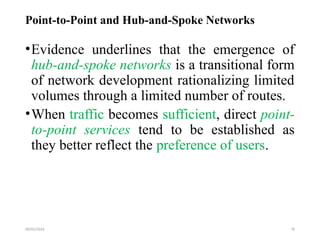
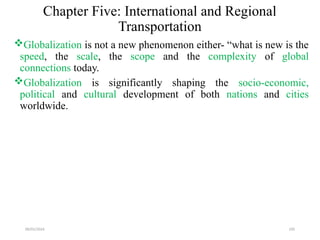
![09/01/2024 94
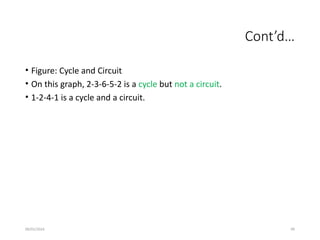
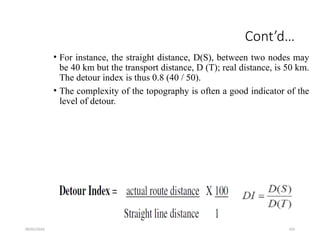
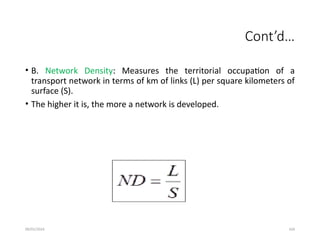
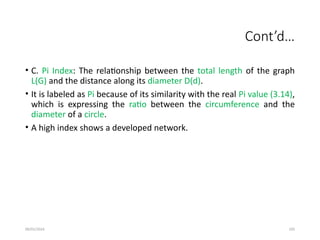
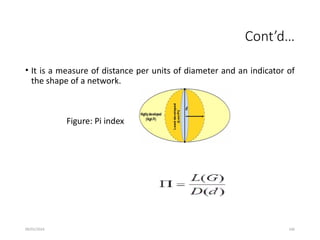
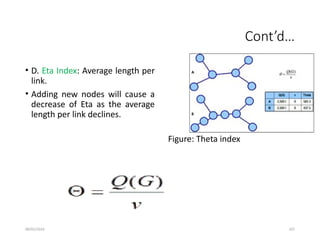
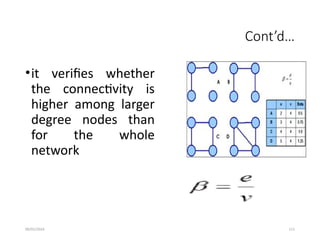
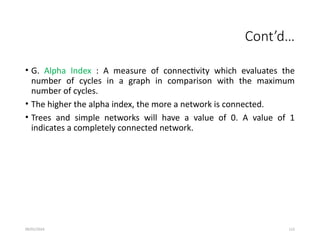
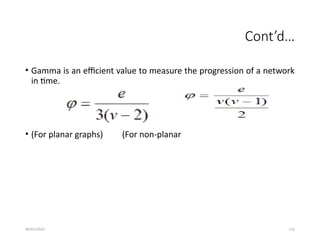
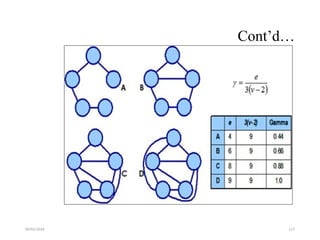
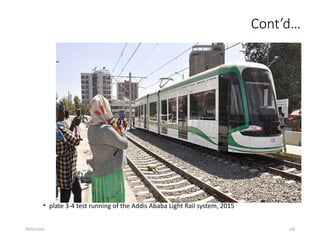
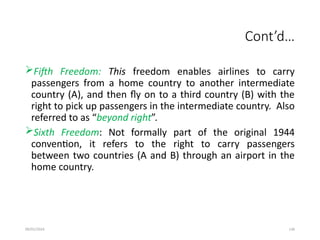
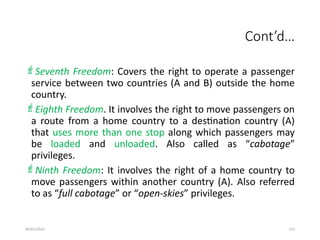
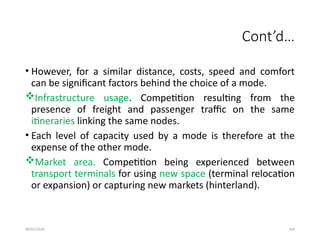
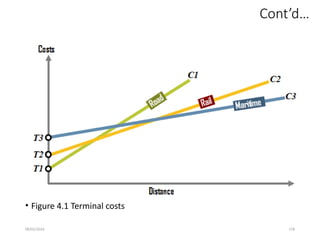
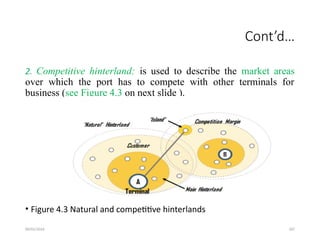
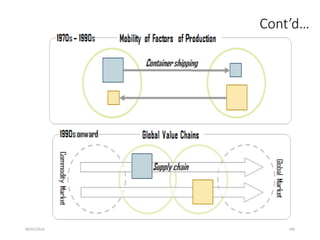
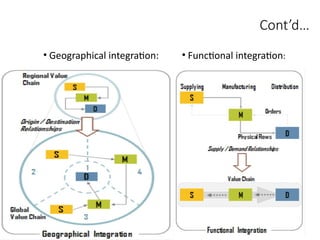
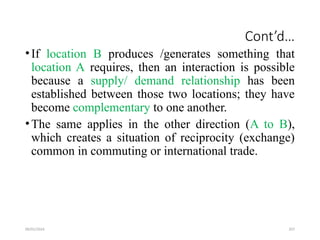
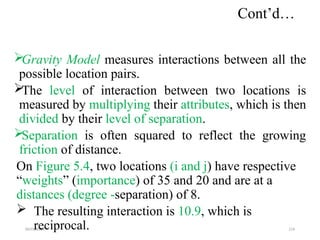
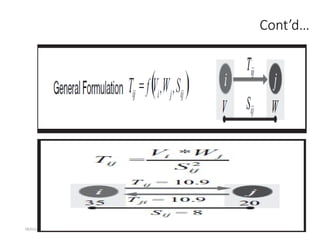
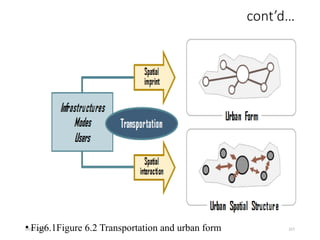
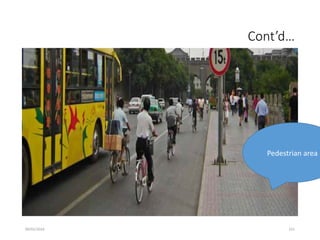
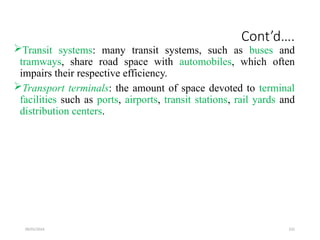
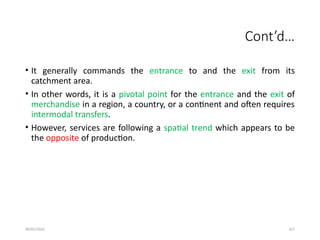
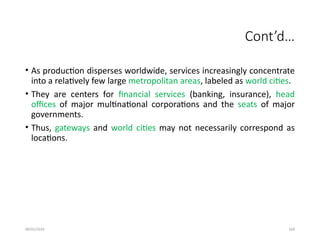
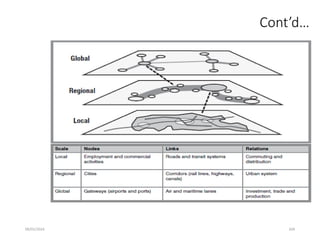
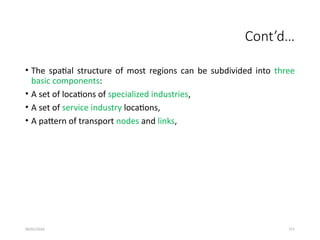
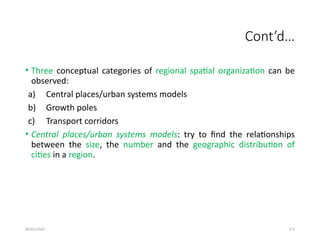
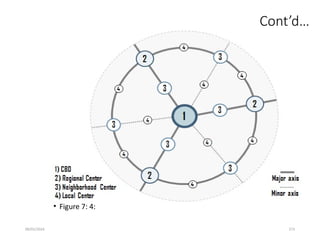
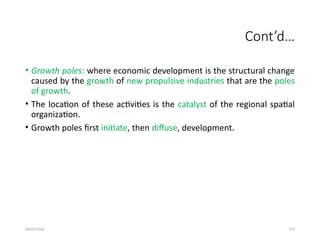
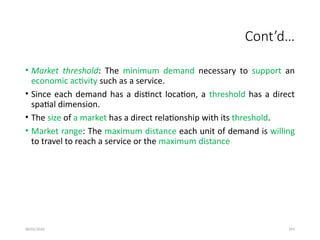
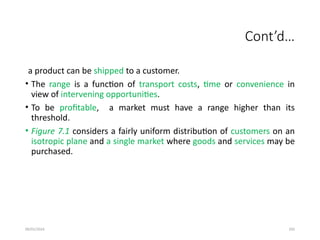
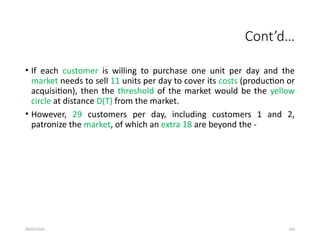
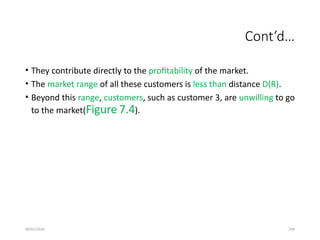
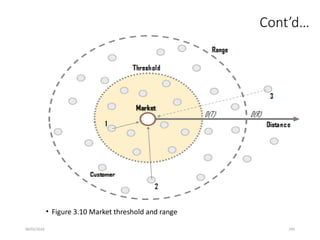
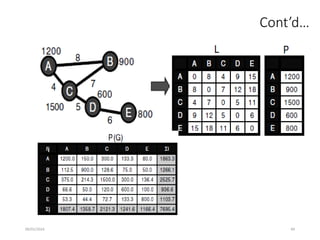
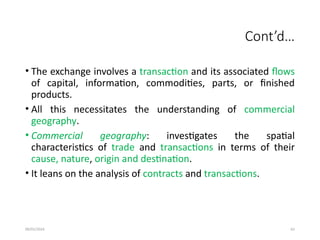
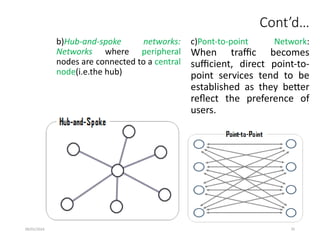
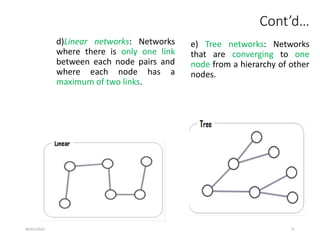
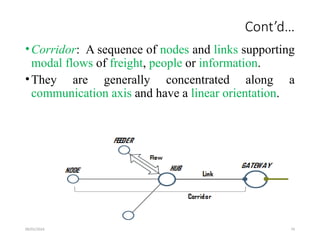
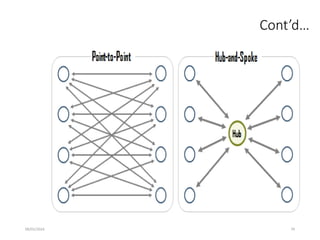
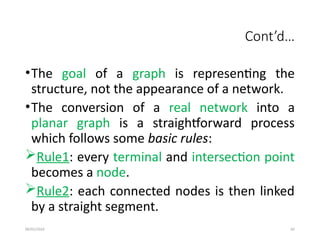
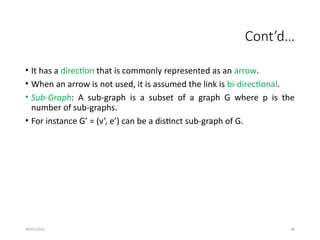
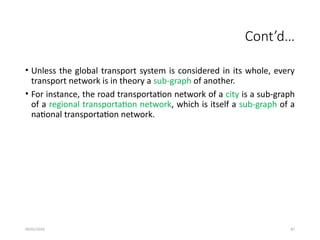
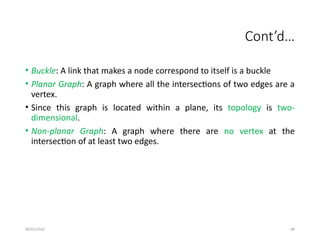
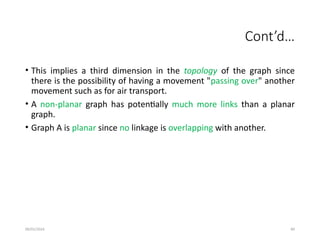
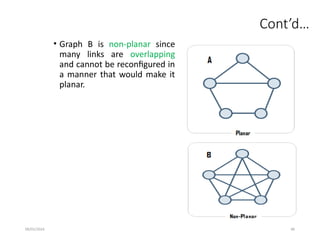
Cont’d…
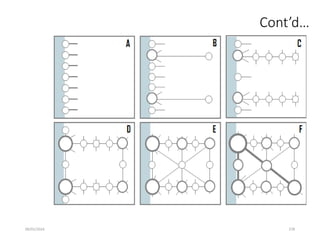
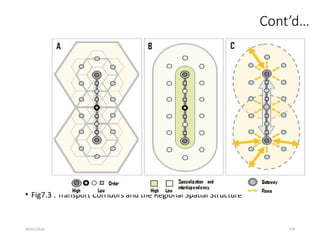
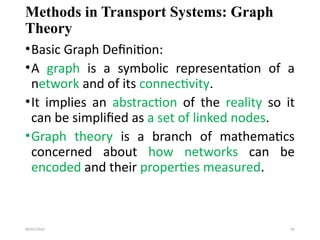
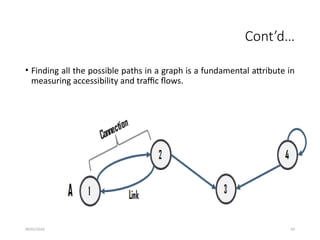
• On graph A, there are 5 links [(1,2), (2,1), (2,3), (4,3), (4,4)] and 3
connections [(1-2), (2-3), (3-4)].
• On graph B, there is path between 1 and 3, but on graph C there is no
path between 1 and 3.](https://image.slidesharecdn.com/ppttransport2016tutorial-240901041608-bd664a12/85/Abel-Ermias-PPT_Transport-2016-tutorial-pptx-94-320.jpg)