Medicine is a human science that is constantly evolving, and this evolution generates a large mass of data that needs to be exploited with the multitude of IT resources available to guarantee and maintain this scientific progress. Some diseases share most symptoms, whereas others could have a low probability of being identified in an early stage. Thus, when facing a such situation, an inexperienced doctor may have difficulty making the right diagnosis or may test different cases, which will be a big waste of time. In this paper, we are going to make this embarrassing situation less complex by giving practitioners every probable disease, and even the least probable ones according to the given symptoms. Indeed, this work will push the diagnosis deeper to reveal hidden symptoms and pathogenesis, to help practitioners make the right decisions. To develop such a solution, the data is organized by matching each disease with its known symptoms, then we used naive Bayes as a classification model, and different metrics to evaluate the performance of this experiment. This work proves that machine learning has become very effective in the medical sector, especially when we notice that the accuracy exceeds 90% in the detection of diseases.
![IAES International Journal of Artificial Intelligence (IJ-AI)
Vol. 14, No. 3, June 2025, pp. 2072~2082
ISSN: 2252-8938, DOI: 10.11591/ijai.v14.i3.pp2072-2082 2072
Journal homepage: http://ijai.iaescore.com
A symptom-driven medical diagnosis support model based on
machine learning techniques
Adil Laabidi, Mohammed Aissaoui
National School of Applied Sciences, Mohammed Premier University, Oujda, Morocco
Article Info ABSTRACT
Article history:
Received Apr 18, 2024
Revised Feb 27, 2025
Accepted Mar 15, 2025
Medicine is a human science that is constantly evolving, and this evolution
generates a large mass of data that needs to be exploited with the multitude
of IT resources available to guarantee and maintain this scientific progress.
Some diseases share most symptoms, whereas others could have a low
probability of being identified in an early stage. Thus, when facing a such
situation, an inexperienced doctor may have difficulty making the right
diagnosis or may test different cases, which will be a big waste of time. In
this paper, we are going to make this embarrassing situation less complex by
giving practitioners every probable disease, and even the least probable ones
according to the given symptoms. Indeed, this work will push the diagnosis
deeper to reveal hidden symptoms and pathogenesis, to help practitioners
make the right decisions. To develop such a solution, the data is organized
by matching each disease with its known symptoms, then we used naive
Bayes as a classification model, and different metrics to evaluate the
performance of this experiment. This work proves that machine learning has
become very effective in the medical sector, especially when we notice that
the accuracy exceeds 90% in the detection of diseases.
Keywords:
Disease prediction
F-score
Machine learning
Medical diagnosis
Naive Bayes
Symptoms
This is an open access article under the CC BY-SA license.
Corresponding Author:
Adil Laabidi
National School of Applied Sciences, Mohammed Premier University
Boulevard Mohamed VI, Oujda, Morocco
Email: laabidi.adil@ump.ac.ma
1. INTRODUCTION
The massive technological advancement has greatly accelerated disease diagnosis and treatment
plans. Various hospitals have adopted the technological approach due to cost reduction, time saving and
accurate results [1], [2]. Moreover, health information technologies could reduce drug events and produce a
better relationship between doctor and patient [3]. We also notice that the dynamic community of
bioinformatics researchers, who have elevated data science to a foundational competency, have consistently
created highly reproducible approaches that work in different settings and with different patients. This group
of researchers employed computers as their laboratories in one of the basic sciences, and which has been one
of the early domains where big data was sequestered as medical science [4].
Furthermore, big data and machine learning have the power to guide practitioners toward the most
effective medical decision and treatments, as they could improve care quality without having any need to test
unnecessary diagnostic and therapies [5]. The collection of massive data has formed large-scale datasets from
different medical sectors such as biological science, radiological, bioinformatics, and even medical
prescriptions written in human natural language. Therefore, this big quantity of data needs an intelligent
treatment to produce relevant results in the aim of helping clinical decisions [6]. To produce these results,
different technics are applied while converging to the same objective; we notice machine learning,](https://image.slidesharecdn.com/3725832-250826093011-f15c83b1/75/A-symptom-driven-medical-diagnosis-support-model-based-on-machine-learning-techniques-1-2048.jpg)
![Int J Artif Intell ISSN: 2252-8938
A symptom-driven medical diagnosis support model based on machine learning techniques (Adil Laabidi)
2073
deep learning, reinforcement learning, and also natural language processing. These artificial intelligence
technologies, combined with human intelligence, have the power to accomplish difficult tasks with ease.
They can help with accurate diagnosis, making efficient treatment and follow-up plans, risk prediction,
productivity improvement, and even reducing medical errors [7], [8].
Using these machine learning techniques, we could work on situations with different levels of
complexity, such as the analysis of radiological images while revealing relevant results that could lead to
interpreting some of the images in priority. Another case could be the situation of patients, some of them may
need to be redirected to a specialist where others will simply receive psychological support. These data
science techniques will not be able to replace human intervention, but will be used as a complement and help
practitioners to better manage their interventions and to devote themselves much more to the most complex
situations. It is a practical way to create collaboration between medicine and artificial intelligence.
In this paper, we study the power of machine learning classifiers to identify diseases according to
some given symptoms. This work won’t be just a simple classification that have to determine concerned
disease, but also to be able to predict even low probability diseases. In some cases, an unexperienced doctor
or even an experienced one could be confused when a patient has symptoms for a common disease, but at the
same time these symptoms can reveal a serious disease in an early stage. Therefore, the doctor must
experiment with different clinical plans for a more accurate diagnosis to define the different possible cases.
However, by following this method, we may waste too much time that could be important in the healing
phase, a time where a disease in an early stage may become in an advanced one. So, this work provides a
solution to overcome this situation and give to practitioners enough time and possibilities to deeply analyses
every case encountered. This study represents the results obtained by applying naive Bayes as a model
learning on a dataset formed from data collected on the web portal of the U.S. National Library of Medicine
(NLM) [9]. The main objective is to give the possibility to determine a hidden disease behind the symptoms
of other ones.
This work is described as follows. Section 2 describes a literature review on machine learning for
healthcare, medical research, and some preliminary comparisons of different models. Section 3 presents the
research methodology which explains the overall structure of our study as well as the techniques and methods
we used in this work. Then in section 4, we will present and discuss the results of this experiment. Finally, in
conclusion, we evaluate the model in terms of achieving the objectives and we will talk about some future
work.
2. RELATED WORKS
Taking advantage of the great technological advances in hardware and software, as well as the
power of various ma- chine learning algorithms, many studies have deeply exploited big data in order to
prove the benefits of artificial intelligence in the medical sector. Laabidi and Aissaoui [10] comparing the
performance of different machine learning algorithms in order to determine the best performing model for
predicting diabetes and prostate cancer. This study proved that algorithms can be very accurate when it
comes to predicting diseases. In the same context, Shah et al. [11] conducted a study with the objective of
determining whether or not a patient could develop heart disease. They worked on four different models
while comparing their performance. The main objective was to work with lesser attributes and tests [11].
This study also demonstrated that classification models are very effective when it comes to producing
medical outcomes with good accuracy. Kosarkar et al. [12] implemented a system using three algorithms,
decision tree, random forest, and naive Bayes. Their work consists in comparing the performances of the
three classifiers using K fold cross validation, which showed that these algorithms gave very good accuracy
with a small advantage of naive Bayes. However, looking at the result of the example given by the author, we
find that naive Bayes and decision tree classifiers give the same result, while random forest gives a different
result. At this level and in general we will choose the favorite result of the most of the classifiers, but with a
precision as close as the one on the example this could put the practitioner in doubt if he has to decide which
disease is the most probable. Therefore, a complementary diagnosis will be necessary.
Chen et al. [13] developed a heart disease predict system by using a combination of 14 attributes to
determine the presence of heart disease. The attributes were a mixture of personal information’s and others
about the presence of symptoms. The use of artificial neural network (ANN) as an algorithm generated good
results, including an accuracy of over 80%. This experiment leads to talk about the efficiency of machine
learning technics even in some of the most advanced and critical medical fields such as cardiology. With this
development of big data analysis, disease prediction and its analysis methods are receiving more attention in
scientific research. Indeed, different researches have been conducted to improve the classification of diseases
and even the risk to develop future diseases [14]. Chen et al. [15] worked on structured and unstructured data
from real life hospital datasets in order to be able to give predictions with an effective accuracy. Their work
aims in another sense to find a solution to the problem of missing data that could impact the quality of the](https://image.slidesharecdn.com/3725832-250826093011-f15c83b1/75/A-symptom-driven-medical-diagnosis-support-model-based-on-machine-learning-techniques-2-2048.jpg)
![ ISSN: 2252-8938
Int J Artif Intell, Vol. 14, No. 3, June 2025: 2072-2082
2074
results, they finally proposed a new convolutional neural network based multimodal disease risk prediction
(CNN-MDRP) that gave an accuracy of 94.8% [15]. In the same context, many studies conducted on
computer-aided diagnosis (CADx) demonstrated the great utility of medical diagnostic tools in improving
clinical decisions and reducing unnecessary interventions [16], [17].
Still in the same context but this time with a prediction of diseases using symptoms expressed by the
user himself, gadekar et al. [18] worked on a prediction system based on a set of symptoms provided by the
patient. Such a system can be useful to inform the patient on the possible disease he may have, but remains
insufficient or even risky if the patient is not precise in his diagnosis or if he takes the initiative to consume
drugs without medical opinion. Indeed, the majority of models that aim at predicting diseases are based on a
symptom/disease approach, such an approach can reach a good accuracy but remains unable to reveal if there
is a disease hidden behind the symptoms of another or if a disease is present at an early stage.
3. METHOD
3.1. Proposed experimental process
Our disease prediction model is based on an iterative approach, in which the model is fed with the
necessary parameters through several iterations until the optimum result is obtained, as shown in the diagram
in Figure 1. Indeed, when a patient visits a doctor, their primary objective is to accurately convey their
symptoms to receive appropriate treatment. For the doctor, the main goal is to elicit clear and precise
information about the patient's health to make an accurate diagnosis. Our experiment, illustrated in Figure 1,
follows a structured process consisting of the following steps:
‒ Step 1: the doctor inquiries about the patient's health status, guiding the patient to describe their
symptoms and feelings. The doctor's task at this stage is to verify the patient's statements and generate an
initial set of symptoms and signs.
‒ Step 2: the initial set of symptoms and signs identified by the doctor is input into the machine learning
model for the first iteration. The model outputs predictions of likely diseases, ranked in descending order
according to their probability scores. Additionally, the model suggests further symptoms and signs to
check for each listed disease, aiding the practitioner in refining the diagnosis.
‒ Step 3: upon receiving the model's predictions, the doctor interprets the results in the context of the
patient's condition. If the assessment is sufficient to make a decision, the diagnosis is considered optimal.
The practitioner may request additional tests, if necessary, to confirm the diagnosis. If further
investigation is required, the doctor verifies the additional symptoms suggested by the model with the
patient. This process can be repeated iteratively until the doctor is confident in the diagnosis. The number
of iterations is unlimited and depends on the results obtained and the practitioner's judgment. This
iterative approach helps eliminate doubtful cases and identify dangerous conditions accurately.
‒ Step 4: once the doctor finalizes the diagnosis and determines the patient's illness, a treatment protocol
can be planned and implemented for the patient's care and follow-up.
In conclusion, Figure 1 summarizes the process adopted in our study. It is a medical diagnosis support
process designed to help the doctor, whether beginner or experienced, to better master the diagnosis phase in
terms of «Time management» and «Case management».
3.2. Data
The data used in this study come from the NLM, located on the campus of the National Institutes of
Health in Bethesda, Maryland, a center of information innovation since its founding in 1836 [19]. This
library is considered the largest biomedical library in the world, with data collected through a network of
over 8000 collaborators providing access to information across the United States. The NLM has developed a
repository called Unified Medical Language System (UMLS) which is a set of files and software that brings
together many health and biomedical vocabularies and standards to enable interoperability between IT
systems [20]. It integrates more than 2 million names for approximately 900,000 concepts from more than 60
families of biomedical vocabularies. It also integrates 12 million relationships between these concepts [21].
Vocabularies integrated into the UMLS metathesaurus include the NCBI taxonomy, gene ontology, medical
subject headings (MeSH), online mendelian inheritance in man (OMIM), and the digital anatomist symbolic
knowledge base as illustrated in Figure 2 [20], [21].
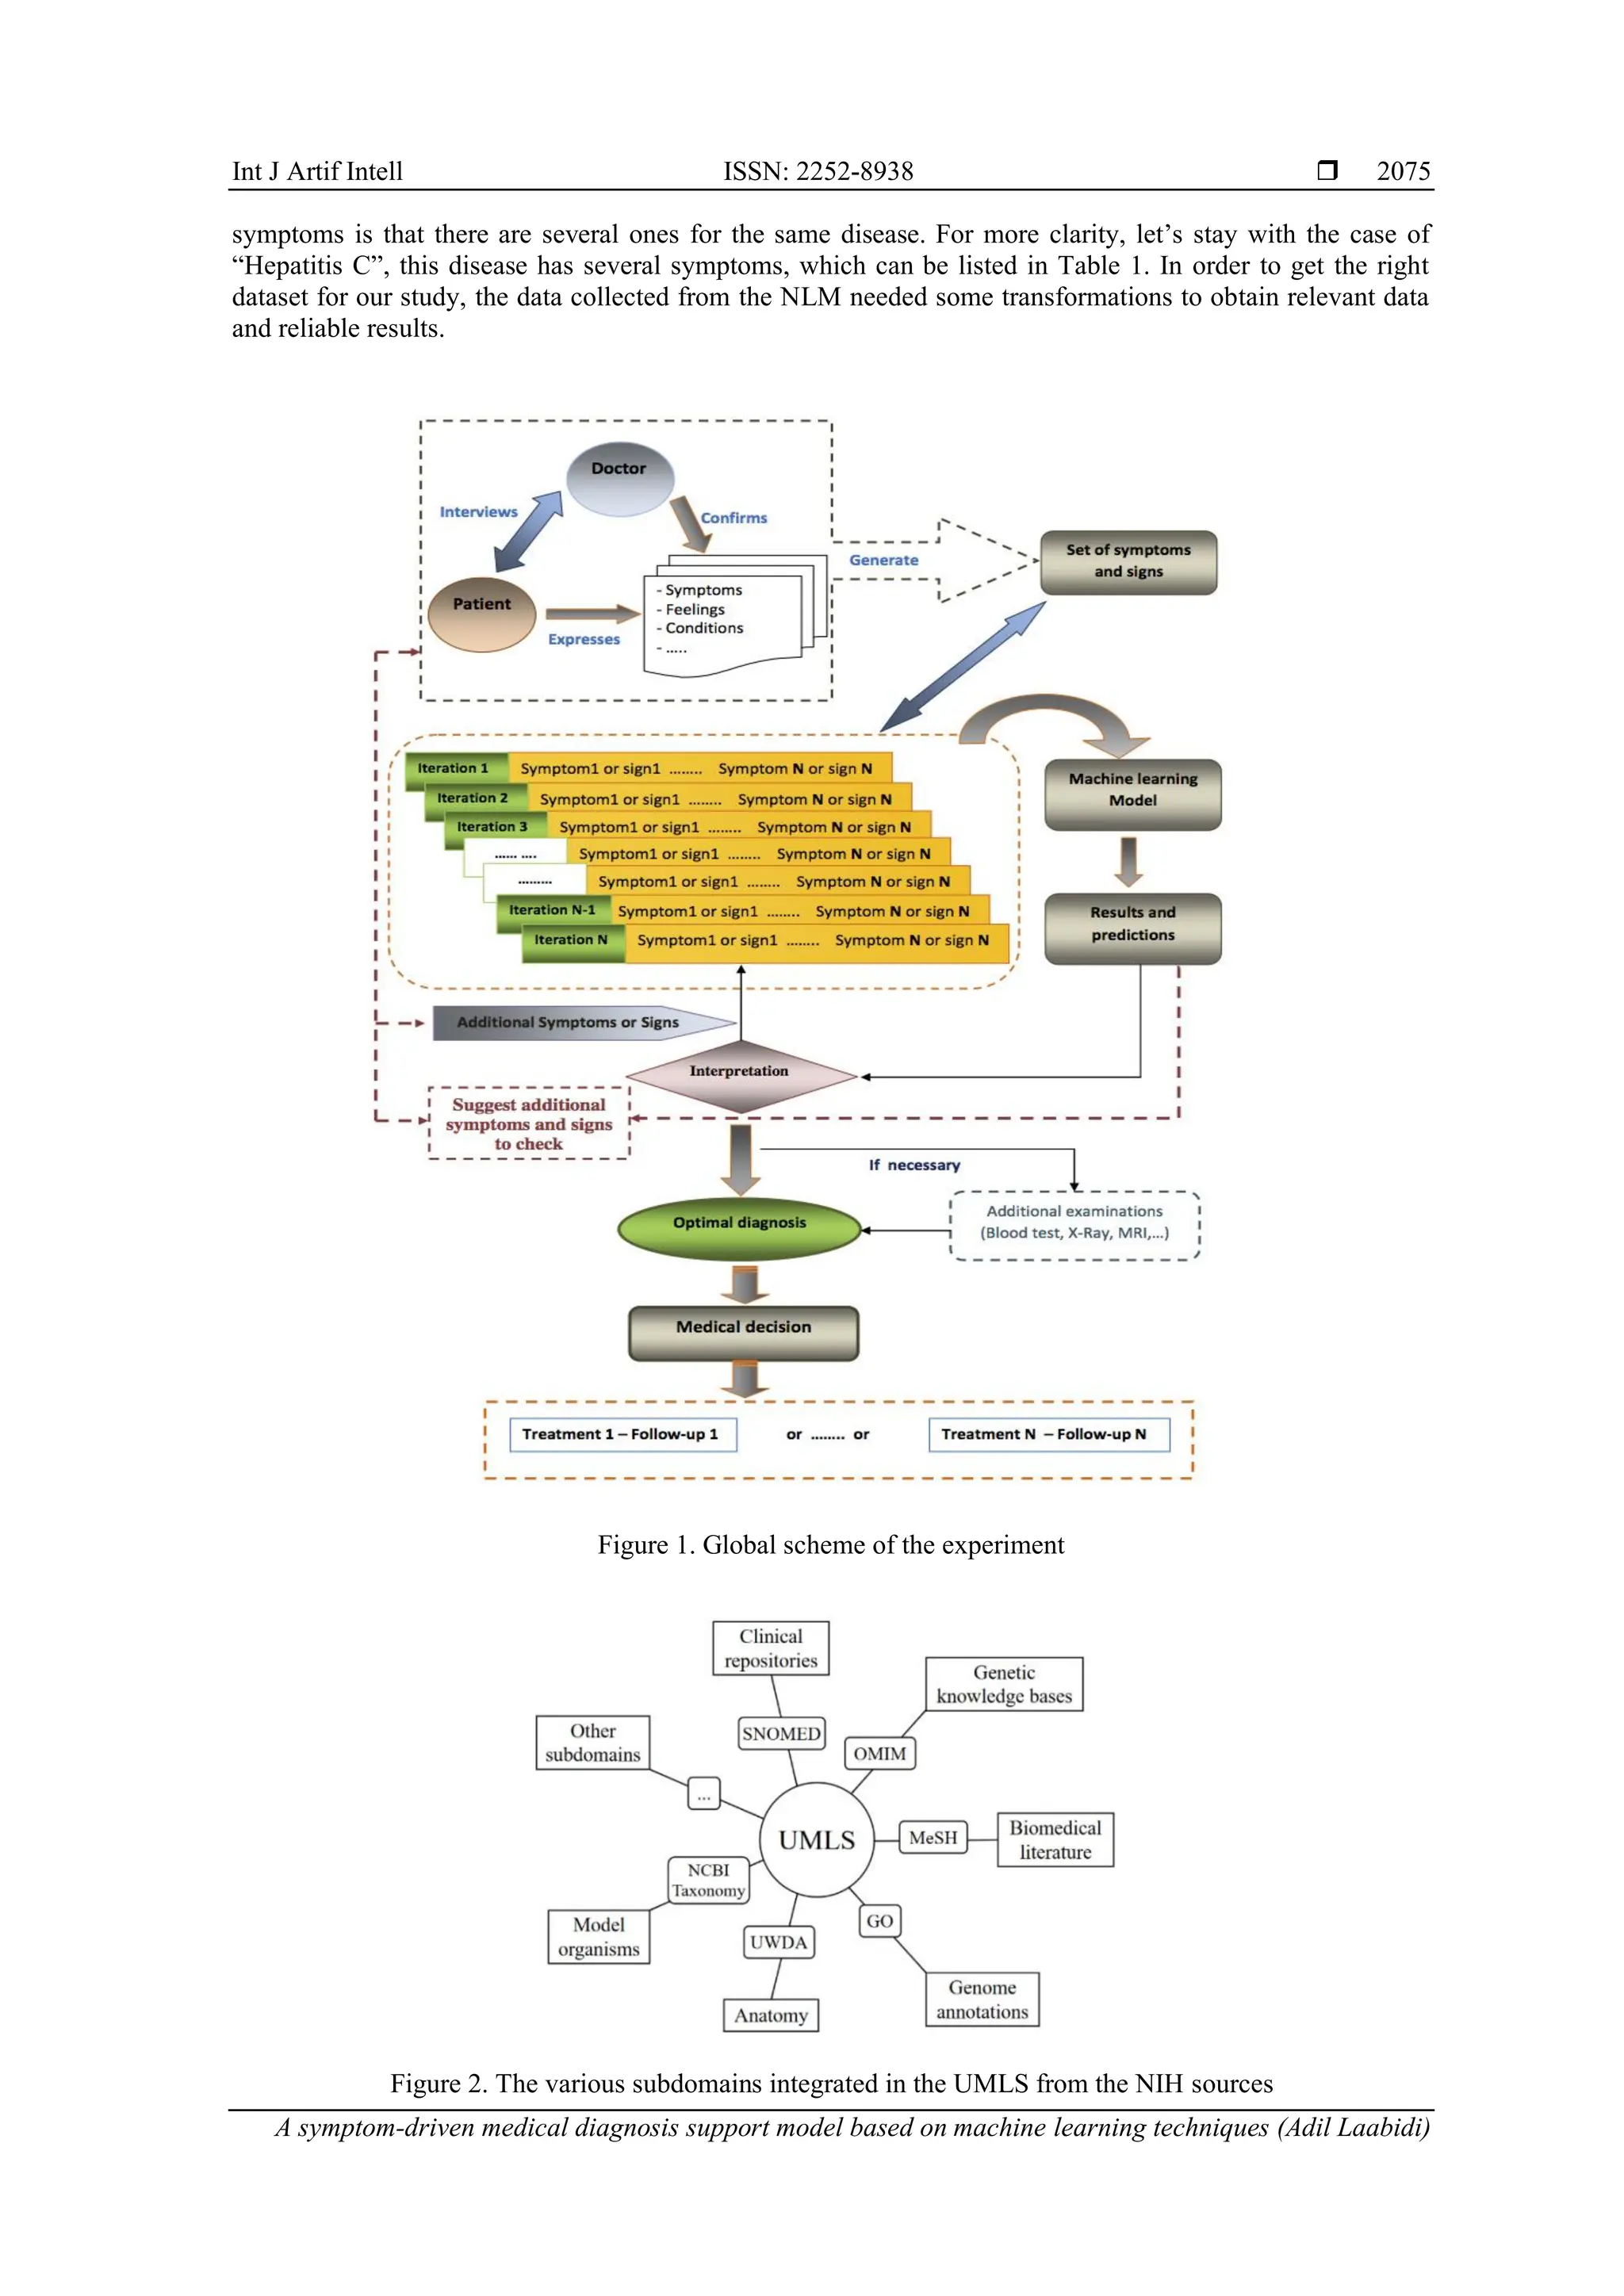
For our study, the main objective is to extract data from UMLS database in order to associate
diseases with their symptoms. Each disease is identified by a code “CUI” made up of an alphabetical
character, which in our case is the letter “C”, followed by a number of seven digits, giving a code in the
following format “Cxxxxxxx”. for example, if we take “Hepatitis C” as the disease, we’ll find the following
code “C0019196” associated with it. For symptoms, we use the same code format, i.e. the letter “C” followed
by seven digits, e.g. for “Headache” we have the following code “C0018681”, but the particularity of](https://image.slidesharecdn.com/3725832-250826093011-f15c83b1/75/A-symptom-driven-medical-diagnosis-support-model-based-on-machine-learning-techniques-3-2048.jpg)
![Int J Artif Intell ISSN: 2252-8938
A symptom-driven medical diagnosis support model based on machine learning techniques (Adil Laabidi)
2077
another, but all attributes contribute independently to maximize the probability [11]. We can use the naive
Bayes model without using any Bayesian methods. However, naive Bayes still one of the best classifiers for
dealing with medical real-world datasets and even complex ones [22].
𝑃(𝑋/𝑌) =
𝑃(𝑌 𝑋
⁄ )×𝑃(𝑋)
𝑃(𝑌)
(1)
Where P(X/Y) is the posterior probability, P(X) is the class prior probability, P(Y) is the predictor prior
probability, and P(Y/X) is the likelihood probability of predictor. Naive Bayes remains a simple,
easy-to-implement and efficient algorithm that can handle non-linear and complicated data. However,
according to some studies, there is a loss of accuracy due to the fact that this algorithm is based on the
assumption and class conditional independence [11].
Figure 4. Disease/symptoms dataset final form
3.5. Methodology
The following section presents the main objectives, data structure, and application of our disease
detection model within the context of enhanced diagnosis.
‒ Main objective: Our primary objective is not only to detect diseases associated with observed symptoms
but also to identify diseases that may be present at an early stage or those that are serious but share
symptoms with benign conditions. To achieve this, we employed an input/output model where symptoms
are used as input to generate an output representing the detected diseases. Our approach is unique in that
we do not solely identify the most probable disease; instead, we produce an output that includes various
potential diseases ranked in descending order of their probability scores.
‒ Data and strategy: To implement this work, our dataset is structured in a diseases/symptoms format, with
rows representing diseases and columns representing symptoms. Each disease is associated with its
known symptoms using binary logic: '1' indicates the presence of a symptom, while '0' indicates its
absence, as shown in Table 2. The dataset is then divided into training and testing subsets, with
approximately 70% of the data allocated for training and 30% for testing (test-size =0.3). This strategy
ensures that our model can be effectively trained and validated for accurate disease detection and
diagnosis.
‒ Application and diagnostic enhancement: Consider a patient presenting with various symptoms of
differing severity. We first catalog these symptoms and convert them into coded form for input into our
model. The model then generates an output list of potential diseases, each accompanied by its probability
of being present in the patient. An essential aspect of our approach is that for each detected disease, the
model suggests additional symptoms for the practitioner to verify. This provides the practitioner with
comprehensive information, facilitating a more thorough and accurate diagnosis and enabling the most
appropriate clinical decision-making.
3.6. Performance evaluation criteria
To evaluate the performance of a classifier, it is necessary to introduce two important parameters:
sensitivity and specificity. When sensitivity represents the classifier’s effectiveness in identifying positive
samples to the total actual positive instances, specificity defines the ratio of incorrectly predicted positive
instances to the total actual negative instances. On the other hand, the accuracy measures the overall
correctness of the model’s predictions. It considers both true positive and true negative instances. It can
therefore be calculated as follows:](https://image.slidesharecdn.com/3725832-250826093011-f15c83b1/75/A-symptom-driven-medical-diagnosis-support-model-based-on-machine-learning-techniques-6-2048.jpg)
![ ISSN: 2252-8938
Int J Artif Intell, Vol. 14, No. 3, June 2025: 2072-2082
2078
Sensitivity =
𝑇𝑃
𝑇𝑃+𝐹𝑁
× 100 (2)
Specificity =
𝑇𝑁
𝑇𝑁+𝐹𝑃
× 100 (3)
𝐴𝑐𝑐𝑢𝑟𝑎𝑐𝑦 =
𝑇𝑃+𝑇𝑁
𝑇𝑃+𝑇𝑁+𝐹𝑃+𝐹𝑁
(4)
In addition, the F-score or F1 score is used to measure the performance of our model. It is a metric
commonly used in machine learning and statistics to evaluate the performance of a classification model, and
looks for potential imbalance problems. It combines and provides a balance between precision and recall, and
is particularly useful when there is an uneven class distribution. F1 score is obtained as follows:
Precision =
𝑇𝑃
𝑇𝑃+𝐹𝑃
(5)
Recall =
𝑇𝑃
𝑇𝑃+𝐹𝑁
(6)
F-score is the harmonic mean of precision and recall.
F − score = 2 ×
𝑝𝑟𝑒𝑐𝑖𝑠𝑖𝑜𝑛 × 𝑟𝑒𝑐𝑎𝑙𝑙
𝑝𝑟𝑒𝑐𝑖𝑠𝑖𝑜𝑛+𝑟𝑒𝑐𝑎𝑙𝑙
(7)
Table 2. Predicted diseases sorted by descending probability score (Iteration 1)
Symptoms Predicted diseases Probability score Additional signs or symptoms to check
- Fever
- Cough
- Headache
- Fatigue
Acute bronchitise 3.165 'Rhinitis', 'Laryngitis', 'Pharyngitis', 'Myalgia'
Myocarditis 1.588 'Diarrhea', 'Exanthema', 'Chest Pain', 'Palpitations'
Pontiac Fever 1.576 'Common cold', 'Sore throat', 'Confusion', 'Diziness', 'Photophobia',
'Myalgia'
Scarlet Fever 1.552 'Deglutition disorders', 'Vomiting', 'Pharyngitis', 'Peritonsillar
abscess', 'Mucous membrane eruption', 'Strawberry tongue',
'Exanthema', 'Pallor', 'Nausea', 'Tonsillitis'
Legionnaires’
Disease
1.546 'Pleurisy', 'Rhinitis', 'Laryngitis', 'Confusion', 'Lethargy', 'Diarrhea',
'Dry cough', 'Chills', 'Myalgia', 'Chest pain', 'Pneumonia'
Bronchopneu-
monia
1.493 ‘Chest pain’, ‘Chills’, ‘Muscle aches’, ‘Myalgia’, ‘Dyspnea’,
‘Sweating’, ‘Tachypnea’
Chikenpox 0.803 'Exanthema', 'Pruritus'
Sarcoidosis 0.803 'Arthritis', 'Erythema nodosum'
Antrax disease 0.800 'Bronchopneumonia', 'Chills', 'Hypoxia'
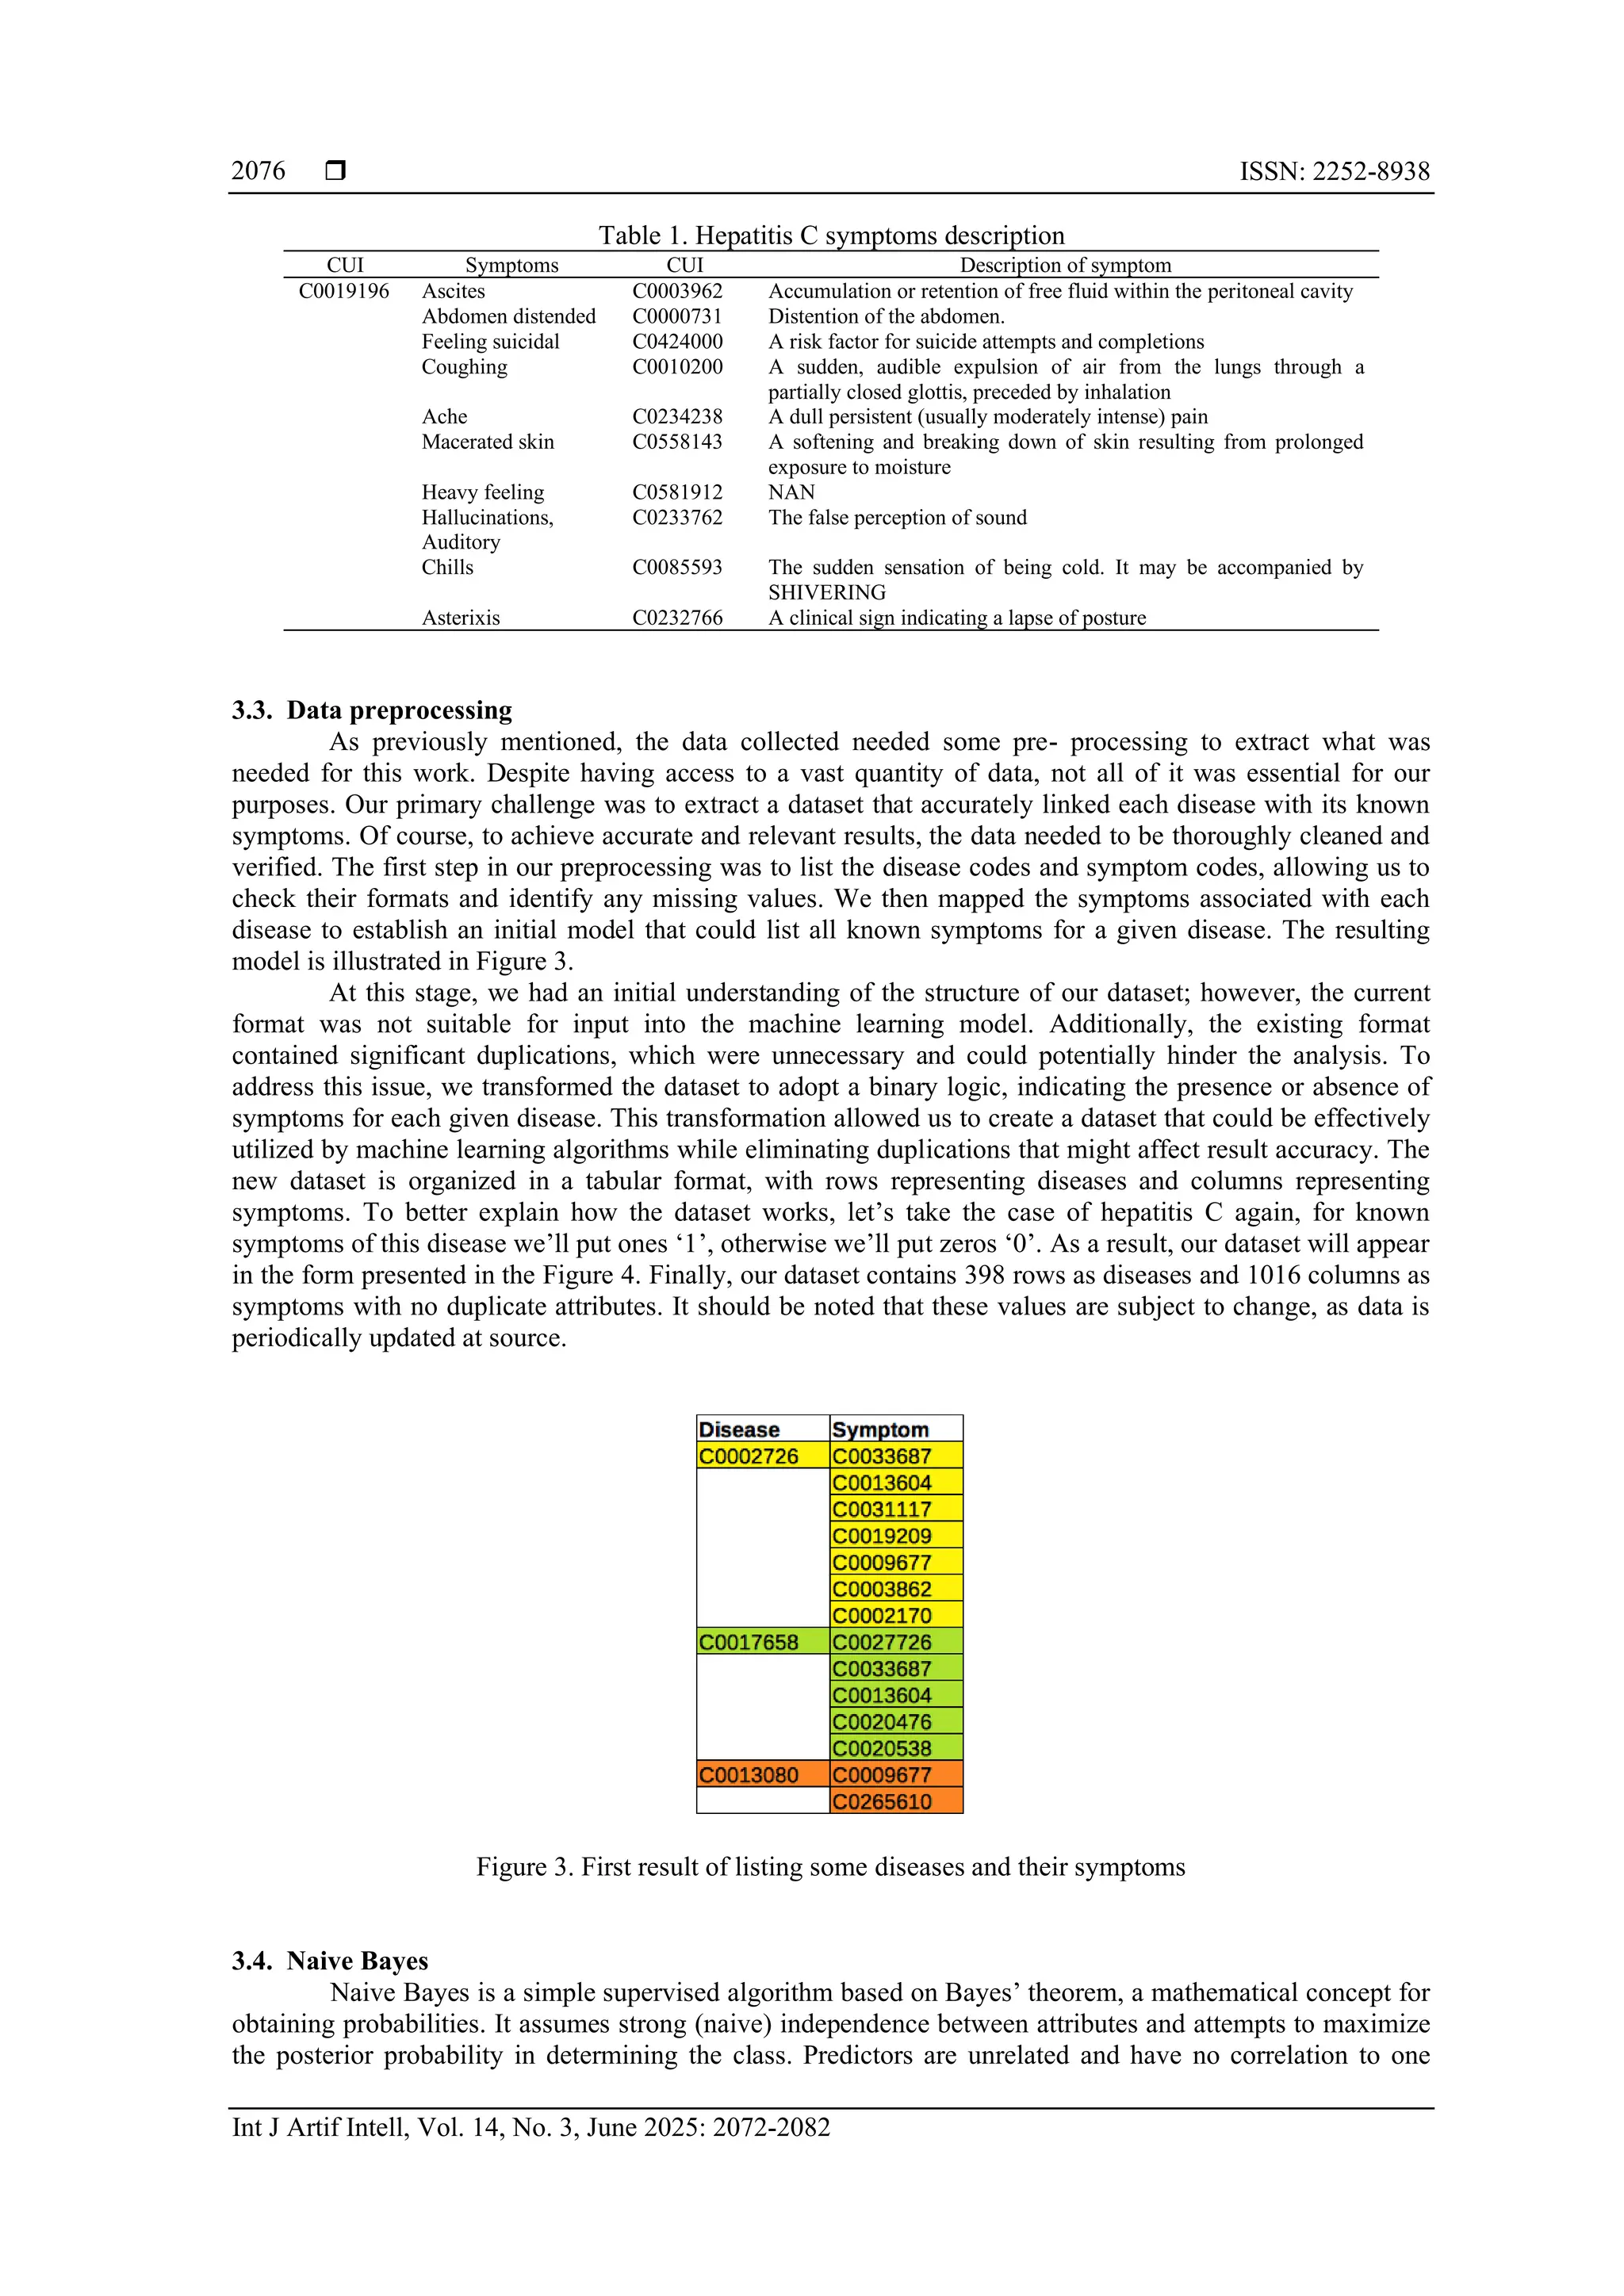
4. RESULTS AND DISCUSSION
Our study was designed to facilitate iterative deep diagnosis for practitioners. Initially, we utilized
only four symptoms for our classification, as depicted in Table 3, and subsequently used our model to predict
the diseases. As illustrated in Table 3, the output is a list of diseases ranked in descending order based on
their probability scores, starting with the disease having the highest probability score, followed by the next
highest.
At this initial stage, each predicted disease is not evaluated for its severity but rather for its
probability of being present. The practitioner can then choose to deepen the diagnosis by examining the
probability scores and analyzing each disease from a severity perspective. Table 3 indicates that the first
iteration revealed diseases of varying severity, and the model suggests additional signs and symptoms to
verify, thereby guiding the practitioner towards a more comprehensive diagnosis.
First, let's have a look to the results generated by our machine learning model in terms of probability
of occurrence and severity. In our first iteration, the most probable disease is ‘Acute bronchitis’ with a
probability of 3.165%. Acute bronchitis is not in itself a dangerous disease, but rather a self-limiting
condition that will disappear after a few days or week [23]. But this does not prevent the disease from having
complications in certain cases [23], and it is why the practitioner must ensure that it is indeed the disease in
question in order to anticipate complications. In second place, we find myocarditis with a probability of
1.588%, but the score is nowhere near that of acute bronchitis, since there is a difference of more than half,
which is enormous, especially when it concerns the medical field. In fact, the probability of developing
myocarditis is small, but still alarming, given that the disease is dangerous, especially if you know that it
remains asymptomatic in most cases, or unnoticeable since the symptoms are eclipsed by those of the](https://image.slidesharecdn.com/3725832-250826093011-f15c83b1/75/A-symptom-driven-medical-diagnosis-support-model-based-on-machine-learning-techniques-7-2048.jpg)
![Int J Artif Intell ISSN: 2252-8938
A symptom-driven medical diagnosis support model based on machine learning techniques (Adil Laabidi)
2079
inflammation that triggered the disease [24]. The presence of such a disease in an advanced stage
(Rank 2 in our case) will certainly lead the doctor to diagnose it more thoroughly, in order to prevent
complications such as heart failure and, in rare cases, cardiogenic shock [24]. For the next three ranks, the
probability of disease is relatively close to that of myocarditis, except that the severity of the three diseases
varies widely. Pontiac fever is ranked third with a score of 1.576%, this disease is considered benign and also
self-limiting and can be mistaken for simple flu [25]. In forth position scarlet fever is present with a score of
1.552%, it is a childhood illness currently considered as mild disease if correctly treated [26]. Like
myocarditis, Legionnaires’ disease (Legionella pneumonia) is present with a probability of 1.546%. This is
not a very high score, but it’s important for the doctor not to overlook this result, as the disease is very
dangerous, and as the prognosis of patients depends above all on two factors: “when the disease was
diagnosed” and “when treatment was instituted” [27]. It should be mentioned that the mortality rate among
senior citizens varies between 10 and 50% [28], which is very alarming, hence the need for early diagnosis.
The rest of our list includes bronchopneumonia with a score of 1.493%, a disease that is very common in
children and requires special attention to prevent complications. It’s a potentially fatal disease, as statistics
show that more than 920,000 children under the age of 5 died of pneumonia, mainly bronchopneumonia, in
2015 [29]. Then we have Chickenpox (varicella) and sarcoidosis with 0.803%, the two diseases have the
same probability but not severity. Chickenpox is usually considered as a childhood mild disease [30],
whereas sarcoidosis is a chronic disease that is often asymptomatic at a certain level but requires follow-up
and treatment by drug therapy if symptoms appear [31]. For patients in an advanced stage of the disease who
are untreated, themortality rate is about 5% [31]. The last case in our ranking is anthrax with 0.8%, it is a
notifiable infectious disease because it is very dangerous and requires a specific protocol [32]. Statistics
report a mortality rate of 50% even with treatment [32].
The initial results from our model indicate that while the symptoms observed in the patient are
familiar and common across all age groups, it is crucial to remain vigilant for serious pathologies that may be
concealed behind these seemingly benign symptoms. For the purposes of our analysis, we focused on the first
eight predicted results, which provided sufficient data to evaluate the model's performance. However,
practitioners have the option to review all results in descending order to gain a comprehensive understanding
of the case. Our findings reveal that among the eight predicted results, approximately four were fatal and
dangerous diseases, underscoring the importance of early diagnosis and urgent treatment. This demonstrates
that our model is an effective tool for practitioners to enhance their diagnostic process and identify potential
hidden pathologies promptly, thereby saving valuable time. For instance, early detection of anthrax can save
many lives, including the patients. Similarly, timely identification of Legionnaire’s disease can significantly
improve patient outcomes.
Table 3. Predicted diseases sorted by descending probability score (Iteration 2)
Symptoms Predicted diseases Probability score Additional signs or symptoms to check
- Fever
- Cough
- Headache
- Fatigue
- Rhinitis
Acute bronchitis 6.064 'Laryngitis', 'Pharyngitis', 'Myalgia'
Legionnaires’
Disease
2.940 'Pleurisy', 'Laryngitis', 'Confusion', 'Lethargy', 'Diarrhea', 'Dry
cough', 'Chills', 'Myalgia', 'Chest pain', 'Pneumonia'
Myocarditis 1.523 'Diarrhea', 'Exanthema', 'Chest pain', 'Palpitations'
Pontiac Fever 1.508 'Common cold', 'Sore throat', 'Confusion', 'Diziness',
'Photophobia', 'Myalgia',
Scarlet Fever 1.479 'Deglutition disorders', 'Vomiting', 'Pharyngitis', 'Peritonsillar
abscess', 'Mucous membrane eruption', 'Strawberry tongue',
'Exanthema', 'Pallor', 'Nausea', 'Tonsillitis'
Bronchopneu-
monia
0.780 ‘Chest pain’, ‘chills’, ‘Muscle aches’, ‘Myalgia’, ‘Dyspnea’,
‘Sweating’, ‘Tachypnea’
Chikenpox 0.772 'Exanthema', 'Pruritus'
Sarcoidosis 0.772 'Arthritis', 'Erythema nodosum',
Antrax disease 0.769 'Bronchopneumonia', 'Chills', 'hypoxia'
During our experiment, we conducted multiple iterations of our model to observe its behavior under
varying parameters. The model demonstrated high sensitivity to modifications in symptoms, as evidenced by
the results of the second iteration presented in Table 4. It is important to note that the symptoms selected for
this iteration were chosen based on the disease with the highest initial probability, aiming to refine its
diagnosis further. For practitioners, parameter selection will be more precise, informed by patient observation
and case-specific interviews. Practitioners can iteratively adjust parameters and continue the diagnostic
process until the most optimal result is achieved. This iterative approach can be supplemented with additional
diagnostic methods, such as blood tests or medical imaging. In the second iteration, we observed that the
probability of acute bronchitis increased significantly to 6.064%, which is expected given that the additional](https://image.slidesharecdn.com/3725832-250826093011-f15c83b1/75/A-symptom-driven-medical-diagnosis-support-model-based-on-machine-learning-techniques-8-2048.jpg)
![Int J Artif Intell ISSN: 2252-8938
A symptom-driven medical diagnosis support model based on machine learning techniques (Adil Laabidi)
2081
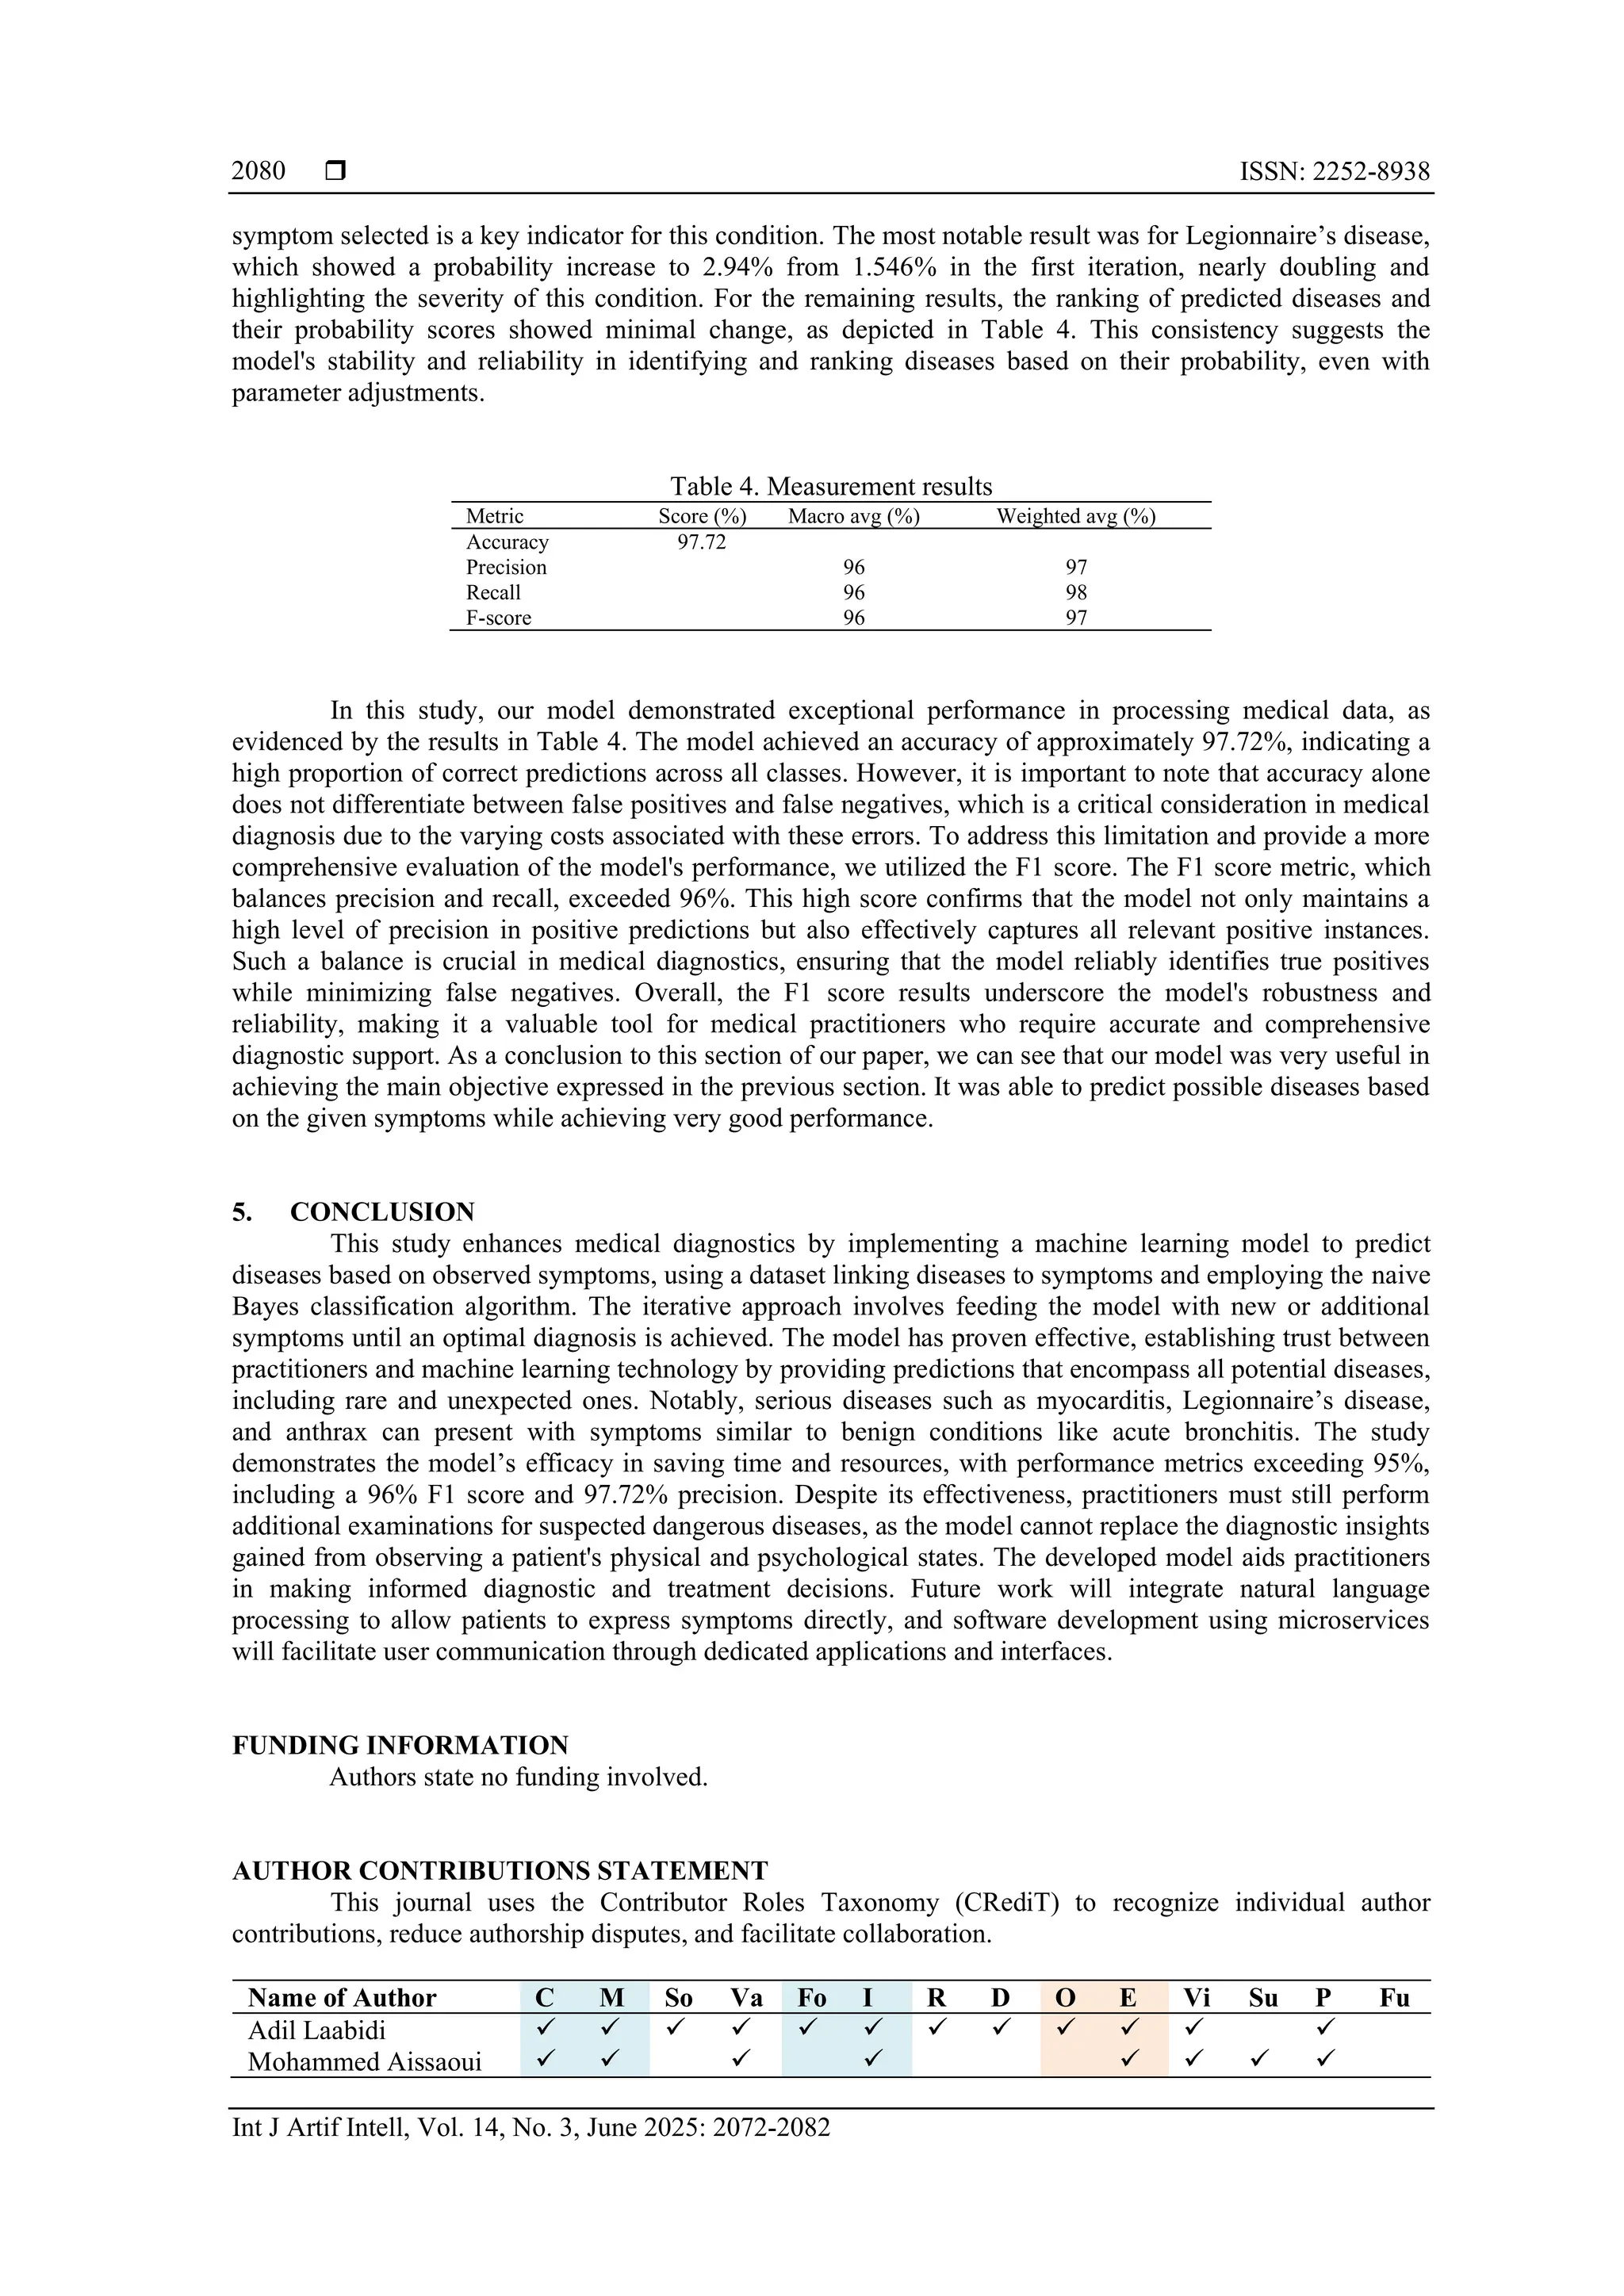
C : Conceptualization
M : Methodology
So : Software
Va : Validation
Fo : Formal analysis
I : Investigation
R : Resources
D : Data Curation
O : Writing - Original Draft
E : Writing - Review & Editing
Vi : Visualization
Su : Supervision
P : Project administration
Fu : Funding acquisition
CONFLICT OF INTEREST STATEMENT
Authors state no conflict of interest.
DATA AVAILABILITY
The data supporting the results of this study are available from the U.S. National Library of
Medicine. Their access is subject to restrictions as they were used under license for this study. Data can be
obtained from the authors with permission from the National Institutes of Health (NIH) or directly from the
NIH after obtaining a license.
REFERENCES
[1] A. Probandari, L. Lindholm, H. Stenlund, A. Utarini, and A. K. Hurtig, “Missed opportunity for standardized diagnosis and
treatment among adult tuberculosis patients in hospitals involved in public-private mix for directly observed treatment short-
course strategy in indonesia: A cross-sectional study,” BMC Health Services Research, vol. 10, May. 2010, doi: 10.1186/1472-
6963-10-113.
[2] M. Puppala et al., “METEOR: An enterprise health informatics environment to support evidence-based medicine,” IEEE
Transactions on Biomedical Engineering, vol. 62, no. 12, pp. 2776–2786, 2015, doi: 10.1109/TBME.2015.2450181.
[3] M. N. Alolayyan, M. S. Alyahya, A. H. Alalawin, A. Shoukat, and F. T. Nusairat, “Health information technology and hospital
performance the role of health information quality in teaching hospitals,” Heliyon, vol. 6, no. 10, 2020,
doi: 10.1016/j.heliyon.2020.e05040.
[4] H. M. Krumholz, “Big data and new knowledge in medicine: The thinking, training, and tools needed for a learning health
system,” Health Affairs, vol. 33, no. 7, pp. 1163–1170, 2014, doi: 10.1377/hlthaff.2014.0053.
[5] G. S. Ginsburg and K. A. Phillips, “Precision medicine: from science to value,” Health Affairs, vol. 37, no. 5, pp. 694–701, 2018,
doi: 10.1377/hlthaff.2017.1624.
[6] T. B. Murdoch and A. S. Detsky, “The inevitable application of big data to health care,” JAMA: The Journal of the American
Medical Association, vol. 309, no. 13, pp. 1351–1352, 2013.
[7] J. He, S. L. Baxter, J. Xu, J. Xu, X. Zhou, and K. Zhang, “The practical implementation of artificial intelligence technologies in
medicine,” Nature Medicine, vol. 25, no. 1, pp. 30–36, 2019, doi: 10.1038/s41591-018-0307-0.
[8] F. Jiang et al., “Artificial intelligence in healthcare: Past, present and future,” Stroke and Vascular Neurology, vol. 2, no. 4,
pp. 230–243, 2017, doi: 10.1136/svn-2017-000101.
[9] NLM, “UMLS metathesaurus browser,” U.S. National Library of Medicine. 2022. [Online]. Available:
https://uts.nlm.nih.gov/uts/umls
[10] A. Laabidi and M. Aissaoui, “Performance analysis of machine learning classifiers for predicting diabetes and prostate cancer,” in
2020 1st International Conference on Innovative Research in Applied Science, Engineering and Technology (IRASET), 2020,
pp. 1–6. doi: 10.1109/IRASET48871.2020.9092255.
[11] D. Shah, S. Patel, and S. K. Bharti, “Heart disease prediction using machine learning techniques,” SN Computer Science, vol. 1,
2020, doi: 10.1007/s42979-020-00365-y.
[12] N. Kosarkar, P. Basuri, P. Karamore, P. Gawali, P. Badole, and P. Jumle, “Disease prediction using machine learning,” in 2022
10th International Conference on Emerging Trends in Engineering and Technology - Signal and Information Processing
(ICETET-SIP-22, pp. 1–4), 2022, doi: 10.1109/ICETET-SIP-2254415.2022.9791739.
[13] A. H. Chen, S. Y. Huang, P. S. Hong, C. H. Cheng, and E. J. Lin, “HDPS: Heart disease prediction system,” Computing in
Cardiology, vol. 38, pp. 557–560, 2011.
[14] B. Qian, X. Wang, N. Cao, H. Li, and Y. G. Jiang, “A relative similarity based method for interactive patient risk prediction,”
Data Mining and Knowledge Discovery, vol. 29, no. 4, pp. 1070–1093, 2015, doi: 10.1007/s10618-014-0379-5.
[15] M. Chen, Y. Hao, K. Hwang, L. Wang, and L. Wang, “Disease prediction by machine learning over big data from healthcare
communities,” IEEE Access, vol. 5, pp. 8869–8879, 2017, doi: 10.1109/ACCESS.2017.2694446.
[16] B. V. Ginneken, C. M. S. -Prokop, and M. Prokop, “Computer-aided diagnosis: How to move from the laboratory to the clinic,”
Radiology, vol. 261, no. 3, pp. 719–732, 2011, doi: 10.1148/radiol.11091710.
[17] J. Z. Cheng et al., “Computer-aided US diagnosis of breast lesions by using cell-based contour grouping,” Radiology, vol. 255,
no. 3, pp. 746–754, 2010, doi: 10.1148/radiol.09090001.
[18] M. Gadekar, S. Jamadar, P. Pachpute, S. Shinde, and S. Bhosale, “Symptoms based disease prediction,” International Research
Journal of Modernization in Engineering Technology and Science, vol. 4, no. 5, pp. 3557–3563, 2022.
[19] NLM, “About the national library of medicine,” U.S. National Library of Medicine. 2023. [Online]. Available:
https://www.nlm.nih.gov/about/index.html
[20] UMLS, “Unified medical language system (UMLS),” U.S. National Library of Medicine. 2024. [Online]. Available:
https://www.nlm.nih.gov/research/umls/index.html
[21] O. Bodenreider, “The unified medical language system (UMLS): integrating biomedical terminology,” Nucleic Acids Research,
vol. 32, pp. D267–D270, 2004.
[22] M. Fatima and M. Pasha, “Survey of machine learning algorithms for disease diagnostic,” Journal of Intelligent Learning Systems
and Applications, vol. 9, no. 1, pp. 1–16, 2017, doi: 10.4236/jilsa.2017.91001.
[23] A. Singh, A. Avula, and E. Zahn, Acute bronchitis, Florida, United States: StatPearls, 2024.](https://image.slidesharecdn.com/3725832-250826093011-f15c83b1/75/A-symptom-driven-medical-diagnosis-support-model-based-on-machine-learning-techniques-10-2048.jpg)
![ ISSN: 2252-8938
Int J Artif Intell, Vol. 14, No. 3, June 2025: 2072-2082
2082
[24] NHLBI, “Heart inflammation: Myocarditis,” The National Heart, Lung, and Blood Institute. 2023. [Online]. Available:
https://www.nhlbi.nih.gov/health/heart-inflammation/myocarditis
[25] T. J. Marrie and P. S. Hoffman, “Legionellosis,” in Tropical Infectious Diseases: Principles, Pathogens and Practice,
Amsterdam, Netherlands: Elsevier, pp. 215–218, 2011, doi: 10.1016/B978-0-7020-3935-5.00032-X.
[26] S. Pardo and T. B. Perera, Scarlet fever. Florida, United States: StatPearls, 2023.
[27] M. F. Brady, A. O. Awosika, A. D. Nguyen, and V. Sundareshan, Legionnaires disease. Florida, United States: StatPearls, 2023.
[28] N. Miyashita et al., “Clinical presentation of legionella pneumonia: Evaluation of clinical scoring systems and therapeutic
efficacy,” Journal of Infection and Chemotherapy, vol. 23, no. 11, pp. 727–732, 2017, doi: 10.1016/j.jiac.2017.09.001.
[29] S. L. Zec, K. Selmanovic, N. L. Andrijic, A. Kadic, L. Zecevic, and L. Zunic, “Evaluation of drug treatment of
bronchopneumonia at the pediatric clinic in sarajevo,” Medical Archives, vol. 70, no. 3, pp. 177–181, 2016,
doi: 10.5455/medarh.2016.70.177-181.
[30] Canadian Paediatric Society, “Facts about chickenpox,” Paediatrics & Child Health, vol. 10, no. 7, pp. 413–414, 2005,
doi: 10.1093/pch/10.7.413.
[31] S. R. A. Bokhari, H. Zulfiqar, and A. Mansur, Sarcoidosis. Florida, United States: StatPearls, 2023.
[32] K. A. Simonsen and K. Chatterjee, Anthrax. Florida, United States: StatPearls, 2023.
BIOGRAPHIES OF AUTHORS
Adil Laabidi graduated in software engineering from the National School of
Applied Sciences, Oujda, Morocco in 2005. He holds a "State doctorate in sciences" from
Mohammed Premier University, Oujda, Morocco in 2024. He works as an engineer at the
Ministry of Health in Morocco. His main area of research includes cloud computing and
machine learning for medical predictions. In general, his areas of interest are cloud computing,
big data, and machine learning. He can be contacted at email: adil.laabidi@gmail.com.
Mohammed Aissaoui holds a "State doctorate in sciences" from Mohammed
Premier University, Oujda, Morocco in 2001. Currently he is a Professor at the National
School of Applied Sciences of Oujda. He also serves as the coordinator of the data science and
cloud computing engineering degree. His main area of research includes cloud computing and
machine learning for medical predictions, hospital data management involving connected
object systems coupled with a cloud computing technological environment, and finally
hospital information systems based on cloud computing technologies. He can be contacted at
email: m.aissaoui@ump.ac.ma.](https://image.slidesharecdn.com/3725832-250826093011-f15c83b1/75/A-symptom-driven-medical-diagnosis-support-model-based-on-machine-learning-techniques-11-2048.jpg)