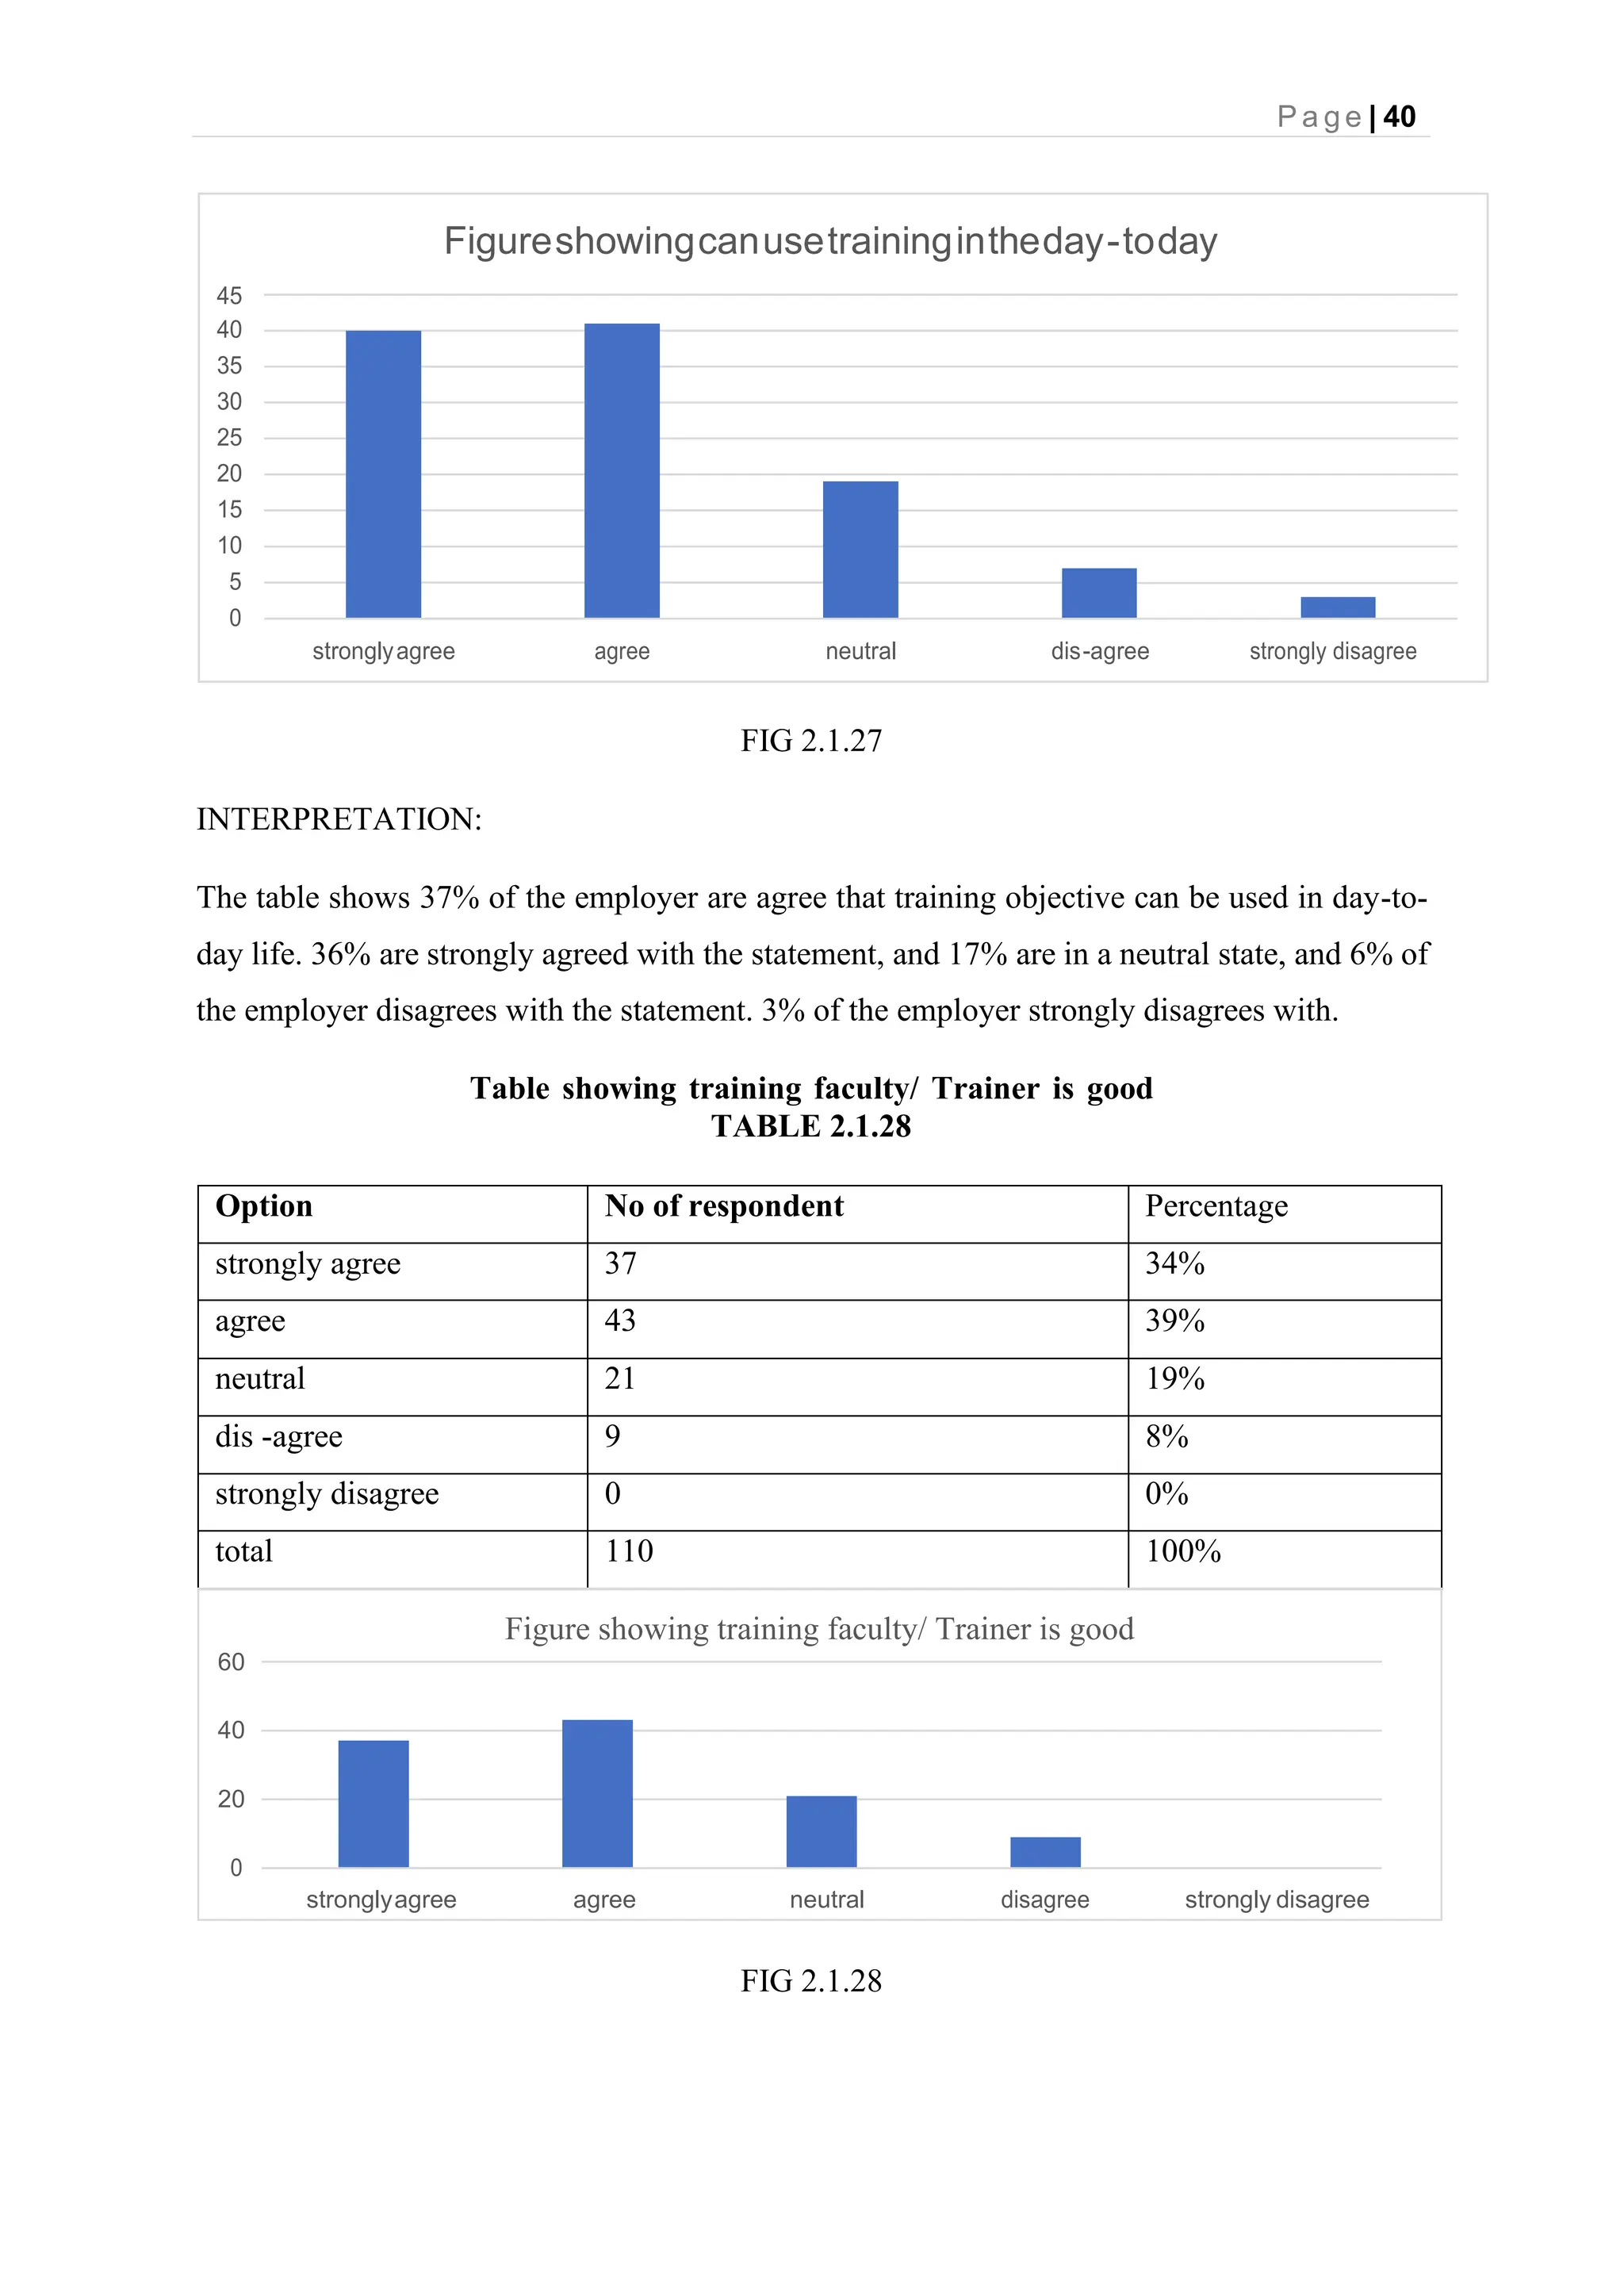
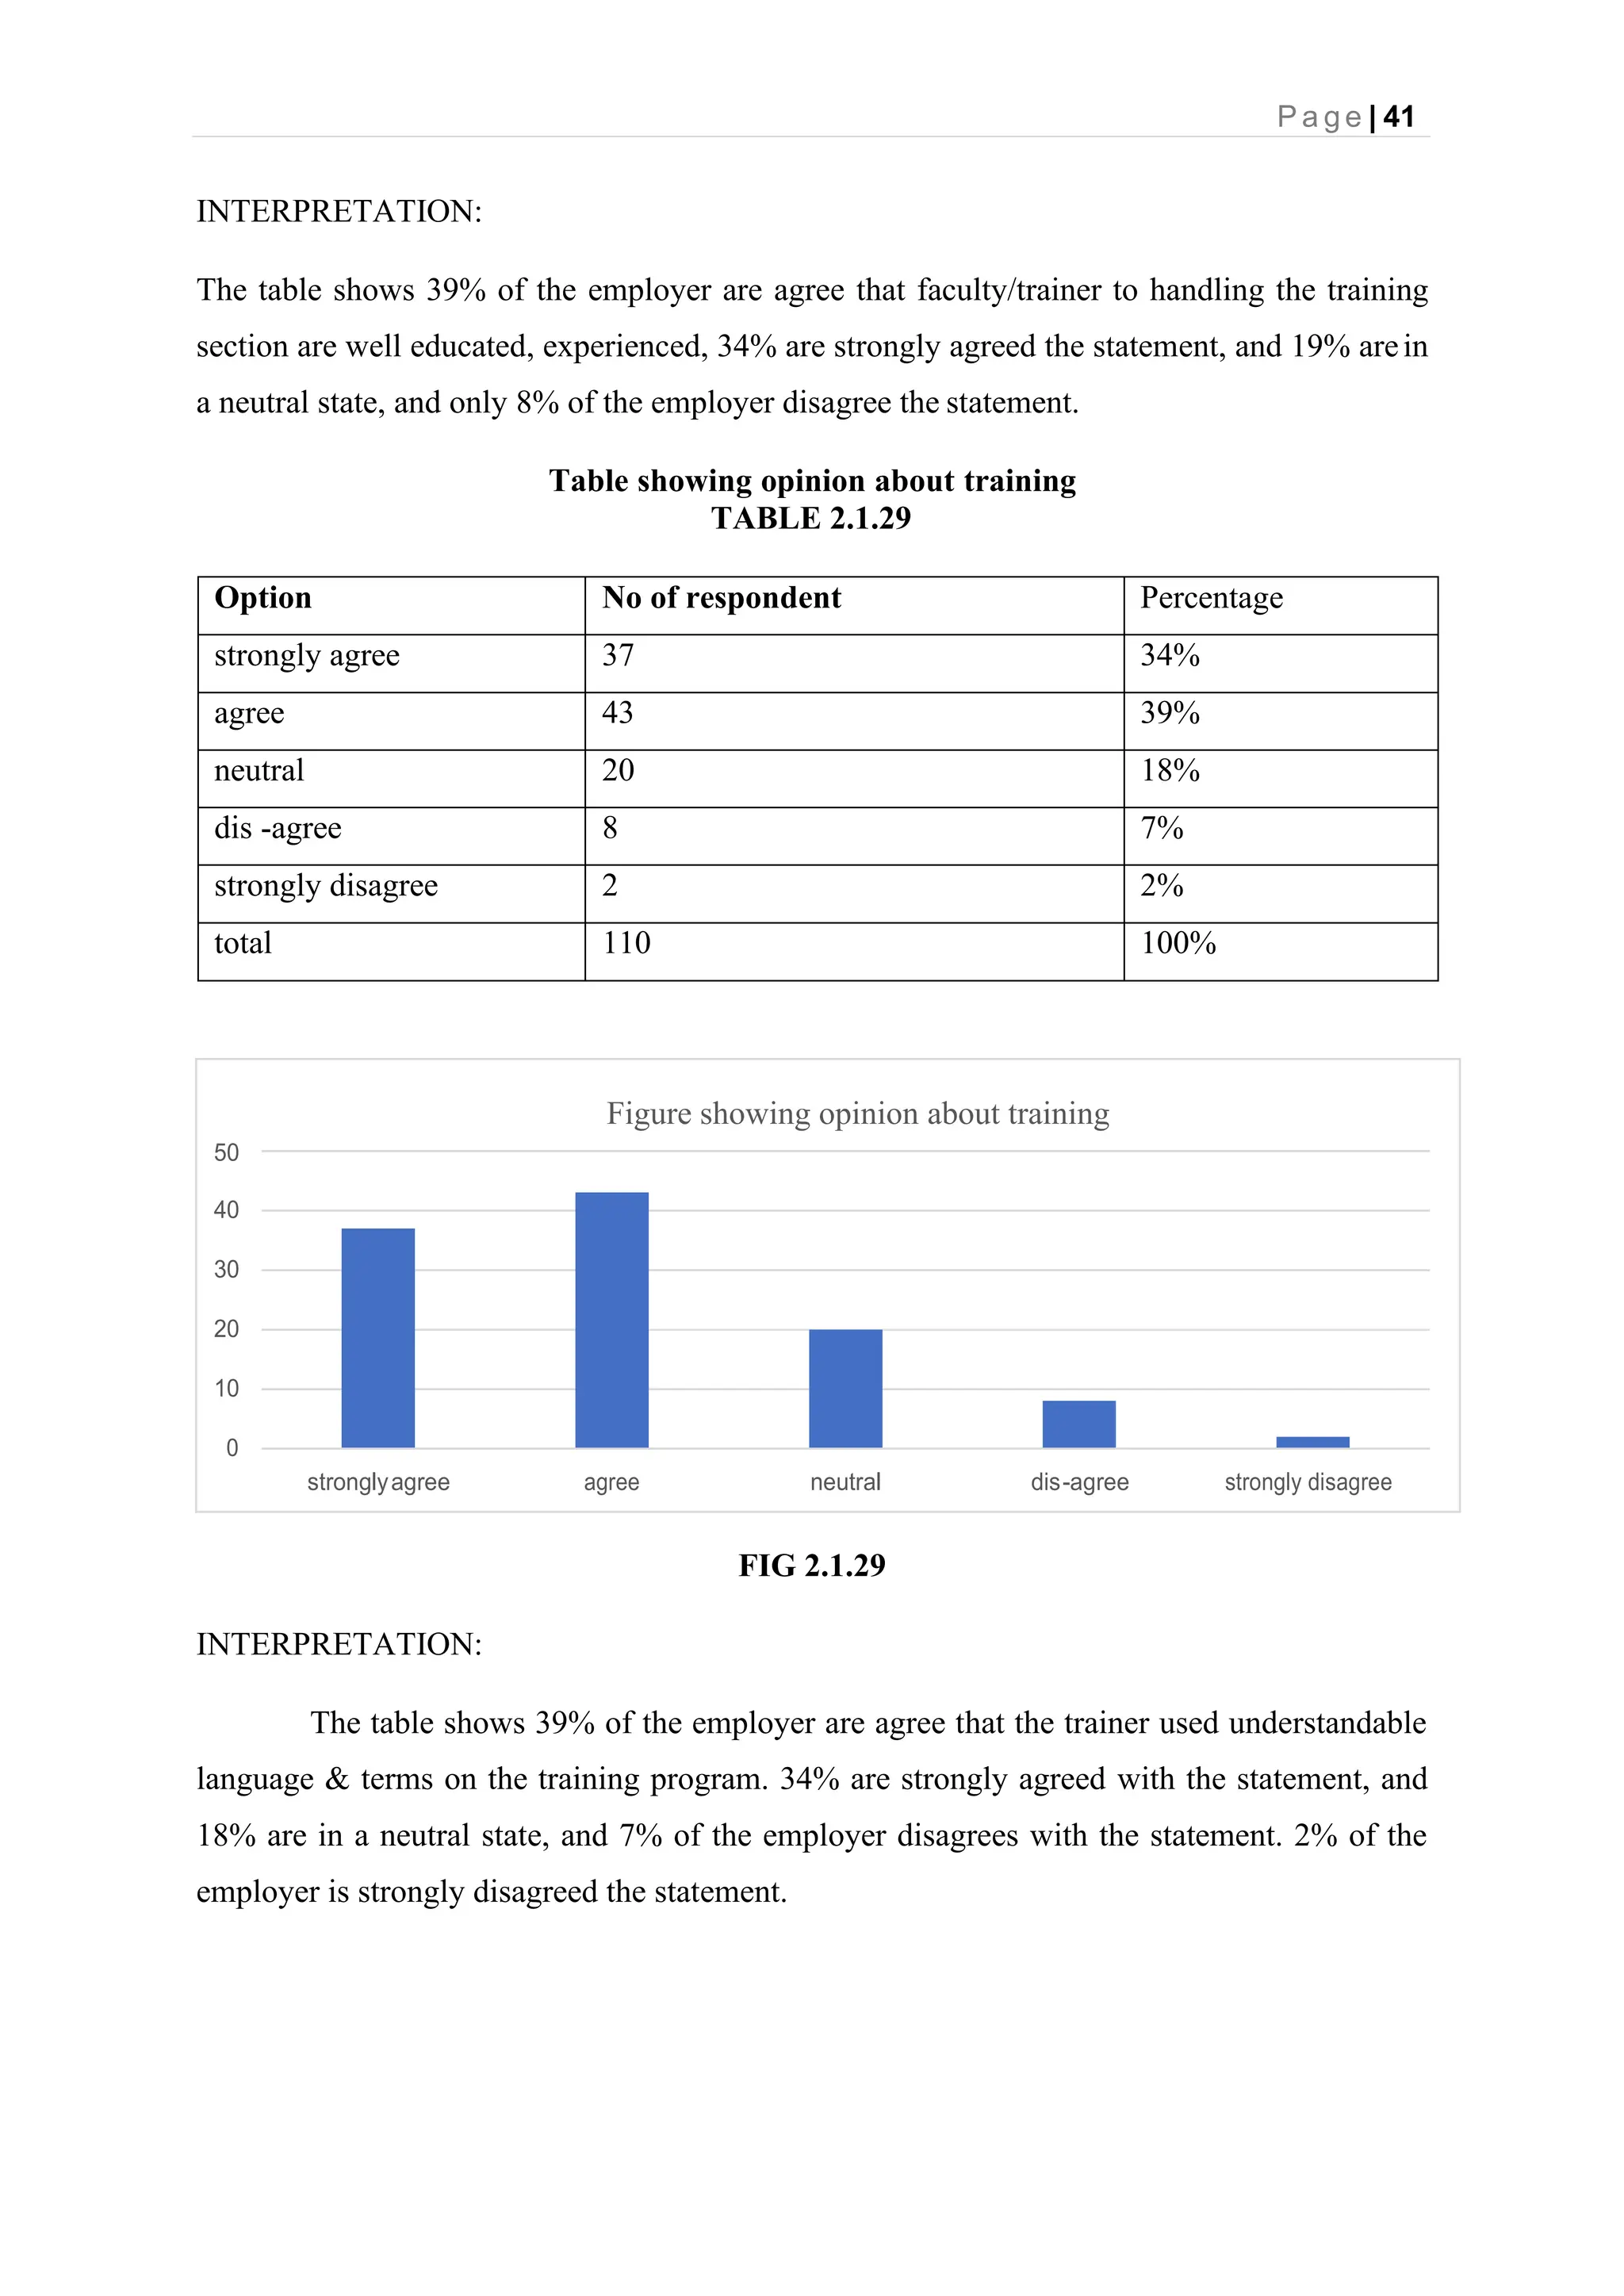
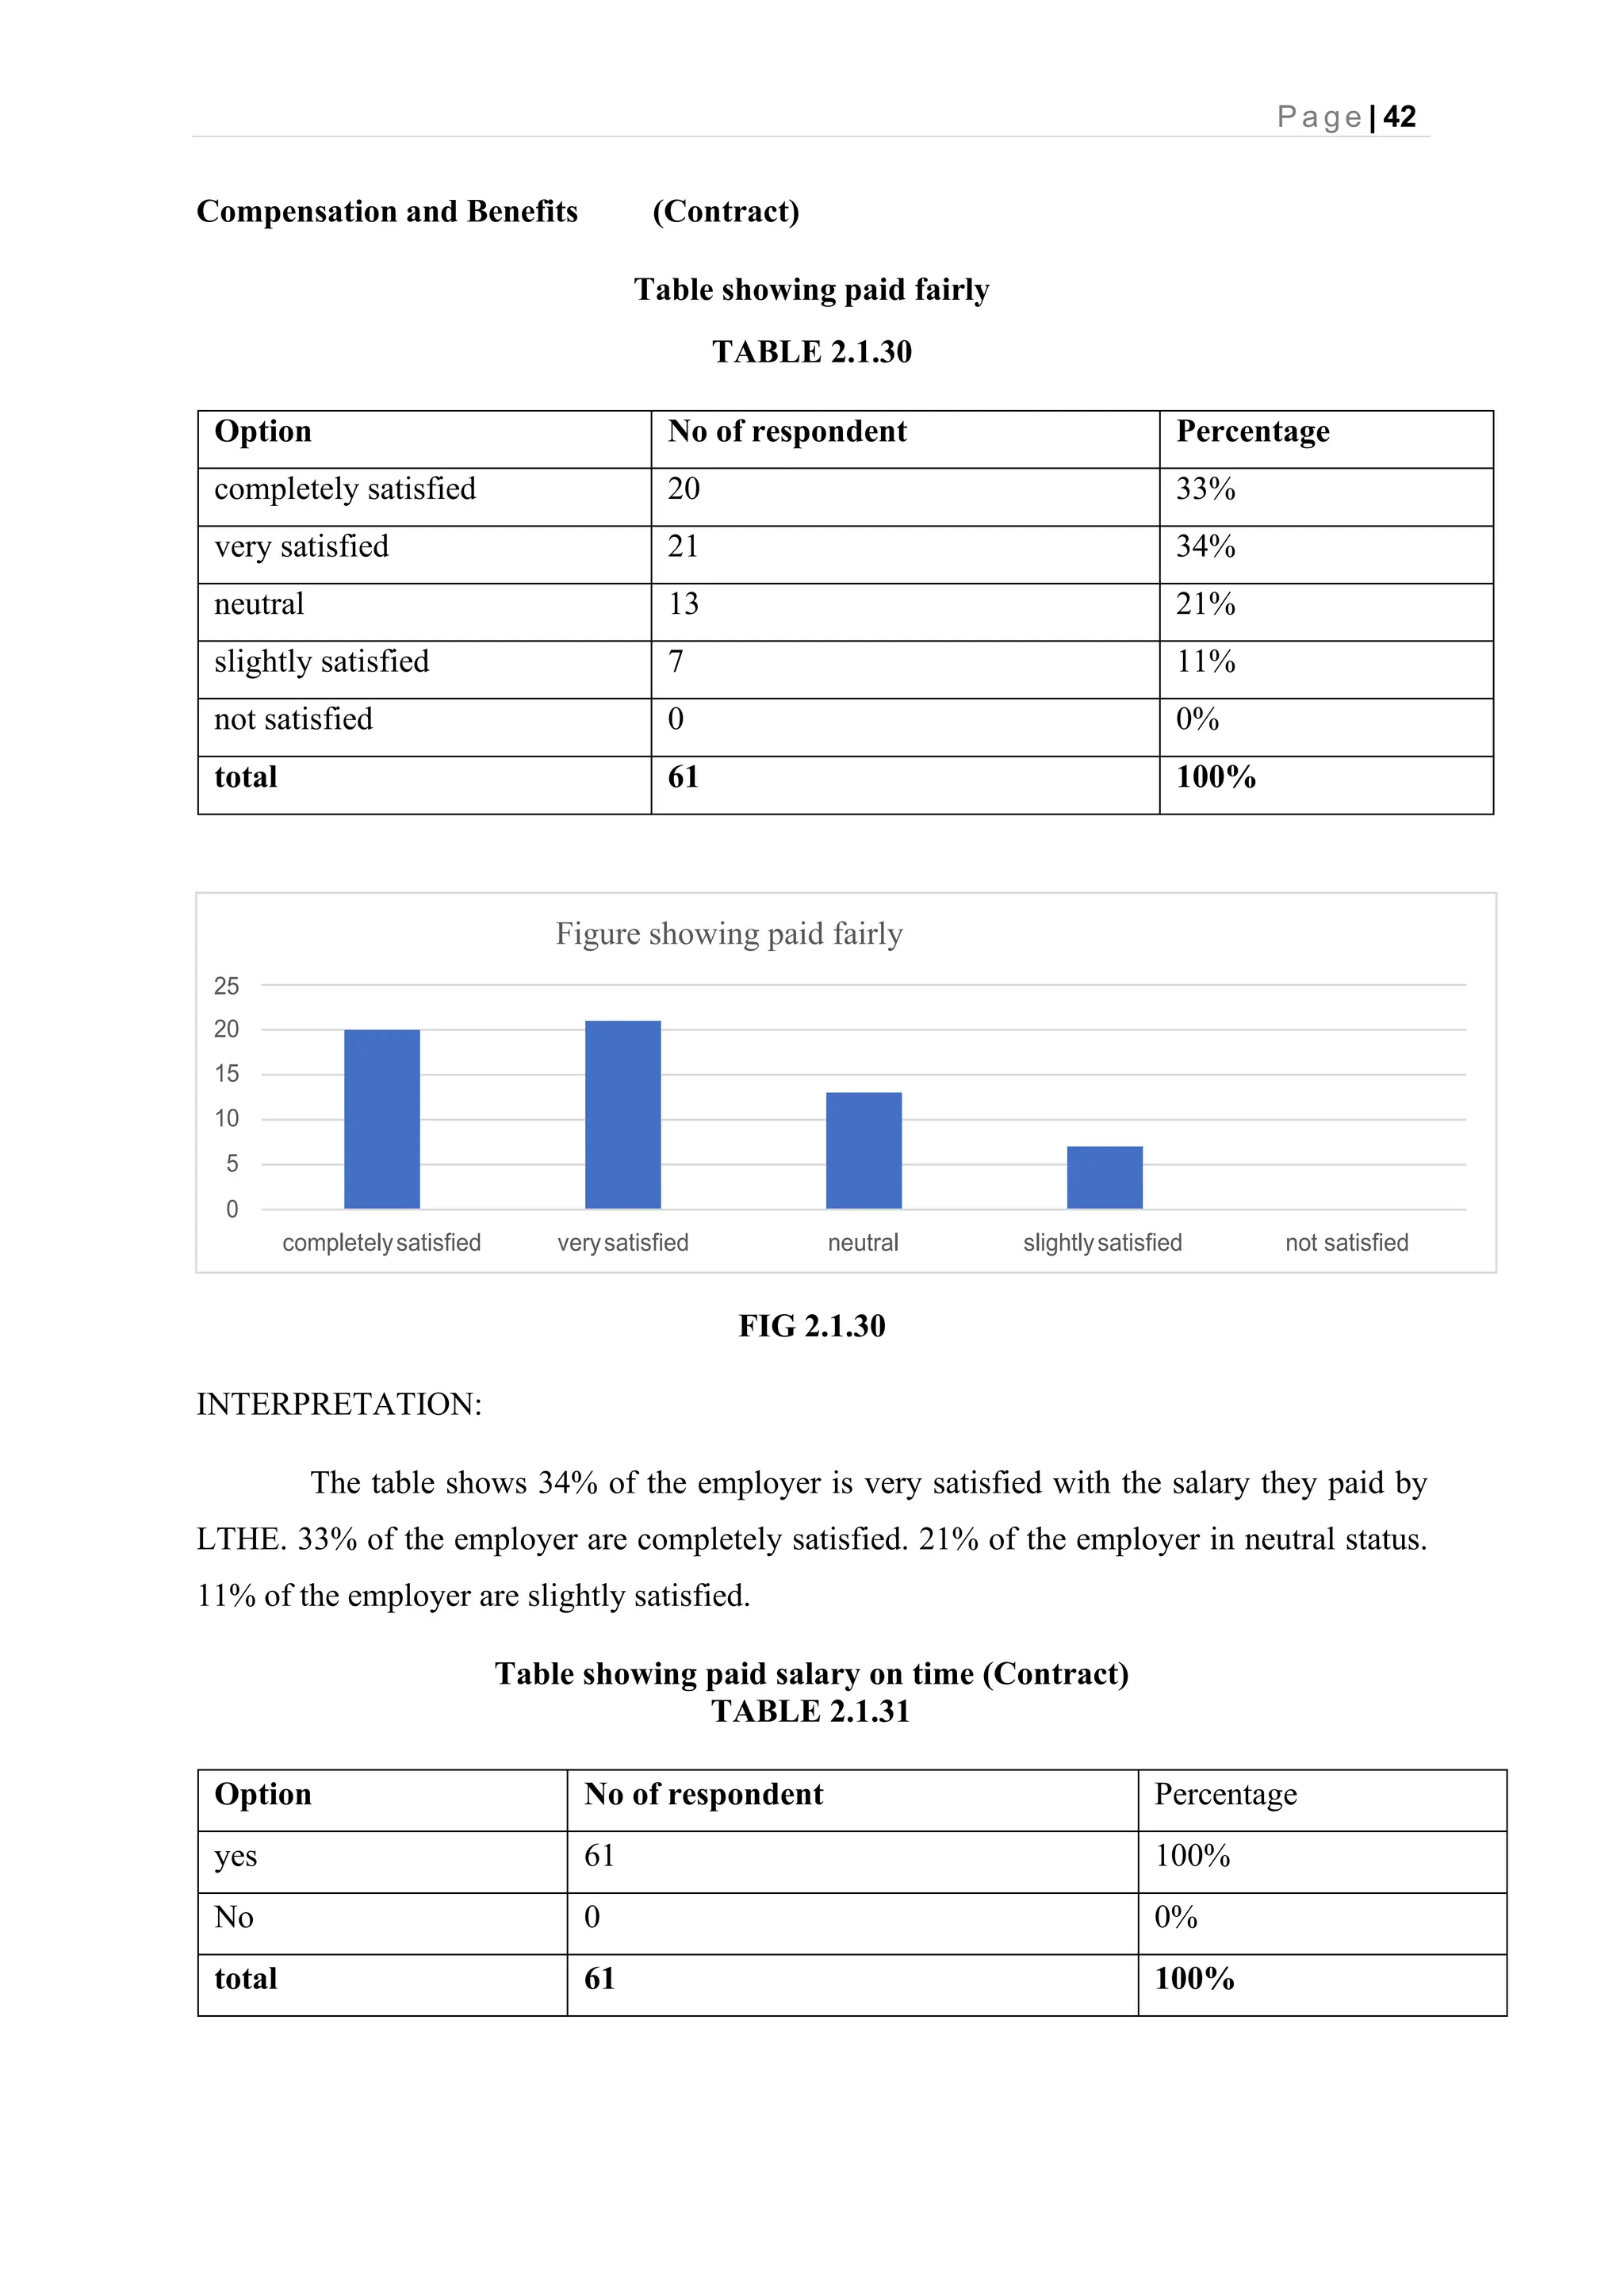
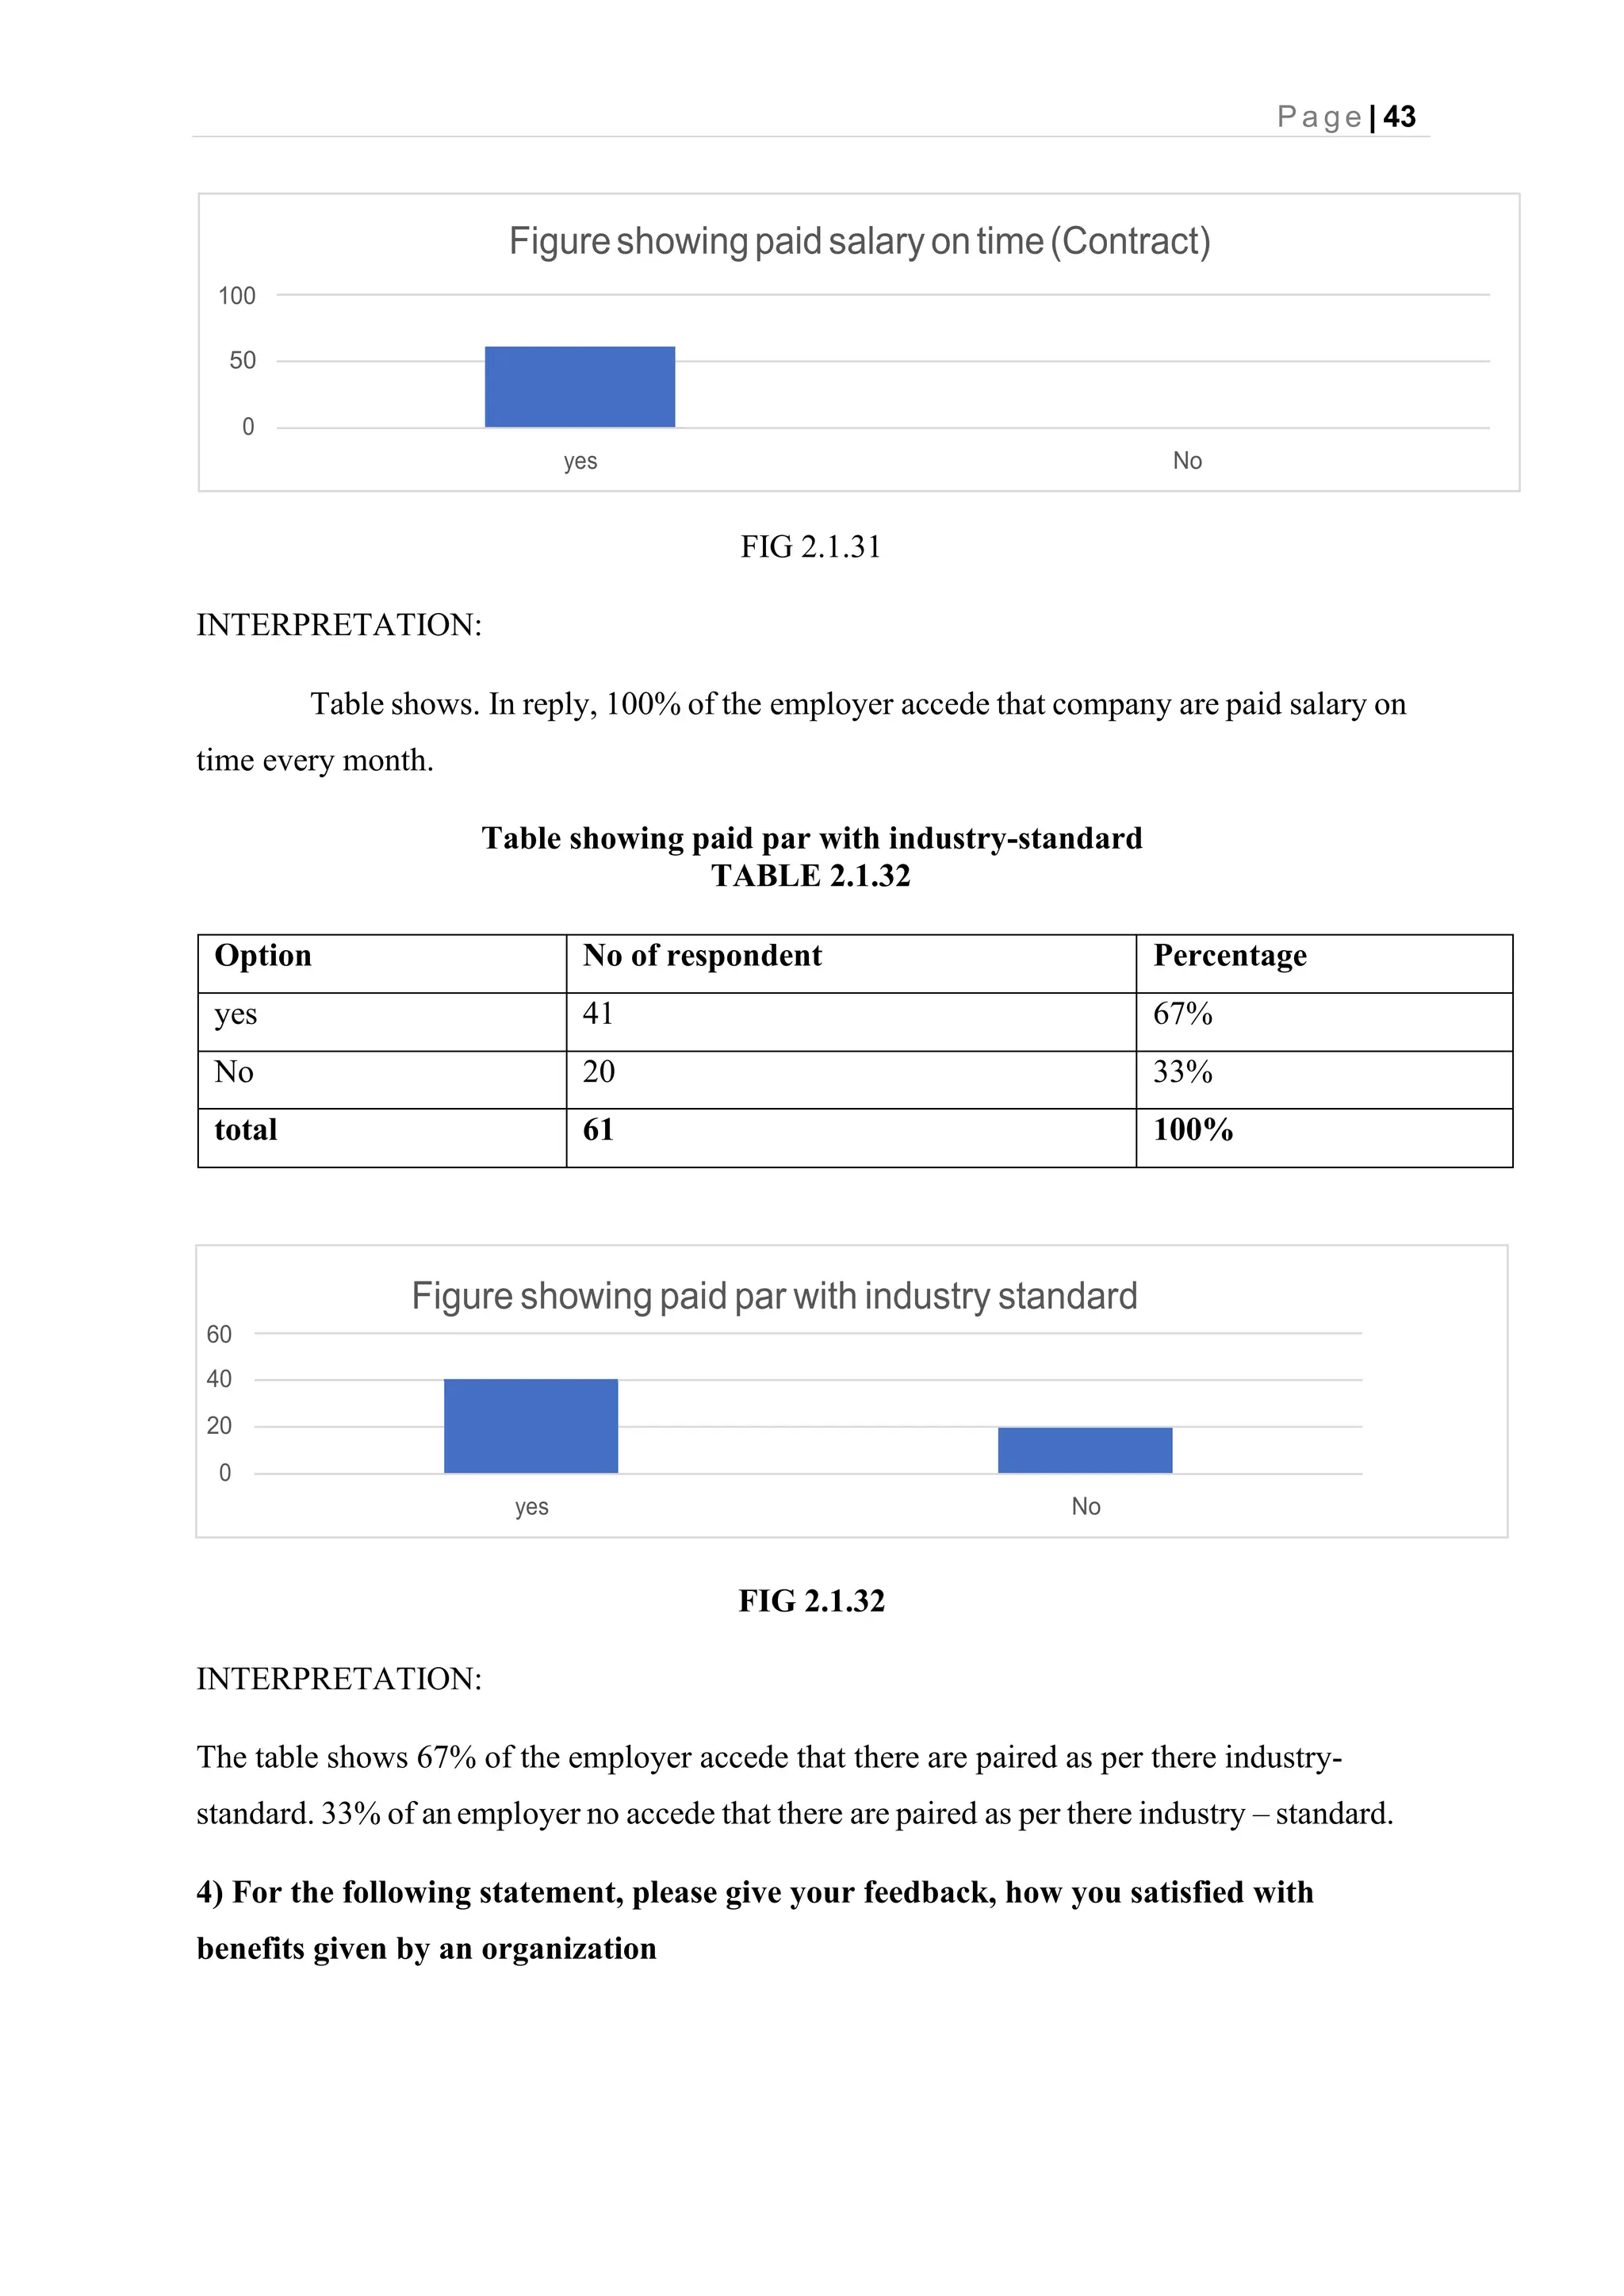
The document is a project report by Ajeethkumar S S on employee satisfaction towards HRD practices at L&T Hydrocarbon Engineering, submitted for the MBA degree at Anna University. It includes a study utilizing a sample of 110 respondents to analyze HRD practices like training, orientation, and compensation, employing descriptive research methodologies and statistical analysis. The findings aim to inform HR practices in organizations, focusing on factors influencing employee satisfaction.
![P a g e | 3
1.2 INDUSTRY PROFILE
Construction is the process of constructing a building or infrastructure. Construction differs
from manufacturing in that manufacturing typically involves mass production of similar items
without a designated purchaser, while construction typically takes place on location for a
known client.[2]
Construction as an industry comprises six to nine per cent of the gross domestic
product of developed countries. Construction starts with planning, design, and financing; it
continues until the project is built and ready for use.
Large-scale construction requires collaboration across multiple disciplines. A project manager
normally manages the budget on the job, and a construction manager, design engineer,
construction engineer or architect supervises it. Those involved with the design and execution
must consider zoning requirements, the environmental impact of the job, scheduling,
budgeting, construction-site safety, availability and transportation of building materials,
logistics, inconvenience to the public caused by construction delays and bidding. Large
construction projects are sometimes referred to as megaprojects.
Industry sectors
Engineering News-Record (ENR), a trade magazine for the construction industry, each year
compiles and reports data about the size of design and construction companies. In 2014, ENR
compiled the data in nine market segments divided as transportation, petroleum, buildings,
power, industrial, water, manufacturing, sewer/waste, telecom, hazardous waste and a tenth
category for other projects. In their reporting, they used data on transportation, sewer,
hazardous waste and water to rank firms as heavy contractors.
1.2.1 Building construction
Building construction is the process of adding structure to real property or construction of
buildings. The majority of building construction jobs are small renovations, such as the addition
of a room, or renovation of a bathroom. Often, the owner of the property acts as a labourer,
paymaster, and design team for the entire project. Although building construction projects
consist of common elements such as design, financial, estimating and legal considerations,
projects of varying sizes may reach undesirable results, such as structural collapse, cost
overruns, and/or litigation. For this reason, those with experience in the field make detailed
plans and maintain careful oversight during the project to ensure a positive outcome.](https://image.slidesharecdn.com/4-240727013951-f1b43f0b/75/A-STUDY-ON-EMPLOYEE-SATISFACTION-TOWARDS-HRD-PRACTICES-WITH-REFERENCE-14-2048.jpg)
![P a g e | 6
Management procurement systems
In this arrangement, the client plays an active role in the procurement system by entering into
separate contracts with the designer (architect or engineer), the construction manager, and
individual trade contractors. The client takes on the contractual role, while the construction or
project manager provides the active role of managing the separate trade contracts, and ensuring
that they complete all work smoothly and effectively together.
Sustainability in construction
Sustainability during the construction phase is one of the aspects of “green building," defined
by the United States Environmental Protection Agency (EPA) as "the practice of creating
structures and using processes that are environmentally responsible and resource-efficient
throughout a building's life-cycle from siting to design, construction, operation, maintenance,
renovation, and deconstruction.
Safety
Construction is one of the most dangerous occupations in the world, incurring more
occupational fatalities than any other sector in both the United States and in the European
Union. In 2009, the fatal occupational injury rate among construction workers in the United
States was nearly three times that for all workers, with Falls being one of the most common
causes of fatal and non-fatal injuries among construction workers.
Proper safety equipment such as harnesses, hard hats and guardrails and procedures
such as securing ladders and inspecting scaffolding can curtail the risk of occupational injuries
in the construction industry.]
Other major causes of fatalities in the construction industry
include electrocution, transportation accidents, and trench cave-ins. Other safety risks for
workers in construction include hearing loss due to high noise exposure, musculoskeletal
injury, chemical exposure, and high levels of stress.](https://image.slidesharecdn.com/4-240727013951-f1b43f0b/75/A-STUDY-ON-EMPLOYEE-SATISFACTION-TOWARDS-HRD-PRACTICES-WITH-REFERENCE-17-2048.jpg)
![P a g e | 18
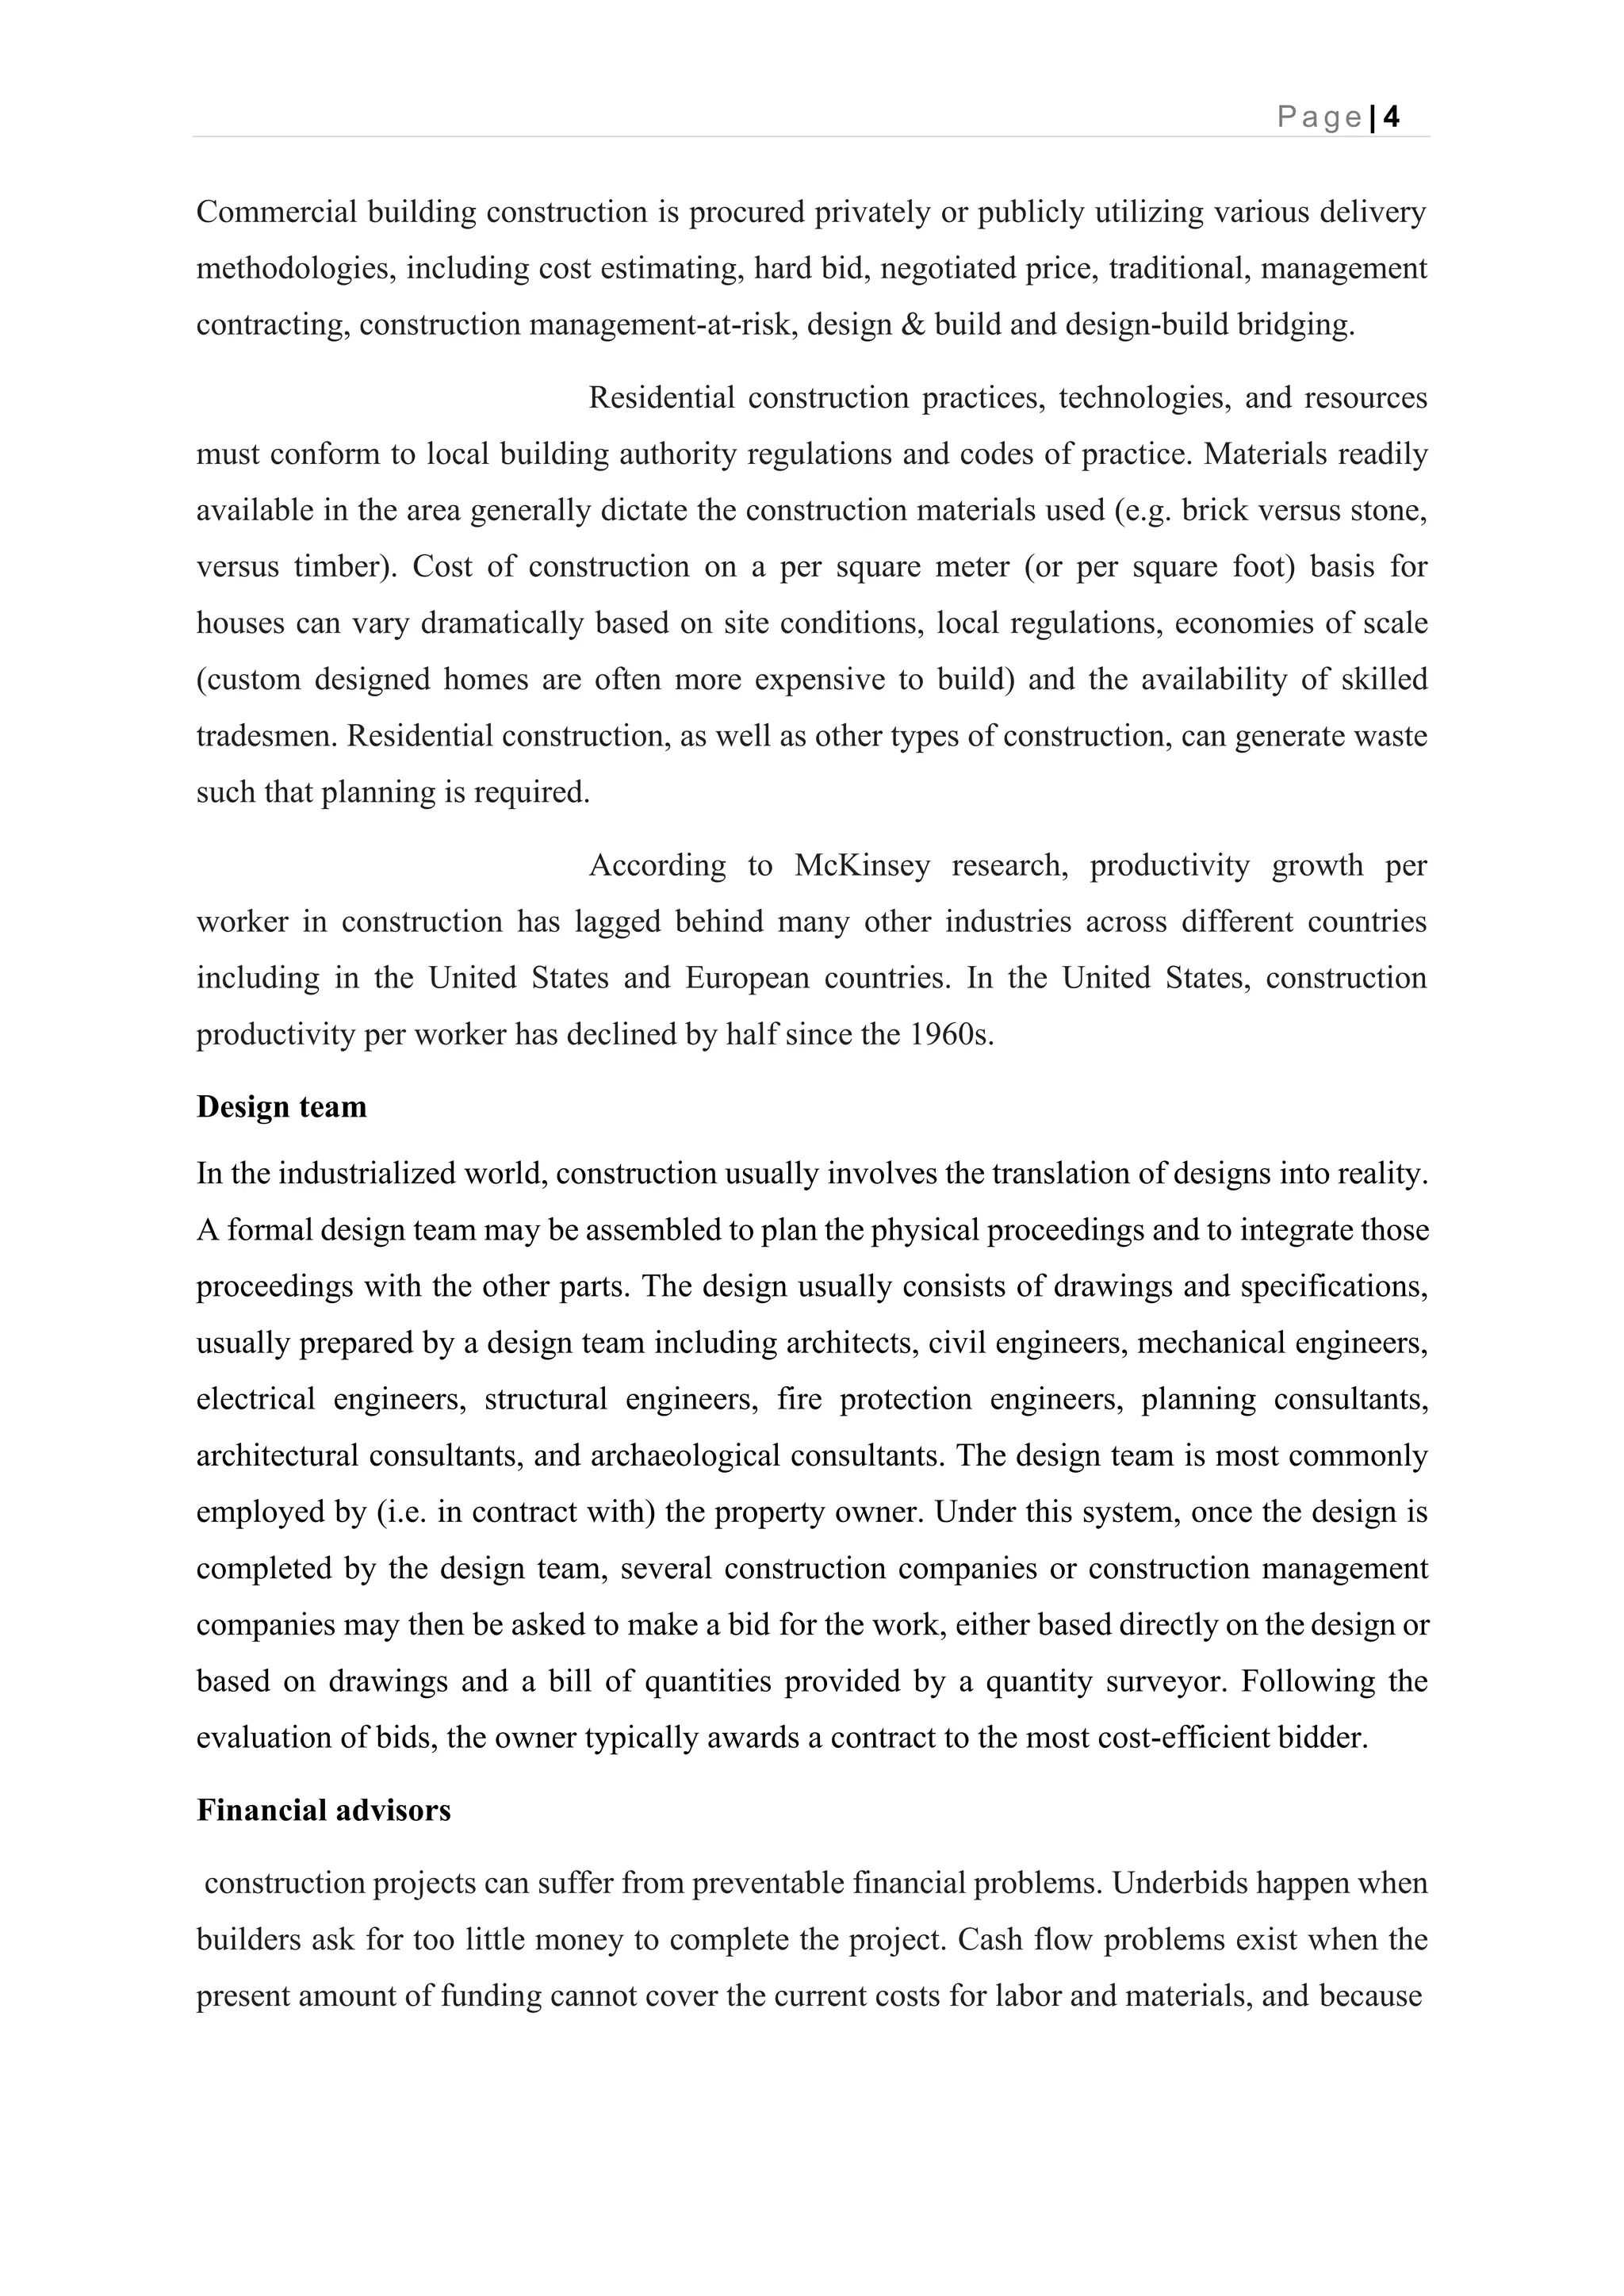
STATISTICAL TOOLS AND TECHNIQUES:
Correlation analysis:
Correlation analysis is a statistical method used to evaluate the strength of the relationship
between two quantitative variables. A high correlation means that two or more variables have
a strong relationship with each other, while a weak correlation means that the variables are
hardly related. In other words, it is the process of studying the strength of that relationship with
available statistical data.
In this Pearson correlation has been used.
Pearson correlation measures a linear dependence between two variables (x and y). It’s also
known as a parametric correlation test because it depends on the distribution of the data. The
plot of y = f(x) is named the linear regression curve.
The Pearson correlation formula is:
r = n(∑xy) −(∑x) (∑y)
√[n∑x2−(∑x)2] [n∑y2−(∑y)2]
Where,
r = Pearson correlation coefficient
x = Values in the first set of data
y = Values in the second set of data
n = Total number of values.](https://image.slidesharecdn.com/4-240727013951-f1b43f0b/75/A-STUDY-ON-EMPLOYEE-SATISFACTION-TOWARDS-HRD-PRACTICES-WITH-REFERENCE-29-2048.jpg)
![✓ Sainath Malisetty, Malathi Narayanan (2018), Evaluating the Impact of HR Practices
on Employee Deviant Behavior: An Exploratory Study on Employees of IT Industry,
Indian Journal of Public Health Research & Development, Vol. 9, No. 11.
✓ M. Shahzad Akbar and Fayia Khanfar (2020), Benefits and Compensations in
Employees’ Motivation, Asian Journal of Economics and Business.
✓ Chris Obisi (2011), Employee Training and Development in Nigerian Organisaitons:
Some Observations and Agenda for Research, Australian Journal of Business and
Management Research. Vol.1 No.9 [82-91].
✓ Ying Wang, Sunghoon Kim (2020), Employee perceptions of HR practices: A critical
review and future directions, The International Journal of Human Resource
Management. VOL. 31, NO. 1, 128–173.
✓ Worlu Rowland & Mugri Ruth (2017), Effect of employee orientation in creating
satisfaction with work, The Business and Management Review, Volume 9 Number 2.](https://image.slidesharecdn.com/4-240727013951-f1b43f0b/75/A-STUDY-ON-EMPLOYEE-SATISFACTION-TOWARDS-HRD-PRACTICES-WITH-REFERENCE-81-2048.jpg)