Download to read offline
![International Journal on Natural Language Computing (IJNLC) Vol.9, No.2, April 2020
DOI: 10.5121/ijnlc.2020.9203 21
A SENTIMENT LEXICON-BASED ANALYSIS FOR
FOOD AND BEVERAGE INDUSTRY REVIEWS. THE
GREEK LANGUAGE PARADIGM
Anastasios Liapakis , Theodore Tsiligiridis and Constantine Yialouris
Informatics Laboratory, Department of Agricultural Economics and Rural Development,
School of Applied Economics and Social Sciences, Agricultural University of Athens
ABSTRACT
The purpose of this research is to implement a methodology to detect and quantify customers’ opinions
which referred to the Food and Beverage (F&B) sector using the Greek language. Due to the large and
continuously opinionative data produced by the evaluations of the customers’ reviews, the F&B companies,
and/or other stakeholders face difficulties to extract all the necessary data and to proceed to further
analysis. As far as the Greek market is concerned, the F&B sector is one of the most dynamic sectors.
Delivery or take away food or coffee is very common, with the vast majority of consumers to order from
aggregators’ platforms (online digital markets). In this study, 8,950 customers’ reviews are extracted from
690 companies selected randomly from a total of 6,795 companies covering the most popular capitals of
Greece and presented in the most used common e-platform. The mining of customers’ reviews covers a
month period during the year of 2018 and the evaluated functions are the quality of food, the customer
service, the image of the company, the pricing, and the quantity of food. As it appears, the sentiment
analysis in an aspect-level using the lexicon-based technique should approach methodologically the
problem by identifying not only the relevant information but also the particular expressions and phrases
the evaluators use over the Internet. The extracted keywords and phrases from the customers’ reviews are
used to form the corresponding dictionaries of the functions and to proceed in the sentiment classification.
The method is tested in an annotated dataset of 2,000 customers’ reviews and, overall, the findings are
expected to contribute towards the design and implementation issues of a sentiment lexicon particularly
devoted to the Greek F&B industry.
KEYWORDS
Sentiment analysis; modern Greek; Food & Beverage Industry; Aspect-level; lexicon-based; corpus-based
1. INTRODUCTION
Before the rapid growth of social media networking, people used to communicate with others to
make recommendations about the products or services that they wanted to consume. This type of
communication is known as Word of Mouth (WoM) and can be defined as the passing of
information from one person to another using oral communication. In the digital era, where the
direct associations were replaced by digital communication (on-line chatting platforms, blogs,
review sites, etc.) the WoM is replaced by the on-line User-Generated Content (UGC)
communication. This type of communication allows any positive or negative statement made by a
potential or former consumer about a product or service, to be visible/available to others via the
Internet [15]. Thus, the UGC communication is considered to be a more reliable method
compared with the traditional methods of mass media [6, 26]. As an example, according to [17],
on-line customers’ reviews improve the available information about products’ quality and this
affects consumers’ food choices.](https://image.slidesharecdn.com/1-200518121352/75/A-SENTIMENT-LEXICON-BASED-ANALYSIS-FOR-FOOD-AND-BEVERAGE-INDUSTRY-REVIEWS-THE-GREEK-LANGUAGE-PARADIGM-1-2048.jpg)
![International Journal on Natural Language Computing (IJNLC) Vol.9, No.2, April 2020
22
In the case of the F&B industry, more and more restaurants tend to cooperate with e-ordering
platforms to follow through with digital advertising campaigns. These e-ordering platforms,
enable customers to evaluate the products or services that they have consumed making also their
evaluations available to other customers or companies. Therefore, the involved companies or
other stakeholders cannot analyse all the evaluations that are produced due to the large volume
and the diversity of the information. An additional problem is that the highest proportion of on-
line evaluations do not take into account the rules of spelling, syntax and grammar [22] creating
many difficulties in the understanding and analysis of the customers’ reviews.
The above problems can be approached with the sentiment analysis. This method quantifies users'
opinions represented by the reviews. It is divided into three levels: document-level [38], sentence-
level [8], and aspect-level [41]. The document-level is recommended in cases that a
document/review expresses opinions only for an entity [2, 37]. The sentence-level is
recommended in cases that a sentence expresses a single opinion about an entity and from only
one person [11]. Note that there is no difference between the document and the sentence level
when the sentences are short documents [17]. The aspect-level which is called also entity or
feature level detects the sentiment for the aspects of an entity [30, 32].
The sentiment analysis relies also on two types of techniques, i.e., machine learning and lexicon-
based. Machine learning techniques are divided into supervised and unsupervised approaches.
There is a huge amount of literature work dealing with the above approaches. Some well-known
supervised approaches are the Naïve Bayes [21], the Support Vector Machine (SVM) [20] and the
K-Nearest Neighbours (KNN) [33], whereas, some unsupervised machine learning approaches
are the Latent Dirichlet Allocation (LDA) [27] and the probabilistic Latent Semantic Analysis
(pLSA) [16]. These approaches are quite consuming only in particular circumstances (e.g.
instances that evaluate only one factor) and in most cases are implemented easily.
The lexicon-based approaches present a robust performance across domains and texts and enable
a deep and computationally intensive linguistic analysis to be incorporated into the process of
analysing sentiment in natural language text. They rely on an opinion lexicon, namely, a
collection of known and pre-compiled sentiment terms that may be manually-based, corpus-based
and dictionary-based. The corpus-based lexicon starts with a seed list of opinion words and then
it finds other opinion words in larger corpora with context-specific orientations, by using
statistical or semantic methods. The dictionary-based lexicon relies on a sentiment dictionary
(e.g. SentiWordNet) to compile opinion words. The most crucial resource for all lexicon-based
approaches is the sentiment lexicon, which can be usually implemented only in a specific
language and in a specific domain too. Note that because of the difficulties in the processing of
natural languages, previous studies showed [9] that domain-dependent methods could be more
effective and accurate. However, the automatic creation of domain sentiment lexicons is
considered a difficult process since this approach relies on seed terms with independent sentiment
orientations and needs a manual selection in annotated sentiment terms. Moreover, limited
methodologies handle the customers’ reviews which evaluate multi-aspects sentences generated
from the opinion and review websites.
For the purposes of this study, the lexicon-based technique of the sentiment analysis approach in
an aspect-level was selected since the reviewers of the F&B sector talk about the restaurants’
functions that have many aspects. The vast majority of the produced evaluations present different
opinions about each of the aspect. This often happens in customers’ reviews about products, or in
discussion forums dedicated to specific product categories, such as food, restaurants,
smartphones, etc. For instance, in a restaurant evaluation, a reviewer can assess the quality of
food, the quality of service, the pricing and the quantity at once. Τhe lexicon-based approach](https://image.slidesharecdn.com/1-200518121352/75/A-SENTIMENT-LEXICON-BASED-ANALYSIS-FOR-FOOD-AND-BEVERAGE-INDUSTRY-REVIEWS-THE-GREEK-LANGUAGE-PARADIGM-2-2048.jpg)
![International Journal on Natural Language Computing (IJNLC) Vol.9, No.2, April 2020
23
seems more suitable than other methods since it is naturally suited to determine both the polarity
and the strength of the orientation. Its outputs are numeric values that are usually calculated as the
average sum of the scores of the opiniated terms in an examined text [40]. In addition, this
approach is likely to work better than a machine learning model while dealing with the negation
(very common in customers’ evaluations about products or services), however, particular studies
are needed to verify such claims.
We searched for articles in accordance with the above criteria and we verify that very limited
research work has been published so far concerning not only for the detection of the Greek
language [22] but also the F&B sector in general. We ended up in the presentation of two tables.
Table 1 shows some related articles which referred to the F&B industry in an aspect-level, using
the English and/or Chinese language, whereas, Table 2 shows some recent articles which concern
the detection of the Greek language in other than the F&B industries in an aspect-level. In each of
the tables, the first column designates the technique that is adopted by the corresponding article,
the second column designates the domain used, the third column specifies the evaluation level,
the fourth column determines the language analysed, and the final column specifies the studied
reference.
Table 1. Articles detecting the English and Chinese language in F&B domain
Technique Domain Evaluation level Language References
Supervised Restaurant Aspect level English [12]
Lexicon Restaurant Aspect level English [4]
Lexicon Restaurant Aspect level English and Chinese [42]
Un-supervised Restaurant Aspect &
Sentence level
English [19]
Un-supervised Restaurant Aspect level English [41]
Un-supervised Restaurant Aspect level English [5]
Supervised Restaurant Aspect level English [39]
Table 2. Articles detecting the Greek language in various domains
Technique Domain Evaluation level Language References
Supervised Education Aspect level Greek [34]
Supervised Movies and tech Aspect level Greek [13]
Supervised Hotel Reviews Aspect level Greek [25]
Supervised News Sentence level Greek [1]
Hybrid Tweets Sentence level Greek [38]
Lexicon General-purpose - Greek [30]
The paper is organized as follows: the second section presents the lexicon-based methodology
and the procedure that is followed to create the proposed lexicons. Section three, presents the
proposed sentiment aggregation procedure, in order to identify and quantify the customers’
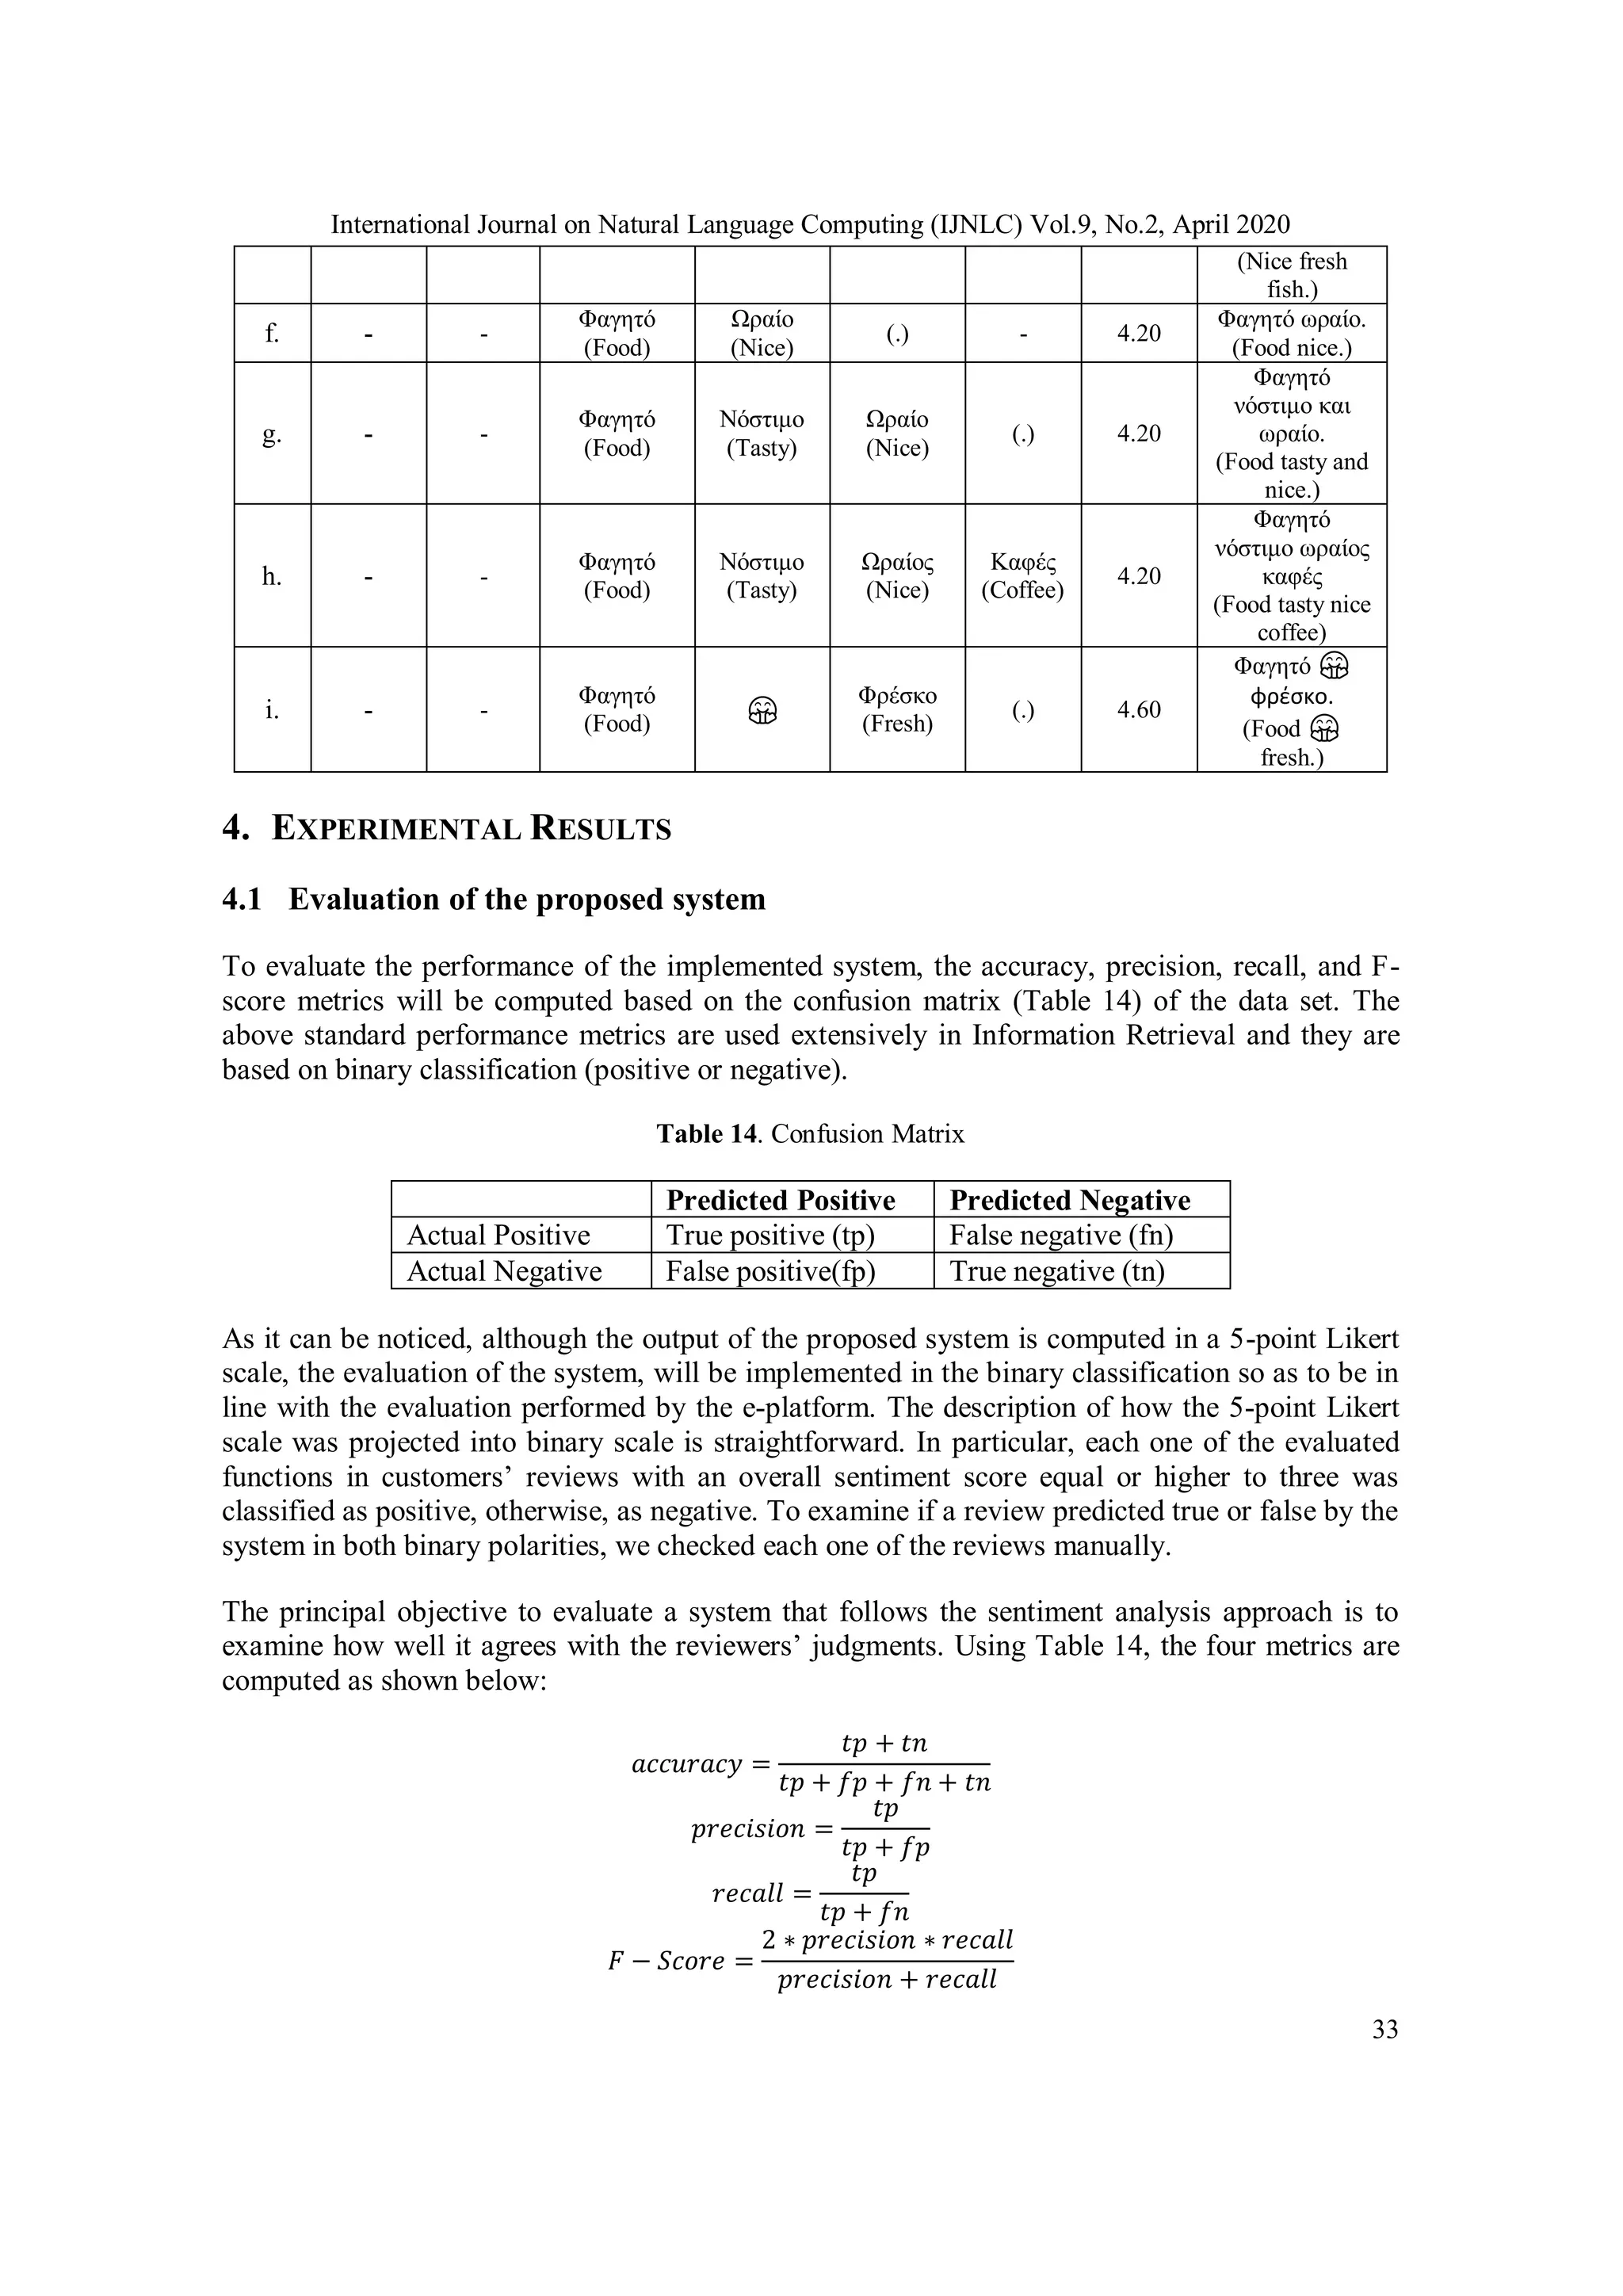
opinions in the examined sector. Based on the confusion matrix of the data set, the experimental
results are presented in the fourth section, by using the standard performance metrics in
information retrieval in each one of the examined functions. The findings of this study are
extended in an annotated data set giving encouraging results. Finally, in the last section, the
conclusions are presented.](https://image.slidesharecdn.com/1-200518121352/75/A-SENTIMENT-LEXICON-BASED-ANALYSIS-FOR-FOOD-AND-BEVERAGE-INDUSTRY-REVIEWS-THE-GREEK-LANGUAGE-PARADIGM-3-2048.jpg)
![International Journal on Natural Language Computing (IJNLC) Vol.9, No.2, April 2020
24
2. THE CREATION OF LEXICONS
2.1. The Lexicon-Based Approach
Lexicon-based approaches together with statistical ones constitute the feature selection methods.
In contrast with the latter which are automatic and used more frequently, the lexicon-based
methods need human annotation. The approach usually starts with a small set of ‘seed’ words,
which is bootstrapped through synonyms and antonyms detection or lexical on-line resources
(e.g. WordNet) in order to obtain a larger lexicon. It is based on the statement that the appropriate
sentiment orientation is the sum of each sentiment words or phrases. This approach does not
require prior training datasets and therefore it is classified as an unsupervised learning technique.
So far, three approaches have been developed; manually, the dictionary-based and the corpus-
based approach. The dictionary-based approach starts from collecting manually a small set of
seed words and then a sentiment dictionary (e.g. WordNet) is used to expand this set of opinion
words via their synonyms or antonyms. The corpus-based approach aims to generate a sentiment
dictionary based on the syntactic or co-occurrence patterns and a list of seed words [23, 24]. Seed
words are a small set of words with strong positive or negative orientations which are usually
collected manually. A lot of researches has already shown that conjunctions between adjectives
provide indirect information about the polarity [14, 37]. Due to the fact that words in different
domains might have various polarities, the major advantage of the corpus-based approach is that
the opinion words generated from a corpus of textual data that are related to a specific domain
[14,37]. For this reason, in this research, the corpus-based approach of the sentiment analysis is
adopted.
2.2. The Procedure
2.2.1. Data extraction
The data set described in the sequel plays an important role in the corpus-based approach which
will be used to develop the sentiment analysis. Its main sources are provided by the reviews of
the customers submitted online in the e-platform. They give insight into product reception and
quality, which helps to make significant business-related decisions. In order to design a
representative sample and to detect most of the Greek local dialects and idioms, we used the last
Greek census of 2011. However, the data is extracted only from the most populated city, e.g. the
capital, of each prefecture, and therefore 44 out of 54 NUTS-3 (Nomenclature of Territorial Units
for Statistics 3) Greek prefectures were presented in the sample. Note that, until the end of 2018,
only three major e-ordering platforms had been established in Greece, owned by the same
multinational firm, and having a common structure. To facilitate the creation of a corpus of
customers’ reviews we retrieved them only from the most popular one. Thus, the reviews were
mined from 690 companies selected randomly from a total of 6,795 companies presented in the e-
platform. A total of 8,950 customers’ reviews have been extracted from 01/11/2018 to
20/11/2018 and the analysis aims to evaluate the functions of quality, service, pricing, quantity,
and image of the local company. The number of customers’ reviews per capital is calculated
using the formulae:
𝑛𝑟𝑒𝑣𝑖𝑒𝑤𝑠𝑖 =
𝑛𝑜 𝑜𝑓 𝑟𝑒𝑠𝑖𝑑𝑒𝑛𝑡𝑠 𝑖𝑛 𝑁𝑈𝑇𝑆3𝑖
𝑛𝑜 𝑜𝑓 𝑎𝑙𝑙 𝑟𝑒𝑠𝑖𝑑𝑒𝑛𝑡𝑠 𝑖𝑛 𝐺𝑟𝑒𝑒𝑐𝑒
× 𝑛𝑜 𝑜𝑓 𝑡𝑜𝑡𝑎𝑙 𝑟𝑒𝑣𝑖𝑒𝑤𝑠 𝑖𝑛 𝑡ℎ𝑒 𝑑𝑎𝑡𝑎 𝑠𝑒𝑡 ; 𝑖 = 1,2, … ,44](https://image.slidesharecdn.com/1-200518121352/75/A-SENTIMENT-LEXICON-BASED-ANALYSIS-FOR-FOOD-AND-BEVERAGE-INDUSTRY-REVIEWS-THE-GREEK-LANGUAGE-PARADIGM-4-2048.jpg)
![International Journal on Natural Language Computing (IJNLC) Vol.9, No.2, April 2020
25
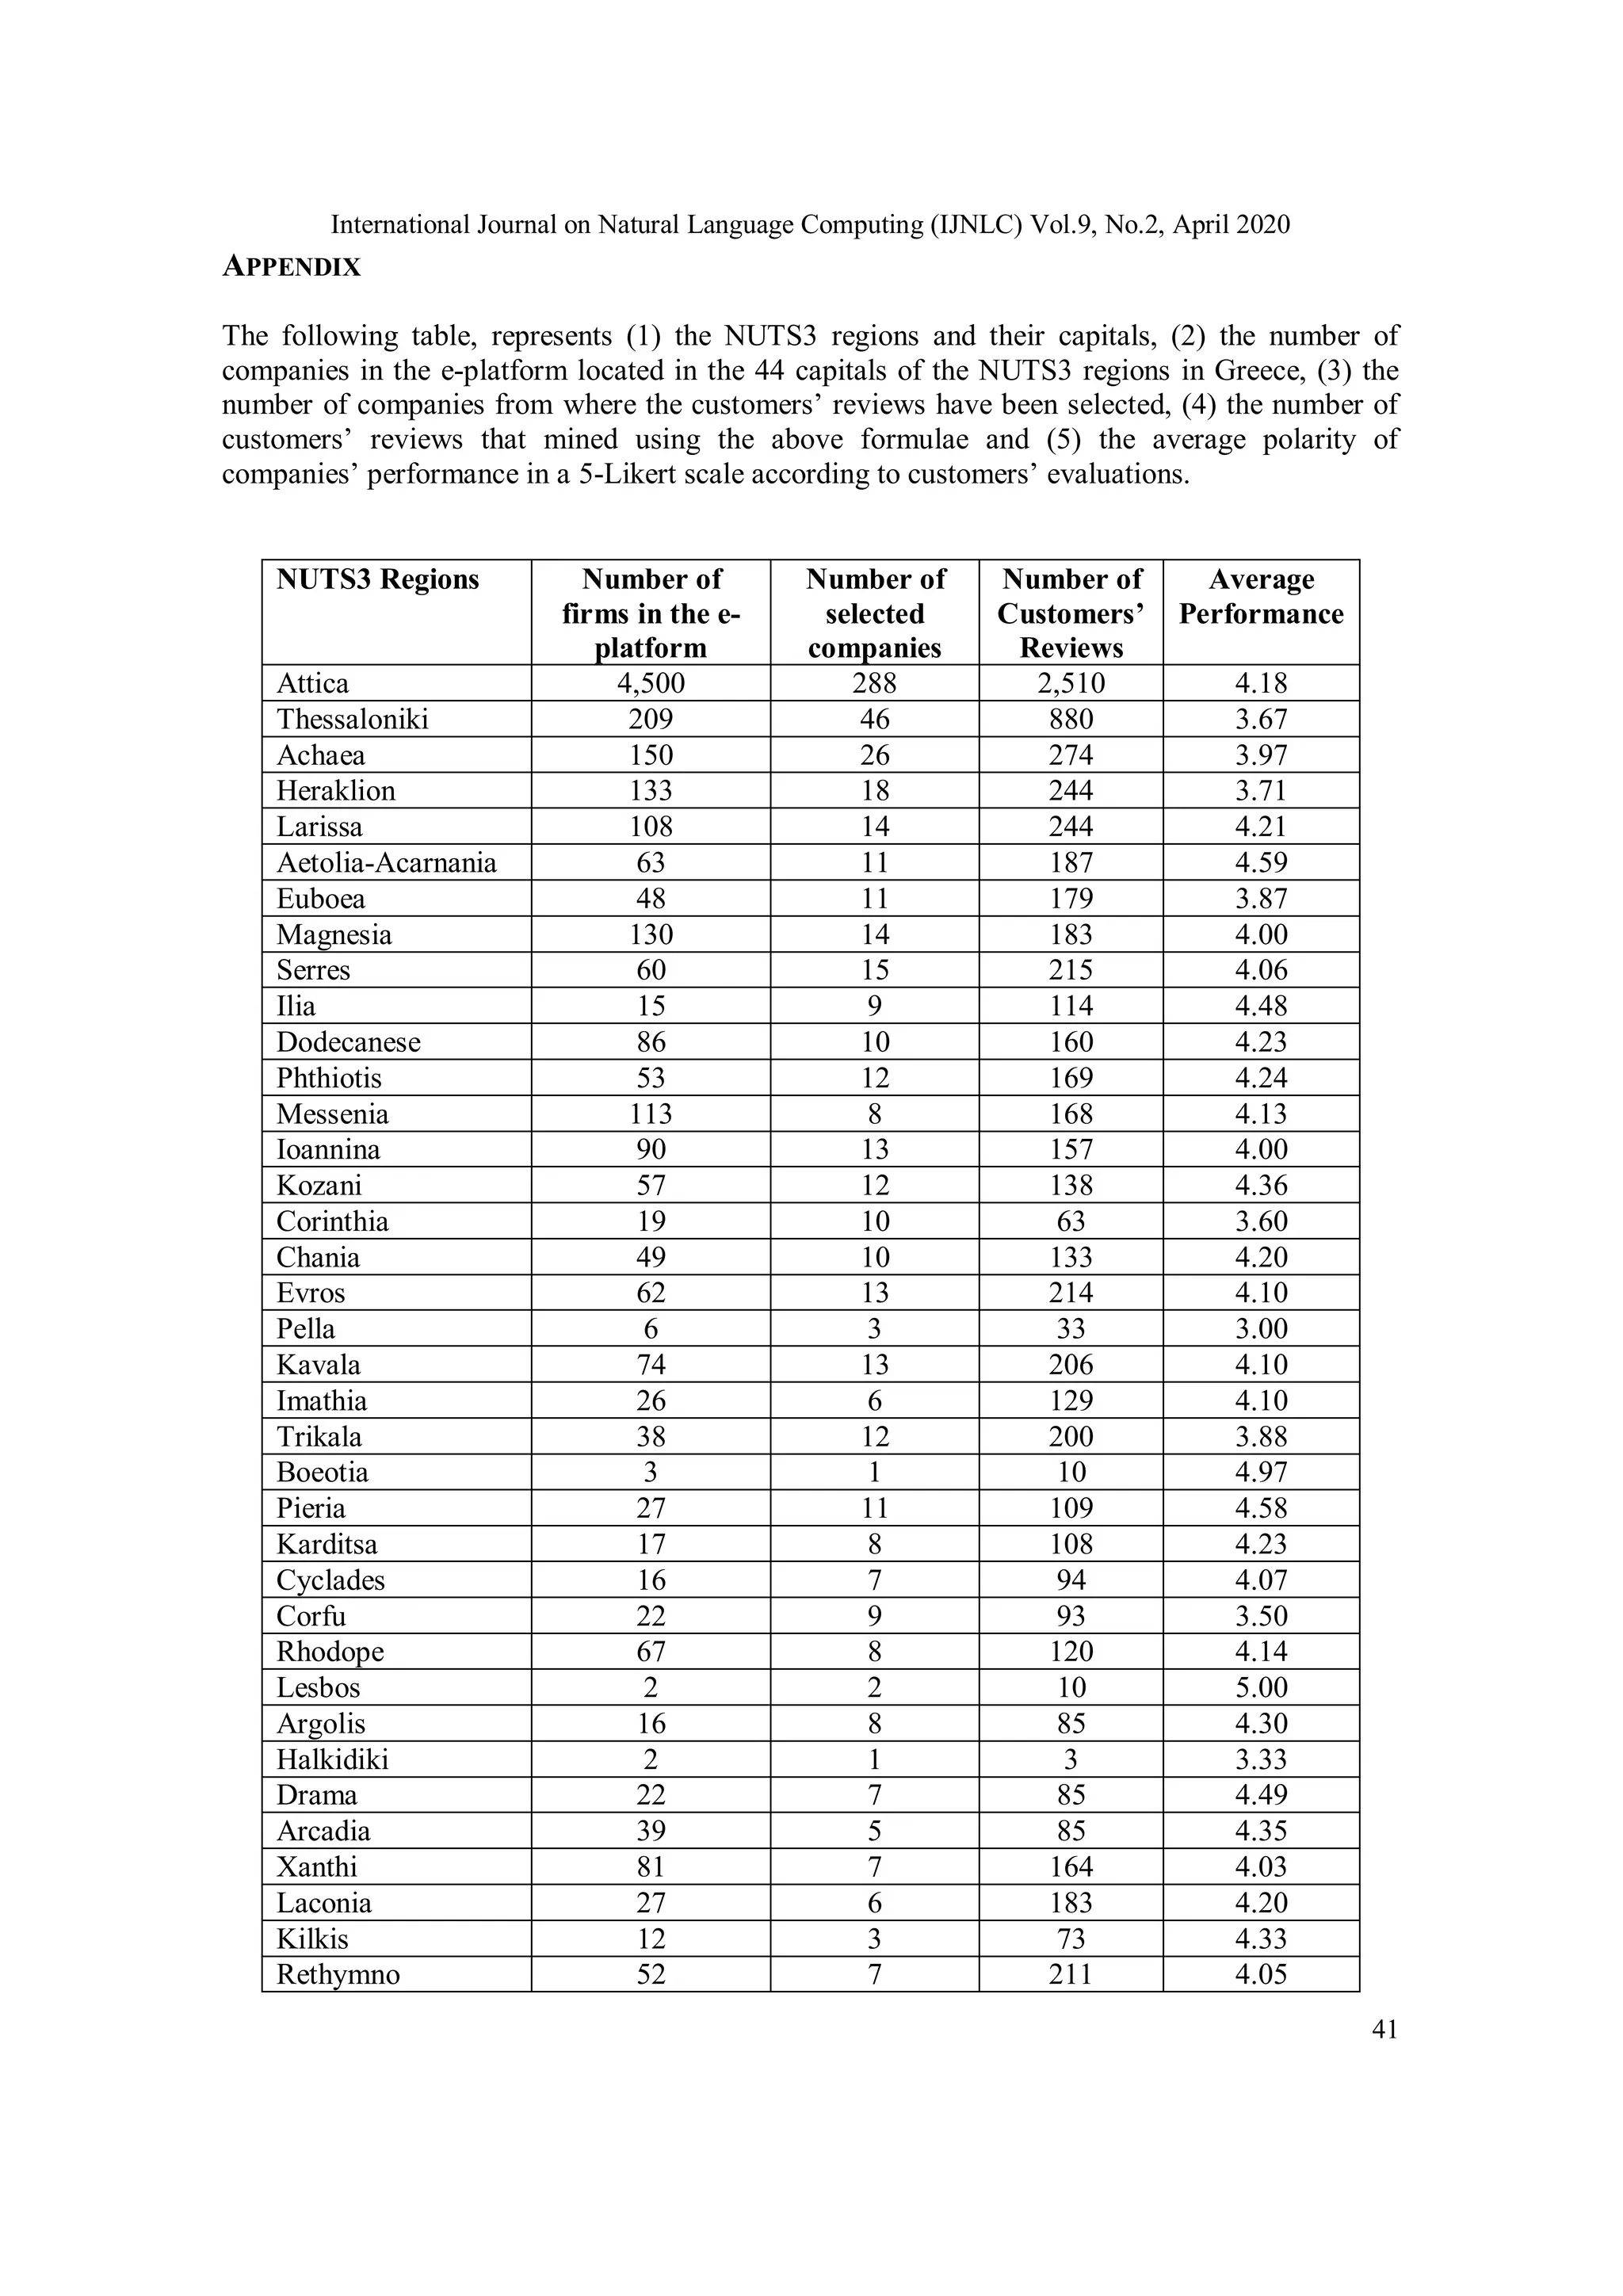
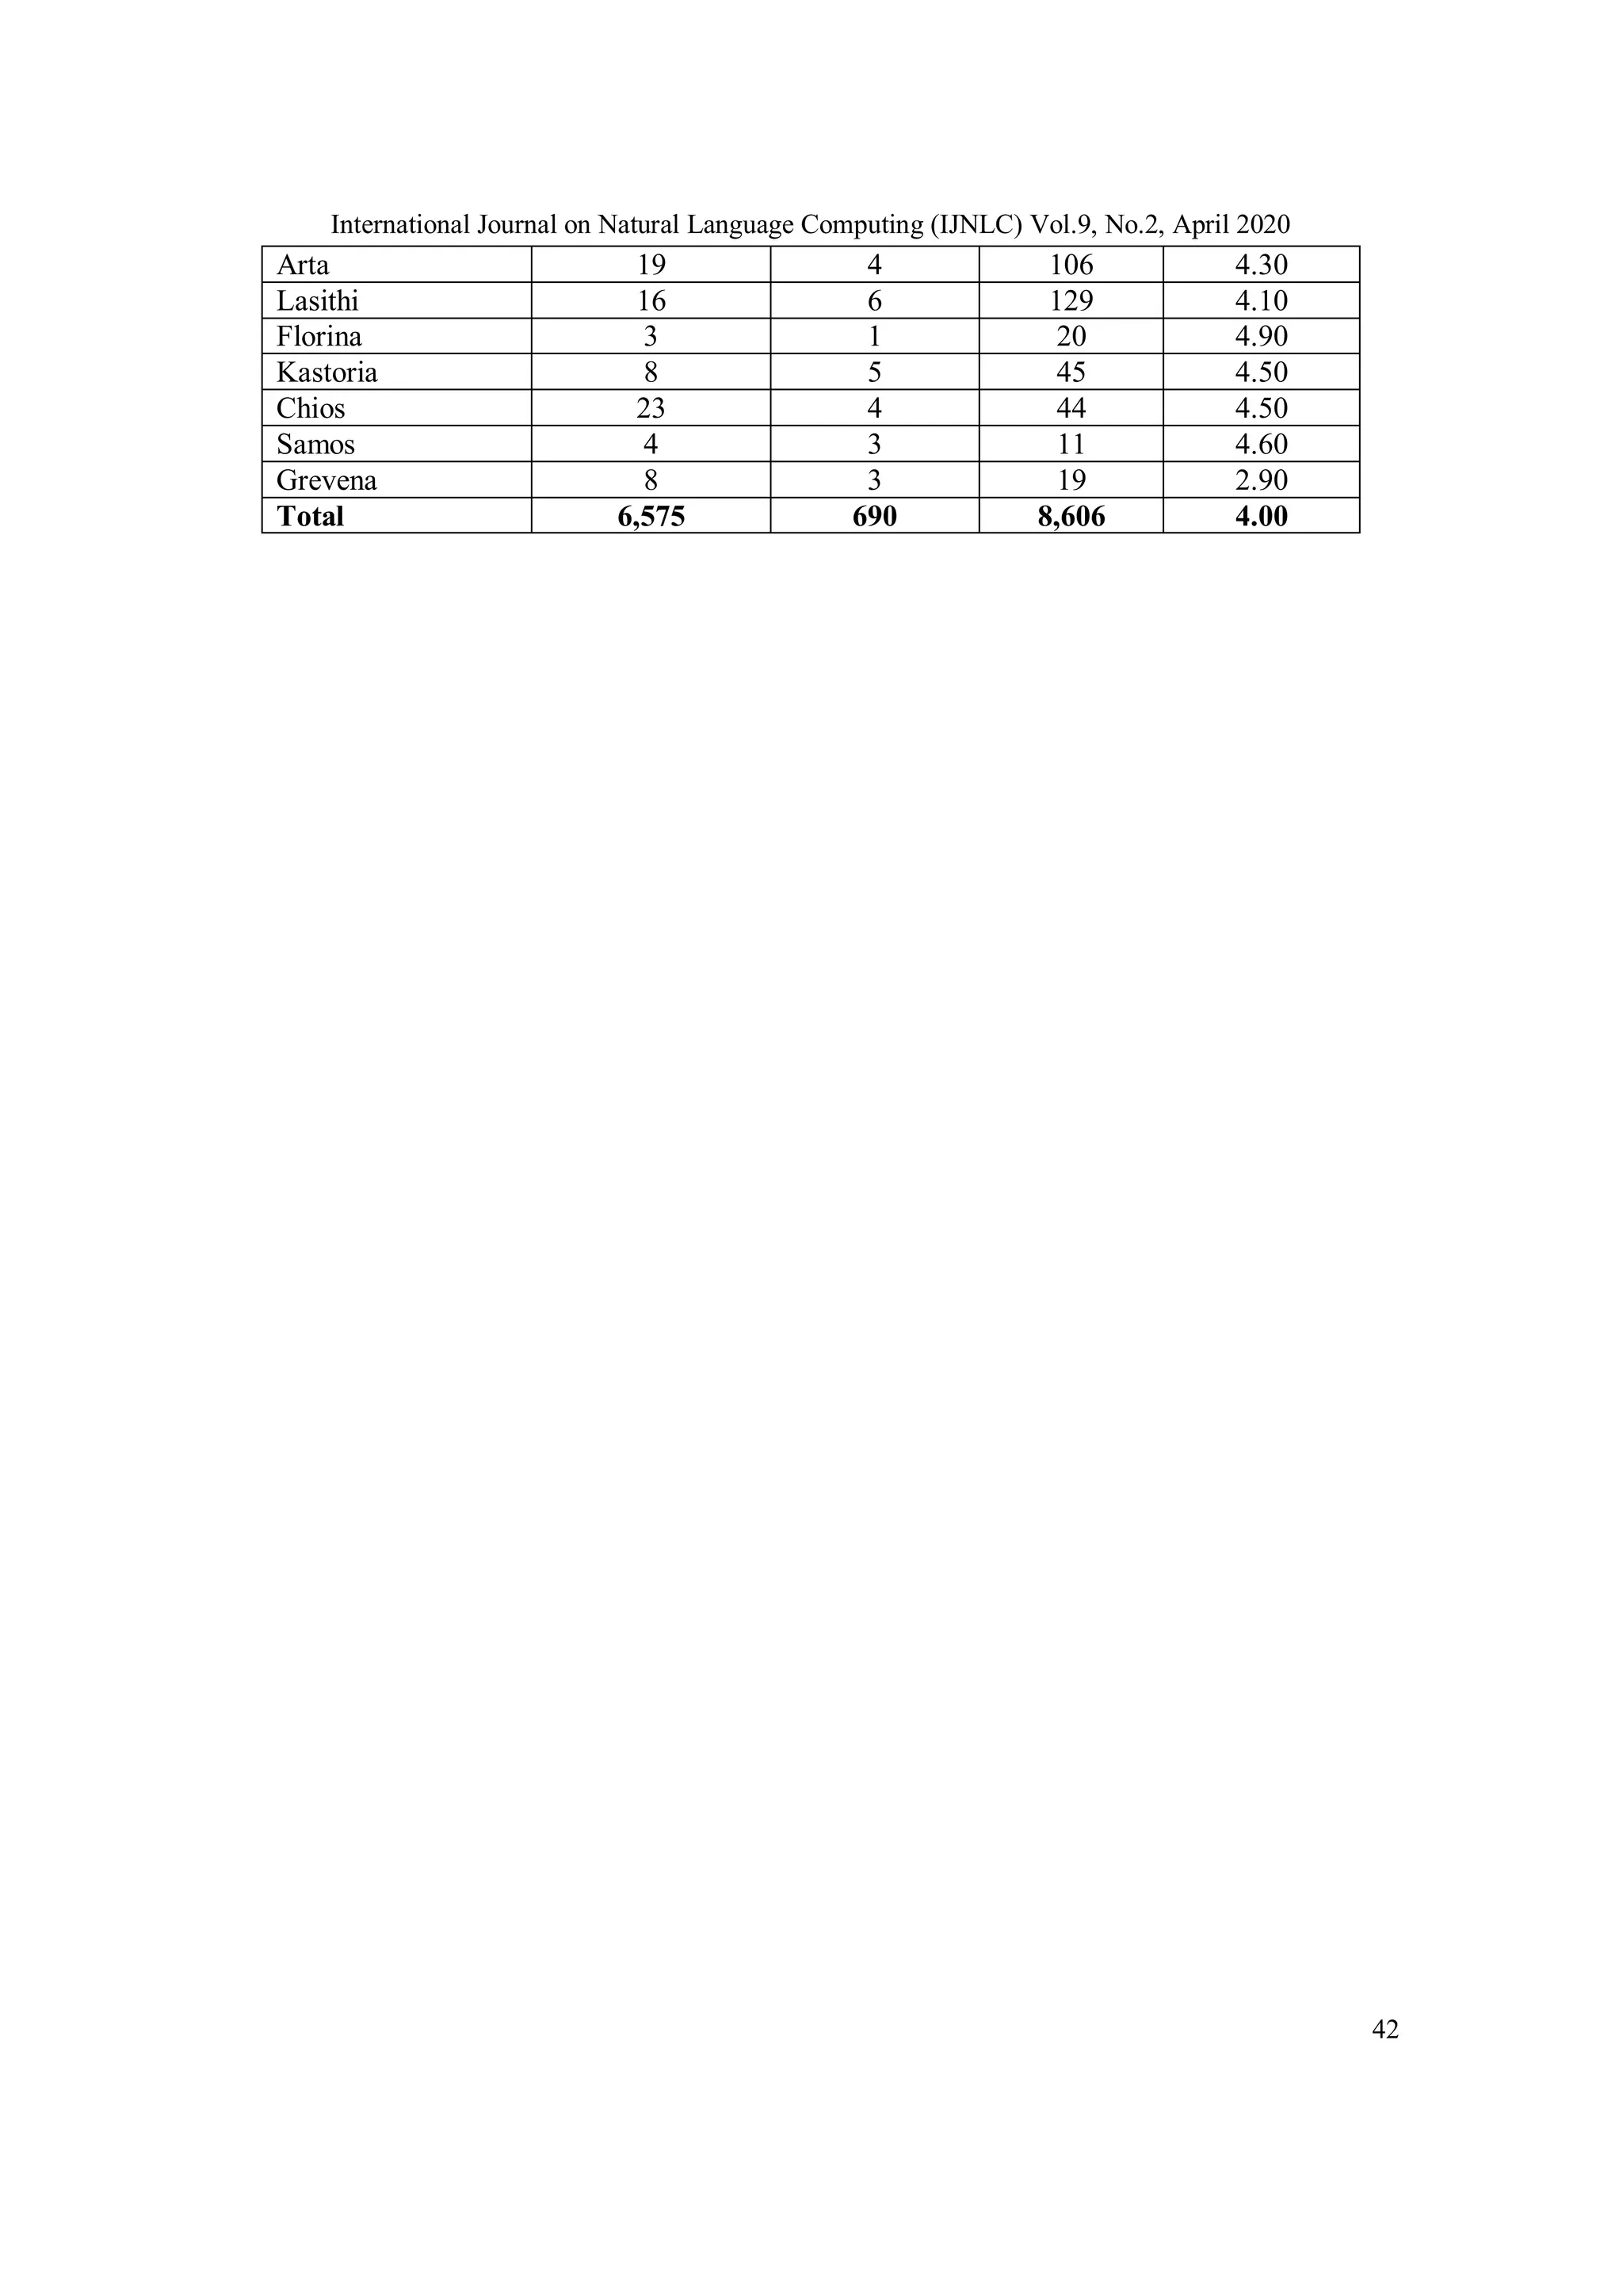
The distribution of companies per capital is presented in a Table (see the appendix) along with
the number of the extracted customers’ reviews and other details.
The overall result of the market analysis and the mining of customers’ reviews show that the vast
majority of small Greek local restaurants or cafeterias cooperate with some e-ordering platforms
to promote their products more efficiently. Interestingly, and according to Eurostat1
, the most
popular Internet activity by the Greek companies was the use of social media networking (50% of
the companies), including opinion and review websites, or e-ordering digital markets, which
permit the customers to make their evaluations about the companies. As far as the Greek Internet
users are concerned, the most used Internet activities were the uploading of self-created content to
any website to be shared (32%), and the searching of information about goods and services
(57%). Recent research2
showed that the e-ordering of ready food was the second top category
(43%) of online shopping in the period of January to September 2018.
2.2.2. Pre-processing of the textual data
Pre-processing is the process of cleaning the data and preparing the text for classification.
Usually, online texts contain lots of noise and unnecessary parts such as tags, scripts, etc. Pre-
processing speeds up the classification process thus helps in real-time the implementation of the
sentiment analysis. We use the following pre-processing strategy, which is suitable for the Greek
language and can significantly improve the creating process of the domain lexicons.
Remove empty customers’ reviews.
Remove the non-Greek words.
Remove Uniform Resource Locators (URLs), hashtags, references, and special characters.
Remove stop words such as intentions, articles, quantifiers and linking words.
Remove all punctuation marks except commas and full stops (these punctuation marks used to
separate the aspects in customers’ reviews).
Capitalize the words to avoid problems with the accentuation (very common in the Greek
language).
Remove extra letters from words. Words that have the same letter more than two times in
suffix are reduced to the word with the repeating letter occurring just once.
In the case that there are expressions that are used as evaluations in the examined platforms by
default, these should be detected before the first step. From the pre-processing procedure, a
percentage of 4% (412) of customers’ reviews were removed.
2.2.3.Construction of lexicons
In order to construct the corpus-based lexicon, we initially cleanse the textual data and reduce the
noise. For the construction, the Bag of Words (BOW) method [10,18] was applied in the data set
of reviews. It processes the textual data with a linear algebraic operator by transforming the text
into sparse numeric vectors. Words are stored in dictionaries and they represented by simple (1-
gram) or composed (2, 3, …, n-gram) words that occur in various documents. Each word is used
as an attribute of the data set represented in the attribute-value form. Thus, in the BOW model, a](https://image.slidesharecdn.com/1-200518121352/75/A-SENTIMENT-LEXICON-BASED-ANALYSIS-FOR-FOOD-AND-BEVERAGE-INDUSTRY-REVIEWS-THE-GREEK-LANGUAGE-PARADIGM-5-2048.jpg)
![International Journal on Natural Language Computing (IJNLC) Vol.9, No.2, April 2020
26
word is represented as a separate variable having a numeric weight of varying importance.
Although in literature, there are various recent models, such as the LDA [27], the pLSA [16], as
well as other word embedding models, the BOW model was preferred, because it has been used
extensively in previous lexicon-based studies with satisfactory results. This choice was also
reinforced by the complex grammar and syntax rules in combination with the lack of resources
e.g. ready dictionaries, such as the SentiWordNet, other proposed research methodologies, etc.) in
Greek language.
To compute each words’ numeric weight, the Term Frequency - Inverse Document Frequency
(TF-IDF or tf-idf) [13] was applied. The weight shows how important a word is to a document in
a collection or corpus of the examined online reviews. It is the product of two factors: the first,
computes the normalized Term Frequency (tf), e.g., the number of times a word appears in a
document, divided by the total number of words in that document; the second term is the Inverse
Document Frequency (idf), which is computed as the logarithm of the number of the documents
in the collection or corpus divided by the number of documents where a specific word appears.
The implementation of the above metrics in the data set of reviews showed that the most frequent
POS tags in customers’ reviews were the adjectives and the nouns. This led us to design five
dictionaries corresponding to the five functions (Quality, Service, Price, Quantity, and Image)
considered. These are the Dictionary of Quality (DoQl), the Dictionary of Service (DoS), the
Dictionary of Price (DoP), the Dictionary of Quantity (DoQn), and finally, the Dictionary of
Image (DoI). The dictionaries include 188 (DoQI), 160 (DoS), 26 (DoP), 22 (DoQn) and 18 (DoI)
adjectives with polarities that describe the functions of quality, the service, the pricing, the
quantity and the image of the local company, respectively. The adjectives were placed in each
dictionary manually, taking into account the context of customers’ reviews that includes these
ajectives. The above results are summarized in Table 4, which also shows that quality is the most
frequently evaluated function in customers’ reviews, followed by the customer service, the image,
the pricing and finally, the quantity. This is because its dictionary presents the higher sum term
frequency, stfDoQI = 0.457 (46% of customers’ reviews have at least one adjective or expression
that evaluates the function of quality), followed by the customer service with stfDoS= 0.30, the
image of the local company with stfDoI=0.167, the pricing with stfDoP=0.04, and finally the
quantity stfDoQn=0.03. Moreover, assuming a scale of 1 (very dissatisfied) to 5 (very satisfied), the
ratio of positive: negative terms, as well as the average polarity of terms for each dictionary, are
shown also in Table 4.
Table 4. Details of each dictionary
Dictionary Weight (stf) Number of
terms
Average polarity
of terms
Positive:
Negative
DoQI 0.457 188 3.09 50:50
DoS 0.306 160 3.50 70:30
DoI 0.167 18 3.80 70:30
DoP 0.04 26 3.60 60:40
DoQn 0.03 22 3.90 80:20
Total: 1.000 414
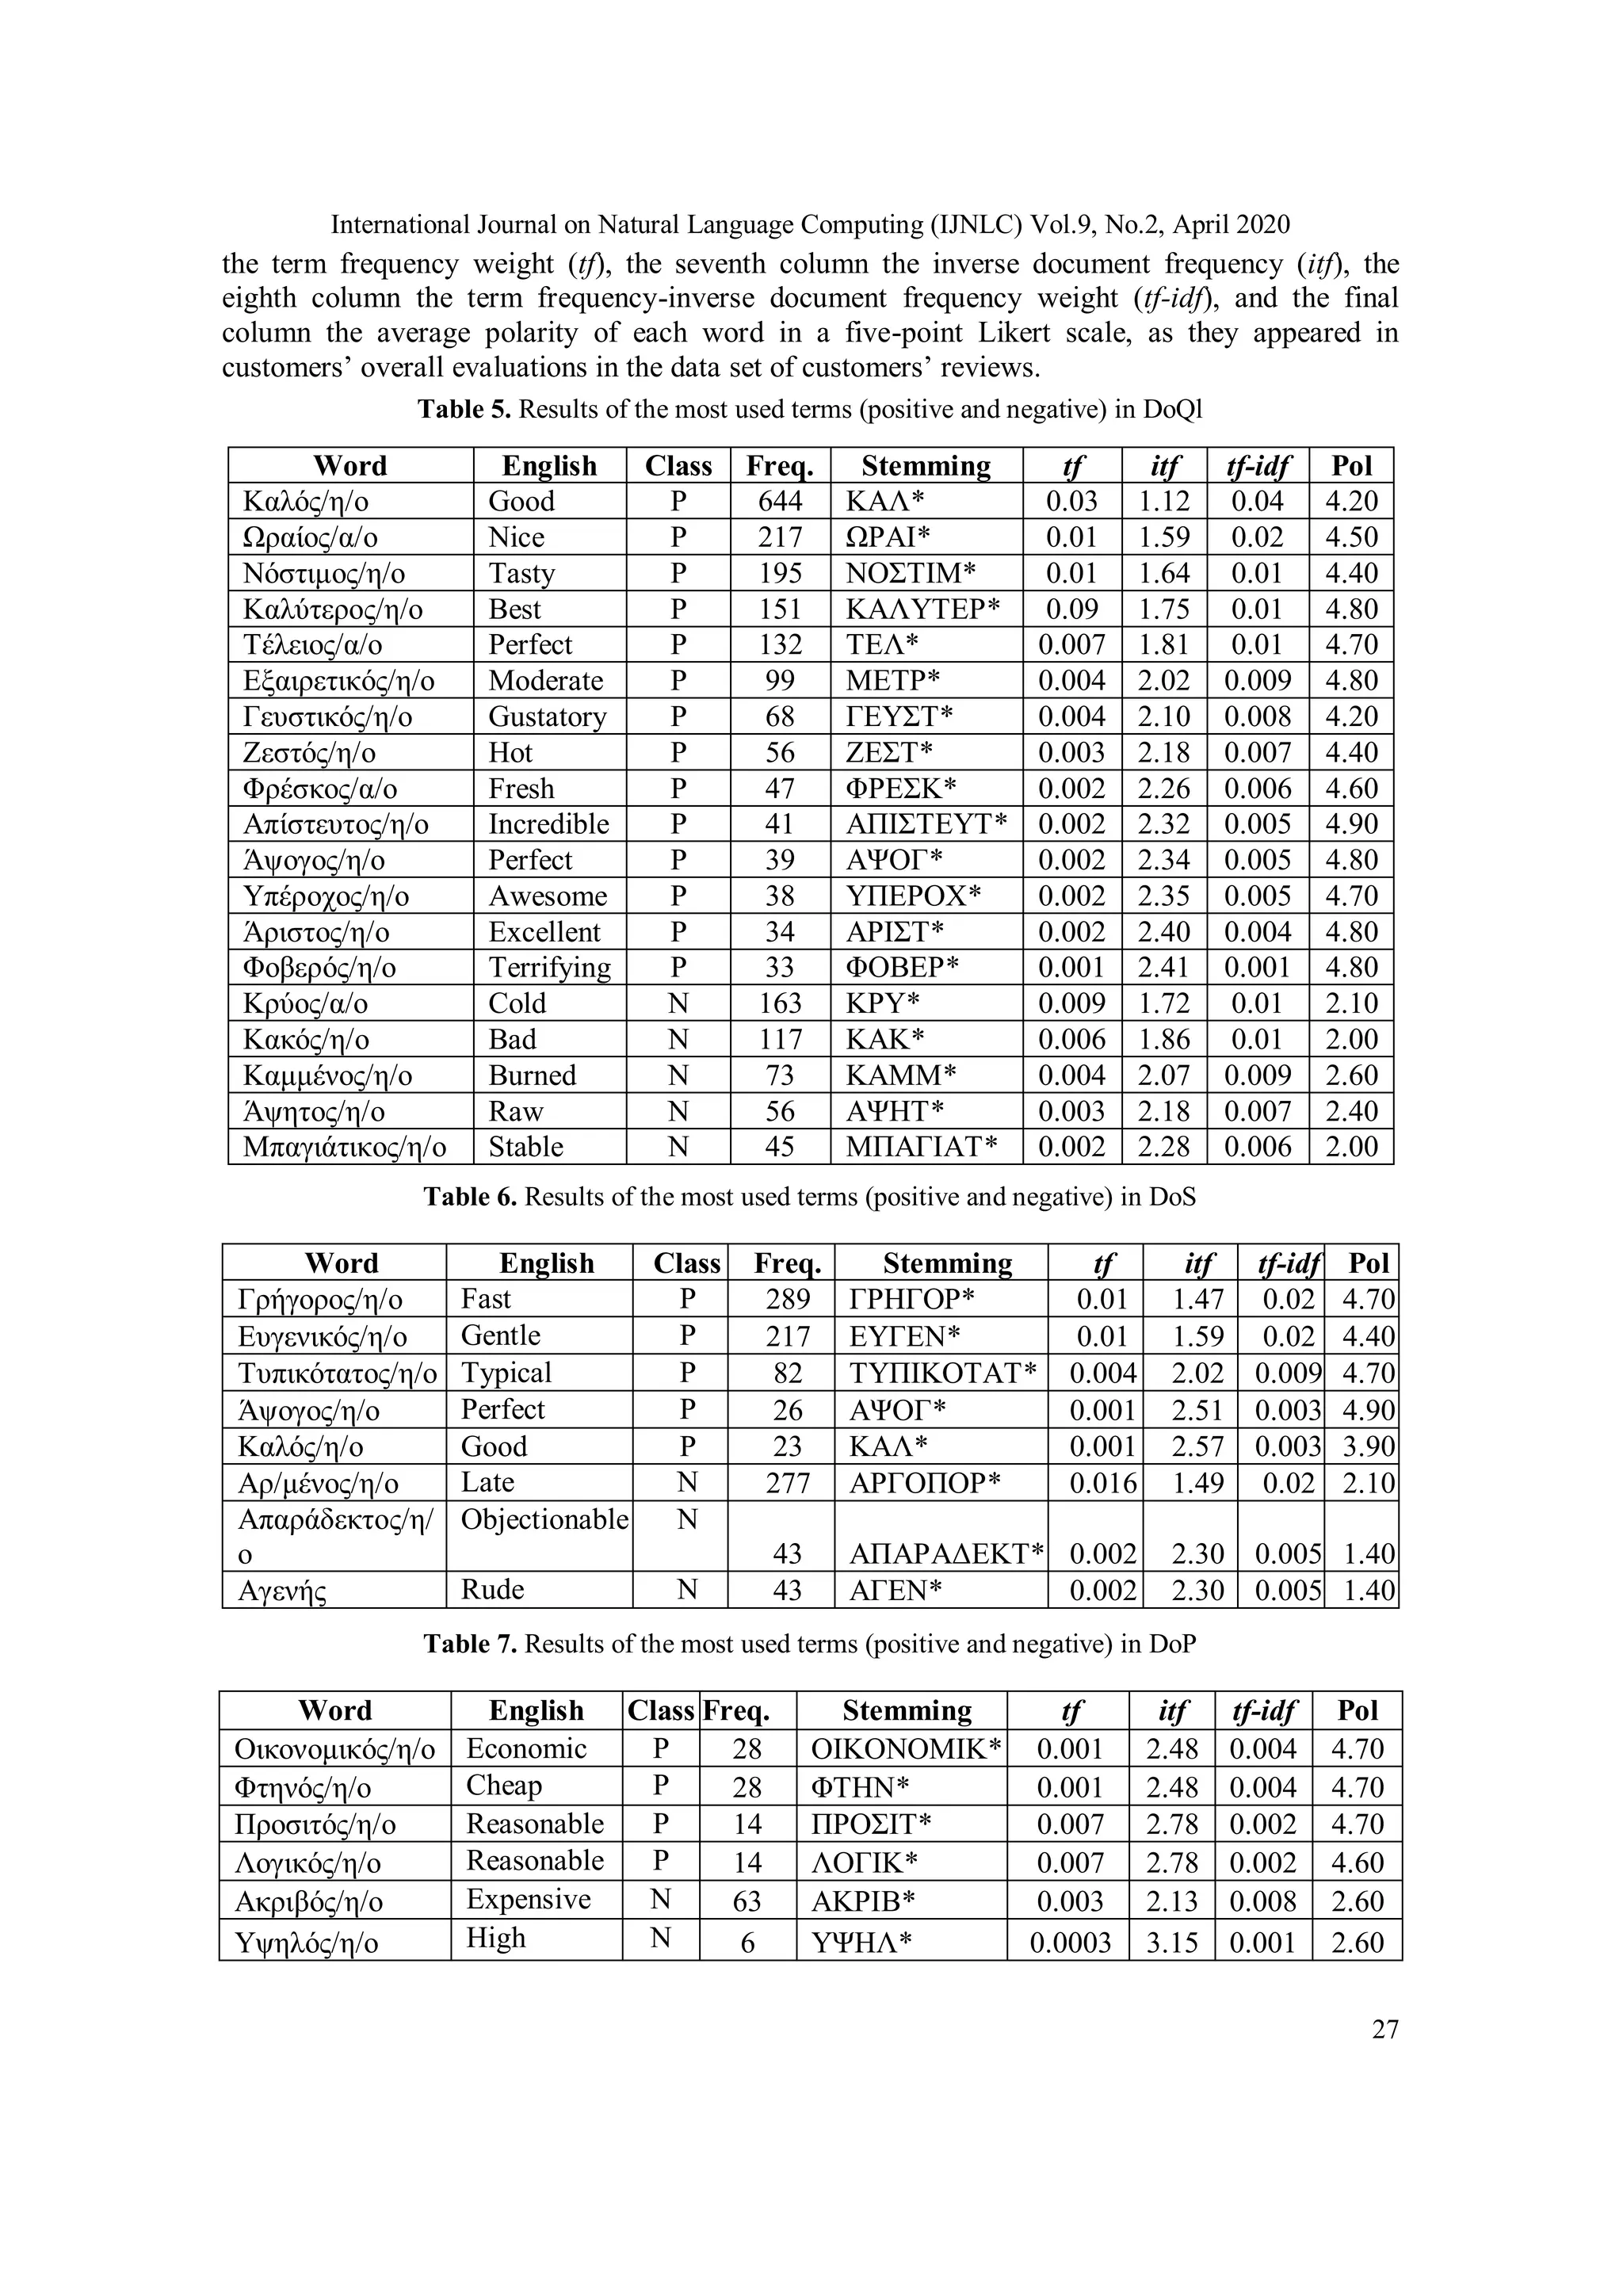
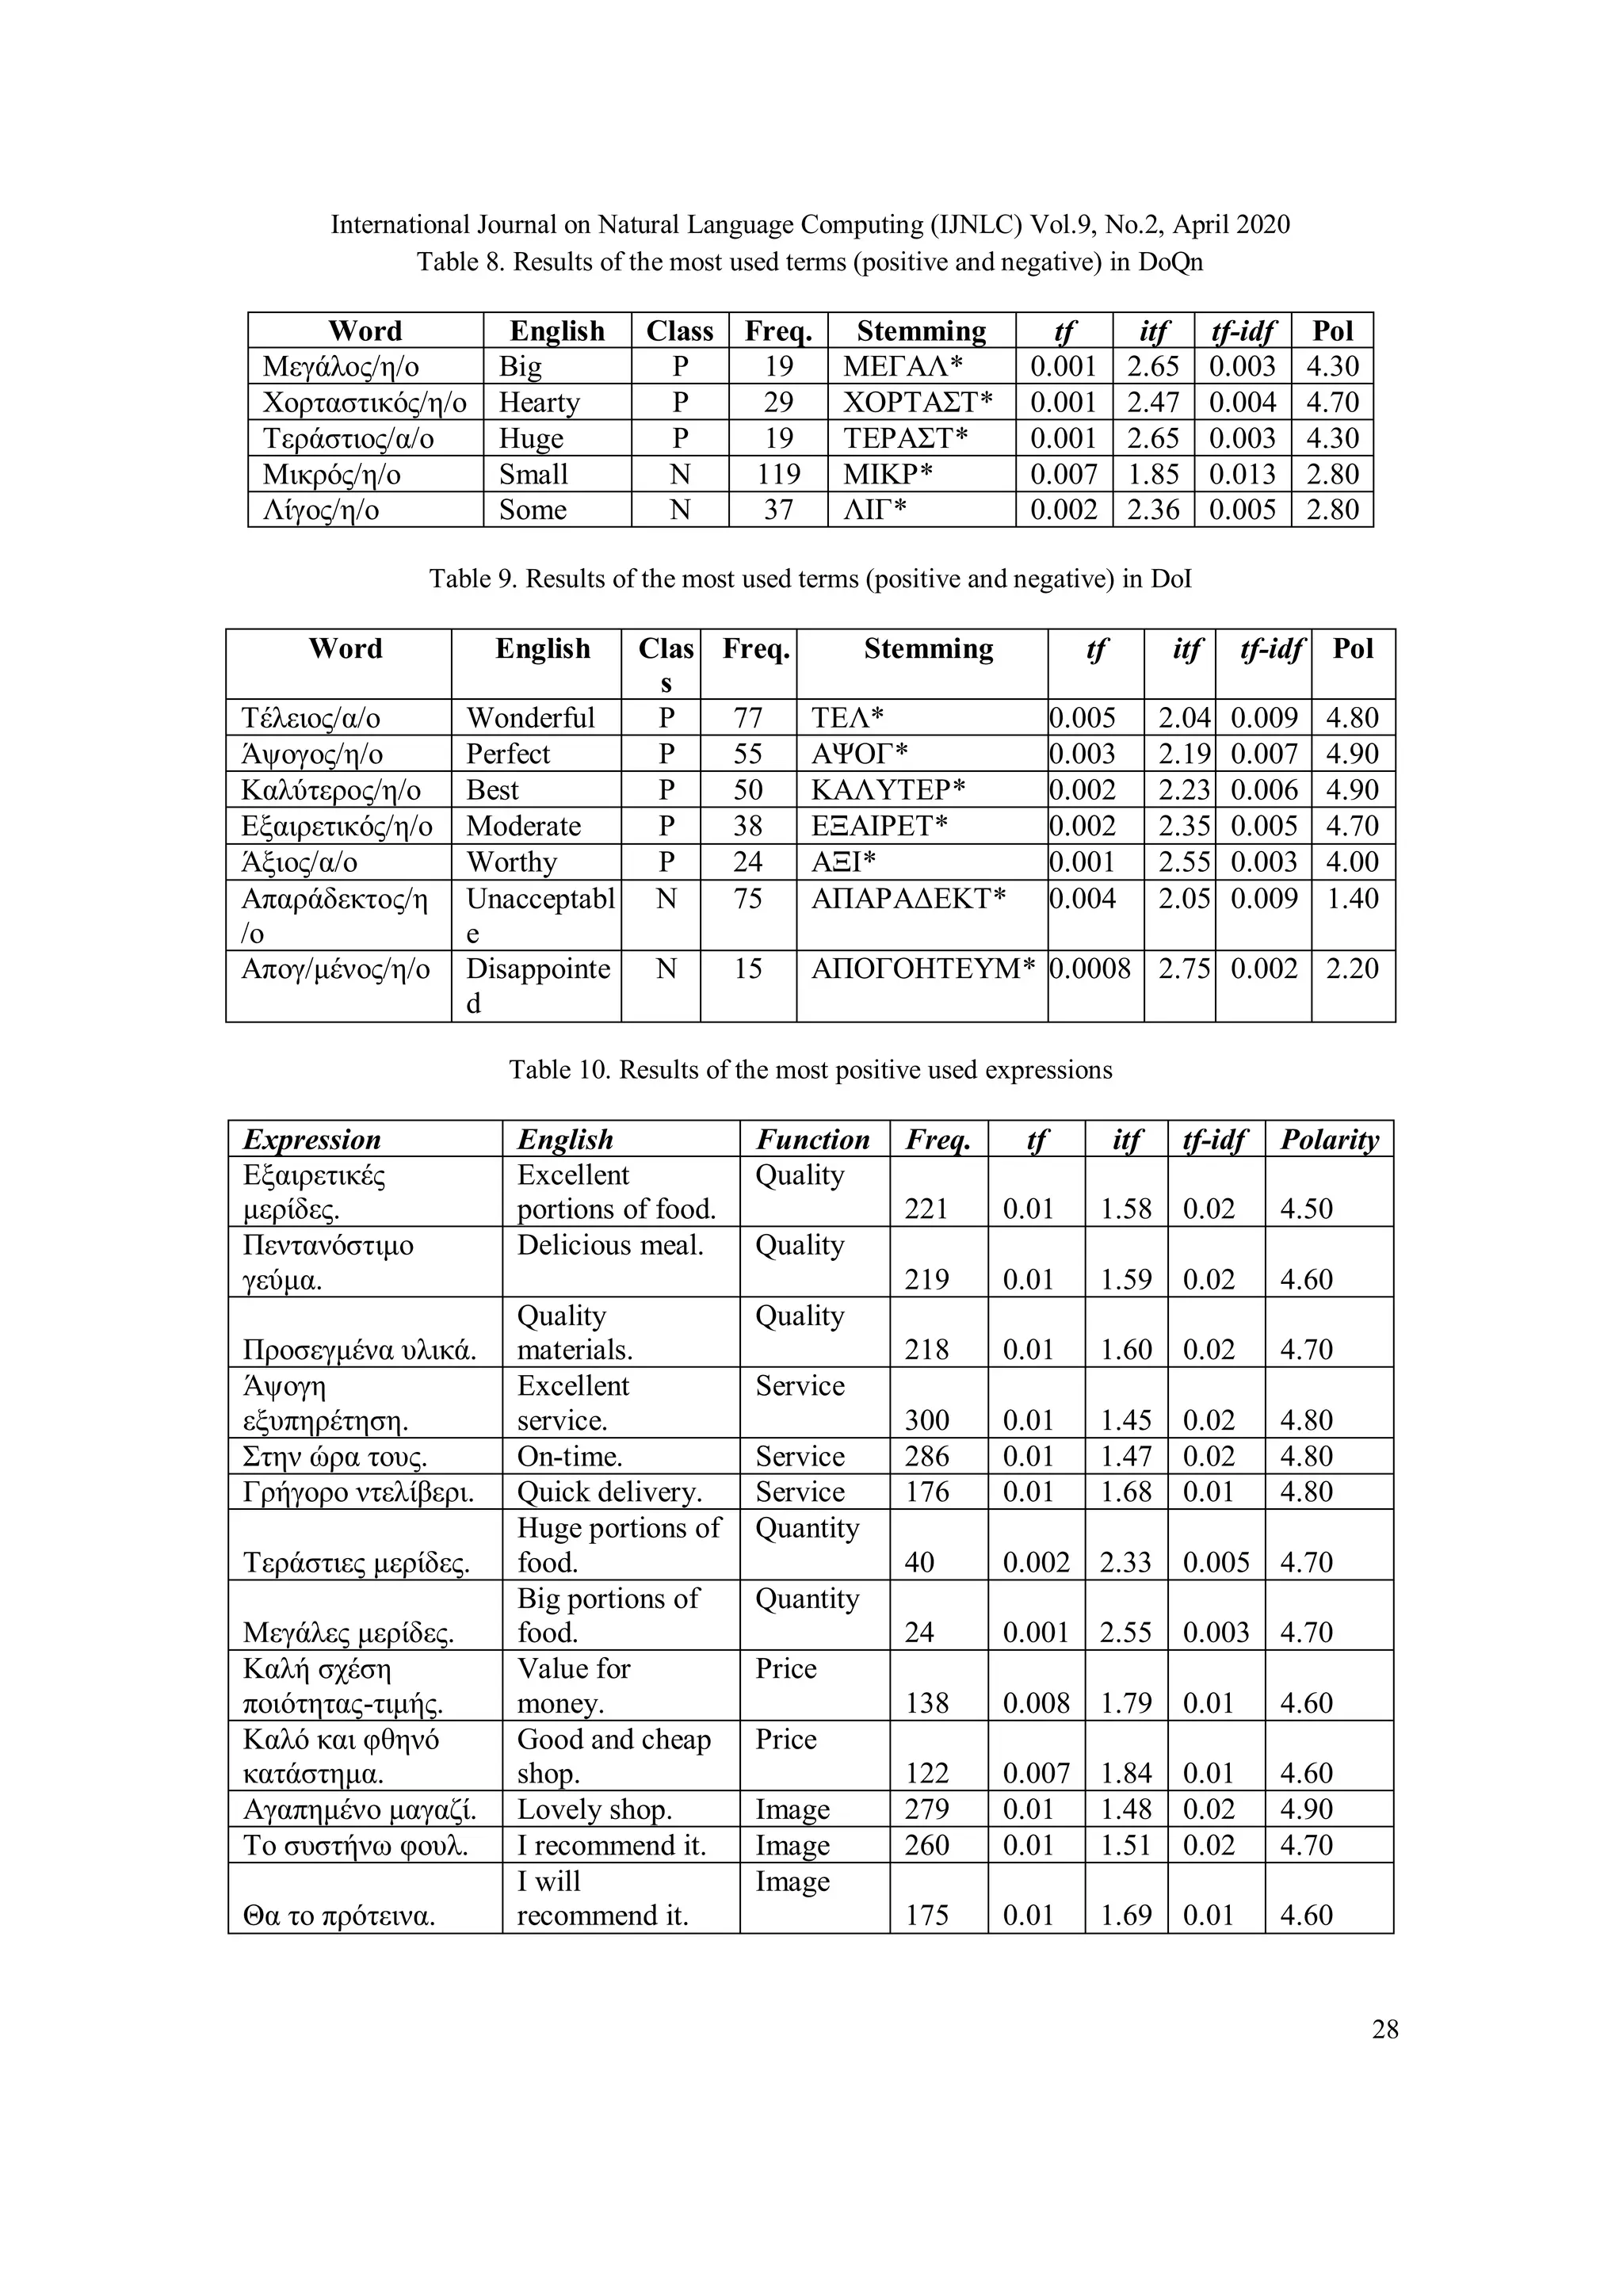
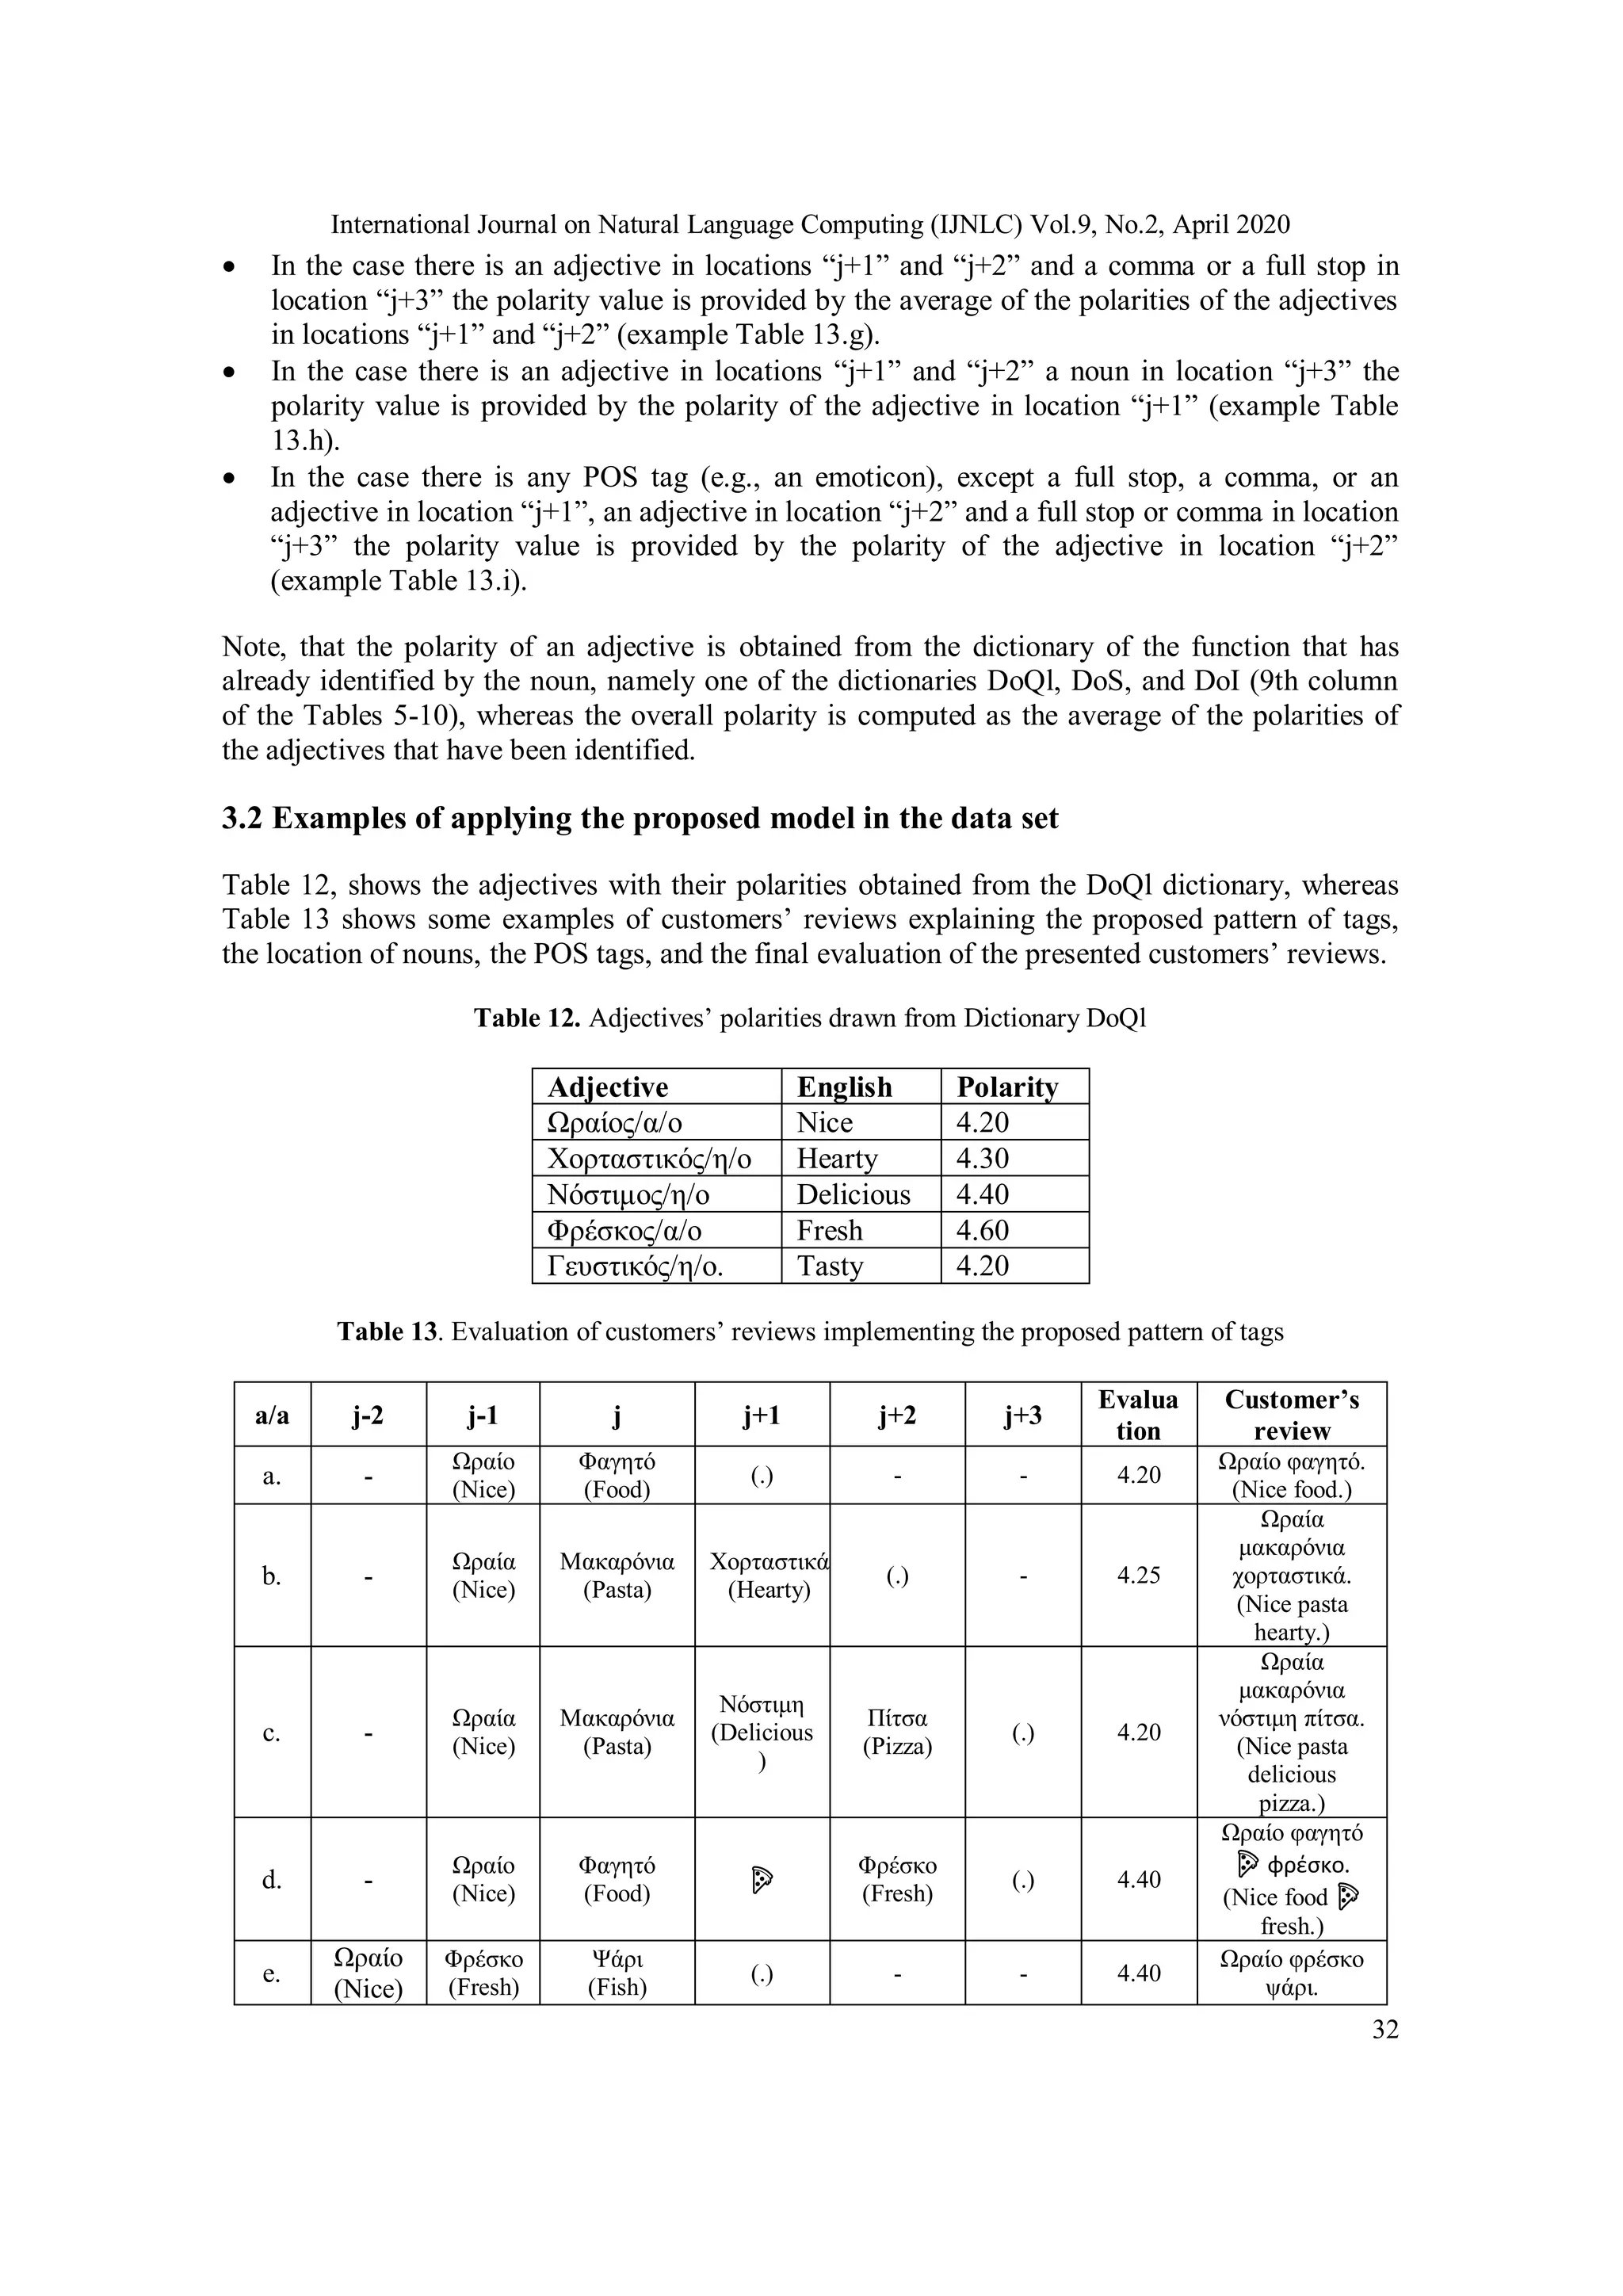
Tables 5 to 10, show the details of the most common positive and negative adjectives used in
each function. These tables have the same structure, namely, the first and the second column
presents the word in Greek and English language respectively, the third column shows the
classification (Positive (P) or Negative (N)), the frequency of the word which is provided by the
BOW method (if a word appears in a customer review more than once, is considered as a single
entry), the fifth column shows the result after applying the stemming rules [28], the sixth column](https://image.slidesharecdn.com/1-200518121352/75/A-SENTIMENT-LEXICON-BASED-ANALYSIS-FOR-FOOD-AND-BEVERAGE-INDUSTRY-REVIEWS-THE-GREEK-LANGUAGE-PARADIGM-6-2048.jpg)
![International Journal on Natural Language Computing (IJNLC) Vol.9, No.2, April 2020
29
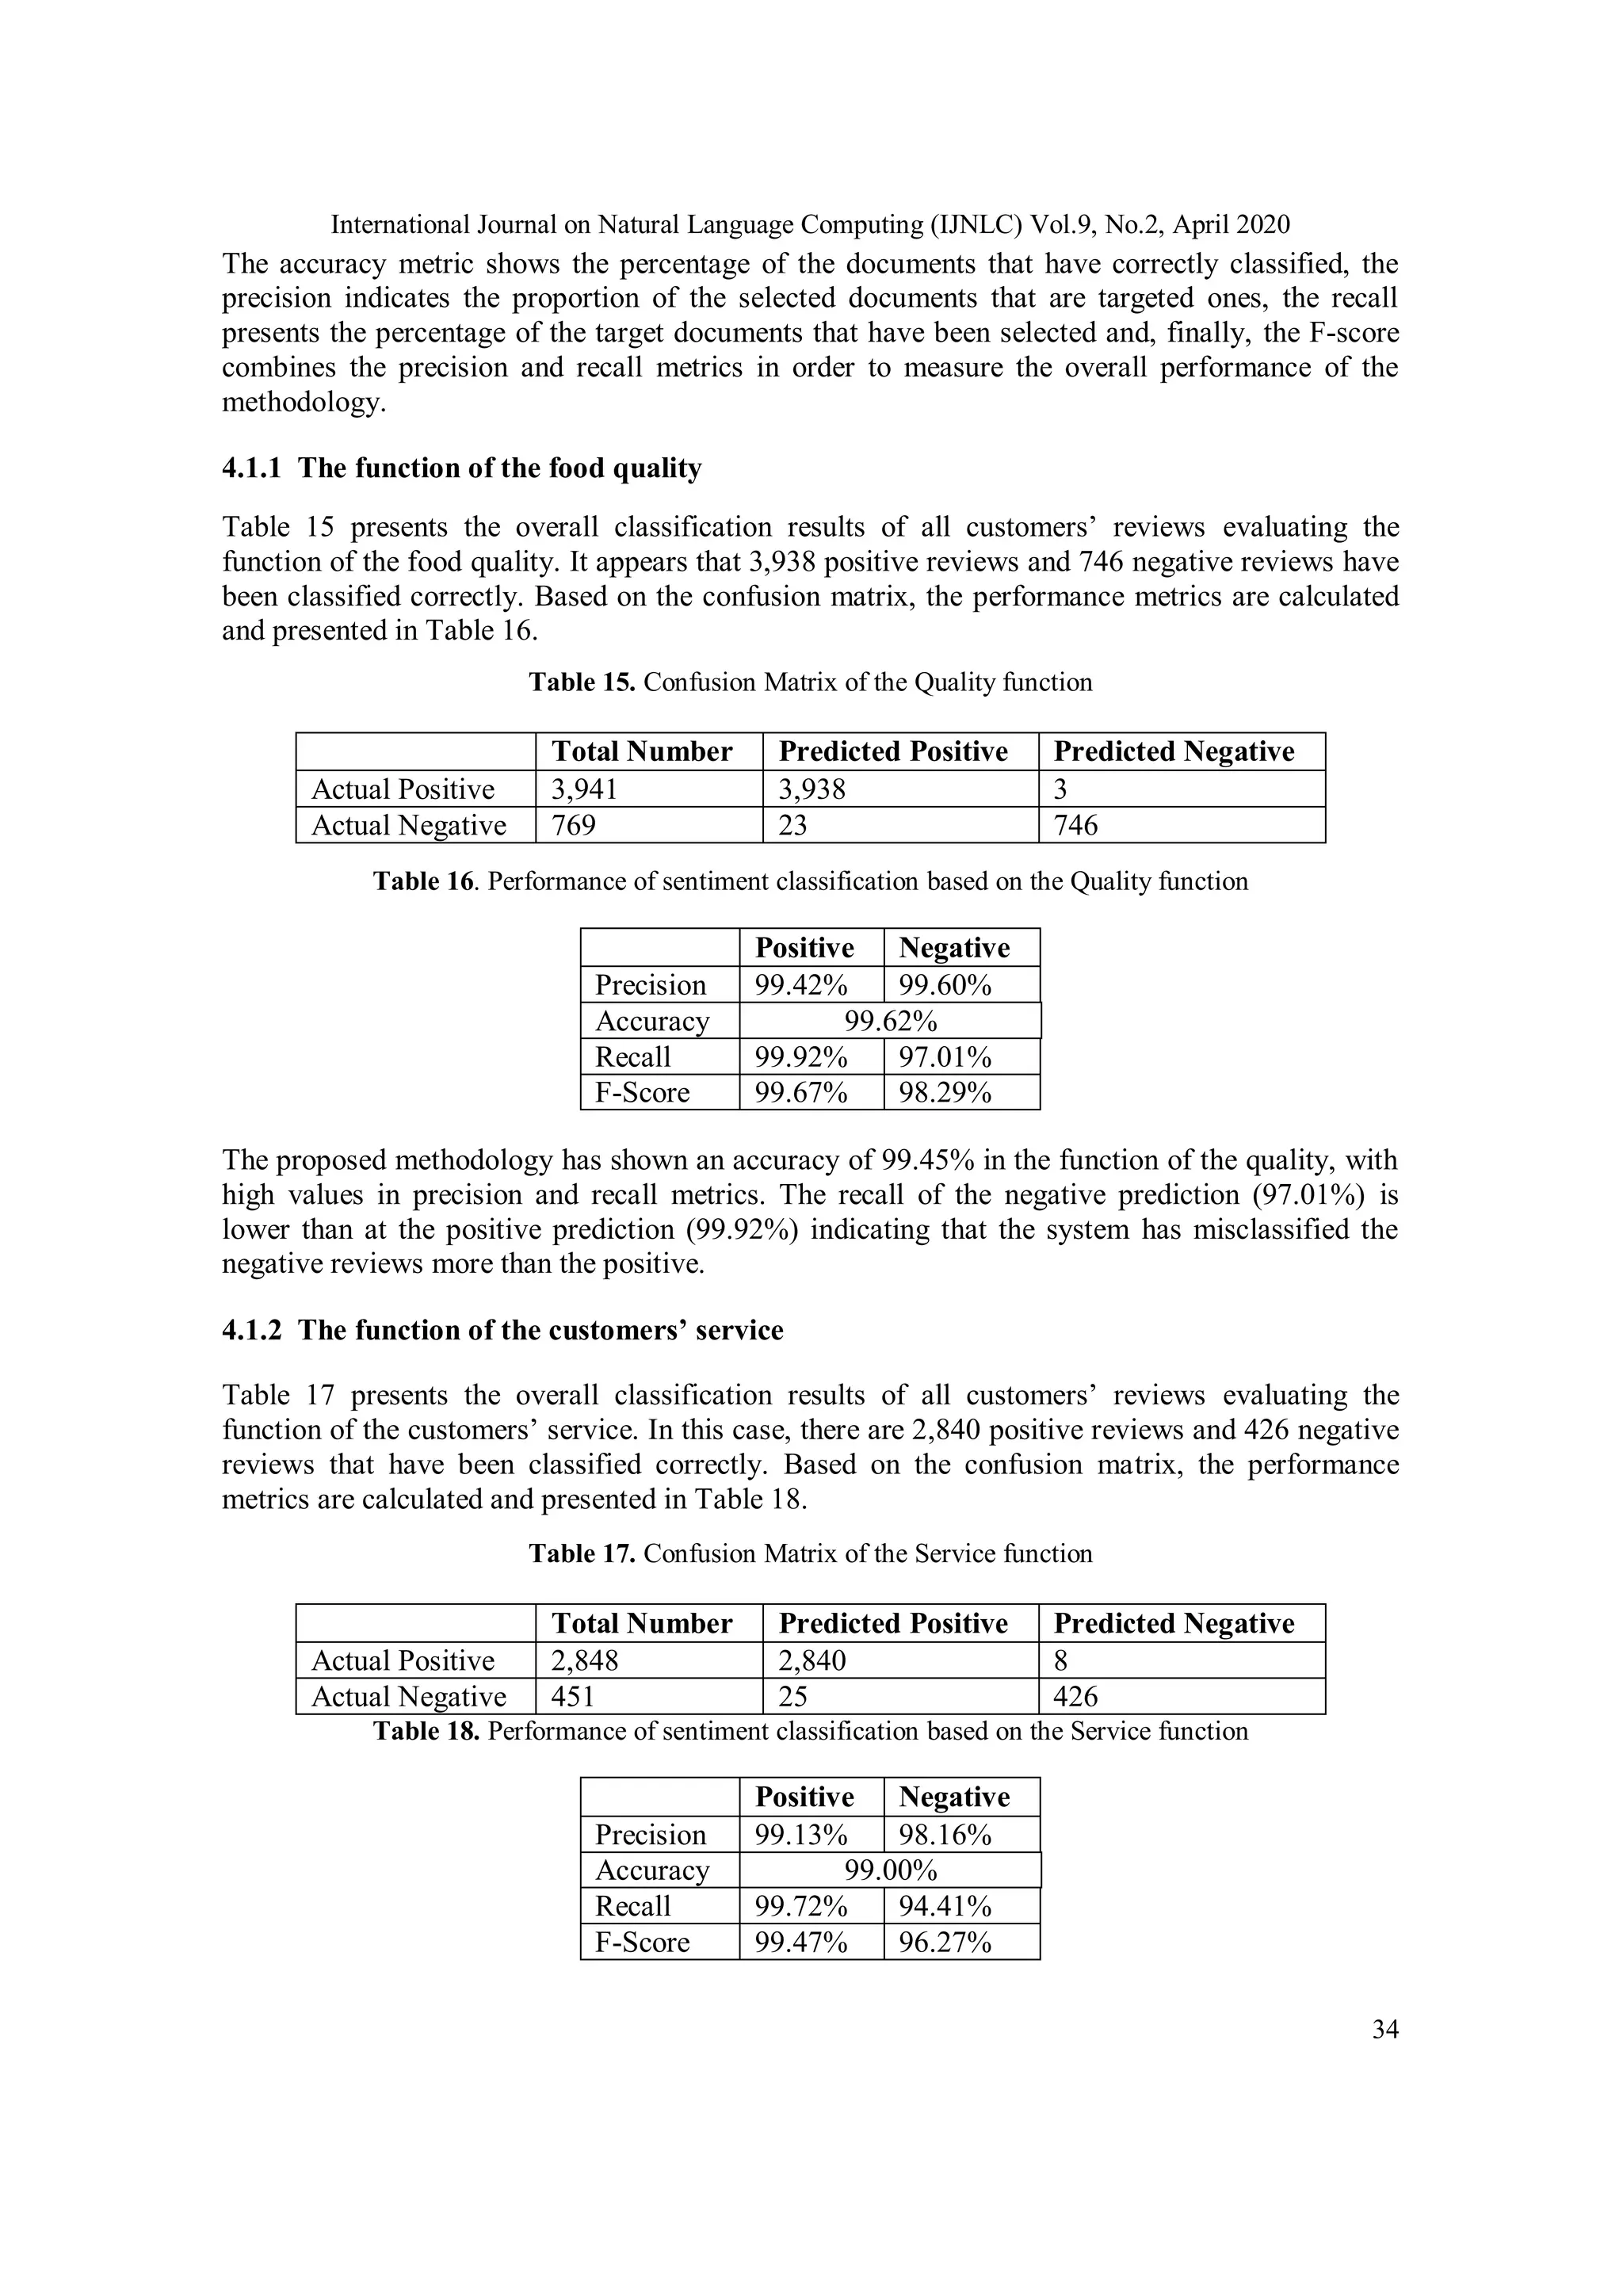
The above suggests that in our case, we may artificially reduce the number of functions
considered. This is because, the functions Quality of food, Customer Service, and Image of the
Company have low values of the tf-idf metric, i.e. lower than some experimentally determined
threshold (see Table 4 column 2). Note that, the terms of the dictionaries DoP and DoQn of the
removed functions Pricing and the Quantity of food will be distributed in the other three
dictionaries.
Finally, some adjectives could be characterized as controversial terms because they can be used
to describe two or more of the examined functions (e.g. good food, good staff, good prices, and
good size). For example, as we can see in Tables 6 and 7, the adjective “καλός” (good) is
included in both, the quality and the customer service dictionary. From the analysis, we
concluded that the controversial terms have different polarities depending on the function they
describe, e.g., the term “good” shows a polarity of 4.20 in DoQl and a polarity of 3.90 in DoS. To
overcome this problem, all customers’ reviews with at least one controversial adjective were
checked manually. In this way, all the terms were placed in the correct function.
2.3. Aspects of extraction
After the computing of words’ frequencies and the construction of the proposed dictionaries, the
next step was to identify the aspects that evaluated by the customers. From the inspection of the
reviews and the application of some linguistic rules, we concluded that all the aspects referred to
the F&B functions are nouns. Thus, the Part-of-Speech (POS) tagging methodology [37] was
implemented in order to separate the nouns from the rest parts of the speech. Therefore, three lists
of nouns, entitled F, S and I were developed. The list F for food includes 286 nouns, e.g. pizza,
pasta, etc., the list S for customer service includes 81 nouns, e.g. delivery, order, etc., and finally,
the list I for the image of the company includes 24 nouns, e.g. shop, atmosphere, etc. The aspects
evaluated most in the list F are the nouns “καφές” (coffee) and “φαγητό” (food). In the case of the
list S, the most evaluated aspects are the nouns “εξυπηρέτηση” (service), and “ντελίβερι”
(delivery boy). Finally, as far as the image of the company is concerned, the most evaluated
aspects are the nouns “εστιατόριο” (restaurant) and “μαγαζί” (shop).
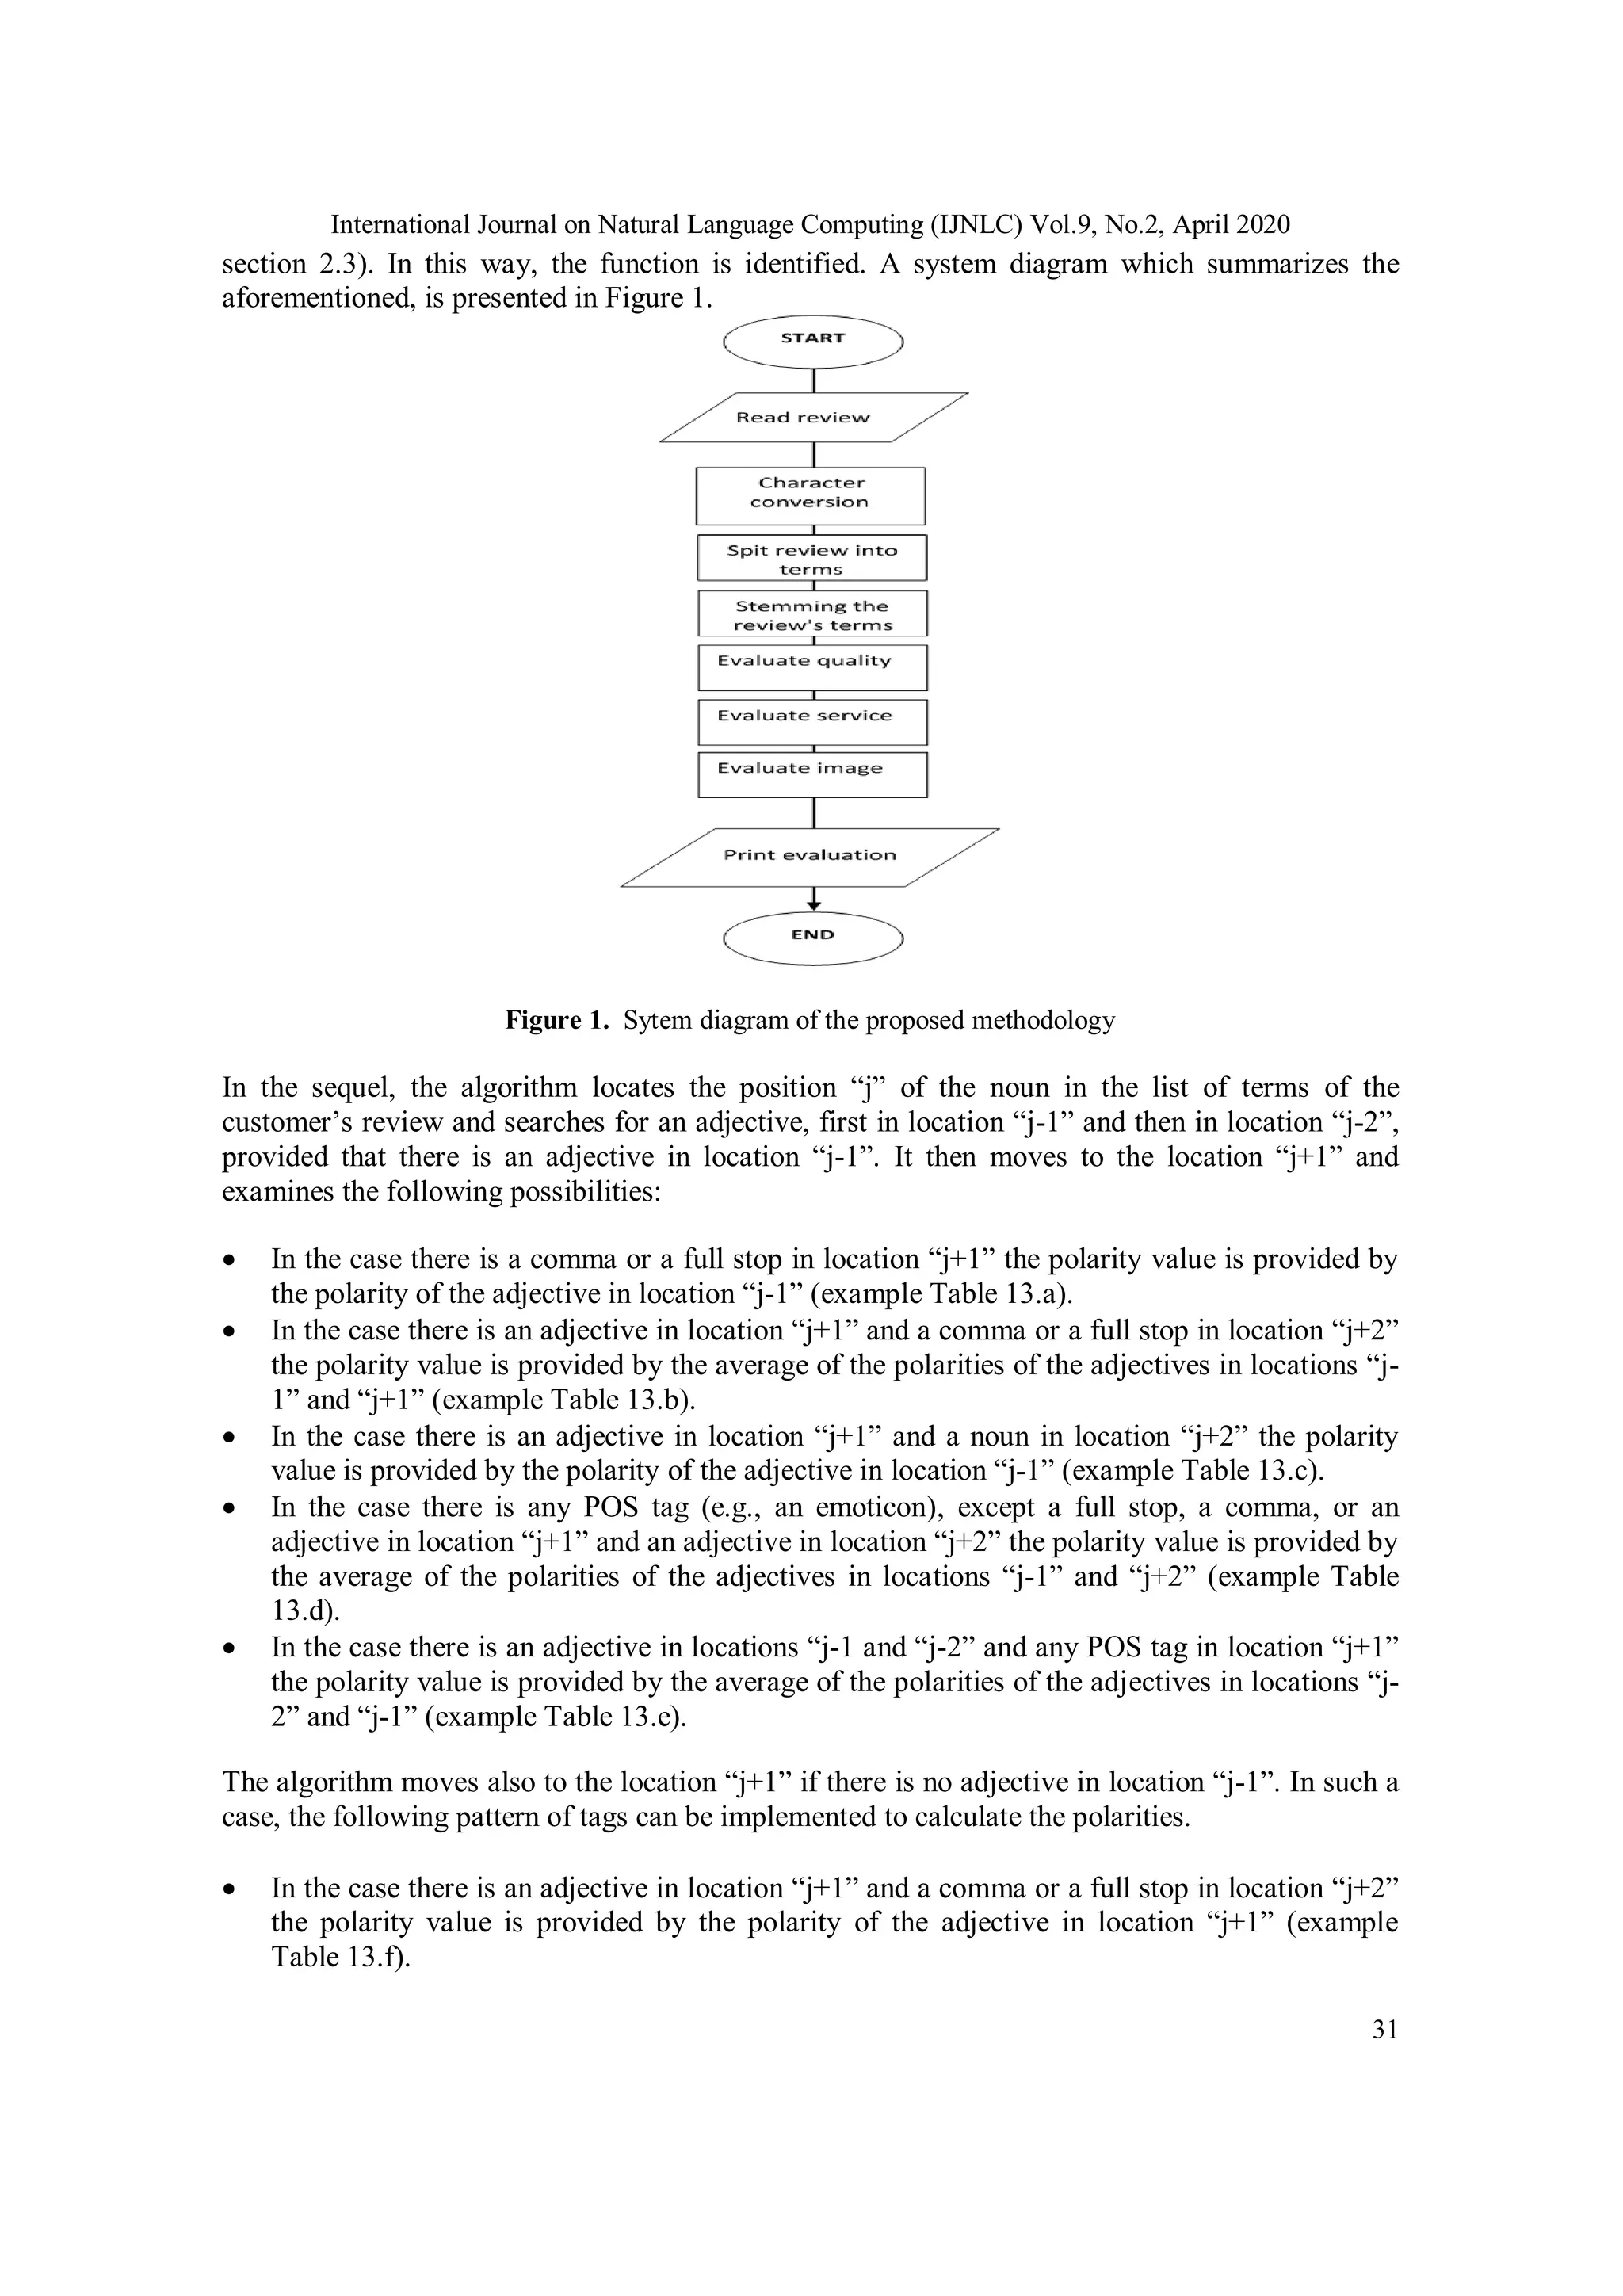
3. THE PROPOSED METHODOLOGY
3.1 Sentiment aggregation
Following similar methodologies in other languages [3, 17, 35] and according to the BOW model,
we observe that the adjectives are con-currently occur with the nouns in most of the cases. This
means that the adjectives should act as sentiment orientation indicators in customers’ reviews
concerning the F&B sector. In order to confirm this statement, the Pointwise Mutual Information
(PMI) measure was implemented. The PMI measure, say 𝐼(𝑤1, 𝑤2), is a theoretic measure (mutual
information) that compares the joint probability 𝑃(𝑤1, 𝑤2) of observing two words, say the word
𝑤1and the word 𝑤2 together with the probabilities of observing the words 𝑤1and 𝑤2 independently
[7]. It is defined as:
𝐼(𝑤1, 𝑤2) = log2
𝑃(𝑤1, 𝑤2)
𝑃(𝑤1)𝑃(𝑤2)
Where:
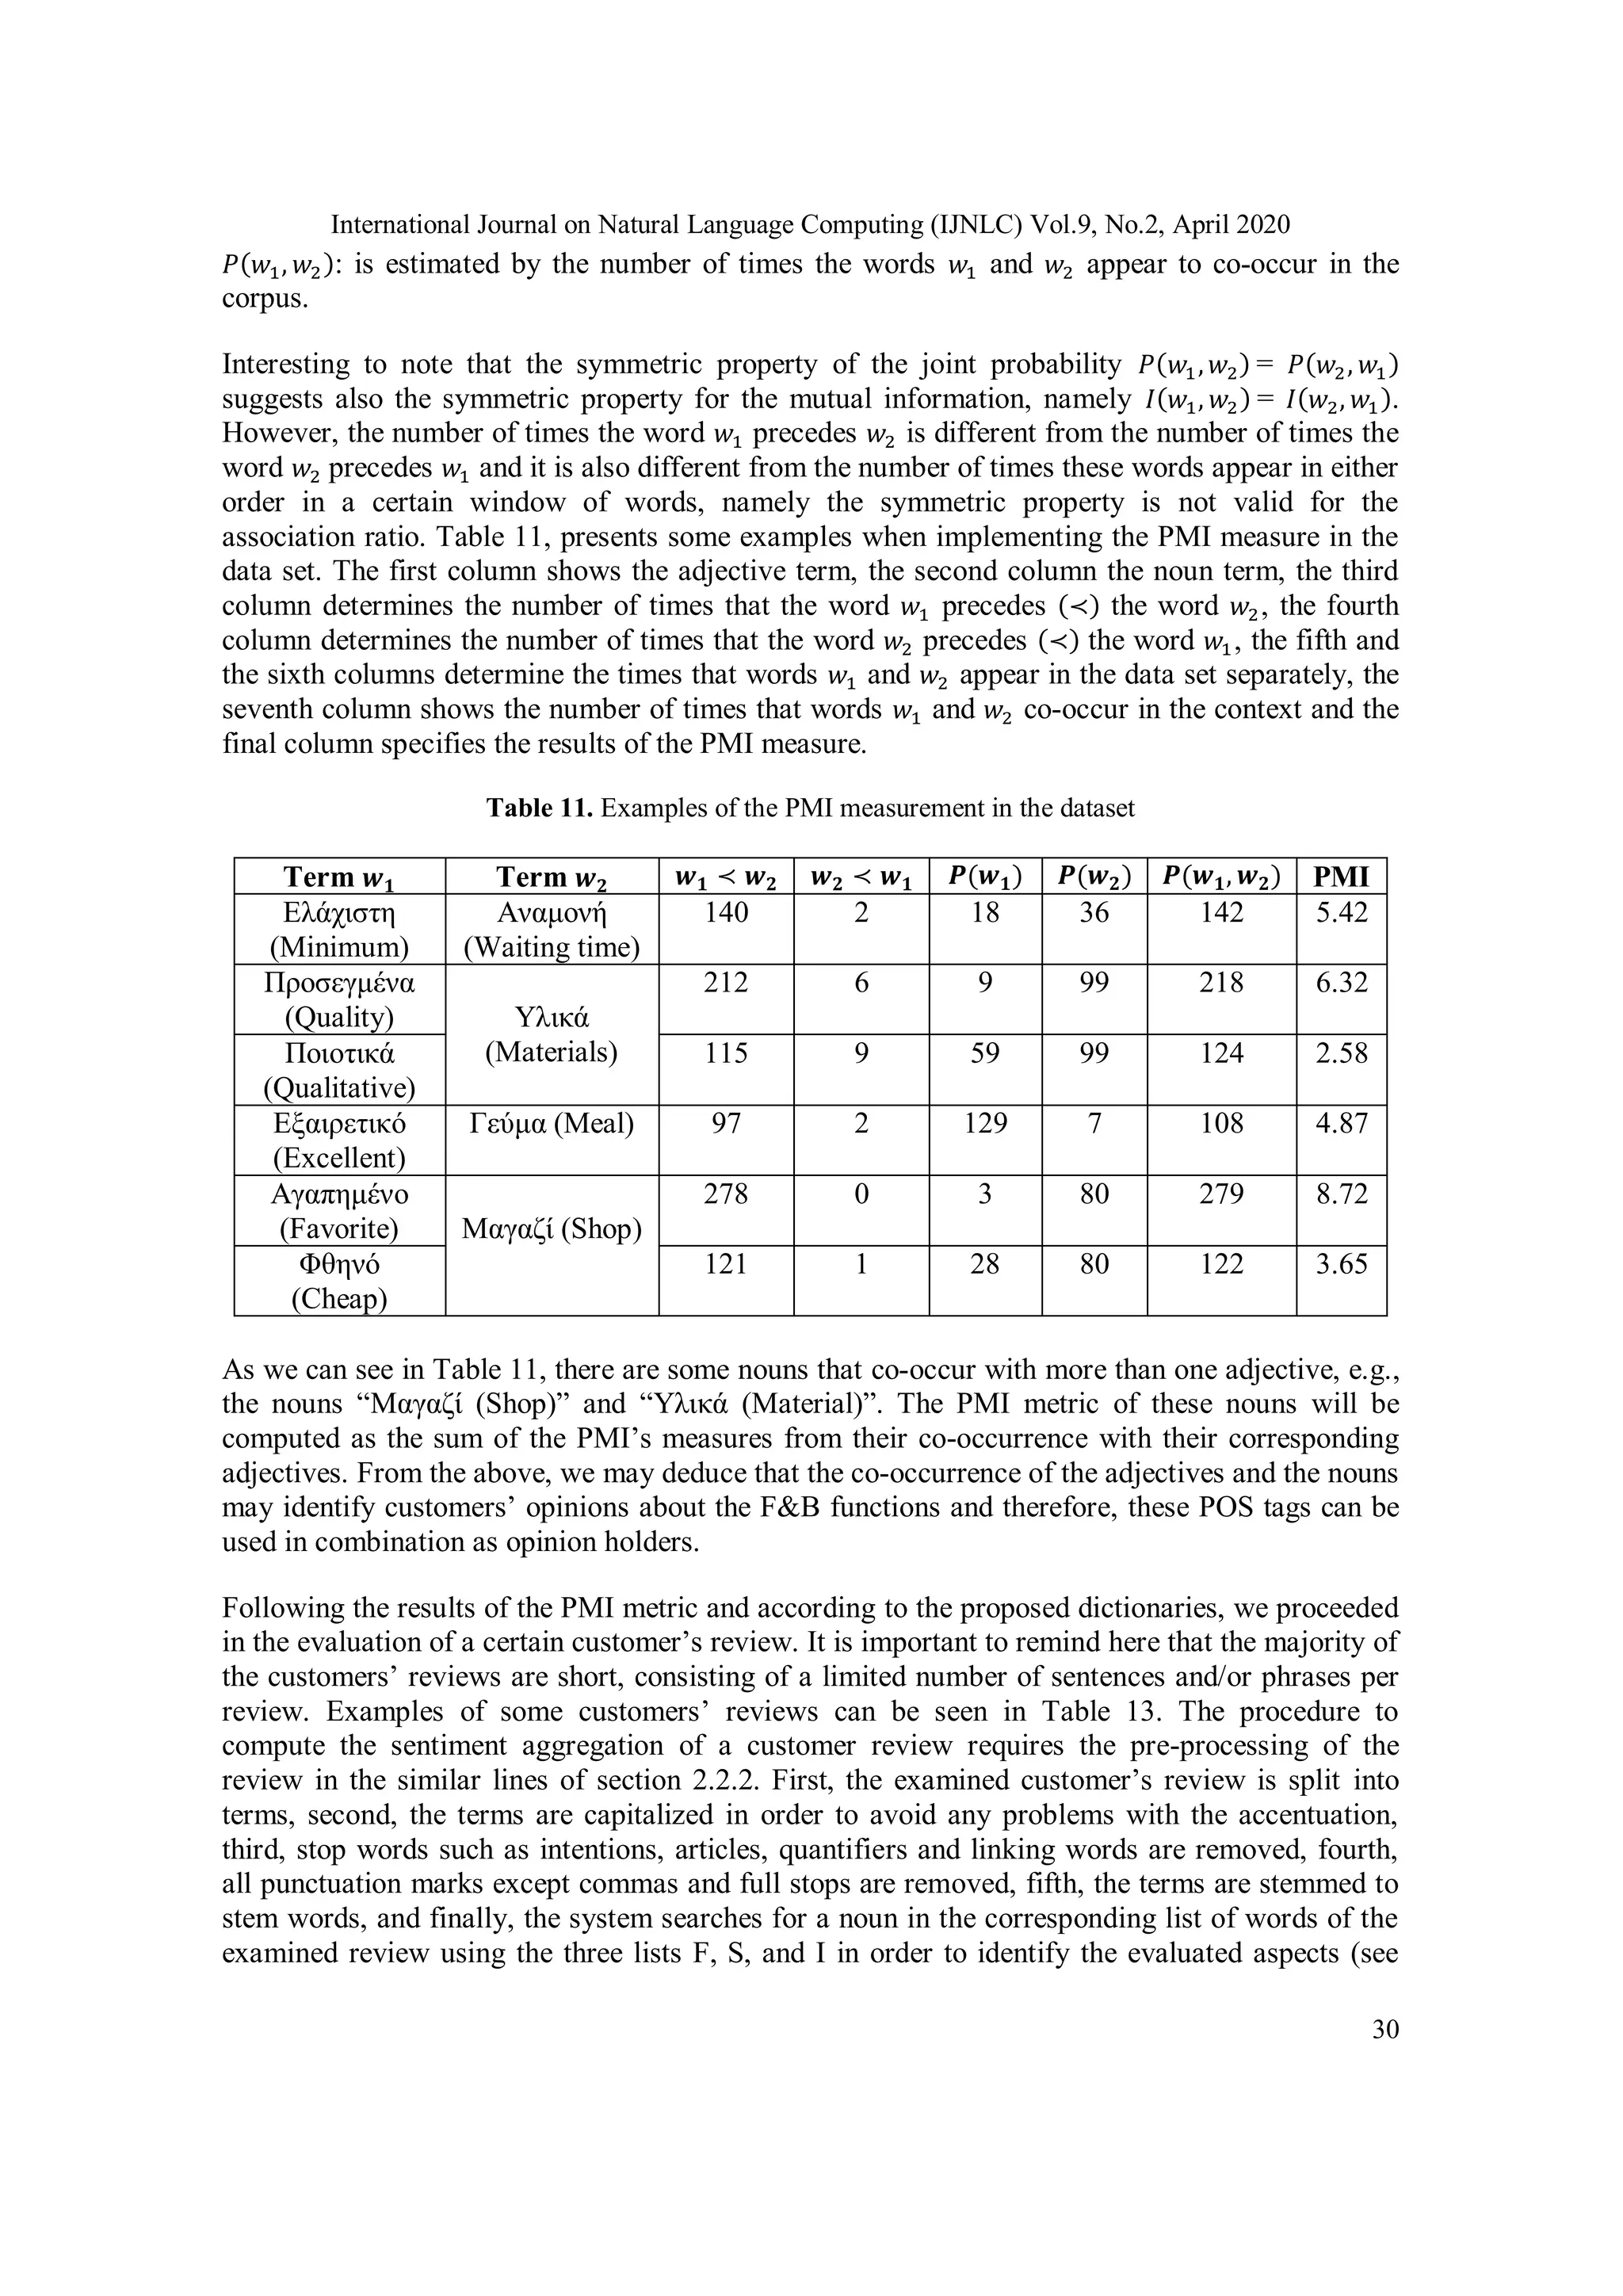
𝑃(𝑤1): is estimated by the number of times the word 𝑤1 appears in the corpus.
𝑃(𝑤2): is estimated by the number of times the word 𝑤2 appears in the corpus.](https://image.slidesharecdn.com/1-200518121352/75/A-SENTIMENT-LEXICON-BASED-ANALYSIS-FOR-FOOD-AND-BEVERAGE-INDUSTRY-REVIEWS-THE-GREEK-LANGUAGE-PARADIGM-9-2048.jpg)
![International Journal on Natural Language Computing (IJNLC) Vol.9, No.2, April 2020
38
REFERENCES
[1] Athanasiou, V., Maragoudakis, M., (2017) “A novel, gradient boosting framework for sentiment
analysis in languages where NLP resources are not plentiful: a case study for modern greek”,
Algorithms, Vol. 10, No. 1, pp 34.
[2] Balage Filho, P., Avanço, L., Pardo, T., Nunes, M. D. G. V., “An improved hybrid system for
sentiment analysis in twitter messages”, In Proceedings of the 8th International Workshop on
Semantic Evaluation (SemEval 2014), Dublin, Ireland, 23-24 August 2014, pp. 428-432.
[3] Benamara, F., Cesarano, C., Picariello, A., Recupero, D. R., Subrahmanian, V. S., “Sentiment
analysis: Adjectives and adverbs are better than adjectives alone”, In Proceedings of the ICWSM,
Colorado, U.S.A, 26-28 March 2007, pp. 1-7.
[4] Blair-Goldensohn, S., Hannan, K., McDonald, R., Neylon, T., Reis, G., Reynar, J., “Building a
sentiment summarizer for local service reviews”, In Proceedings of Workshop NLP Inf. Explosion
Era, Beijing, China, 22 April 2008.
[5] Brody, S., Elhadad, N., “An unsupervised aspect-sentiment model for online reviews”, In Human
Language Technologies: The 2010 Annual Conference of the North American Chapter of the
Association for Computational Linguistics, Los Angeles, California, 2-4 June 2010, pp. 804-812.
[6] Chong, A. Y. L., Li, B., Ngai, E. W., Ch’ing, E., Lee, F, (2016) “Predicting online product sales via
online reviews, sentiments, and promotion strategies: A big data architecture and neural network
approach”, International Journal of Operations & Production Management, Vol. 36, No. 4, pp 358-
383.
[7] Church, K.W., Hanks, P., (1990) “Word association norms, mutual information, and lexicography”,
Computational linguistics, Vol.16 No. 1, pp 22-29.
[8] Farra, N., Challita, E., Assi, R. A., Hajj, H., “Sentence-level and document-level sentiment mining
for Arabic texts”, In Proceedings of the IEEE international conference on data mining workshops,
Sydney, Australia, 13 December 2010, pp. 1114-1119.
[9] Feldman, R, (2013) “Techniques and applications for sentiment analysis”, Communications of the
ACM, Vol. 56, No. 4 , pp. 82-89.
[10] Gabriel, M., (2018) “Application of the Bag-of-Words Algorithm in Classification the Quality of
Sales Leads Application”, In International Conference on Artificial Intelligence and Soft
Computing, pp. 615-622, Springer, Cham.
[11] Gamon, M., Aue, A.,” Automatic identification of sentiment vocabulary: exploiting low association
with known sentiment terms”, In Proceedings of the ACL Workshop on Feature Engineering for
Machine Learning in Natural Language Processing, Ann Arbor, Michigan, 29 June 2005, pp.57-64.
[12] Ganu, G., Elhadad, N., Marian, A., “Beyond the stars: improving rating predictions using review text
content”, In Proceedings of the 12th International Workshop on the Web and Databases, Rhode
Island, USA, 28 June 2009, pp. 1-6.
[13] Giatsoglou, M., (2017) “Sentiment analysis leveraging emotions and word embeddings”, Expert
Systems with Applications, Vol. 69, pp. 214-224.
[14] Hatzivassiloglou, V., and McKeown, K., (1997) “Predicting the semantic orientation of adjectives”,
In proceedings of 35th
Meeting of the Association of Computational Linguistics, pp.174-181,
Madrid, Spain.
[15] Hennig-Thurau, T., Gwinner, K. P., Walsh, G., Gremler, D. D., (2004) “Electronic word-of-mouth
via consumer-opinion platforms: what motivates consumers to articulate themselves on the
internet?”, Journal of interactive marketing, Vol. 18, No.1, pp. 38-52.
[16] Hofmann, T., (2001) “Unsupervised learning by probabilistic latent semantic analysis”, Machine
learning, Vol. 42, No.1-2, 177-196.](https://image.slidesharecdn.com/1-200518121352/75/A-SENTIMENT-LEXICON-BASED-ANALYSIS-FOR-FOOD-AND-BEVERAGE-INDUSTRY-REVIEWS-THE-GREEK-LANGUAGE-PARADIGM-18-2048.jpg)
![International Journal on Natural Language Computing (IJNLC) Vol.9, No.2, April 2020
39
[17] Hu, N., Liu, L., Zhang, J.J., (2008) “Do online reviews affect product sales? The role of reviewer
characteristics and temporal effects”, Information Technology and Management, Vol. 9, No.3, pp.
201-214.
[18] Hu X., Liu H. (2012) “Text Analytics in Social Media”. In: Aggarwal C., Zhai C. (eds) Mining Text
Data. Springer, Boston, MA.
[19] Jo, Y., Oh, A.H., “Aspect and sentiment unification model for online review analysis”, In
Proceedings of the fourth ACM international conference on Web search and data mining, Hong
Cong, China, 9-12 February 2011, pp.815-824.
[20] Joachims, T. A, “Statistical Learning Model of Text Classification for Support Vector Machines”, In
Proceedings of SIGIR-01, 24th ACM International Conference on Research and Development in
Information Retrieval, New Orleans, Louisiana, USA, pp. 128-136.
[21] Lewis, D. D., “Naïve (Bayes) at forty: The independent assumption in information retrieval”, In
Proceedings of ECML-98, 10th European Conference on Machine Learning, Chemnitz,
Germany,21-23 April 1998, pp. 4 -15.
[22] Liapakis, A., Tsiligiridis, T., “Sentiment Analysis in the Food Sector: The Greek Case”, In
Proceedings of the 7th International Symposium and 29th National Conference on Operational
Research, Chania, Crete, 14-16 June 2018, pp. 51-55.
[23] Liu, B., (2012) “Sentiment analysis and opinion mining”, Synthesis lectures on human language
technologies, Vol. 5, No.1, pp.1-167.
[24] Luo, T., Chen, S., Xu, G., & Zhou, J. (2013) Trust-based collective view prediction, Springer.
[25] Markopoulos, G., Mikros, G., Iliadi, A., Liontos, M., (2015) “Sentiment analysis of hotel reviews in
Greek: a comparison of unigram features”, Cultural Tourism in a Digital Era Springer, pp. 373-383.
[26] Mudambi, S.M., Schuff, D., (2010) “What makes a helpful review?”, A study of customer reviews
on Amazon. com. MIS Quarterly, Vol. 34, No. 1, 185-200.
[27] Nallapati, R., Cohen, W.W., “Link-PLSA-LDA: A New Unsupervised Model for Topics and
Influence of Blogs”, In ICWSM, Seattle, Washington, U.S.A., 30 March-2 April 2008, pp. 84-92.
[28] Ntais, G., (2006) “Development of a Stemmer for the Greek Language”, Master Thesis, Department
of Computer and Systems Sciences at Stockholm University/Royal Institute of Technology, Kista
Sweden, February.
[29] Palogiannidi, E. et al., "Affective lexicon creation for the Greek language.", In Proceedings of the
Tenth International Conference on Language Resources and Evaluation (LREC'16), pp. 2867-2872.
2016.
30] Pang, B., Lee, L., (2008) “Opinion mining and sentiment analysis. Foundations and Trends®”, in
Information Retrieval, Vol. 2, No. 1–2, pp. 1-135.
[31] Sauper, C., Barzilay, R., (2013) “Automatic aggregation by joint modelling of aspects and values”,
Journal of Artificial Intelligence Research, Vol. 46, pp. 89-127.
[32] Schouten, K., Frasincar, F., (2015) ”Survey on aspect-level sentiment analysis”, Transactions on
Knowledge and Data Engineering, IEEE, Vol. 28, No.3, pp. 813-830.
[33] Sharma, A., Dey, S., “A comparative study of feature selection and machine learning techniques for
sentiment analysis”, In Proceedings of the 2012 ACM research in applied computation symposium,
San Antonio, Texas, 23-26 October 2012, pp. 1-7.
[34] Spatiotis, N., Paraskevas, M., Perikos, I., Mporas, I., “Examining the Impact of Feature Selection on
Sentiment Analysis for the Greek Language”, In International Conference on Speech and Computer,
Hatfield, UK, 12-16 September 2017, pp.353-361.
[35] Taboada, M., Anthony, C., Voll, K.D., “Methods for Creating Semantic Orientation Dictionaries”, In
LREC, Genoa, Italy, 24-26 May 2006, pp. 427-432.](https://image.slidesharecdn.com/1-200518121352/75/A-SENTIMENT-LEXICON-BASED-ANALYSIS-FOR-FOOD-AND-BEVERAGE-INDUSTRY-REVIEWS-THE-GREEK-LANGUAGE-PARADIGM-19-2048.jpg)
![International Journal on Natural Language Computing (IJNLC) Vol.9, No.2, April 2020
40
[36] Tsakalidis, A., et al., (2018) "Building and evaluating resources for sentiment analysis in the Greek
language." Language resources and evaluation, Vol, 52, No. 4, pp. 1021-1044.
[37] Turney, P.D.,” Thumbs up or thumbs down? semantic orientation applied to unsupervised
classification of reviews”, In Proceedings of the 40th annual meeting on association for
computational linguistics, Philadelphia, Pennsylvania, 07-12 July 2002, pp. 417-424.
[38] Yessenalina, A., Yue, Y., Cardie, C., “Multi-level structured models for document-level sentiment
classification”, In Proceedings of the 2010 conference on empirical methods in natural language
processing, MIT Stata Center, Massachusetts, USA, 9-11 October 2010, pp. 1046-1056.
[39] Yu, B., Zhou, et al.,(2017) “Identifying Restaurant Features via Sentiment Analysis on Yelp
Reviews”, arXiv preprint arXiv:1709.08698.
[40] Yerpude, A., Phirke, A., Agrawal, A., & Deshmukh, A., (2019) “Sentiment Analysis on Product
Features Based on Lexicon Approach Using Natural Language Processing”, International Journal on
Natural Language Computing (IJNLC), Vol.8, No.3, pp. 1-15.
[41] Zhou, H., Song, F., “Aspect-level sentiment analysis based on a generalized probabilistic topic and
syntax model”, In Proceedings of the Twenty-Eighth International Florida Artificial Intelligence
Research Society Conference, Hollywood, Florida, USA, 18-20 May 2018, pp 241-244.
[42] Zhu, J., Wang, H., Tsou, B. K, Zhu, M., “Multi-aspect opinion polling from textual reviews”, In
Proceedings of the 18th ACM conference on Information and knowledge management, Hong Kong,
China, 02-06 November 2009, pp. 1799-1802.
AUTHORS
Anastasios Liapakis studied Agricultural Economics and Rural Development at the Agricultural
University of Athens. He holds a master's degree in Business Administration (MBA) with specialisation in
Food digital marketing and is currently a Ph.D. candidate in the field of big data analytics in social media
networking in the Informatics Laboratory of the Agricultural University of Athens. He has participated in
two research projects in the area of Informatics and he teaches data analytics and programming in a well-
known American College of Greece. His research interests are focused on data analytics in the food sector
in the field of e-business and e-marketing.
Theodore Tsiligiridis is a Professor in computer networks and ICT. He received his Ph.D. from the Dept
of Electronic and Electrical Engineering, University of Strathclyde, Scotland, UK. He joined the InfoLab of
the Agricultural University of Athens (AUA) and he served in various academic and public posts
coordinating many research and development projects. Recently, he coordinated two projects, the
FruitFlyNet/ENPICBCMED/EU, and the E-learning courses at the AUA funded by NSRF/EU, whereas
currently, coordinates the SALSA/Horizon2020/EU project in Greece. His core research includes traffic
modeling and performance evaluation of data networks and wireless sensor networks. He currently works
in location-based WebGIS services, remote sensing big AgriData, as well as utilizing social media
networking and big data analytics. He has published extensively in the networking and scientific literature.
He participated in many editorial boards and organizing committees of scientific journals and conferences.
Constantine Yialouris is a Professor Emeritus in Intelligent Systems in the Agricultural University of
Athens. He holds a bachelor in Mathematics from University of Athens, Greece and a PhD in Expert
Systems from Agricultural University of Athens. His research activity includes Expert Systems,
Knowledge Engineering in problems concerning bio and earth sciences, Artificial Neural Networks and
Knowledge Management. He has been participated in national and European research projects. He has
also been the leader of a post doc research programme funded by the Greek Ministry of Education and EU.
He has joined in many scientific and organizing committees of International Conferences and he is
reviewer in 10 International Journals. He is author of 7 books on Informatics (in Greek). He has also
published 28 Journal papers and 60 Conference papers in national and international peer reviewed
workshops/conferences. His published research has got a significant number of references.](https://image.slidesharecdn.com/1-200518121352/75/A-SENTIMENT-LEXICON-BASED-ANALYSIS-FOR-FOOD-AND-BEVERAGE-INDUSTRY-REVIEWS-THE-GREEK-LANGUAGE-PARADIGM-20-2048.jpg)

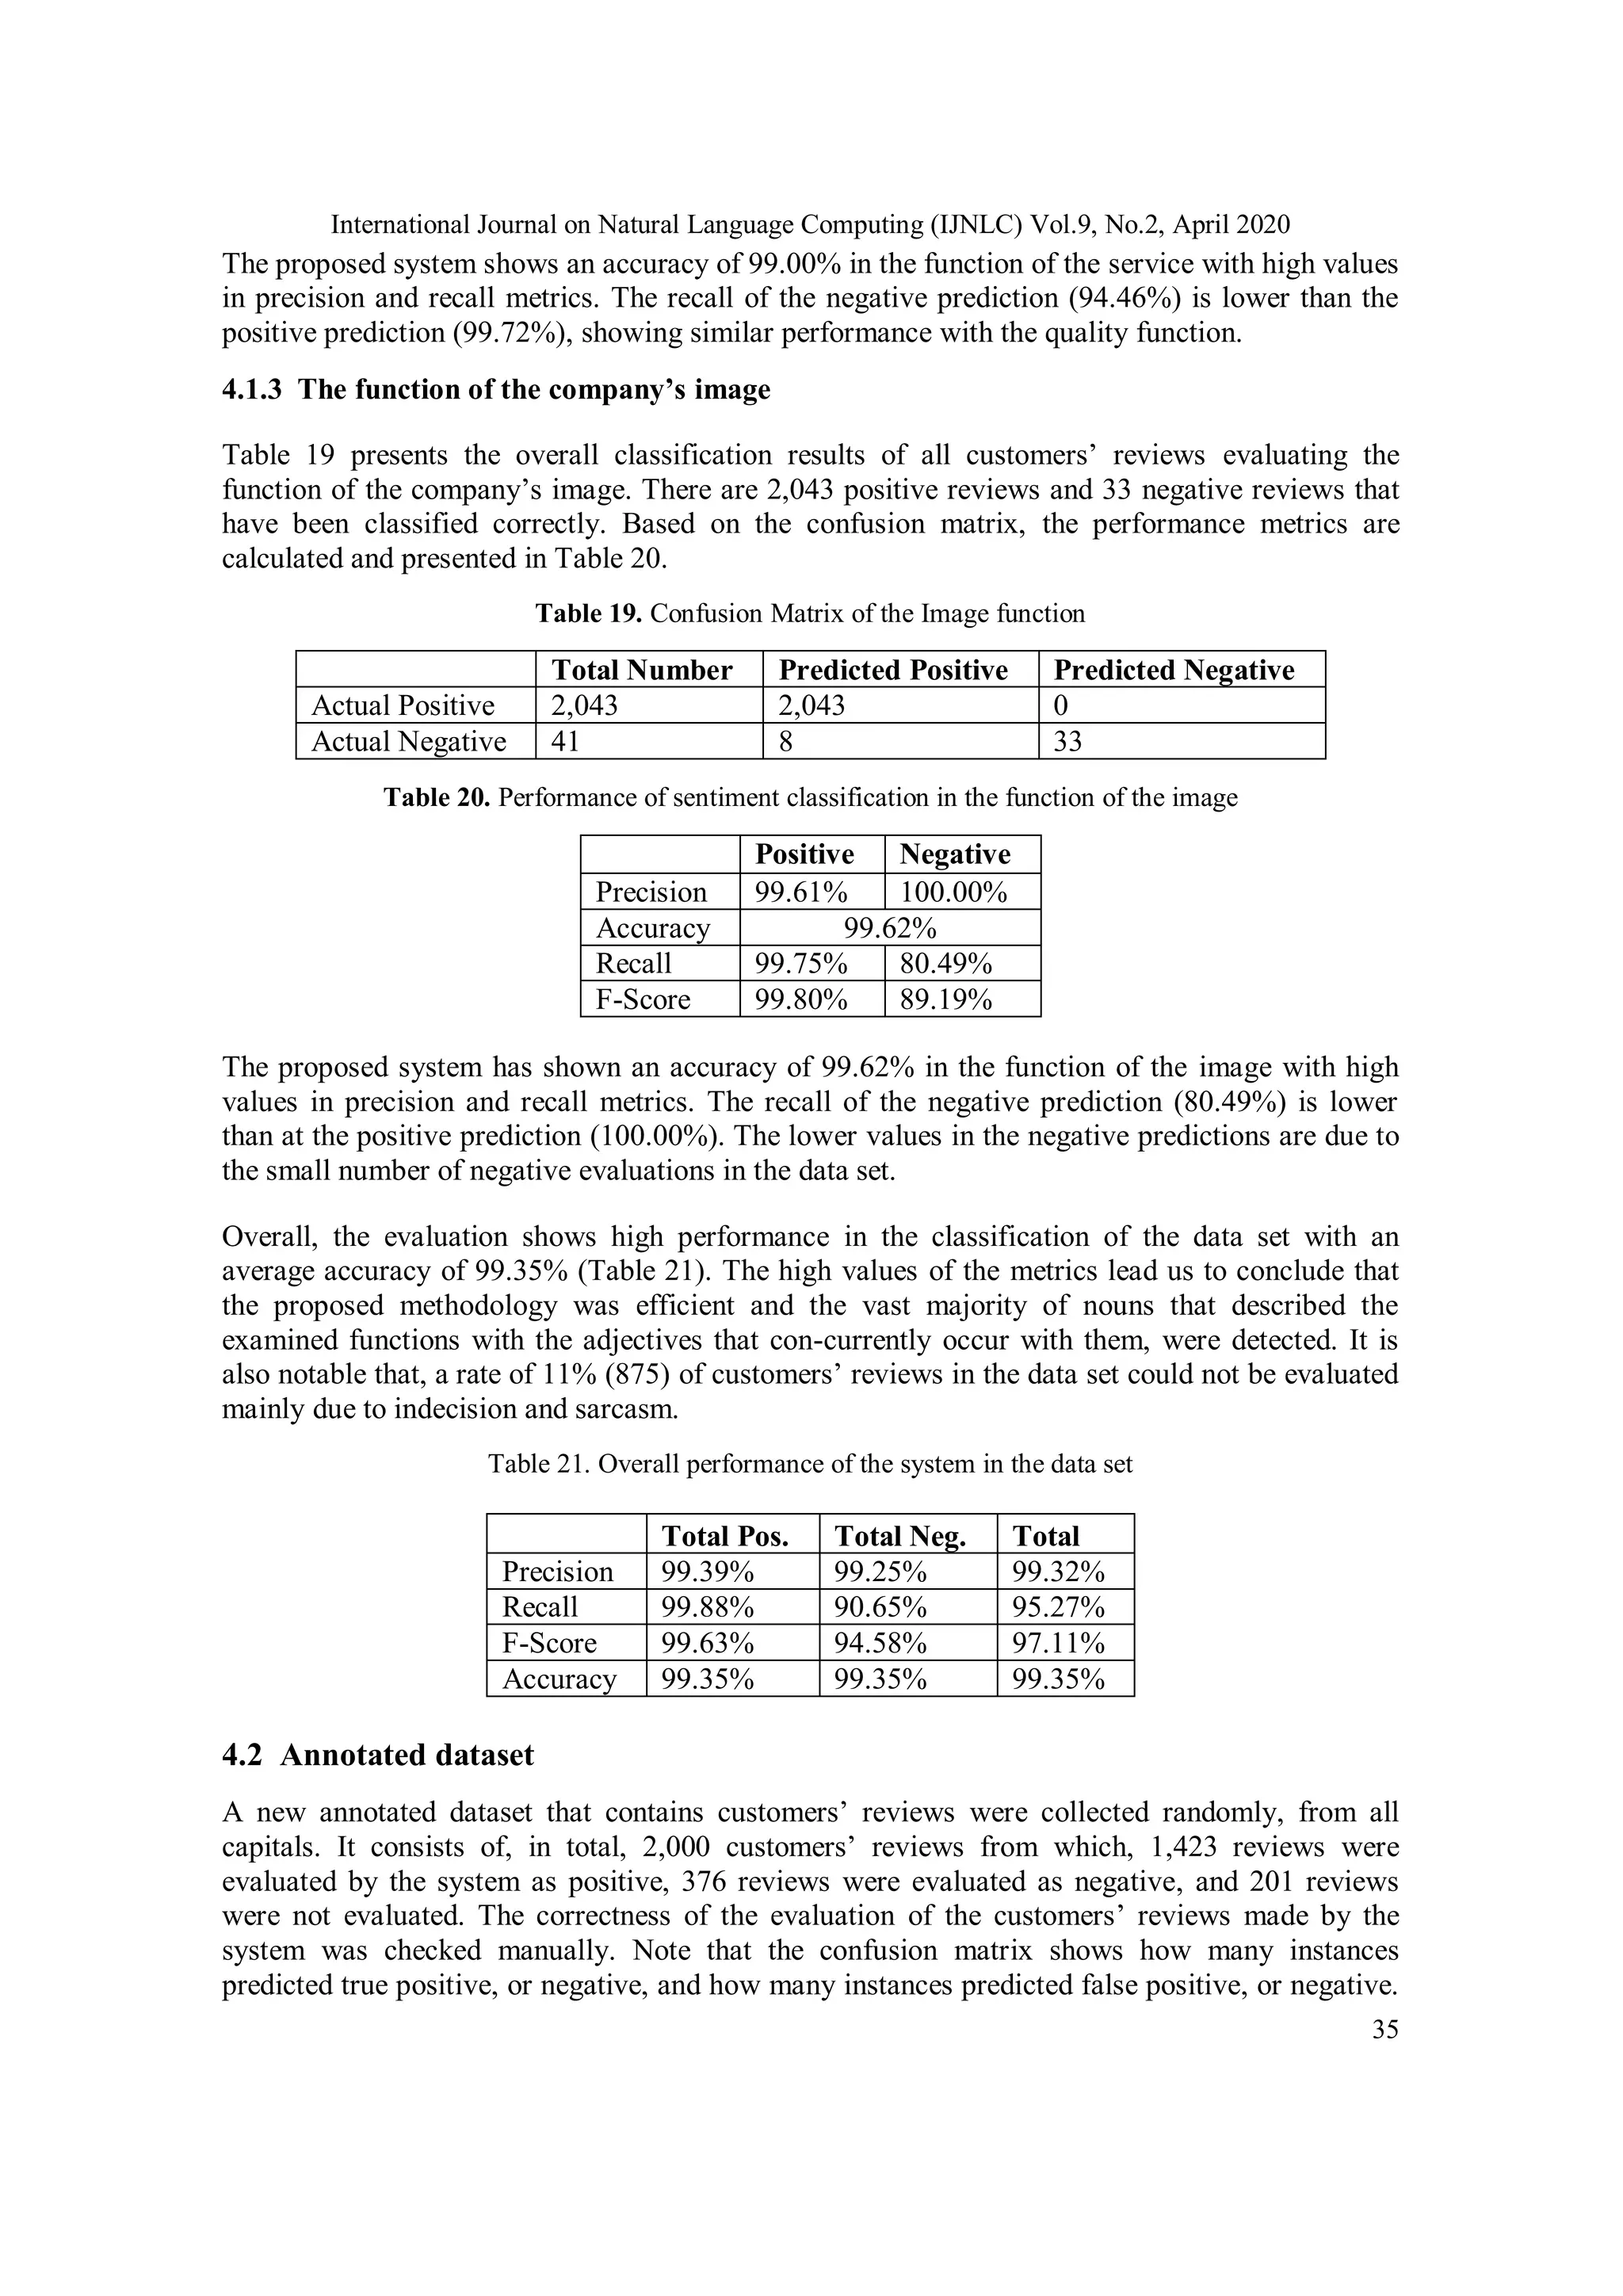
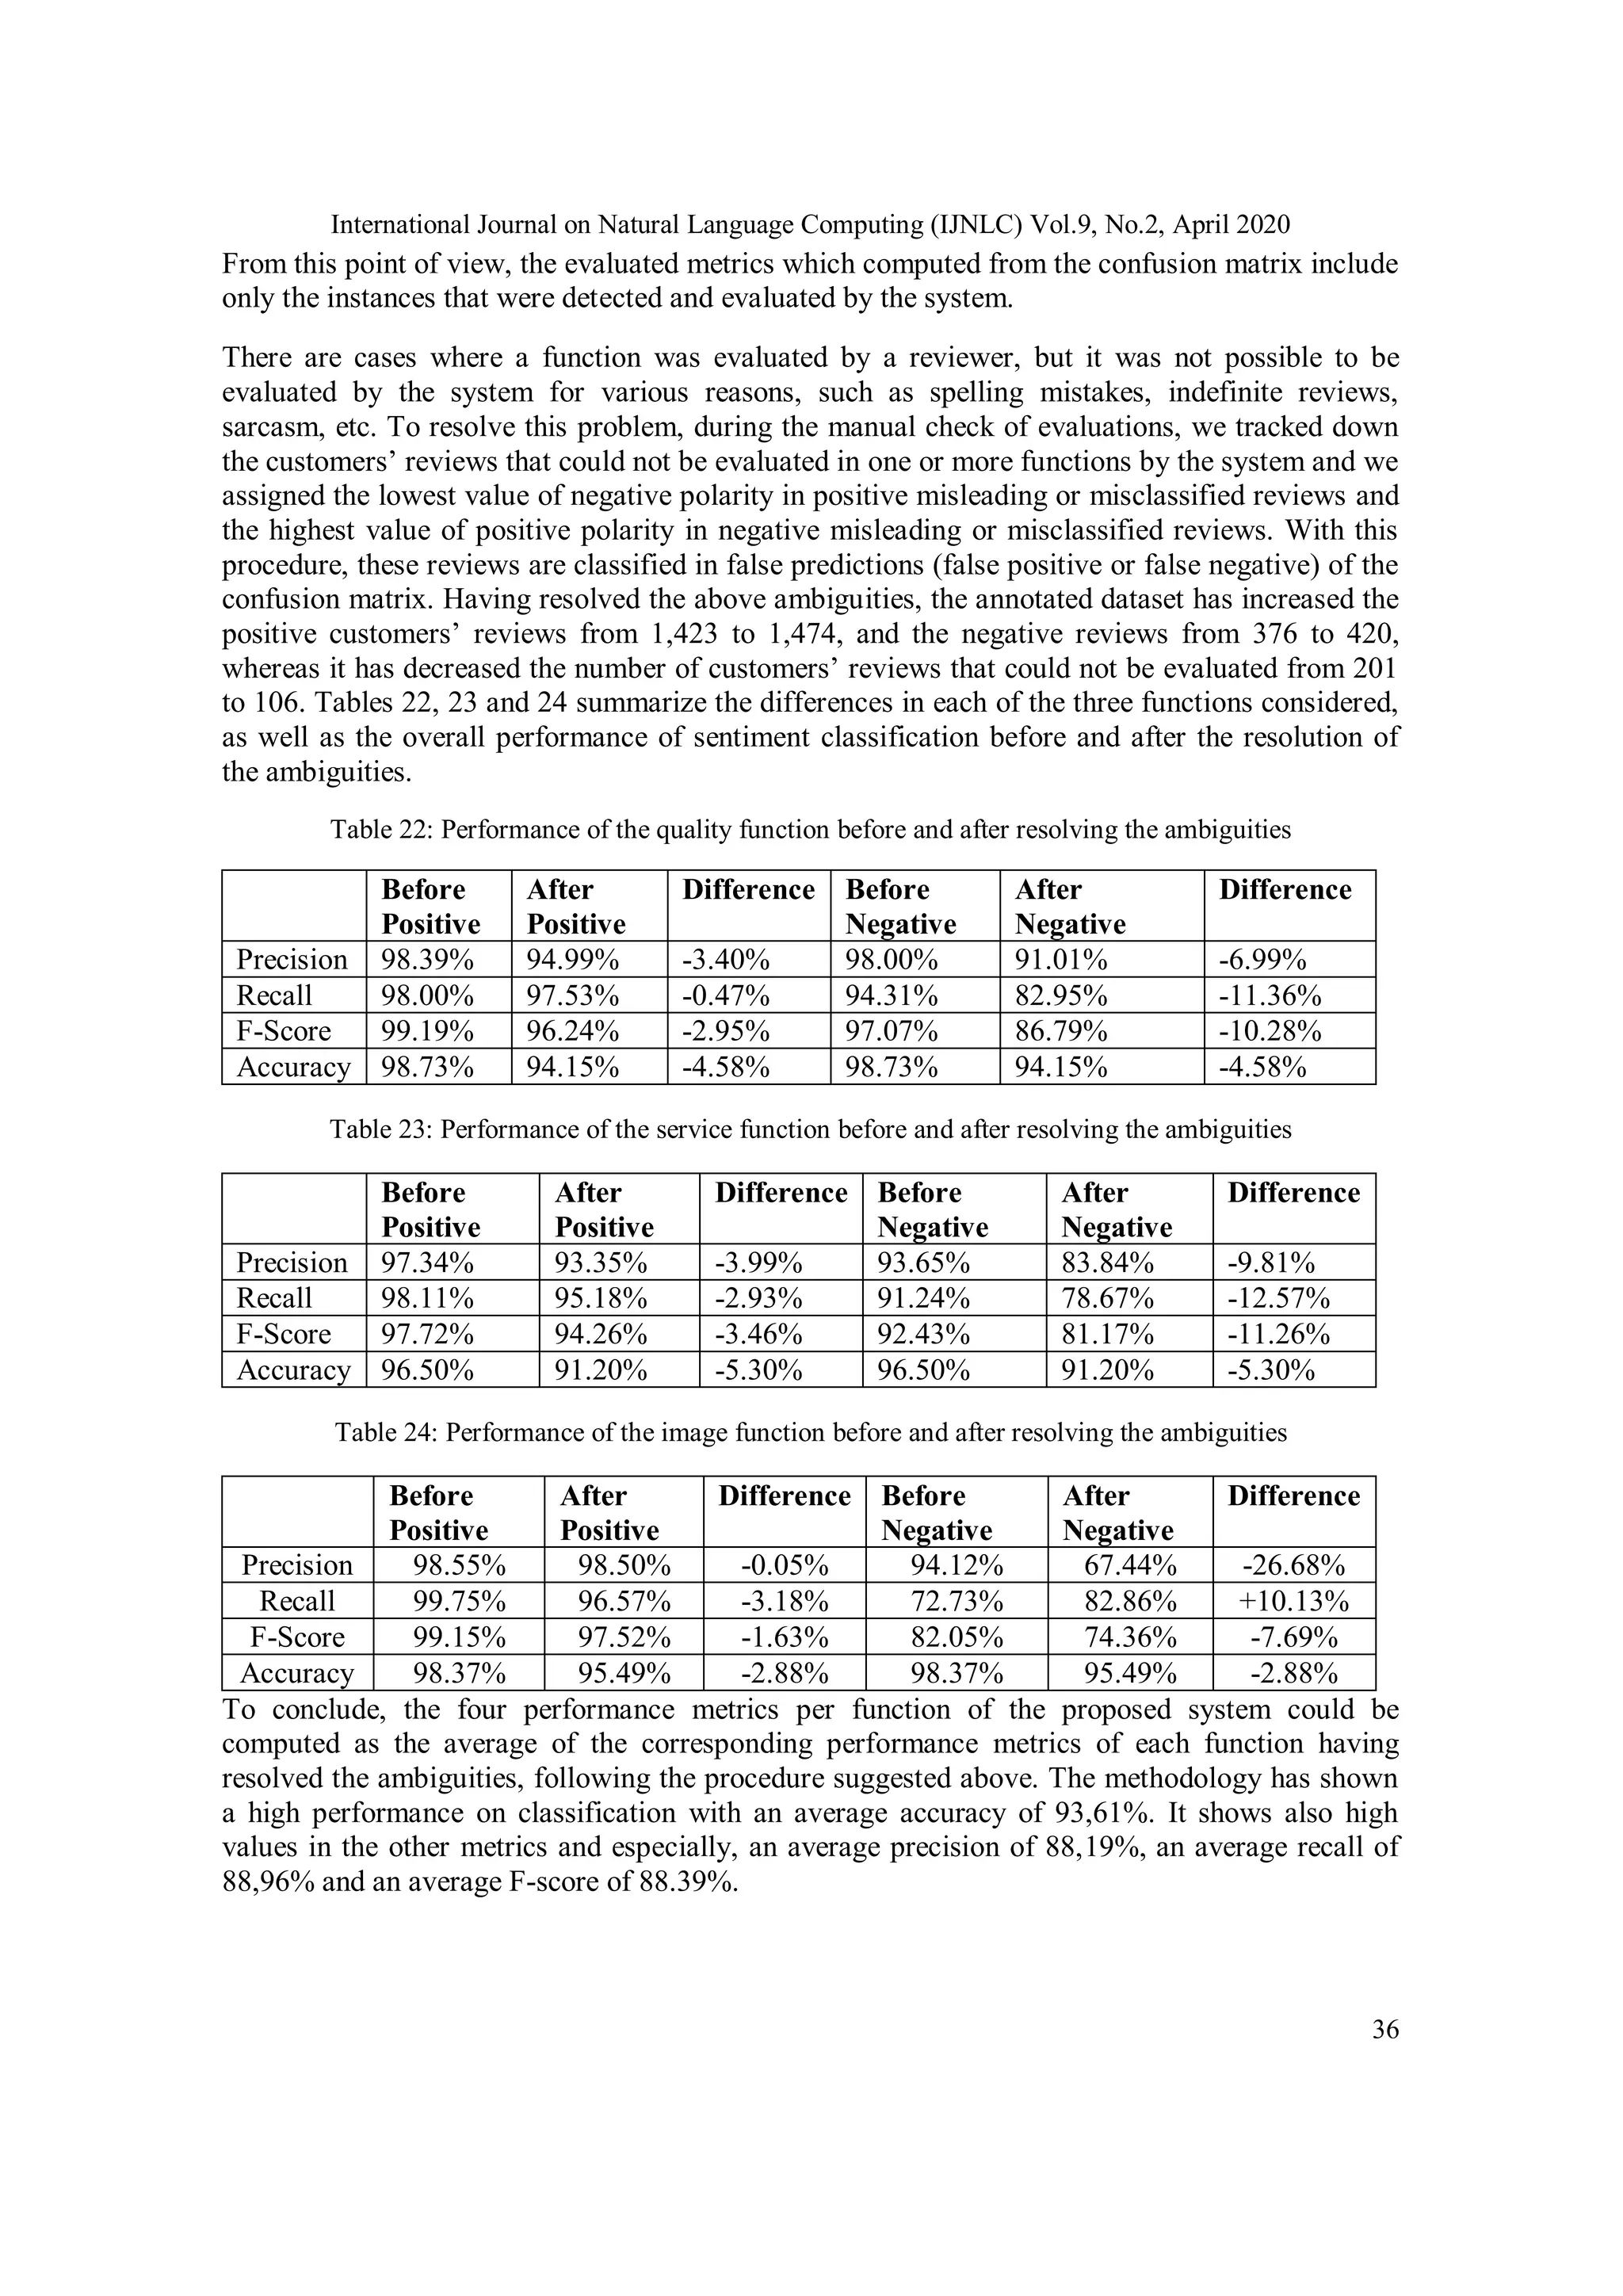
The research implements a methodology to analyze customer opinions in the Greek food and beverage sector using a sentiment lexicon-based approach, focusing on data from 8,950 reviews across 690 companies. The study addresses challenges in extracting meaningful insights from the extensive and diverse customer feedback available on online platforms, employing a corpus-based lexicon construction method to quantify sentiments related to various aspects such as food quality and service. Findings aim to enhance sentiment analysis techniques specifically for the Greek market and contribute to better understanding consumer preferences in this dynamic industry.