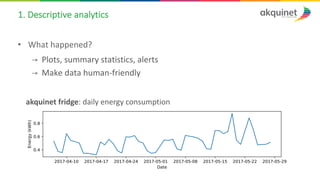
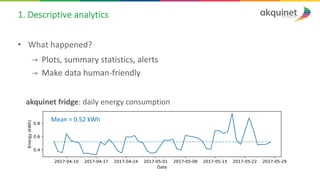
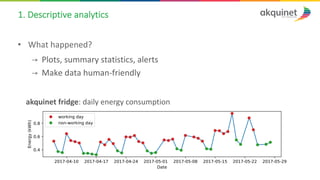
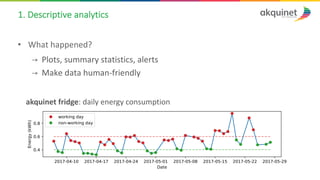
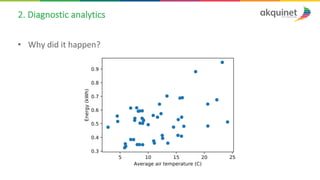
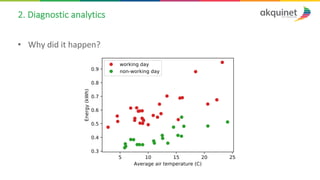
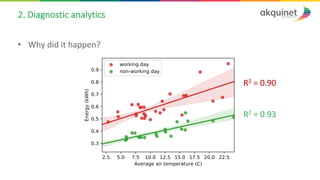
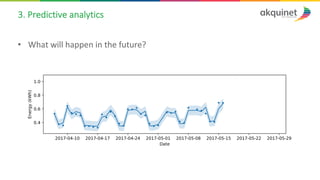
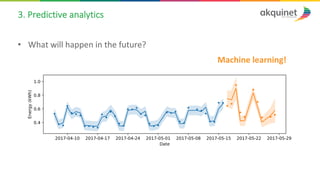
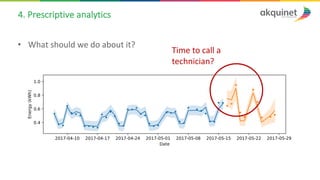
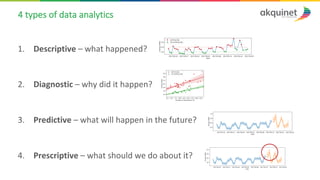
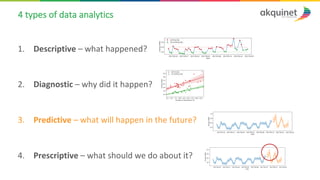
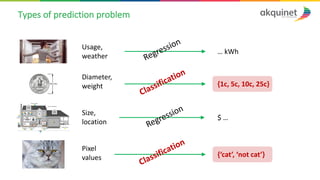
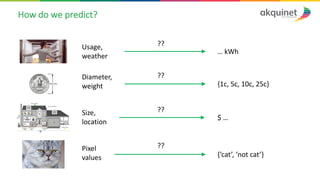
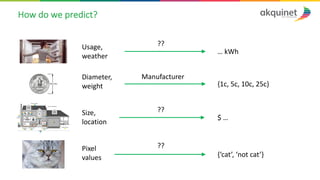
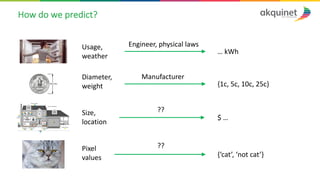
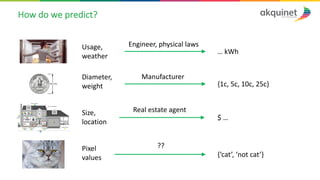
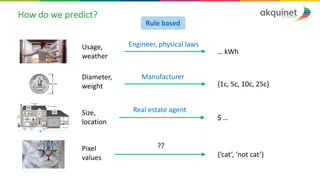
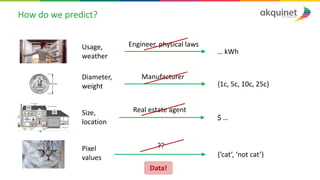
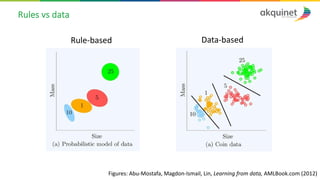
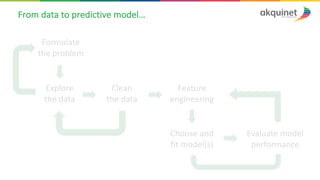
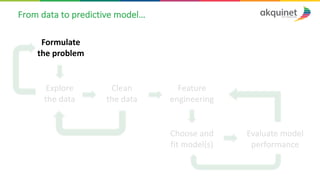
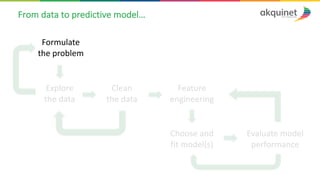
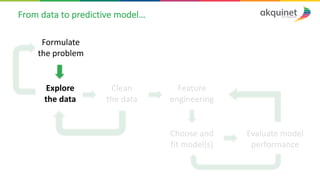
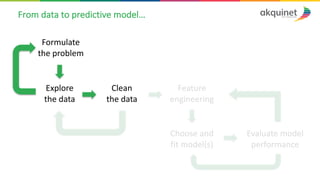
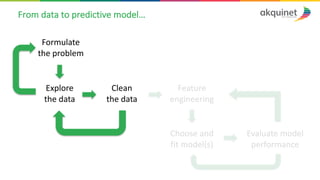
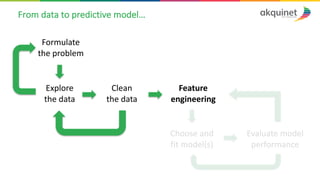
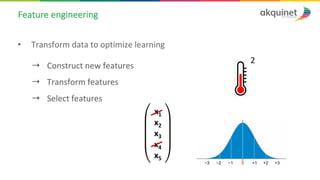
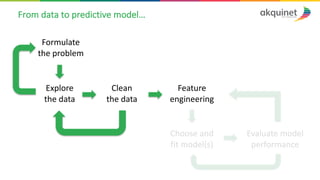
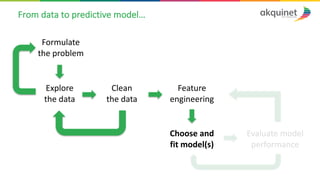
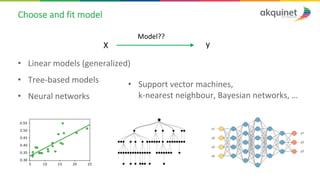
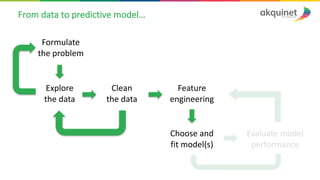
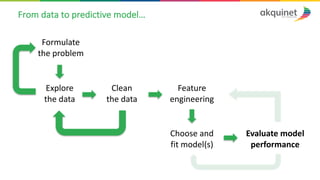
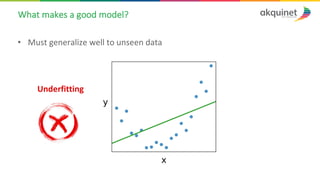
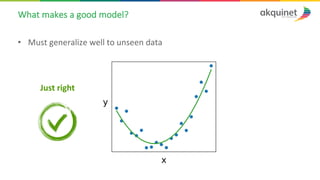
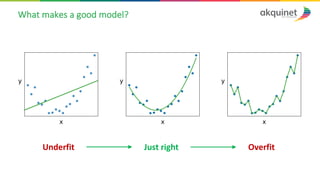
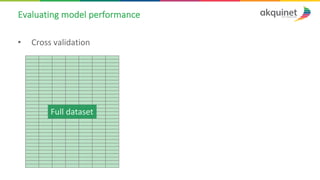
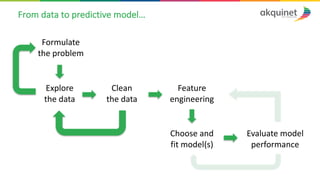
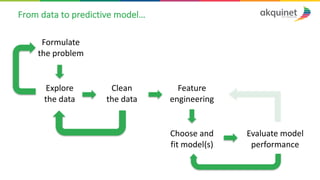
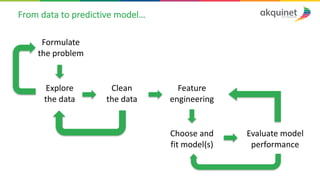
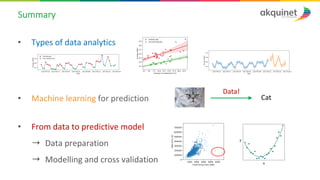
A	practical	introduction	
to	data	science	and	
machine	learning
Lisa	Torlina
lisa.torlina@akquinet.de
knowhow@akquinet.de
Introduction
2.5	million	TB	of	data	
produced	every	day
of	all	data	has	been	
generated	in	the	
last	2	years
90%
150	times!
Introduction
– John	Naisbitt
Types	of	data	analytics
1.	Descriptive	analytics
• What	happened?
→ Plots,	summary	statistics,	alerts
→ Make	data	human-friendly
akquinet fridge:	daily	energy	consumption
1.	Descriptive	analytics
• What	happened?
→ Plots,	summary	statistics,	alerts
→ Make	data	human-friendly
akquinet fridge:	daily	energy	consumption
Mean	=	0.52	kWh
1.	Descriptive	analytics
• What	happened?
→ Plots,	summary	statistics,	alerts
→ Make	data	human-friendly
akquinet fridge:	daily	energy	consumption
1.	Descriptive	analytics
• What	happened?
→ Plots,	summary	statistics,	alerts
→ Make	data	human-friendly
akquinet fridge:	daily	energy	consumption
2.	Diagnostic	analytics
• Why	did	it	happen?
2.	Diagnostic	analytics
• Why	did	it	happen?
2.	Diagnostic	analytics
• Why	did	it	happen?
R2 =	0.90
R2 =	0.93
3.	Predictive	analytics
• What	will	happen	in	the	future?
3.	Predictive	analytics
• What	will	happen	in	the	future?
Machine	learning!
4.	Prescriptive	analytics
• What	should	we	do	about	it?
Time	to	call	a	
technician?
4	types	of	data	analytics
1. Descriptive – what	happened?
2. Diagnostic – why	did	it	happen?
3. Predictive – what	will	happen	in	the	future?
4. Prescriptive – what	should	we	do	about	it?
4	types	of	data	analytics
1. Descriptive – what	happened?
2. Diagnostic – why	did	it	happen?
3. Predictive – what	will	happen	in	the	future?
4. Prescriptive – what	should	we	do	about	it?
Predictive	modelling	&	
machine	learning
The	problem	of	prediction
Price?House
Image Cat?
Fridge Energy	consumption?
Coin Denomination?
The	problem	of	prediction
• What	do	we	mean	by	prediction?
Information	we	use	to	
make	the	prediction
Quantity	we	
want	to	predict
y = f(X)
X y
??
• In	mathematical	terms:
Features Target	variable
Types	of	prediction	problem
$	…
Size,	
location
Pixel	
values {‘cat’,	‘not	cat’}
Usage,	
weather
… kWh
Diameter,	
weight {1c,	5c,	10c,	25c}
Types	of	prediction	problem
$	…
Size,	
location
Pixel	
values {‘cat’,	‘not	cat’}
Usage,	
weather
… kWh
Diameter,	
weight {1c,	5c,	10c,	25c}
Types	of	prediction	problem
$	…
Size,	
location
Pixel	
values {‘cat’,	‘not	cat’}
Usage,	
weather
… kWh
Diameter,	
weight {1c,	5c,	10c,	25c}
How	do	we	predict?
$	…
Size,	
location
Pixel	
values {‘cat’,	‘not	cat’}
Usage,	
weather
… kWh
Diameter,	
weight {1c,	5c,	10c,	25c}
??
??
??
??
How	do	we	predict?
$	…
Size,	
location
Pixel	
values {‘cat’,	‘not	cat’}
Usage,	
weather
… kWh
Diameter,	
weight {1c,	5c,	10c,	25c}
??
??
??
Manufacturer
How	do	we	predict?
$	…
Size,	
location
Pixel	
values {‘cat’,	‘not	cat’}
Usage,	
weather
… kWh
Diameter,	
weight {1c,	5c,	10c,	25c}
??
??
Manufacturer
Engineer,	physical	laws
How	do	we	predict?
$	…
Size,	
location
Pixel	
values {‘cat’,	‘not	cat’}
Usage,	
weather
… kWh
Diameter,	
weight {1c,	5c,	10c,	25c}
Real	estate	agent
??
Manufacturer
Engineer,	physical	laws
How	do	we	predict?
$	…
Size,	
location
Pixel	
values {‘cat’,	‘not	cat’}
Usage,	
weather
… kWh
Diameter,	
weight {1c,	5c,	10c,	25c}
Real	estate	agent
??
Manufacturer
Engineer,	physical	laws
Rule	based
How	do	we	predict?
$	…
Size,	
location
Pixel	
values {‘cat’,	‘not	cat’}
Usage,	
weather
… kWh
Diameter,	
weight {1c,	5c,	10c,	25c}
Real	estate	agent
??
Manufacturer
Engineer,	physical	laws
Data!
Rules	vs	data
Rule-based Data-based
Figures:	Abu-Mostafa,	Magdon-Ismail,	Lin,	Learning	from	data,	AMLBook.com (2012)
Machine	learning
Classification Regression
Machine	learning
• Prediction	based	on	data	→	model	learns	by	looking	at	examples
Classification Regression
What	can	machine	learning	do?
• Image,	speech	recognition	(>	95%	accuracy)
• Self-driving	vehicles
• DeepMind	defeated	Go	champion,							
• Recommendation	engines,	spam	filters,	fraud	detection,	text	analysis…
Google’s	energy	efficiency	by	15%
From	data	to	predictive	model:	
a	step-by-step	guide
From	data	to	predictive	model…
Formulate	
the	problem
Explore	
the	data
Clean	
the	data
Feature	
engineering
Evaluate	model	
performance
Choose	and	
fit	model(s)
From	data	to	predictive	model…
Formulate	
the	problem
Explore	
the	data
Clean	
the	data
Feature	
engineering
Evaluate	model	
performance
Choose	and	
fit	model(s)
Formulate	the	problem
• What	do	we	want	to	predict?
• What	data	could	we	use	to	do	this?
X y
Formulate	the	problem
• What	do	we	want	to	predict?
• What	data	could	we	use	to	do	this?
X y
Formulate	the	problem
• What	do	we	want	to	predict?
• What	data	could	we	use	to	do	this?
X y
Formulate	the	problem
• What	do	we	want	to	predict?
• What	data	could	we	use	to	do	this?
Energy	consumption
Weekday/holiday
Weather
E.g.	fridge
X y
Formulate	the	problem
Price
E.g.	house Size
Location
No.	rooms
Condition
…
• What	do	we	want	to	predict?
• What	data	could	we	use	to	do	this?
X y
From	data	to	predictive	model…
Formulate	
the	problem
Explore	
the	data
Clean	
the	data
Feature	
engineering
Evaluate	model	
performance
Choose	and	
fit	model(s)
From	data	to	predictive	model…
Formulate	
the	problem
Explore	
the	data
Clean	
the	data
Feature	
engineering
Evaluate	model	
performance
Choose	and	
fit	model(s)
Explore	the	data
• Visualization,	descriptive	analytics
1. Individual	variables
2. Relationships	between	variables
Explore	the	data
• Visualization,	descriptive	analytics
1. Individual	variables
2. Relationships	between	variables
Explore	the	data
• Visualization,	descriptive	analytics
1. Individual	variables
2. Relationships	between	variables
Explore	the	data
• Outliers	and	spurious	values
From	data	to	predictive	model…
Formulate	
the	problem
Explore	
the	data
Clean	
the	data
Feature	
engineering
Evaluate	model	
performance
Choose	and	
fit	model(s)
From	data	to	predictive	model…
Formulate	
the	problem
Explore	
the	data
Clean	
the	data
Feature	
engineering
Evaluate	model	
performance
Choose	and	
fit	model(s)
From	data	to	predictive	model…
Formulate	
the	problem
Explore	
the	data
Clean	
the	data
Feature	
engineering
Evaluate	model	
performance
Choose	and	
fit	model(s)
Clean	the	data
• Missing	entries	
• Outliers
• Spurious values
} • Remove?
• Impute/correct?
• Label	and	keep?
Convert	data	types
Lot	Shape
Regular
Slightly	irregular
Moderately	Irregular
Irregular
0
1
2
3
Ordinal	encoding
Convert	data	types
Neighbourhood
1 North	Ames
2 North	Ames
3 Gilbert
4 Gilbert
5 Stone	Brook
6 Gilbert
7 Gilbert
North	Ames Gilbert Stone	Brook
1 1 0 0
2 1 0 0
3 0 1 0
4 0 1 0
5 0 0 1
6 0 1 0
7 0 1 0
Dummy	(one-hot)	encoding
From	data	to	predictive	model…
Formulate	
the	problem
Explore	
the	data
Clean	
the	data
Feature	
engineering
Evaluate	model	
performance
Choose	and	
fit	model(s)
From	data	to	predictive	model…
Formulate	
the	problem
Explore	
the	data
Feature	
engineering
Evaluate	model	
performance
Choose	and	
fit	model(s)
Clean	
the	data
From	data	to	predictive	model…
Formulate	
the	problem
Explore	
the	data
Feature	
engineering
Evaluate	model	
performance
Choose	and	
fit	model(s)
Clean	
the	data
Feature	engineering
• Transform	data	to	optimize	learning
→ Construct	new	features
→ Transform	features	
→ Select	features
2
x1
x2
x3
x4
x5
From	data	to	predictive	model…
Formulate	
the	problem
Explore	
the	data
Feature	
engineering
Evaluate	model	
performance
Choose	and	
fit	model(s)
Clean	
the	data
From	data	to	predictive	model…
Formulate	
the	problem
Explore	
the	data
Feature	
engineering
Evaluate	model	
performance
Choose	and	
fit	model(s)
Clean	
the	data
Choose	and	fit	model
• Linear	models	(generalized)
• Tree-based	models	
• Neural	networks
X y
Model??
• Support	vector	machines,	
k-nearest	neighbour,	Bayesian	networks,	…
From	data	to	predictive	model…
Formulate	
the	problem
Explore	
the	data
Feature	
engineering
Evaluate	model	
performance
Choose	and	
fit	model(s)
Clean	
the	data
From	data	to	predictive	model…
Formulate	
the	problem
Explore	
the	data
Feature	
engineering
Evaluate	model	
performance
Choose	and	
fit	model(s)
Clean	
the	data
How	well	did	my	model	do?
Quantifying	error	(regression)
Typical	choice –
Root	mean	squared	error:
RMSE =
v
u
u
t 1
n
nX
i=1
(yi ˆyi)2
What	makes	a	good	model?
• Must	generalize	well	to	unseen data
What	makes	a	good	model?
• Must	generalize	well	to	unseen	data	
Overfitting
What	makes	a	good	model?
• Must	generalize	well	to	unseen	data	
Underfitting
What	makes	a	good	model?
• Must	generalize	well	to	unseen	data	
Just	right
What	makes	a	good	model?
Underfit OverfitJust	right
Evaluating	model	performance
• Cross	validation
Full	dataset
Evaluating	model	performance
• Cross	validation
Training	set Model	learns	from	this	data
Evaluating	model	performance
• Cross	validation
Training	set Model	learns	from	this	data
Test	set Used	to	evaluate	model	performance
K-fold	cross	validation
Test	set	
RMSE:
Train
Test
1
0.12
Train
Train
Test
2
0.14
Train
Train
Test
3
0.10
Train
Test
4
0.11 0.12
Average
From	data	to	predictive	model…
Formulate	
the	problem
Explore	
the	data
Feature	
engineering
Evaluate	model	
performance
Choose	and	
fit	model(s)
Clean	
the	data
From	data	to	predictive	model…
Formulate	
the	problem
Explore	
the	data
Feature	
engineering
Evaluate	model	
performance
Choose	and	
fit	model(s)
Clean	
the	data
From	data	to	predictive	model…
Formulate	
the	problem
Explore	
the	data
Feature	
engineering
Evaluate	model	
performance
Choose	and	
fit	model(s)
Clean	
the	data
The	akquinet fridge
House	prices	on	Kaggle
• Prediction	error within	
1% in	most	cases
• Top	2% of	all	
submissions	on	Kaggle
Summary
• Types	of	data	analytics
• Machine	learning	for	prediction
• From	data	to predictive	model
→ Data	preparation
→ Modelling	and	cross	validation
Cat
Data!
Thanks	for	listening!

A practical introduction to data science and machine learning