A New Magnetic Resononance Imaging Biomarker for Diabetes
•Download as PPTX, PDF•
1 like•324 views

Dorela Shuboni, Christiane Mallett, Maciej Parys, and Erik Shapiro describe latest research

Recommended
More Related Content
Viewers also liked
Viewers also liked (20)
Similar to A New Magnetic Resononance Imaging Biomarker for Diabetes
Similar to A New Magnetic Resononance Imaging Biomarker for Diabetes (20)
More from Michigan State University Research
More from Michigan State University Research (16)
Recently uploaded
Recently uploaded (20)
A New Magnetic Resononance Imaging Biomarker for Diabetes
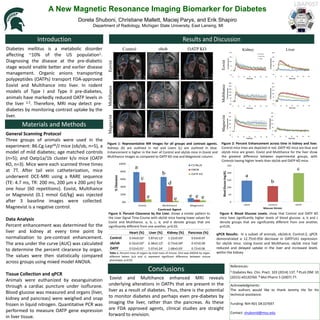
- 1. A New Magnetic Resonance Imaging Biomarker for Diabetes Dorela Shuboni, Christiane Mallett, Maciej Parys, and Erik Shapiro Department of Radiology, Michigan State University, East Lansing, MI Acknowledgments: The authors would like to thank Jeremy Hix for his technical assistance. Funding: NIH R01 DK107697 Contact: shubonid@msu.edu References: 1 Diabetes Res. Clin. Pract. 103 (2014) 137. 2 PLoS ONE 10 (2015) e0120760. 3 Mol Pharm 5 (2007) 77. General Scanning Protocol Three groups of animals were used in the experiment: B6.Cg-Lepob/J mice (ob/ob, n=5), a model of mild diabetes; age matched controls (n=5); and Oatp1a/1b cluster k/o mice (OATP KO, n=3). Mice were each scanned three times at 7T. After tail vein catheterization, mice underwent DCE-MRI using a RARE sequence (TE: 4.7 ms, TR: 200 ms, 200 μm x 200 μm) for one hour (60 repetitions). Eovist, Multihance or Magnevist (0.1 mmol Gd/kg) was injected after 3 baseline images were collected. Magnevist is a negative control. Data Analysis Percent enhancement was determined for the liver and kidney at every time point by normalization to pre-contrast enhancement. The area under the curve (AUC) was calculated to determine the percent clearance by organ. The values were then statistically compared across groups using mixed model ANOVA. Tissue Collection and qPCR Animals were euthanized by exsanguination through a cardiac puncture under isoflurane. Blood glucose was measured and organs (liver, kidney and pancreas) were weighed and snap frozen in liquid nitrogen. Quantitative PCR was performed to measure OATP gene expression in liver tissue. Diabetes mellitus is a metabolic disorder affecting ~10% of the US population1. Diagnosing the disease at the pre-diabetic stage would enable better and earlier disease management. Organic anions transporting polypeptides (OATPs) transport FDA-approved Eovist and Multihance into liver. In rodent models of Type I and Type II pre-diabetes, animals have markedly reduced OATP levels in the liver 2,3. Therefore, MRI may detect pre- diabetes by monitoring contrast uptake by the liver. Eovist and Multihance enhanced MRI reveals underlying alterations in OATPs that are present in the liver as a result of diabetes. Thus, there is the potential to monitor diabetes and perhaps even pre-diabetes by imaging the liver, rather than the pancreas. As these are FDA approved agents, clinical studies are straight forward to envision. Figure 1: Representative MR images for all groups and contrast agents. Kidneys (K) are outlined in red and Livers (L) are outlined in blue. Enhancement is higher in the liver of Control and ob/ob mice in Eovist and Multihance images as compared to OATP KO row and Magnevist column. Figure 2: Percent Enhancement across time in kidney and liver. Control mice lines are depicted in red, OATP KO mice are blue and ob/ob mice are green. Eovist and Multihance for the liver show the greatest difference between experimental groups, with Controls having higher levels than ob/ob and OATP KO mice. Figure 3: Percent Clearance by the Liver. shows a similar pattern to the Liver Signal Time Course with ob/ob mice having lower values for Eovist and Multihance. a, b, c, d, and e denote groups that are significantly different from one another, p<0.05. Heart (%) Liver (%) Kidney (%) Pancreas (%) Control 0.54±0.02a 3.87±0.12a 1.22±0.03a 0.63±0.07 ob/ob 0.32±0.02b 6.38±0.12b 0.73±0.04b 0.47±0.09 OATP 0.52±0.01a 5.07±0.24c 1.68±0.03c 0.72±0.06 Figure 4: Blood Glucose Levels. show that Control and OATP KO mice have significantly higher levels of blood glucose. a, b and c denote groups that are significantly different from one another, p<0.05. Table 1. Percent mass of organs by total mass of mouse. One-way ANOVA by organ, different letters (a,b and c) represent significant difference between mouse phenotype, p<0.05. qPCR Results: In a subset of animals, ob/ob:4; Control:2, qPCR demonstrated a 12.75±0.95X decrease in OATP1A1 expression for ob/ob mice. Using Eovist and Multihance, ob/ob mice had reduced and delayed uptake in the liver and increased levels within the kidney LBAP057