1. Abstract:
It is well known that chronic alcohol use can reduce the function
of the liver in ways of scarring and reducing its ability to rid
itself of lipids- leading to a fatty liver also known as the
condition steatosis. It is less know that a high fat diet can cause
the same effects. With the prevalence of high fat diets with
availability of fast food and the rise in obesity the effects of a
fatty liver have become relevant. To display this two groups of
male mice were compared in a sub-acute study, one with a
normal diet of 4% fat, and the other with a high fat diet of 11%.
Densities of the liver, the ratio of mass of liver to overall body
mass, color or visual lipid content were compared. Although the
livers of the normal diet had a high variation of different colors
marbling was seen only in the high fat livers supporting the
hypothesis. The ratios of comparing the overall liver mass and
body mass show have shown that the livers in the high fat diet
are actually smaller than that compared to those of the normal
diet but its densities had a lower p-value showing a high
significance in difference. These two considerations of a smaller,
denser liver could be due to hyperplasia and, if done in a chronic
study, may show cancer.
Steatosis Induced by a High Fat Diet in Male Mice Livers
Rachael Swedberg, Graduate Mentor: CJ Kupser, Faculty Mentor: Dr. Steven Mercurio Ph.D
Minnesota State University, Mankato
rachael.yates-swedberg@mnsu.edu
Method and Materials
Two groups of male mice were used; one group on a 4% fat diet and another in an 11% diet. Mice were kept on diets until a stabilization in body mass was accomplished (no more growth was achieved) this took 25
weeks. After death, mice were preserved by freezing from 3 weeks (for normal) and two weeks for high fat.
Volumes of livers were obtained by the displacement of water in a 100 mL graduated cylinder, and masses of livers and over all mass was achieved by a basic top-loading scale. Livers were preserved in a 10%
formalin solution.
Percent fat sampling was accomplished by first creating four cross sections of the preserved livers; photographs were taken of the cross sectioned livers, cut out and weighed on an analytical balance. Marbling of fat
(characterized by a grayish-yellow color) was cut out of paper livers and weighed on an analytical scale.
Conclusion
The conclusion seems to be that the 7% increase in fat in the diet does
lead to morphological differences in mass, density, and color. The
implications for this would be steatosis, or fatty liver, was achieved.
Further Study
The most counter intuitive result was that of the densities as the livers
of the high fat group were more dense than that of the normal diet.
This leads to the question of what is the cause, is it hyperplasia that
could lead to liver cancer? Is it reversible or a permanent feature? This
could be determined by doing a chronic study of around two years.
There is evidence available as well that could reverse steatosis by
things such as tea (Park 2011) and vitamin E (Lomonaco 2013). It
would also be of interest to see if the function at this stage is inhibited
by looking at the contents of the gull bladder.
Limitations:
The limitations of this particular study would be only doing
observations. Percent fat, for example was achieved by a sampling
method and could have gotten more accurate values from taking a
cross section under a microscope. More accurate number could have
been achieved as well with a more equal group size (around 16 mice in
the high fat group). Although the numbers listed do give a good
indication of the trends in numbers.
References
Abbot, J.M., Byrd-Bredbenner, C. 2007, The State of the American Diet: Can We Cope? Top Clin
Nutr 22(3):202-233
D’Alessandro, L.A., Meyer, R., Klingmuller, U. Feb 2013. Hepatocellular carcinoma: a systems
biology perspective. Front Physiol 4:28
Flegal, K.M., et. al Feb 2012 Prevalence of Obesity and Trends in the Distribution of Body Mass
Index Among US Adults. 1999-2010, JAMA 307(5); 491-497
Frank B. Hu, M.D., et. al Nov 1997 Dietary Fat Intake and the Risk of Coronary Heart Disease in
Women. N Engl J Med 337:1491-1499
Lomonaco R, Sunny NE, Bril F, Cusi K Jan 2013 Nonalcoholic fatty liver disease: current issues
and novel treatment approaches. Drugs: 73(1): 1-14
Park, H.J., et al Apr. 2011, Green tea extract attenuates hepatic steatosis by decreasing adipose
lipogenesis and enhancing hepatic antioxidant defenses in ob/ob mice. J Nutr Biochem 22(4): 343-400
Background/Introduction
It is no secret the diet Americans are known for is a high dense
and high fat diet (Abbot 2007). In 2010 it was estimated that
35.5% males and 35.8% females were obese in America,
meaning having a BMI of 30 or higher (Flegal 2012). The most
popular outcome of high fat die would be its effect on the
cardiovascular system, where even small increases in fat in the
diet can lead to changes in the health (Frank 1997). There is also
the less known NAFLD, non-alcoholic fatty liver disease which
reveals fat in the liver that accumulates eventually to morph into
steatohepatitis, reduction in function due to inflammation, and
eventually scarring of he liver will occur(D’Alessandro 2013).
Although some fat in the liver is fine and unavoidable, the
question then becomes what are the results of a high fat diet
compared to a normal fat diet on the liver and do small changes
led to such out comes as it does to the cardiovascular system?
Results
Comparison T-test of
Mass of Mice
2
1
DIET
10
20
30
40
MOUSEWT
051015
Count
0 5 10 15
Count
Comparison T-test of Mice
livers grouped by diet
2
1
DIET
0.5
1.0
1.5
2.0
2.5
LIVERWT
024681012
Count
0 2 4 6 8 10 12
Count
Comparison t-test of liver
densities by diet
2
1
DIET
0.5
0.6
0.7
0.8
0.9
1.0
1.1
1.2
LIVERD
024681012
Count
0 2 4 6 8 10 12
Count
Mass of liver to over all
mass ratios
2
1
DIET
0.04
0.05
0.06
0.07
0.08
0.09
LVRMOUSERATI
024681012
Count
0 2 4 6 8 10 12
Count
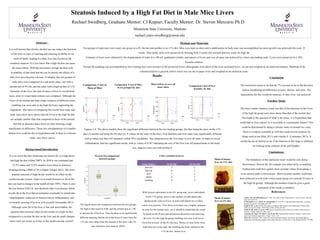
Figures 1-4 :The above models show the significant difference between the two feeding groups, the blue being the mice on the 11%
diet (1) and the red being the 4% diet (2). P-values for the mass of the mice, liver densities and liver mass were significantly different
with p-values less that 0.05 measures within 95% confidence. The comparison to the liver mass to over all mass, in hopes to reveal
inflammation, had less significant results, with p- values of 0.507 indicating the size of the liver was sill proportionate to the body
size. Statisics were run with SysStat 9.
Color/ Pattern 4% fat diet 11% fat diet
dark red 7 5
dull red 8 5
pink 7 2
yellow 3 7
marbling 0 7
Percent Fat comparison
between groups
Color variation in livers
With sixteen individuals in the 4% group and seven individuals
in the 11% group, above is the number of individuals that
displayed the color in livers, in most individuals two or three
colors were present. This shows how there was a higher variation
in color for the normal mice, yet it should be noted that this could
be based on the frozen period between dissection and removing
the liver. For the high fat group marbling was seen in all seven
livers but in none of the 4% fat mice. Photos of mice livers from
both diets are to the right, the marbling has been outlined in the
11% fat diet mouse liver.
This figure shows the comparison between the two groups,
the high at diet noted as 0.00, and the normal diet as 1.00,
in percent fat of the liver. They do show to be significantly
different meaning that the fat in the livers of mice from the
11% die were larger than the amount in the mice o the 4%
diet. Statistics were done by SPSS.
Photo of mouse
liver on 11% diet
Photo of mouse
liver on 4% diet