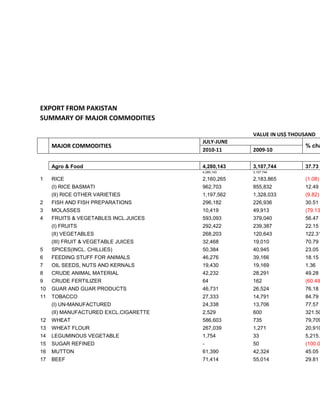
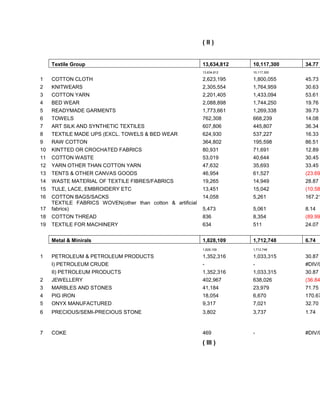
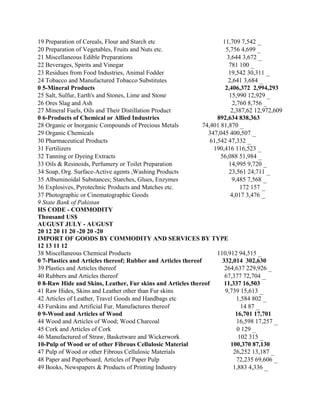
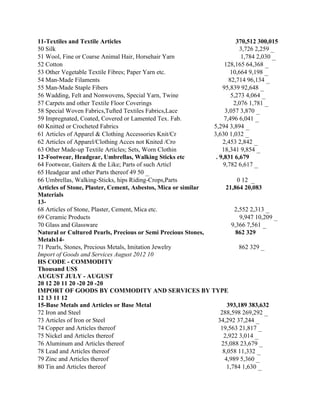
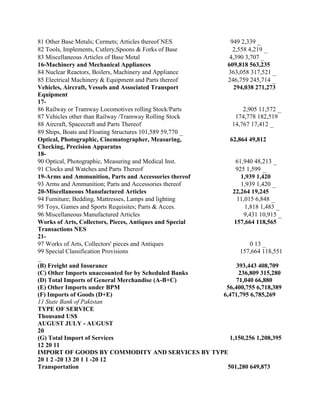
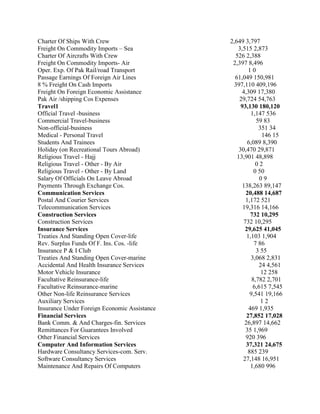
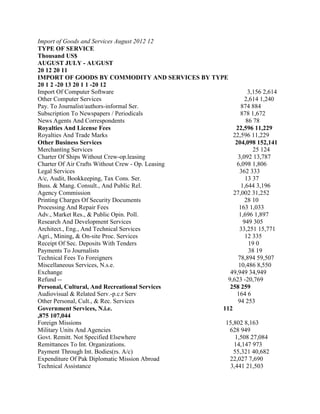
This document summarizes Pakistan's major commodity exports for July-June 2010-11 and 2009-10. The top three exported commodities by value were:
1. Rice, worth $2.16 billion, accounting for 1.08% of total exports.
2. Textiles, worth $13.63 billion, accounting for 34.77% of total exports.
3. Petroleum and petroleum products, worth $1.35 billion, accounting for 30.87% of total exports.
The document presents statistics on patent applications filed by technology sector from 1990 to 2007 based on data from the World Intellectual Property Organization (WIPO). It shows that the number of applications increased over time across all sectors. The sectors with the most applications in 2007 were electrical/electronics, computer technology, medical technology, and mechanical engineering.
Laboratorio valoración de cartera resolución enviarEdlin Rodriguez
This document provides an analysis of a credit portfolio including:
1) A listing of credit accounts with details on balance, collateral, delinquency, and risk classification. Most accounts are classified as low risk (A) but some are higher risk (B,C,D,E).
2) Summaries of the portfolio by credit type, risk category, and reserve levels. The portfolio is mostly prime commercial loans but also includes smaller business, consumer, and mortgage loans. Higher risk loans (C,D,E) make up 12.2% of the total portfolio.
3) Key metrics on the portfolio including coverage ratios for reserves to riskier loans and delinquent loans. Reserves cover 24.6
The document provides statistics on patent, utility model, design, and trademark applications filed in Korea from 1947 to 2008. Some key details:
- Patent applications by Koreans increased from 236 in 1947 to over 127,000 in 2008, while foreign patent applications in Korea increased from 0 to over 43,000.
- In 2007, most patent applications were filed online (97.2%), while utility model applications were mostly filed online (82.7%) and design applications were mostly filed in other formats than online or paper (90.1%).
- The proportion of Korean patent applications decreased from 100% in early years to 74.5% in 2008, while foreign applications increased from 0% to 25.5
This document summarizes 10 key strategies for entrepreneurial success based on scientific research:
1) Choose an industry with a high startup success rate.
2) Gain relevant industry experience before starting your venture.
3) Prepare by researching the industry and developing initial sales and financial plans.
4) Assemble a strong founding team with complementary skills.
5) Achieve high initial sales to drive early growth.
6) Seek advice from experienced entrepreneurs and business advisors.
7) Obtain a college degree or professional training to strengthen skills.
8) Implement financial controls like budgeting to manage resources.
9) Secure adequate startup funding to launch and grow the business
The environmental management report summarizes Tohoku University's environmental performance in 2008. Key points include:
- Total CO2 emissions were 100,458.5 tons, with electricity usage accounting for 74% of emissions.
- Total water usage was 17,887 cubic meters, a slight increase from the previous year.
- Waste production increased to 4,274 tons, primarily due to construction and renovation projects. The recycling rate was 54%.
The document provides information on calculating customs duties for imported DVD players into India. It lists the FOB value, ocean freight, insurance, CIF cost, and total assessable value. It then calculates the basic customs duty, CVD duty based on the maximum retail price of each player model, education cess on CVD, and total duty payable. The duty is calculated separately for each model and then summed to get the total duty.
An Israeli NPO dedicated to the empowerment of women, teens, and other special populations through Martial Arts and Self-Defense training, as a path to a joyous, safe and fulfilling life.
Bryce Neier, a North Carolina attorney, contributes to charities including Smile Train. Smile Train provides cleft lip and cleft palate surgery to individuals in developing countries, as these disorders can prevent proper eating, speaking, and attending school or work. Through Smile Train, doctors travel to over 80 countries and have treated hundreds of thousands of children, providing surgery and follow-up care like dentistry and speech therapy for those who cannot afford it. Smile Train also benefits communities by training local professionals and utilizing modern medical equipment.
This document discusses STEAM'D learning, an approach to education that incorporates science, technology, engineering, arts, and mathematics through interconnected, authentic, problem-based projects involving drawing, designing, and prototyping. Some examples provided include building rockets from straw and paper, edible structures from food items, and water filtration systems. The approach emphasizes providing skills and knowledge through hands-on mini-explorations and challenges related to topics like renewable energy and off-grid living.
The document is a response from a company to queries raised by tax authorities regarding withholding taxes for the 2011 tax year. It provides explanations for why withholding tax was not deducted from the full amount of salary expenses reported in the audited financial statements. It details that a majority of wages were paid to manual laborers earning below the taxable limit, and that withholding tax was deducted from applicable payments to directors and employees. Supporting documents like salary registers are available.
The document provides production statistics for sorghum grain across 14 municipalities in Nayarit, Mexico for the years 2010, 2009, and 2008. It includes the planted area, harvested area, production volume, yield per hectare, price per metric ton, and total production value for each municipality and year. Overall production levels fluctuated between about 250,000 metric tons in 2010 to over 350,000 metric tons in 2009. The municipality of Tecuala consistently had the largest planted and harvested areas each year.
This document summarizes the holdings, valuations, and performance of the Bryford Investment Club portfolio as of September 30, 2008. The portfolio contained shares in 12 companies and had a total value of £20,942.36. Overall the portfolio showed an unrealized loss of -£4,764.60 or -23% compared to total costs. Individually, members' holdings ranged in value from £938.77 to £3,706.03 with profits or losses ranging from +9.99% to -23.82%
The Current Status Of Nuclear Power In TheJoe Miller
The United States is the world's largest producer of nuclear power, generating over 20% of its electricity from 104 nuclear reactors in 2010. While few new reactors have been built in recent decades, 4-6 new units are expected by 2020 from 16 license applications since 2007. However, lower gas prices and the Fukushima accident may delay some projects. The US nuclear fleet has significantly increased output through higher capacity factors now around 90%, reduced outage times, power uprates, and extended fuel cycles without new plant construction.
The document provides production data for beans in the state of Nayarit, Mexico for the years 2010, 2009, and 2008. It lists the planted area, harvested area, production, yield, price per metric ton, and total value of production for each municipality. Some key details are:
- In 2010, a total of 52,811.72 hectares were harvested, producing 72,403.47 metric tons of beans with an average yield of 1.37 tons/hectare and a total value of 777,108,449 Mexican pesos.
- Santiago Ixcuintla municipality had the largest planted and harvested area each year, while Compostela and Rosamorada also had over
The document is a report on petroleum product consumption in Italy for June 2012 and January-June 2012. It shows consumption figures in tons for various petroleum products like gasoline, gas oil, LPG, bitumens and lubricants. It also lists total sales, refinery consumption and losses, and petrochemical loading for the reported periods. Consumption of most products decreased compared to the same periods in 2011.
This document provides consumption data for various petroleum products in Italy for December 2012 and January-December 2012, with comparisons to the previous year. It shows that total consumption of petroleum products in December 2012 decreased 11.6% compared to December 2011. For the full year of 2012, total consumption decreased 10.1% compared to 2011. Decreases were seen across most product categories, including gasoline, diesel fuel, fuel oil, and petrochemical feedstock. Bunker fuel was one of the few categories to see an increase in December 2012 compared to the previous year.
The document is a table summarizing Italian petroleum product consumption and sales data for September and January-September 2012 compared to the same periods in 2011. It shows decreases across most product categories including gasoline, gas/diesel oil for motors, and total sales and consumption compared to the previous year. Total petroleum product consumption in September 2012 was down 14.8% and year-to-date was down 9.3% from 2011 levels.
The document discusses the impact of Venezuela's 2001 agrarian reform on the rural population, using a case study of the state of Monagas. It provides background on Venezuela's history of land reform and increasing inequality. The reform intensified land redistribution and was accompanied by rising oil prices and agrarian investment. However, there has also been a production crisis, with decreasing output potentially due to difficulties faced by new cooperatives, landowners planting less or withholding supply, and mismanagement. The document outlines research objectives on decision-making by cooperatives and evaluates the sustainability of the reform.
This document summarizes Italian petroleum product consumption data for August 2012 and year-to-date January-August 2012. It shows consumption volumes in 1000 metric tons for various petroleum products like gasoline, diesel, fuel oil, LPG, and bunker fuels. It also provides percentage changes from the same periods in 2011. Total petroleum product sales were down 8.3% in August 2012 and 9.7% for January-August compared to the previous year.
The document provides an overview of IDBI Bank including:
- IDBI Bank was established in 1964 and was originally fully owned by the government but has since seen decreasing government ownership and an increase in private ownership.
- It has a large network of over 900 branches across India and provides various corporate and retail banking services.
- Some key investments and subsidiaries of IDBI Bank that have helped develop India's financial system are listed.
The document provides statistics on maize production in the state of Nayarit, Mexico for the years 2010, 2009, and 2008, including the area planted, area harvested, production, yield, price per metric ton, and total value of production for each municipality. Overall maize production in Nayarit totaled 176,223 metric tons in 2010, 214,440 metric tons in 2009, and 186,568 metric tons in 2008. The highest producing municipalities across the three years were Compostela, San Pedro Lagunillas, and Yesca La.
The document is a report from the Italian Ministry of Economic Development - Department of Energy on fuel consumption in Italy for November 2012 and year-to-date January-November 2012. It shows consumption of gasoline, diesel, LPG, fuel oil, and other products in November 2012 was down 12.2% from November 2011. For the year-to-date period consumption was down 10.8% compared to the same period in 2011. Diesel consumption through retail networks was down 10% in November and 8.6% for the year-to-date period. Consumption of other oil products for non-fuel uses was down 40% in November and 23.4% for the year-to-date period.
PDRB Kota Pekanbaru Menurut Lapangan Usaha Tahun 2006-2010bps1471
The document is a table showing regional gross domestic product (GRDP) in Pekanbaru, Riau Province, Indonesia from 2006 to 2010 according to industrial origin. It lists 9 industries and their contribution to GRDP each year. The largest contributing industries were manufacturing, agriculture/livestock/fisheries, trade/hotels/restaurants, and services. The GRDP of Pekanbaru grew from Rp16.48 trillion in 2006 to Rp36.75 trillion in 2010, with manufacturing and services as the top growing industries.
- Philippine mineral production increased in both quantity and value in 2010 compared to 2009, with total production valued at PHP 111 billion in 2010 versus PHP 79.6 billion in 2009, a 39% increase.
- Gold production increased 10% in quantity and 34% in value, with the largest producers being Philippine Gold Processing & Refining Corp. and Philsaga Mining Corp.
- Copper production increased 16% in quantity and 46% in value, led by Carmen Copper Corporation and Philex Mining Corporation.
- Nickel production from direct shipping ore increased 59% in quantity and 87% in value, primarily from increases at Platinum Group Metals Corporation and CTP Construction & Mining Corp
This document summarizes oil and petroleum product consumption in Italy for March 2013 and the first three months of 2013. It shows consumption of fuels like gasoline, diesel, and liquefied petroleum gas, as well as their changes compared to the same periods in 2012. Total sales of petroleum products in March 2013 were 4,388 thousand tons, down 6.1% from March 2012. For the first three months of 2013, total consumption was 14,527 thousand tons, down 8.8% from the same period of 2012.
The document summarizes mango production data across multiple municipalities in Nayarit, Mexico for the years 2010, 2009, and 2008. It includes information on planted area, harvested area, production levels in tons, yield per hectare, price per metric ton, and total value of production for each municipality and year. Overall mango production increased from 2008 to 2010, with total production reaching over 292,000 tons and a value of over 604 million pesos in 2010.
This document summarizes Italian petroleum product consumption data for April 2012 and year-to-date January-April 2012 with comparisons to the previous year. It shows that total petroleum product sales were down 15.1% in April 2012 and 12% year-to-date, driven primarily by declines in gasoline, diesel, and fuel oil sales. Refinery consumption for energy production was also down around 4-7% from the previous year.
3. Engineering Manufacturing Goods 2,444,041 2,166,675 12.80
2,444,041 2,166,675
1 CHEMICALS AND PHARMACEUTICAL PRODUCTS 923,098 711,181 29.80
(I) PLASTIC MATERIALS 405,955 270,073 50.31
(II) PHARMACAUTICAL PRODUCTS. 149,047 137,011 8.78
(III) FERTILIZER MANUFACTURES 101 719 (85.95
(IV) OTHER CHEMICAL 367,994 303,379 21.30
2 RUBBER MANUFACTURES 7,733 4,324 78.84
3 PAPER AND PAPER BOARD 6,936 14,641 (52.63
4 CUTLERY 85,472 65,409 30.67
5 MACHINERY & TRANSPORT EQUIPMENT 256,047 230,184 11.24
(I) ELECTRIC FANS 38,046 34,311 10.89
(II) TRANSPORT EQUIPMENT 22,553 29,109 (22.52
(III) OTHER ELECTRICAL MACHINERY 50,192 42,005 19.49
(IV) MACHINERY SPECIALIZED FOR PART. IND. 47,877 43,030 11.26
(V) AUTO PARTS 21,032 13,338 57.68
(VI) OTHER MACHINERY 76,347 68,390 11.63
6 HOUSE-HOLD EQUIPMENT 33,513 34,543 (2.98)
7 SPORTS GOODS 330,000 298,163 10.68
(I) FOOT BALLS COMPLETE 143,403 151,536 (5.37)
(II) GLOVES (SPORTS) 123,650 98,159 25.97
(III) OTHER (SPORTS) 62,946 48,467 29.87
8 CEMENT 457,448 484,004 (5.49)
9 SURGICAL GOODS 260,598 229,201 13.70
10 ARTICLES OF PLASTIC 74,636 81,607 (8.54)
11 FURNITURE 6,646 7,747 (14.21
12 HANDICRAFTS 1,916 5,672 (66.22
4. IMPORT OF GOODS BY COMMODITY AND SERVICES BY TYPE
TYPE OF SERVICE JULY-AUGUST
2012-2013 2011-2012
(A) Import Payments (Scheduled Banks 6,557,389 6,811,818
12 20 11 20 -20 20 -20
IMPORT OF GOODS BY COMMODITY AND SERVICES BY TYPE
12 13 11 12
0 1-Live Animals and Animals Products 33, 041 23, 405
0 1 Live Animals 1,762 2,316 _
0 2 Meat and Edible Meat Offal 1,463 1,027 _
0 3 Fish and Crustaceans 227 409 _
0 4 Dairy, Eggs, Honey and Edible Products 29,255 19,188 _
0 5 Products of Animal origin NES 334 464 _
0 2-Vegetable Products 291,291 245,397
0 6 Live Trees and other Plants 09_
0 7 Edible Vegetables 109,295 79,513 _
0 8 Edible Fruits and Nuts 18,083 11,878 _
0 9 Coffee, Tea, Mate and Spices 60,117 54,829 _
10 Cereals 13,112 6,928 _
11 Products of Milling Industry 1,561 1,863 _
12 Oil Seeds and Oleaginous Fruit 84,428 87,005 _
13 Other Vegetable Saps and Extracts; Lac,Gums,Resins 1,492 608 2,612 1,271 _
14 Vegetable Planting Materials 2,084 2,101 _
0 3-Animal or Vegetable Fats, Oils and Waxes 475,512 490,633
15 Animal or Vegetable Fats, Oils & Cleavage Products 475,512 490,633 _
Prepared Foodstuffs; Beverages, Spirits, Vinegar and 53,272 61,476
Tobacco
0 4-
16 Preparation of Meat, Fish and Crustaceans etc. 542 535 _
17 Sugars and Sugar Confectionery 6,067 8,593 _
18 Cocoa and Cocoa Preparations 2,590 2,340 _
5. 19 Preparation of Cereals, Flour and Starch etc 11,709 7,542 _
20 Preparation of Vegetables, Fruits and Nuts etc. 5,756 4,699 _
21 Miscellaneous Edible Preparations 3,644 3,672 _
22 Beverages, Spirits and Vinegar 781 100 _
23 Residues from Food Industries, Animal Fodder 19,542 30,311 _
24 Tobacco and Manufactured Tobacco Substitutes 2,641 3,684 _
0 5-Mineral Products 2,406,372 2,994,293
25 Salt, Sulfur, Earth's and Stones, Lime and Stone 15,990 12,929 _
26 Ores Slag and Ash 2,760 8,756 _
27 Mineral Fuels, Oils and Their Distillation Product 2,387,62 12,972,609
0 6-Products of Chemical or Allied Industries 892,634 838,363
28 Organic or Inorganic Compounds of Precious Metals 74,401 81,870 _
29 Organic Chemicals 347,045 400,507 _
30 Pharmaceutical Products 61,542 47,332 _
31 Fertilizers 190,416 116,523 _
32 Tanning or Dyeing Extracts 56,088 51,984 _
33 Oils & Resinoids, Perfumery or Toilet Preparation 14,995 9,720 _
34 Soap, Org. Surface-Active agents ,Washing Products 23,561 24,711 _
35 Albuminoidal Substances; Starches, Glues, Enzymes 9,485 7,568 _
36 Explosives, Pyrotechnic Products and Matches etc. 172 157 _
37 Photographic or Cinematographic Goods 4,017 3,476 _
9 State Bank of Pakistan
HS CODE - COMMODITY
Thousand US$
AUGUST JULY - AUGUST
20 12 20 11 20 -20 20 -20
IMPORT OF GOODS BY COMMODITY AND SERVICES BY TYPE
12 13 11 12
38 Miscellaneous Chemical Products 110,912 94,515 _
0 7-Plastics and Articles thereof; Rubber and Articles thereof 332,014 302,630
39 Plastics and Articles thereof 264,637 229,926 _
40 Rubbers and Articles thereof 67,377 72,704 _
0 8-Raw Hide and Skins, Leather, Fur skins and Articles thereof 11,337 16,503
41 Raw Hides, Skins and Leather other than Fur skins 9,739 15,613 _
42 Articles of Leather, Travel Goods and Handbags etc 1,584 802 _
43 Furskins and Artificial Fur, Manufactures thereof 14 87 _
0 9-Wood and Articles of Wood 16,701 17,701
44 Wood and Articles of Wood; Wood Charcoal 16,598 17,257 _
45 Cork and Articles of Cork 0 129 _
46 Manufactured of Straw, Basketware and Wickerwork 102 315 _
10-Pulp of Wood or of other Fibrous Cellulosic Material 100,370 87,130
47 Pulp of Wood or other Fibrous Cellulosic Materials 26,252 13,187 _
48 Paper and Paperboard, Articles of Paper Pulp 72,235 69,606 _
49 Books, Newspapers & Products of Printing Industry 1,883 4,336 _
6. 11-Textiles and Textile Articles 370,512 300,015
50 Silk 3,726 2,259 _
51 Wool, Fine or Coarse Animal Hair, Horsehair Yarn 1,784 2,030 _
52 Cotton 128,165 64,368 _
53 Other Vegetable Textile Fibres; Paper Yarn etc. 10,664 9,198 _
54 Man-Made Filaments 82,714 96,134 _
55 Man-Made Staple Fibers 95,839 92,648 _
56 Wadding, Felt and Nonwovens, Special Yarn, Twine 5,273 4,064 _
57 Carpets and other Textile Floor Coverings 2,076 1,781 _
58 Special Woven Fabrics,Tufted Textiles Fabrics,Lace 3,057 3,870 _
59 Impregnated, Coated, Covered or Lamented Tex. Fab. 7,496 6,041 _
60 Knitted or Crocheted Fabrics 5,294 3,894 _
61 Articles of Apparel & Clothing Accessories Knit/Cr 3,630 1,032 _
62 Articles of Apparel/Clothing Acces not Knited /Cro 2,453 2,842 _
63 Other Made-up Textile Articles; Sets, Worn Clothin 18,341 9,854 _
12-Footwear, Headgear, Umbrellas, Walking Sticks etc . 9,831 6,679
64 Footwear, Gaiters & the Like; Parts of such Articl 9,782 6,617 _
65 Headgear and other Parts thereof 49 50 _
66 Umbrellas, Walking-Sticks, hips Riding-Crops,Parts 0 12 _
Articles of Stone, Plaster, Cement, Asbestos, Mica or similar 21,864 20,083
Materials
13-
68 Articles of Stone, Plaster, Cement, Mica etc. 2,552 2,313 _
69 Ceramic Products 9,947 10,209 _
70 Glass and Glassware 9,366 7,561 _
Natural or Cultured Pearls, Precious or Semi Precious Stones, 862 329
Metals14-
71 Pearls, Stones, Precious Metals, Imitation Jewelry 862 329 _
Import of Goods and Services August 2012 10
HS CODE - COMMODITY
Thousand US$
AUGUST JULY - AUGUST
20 12 20 11 20 -20 20 -20
IMPORT OF GOODS BY COMMODITY AND SERVICES BY TYPE
12 13 11 12
15-Base Metals and Articles or Base Metal 393,189 383,632
72 Iron and Steel 288,598 269,292 _
73 Articles of Iron or Steel 34,292 37,244 _
74 Copper and Articles thereof 19,563 21,817 _
75 Nickel and Articles thereof 2,922 3,014 _
76 Aluminum and Articles thereof 25,088 23,679 _
78 Lead and Articles thereof 8,058 11,332 _
79 Zinc and Articles thereof 4,989 5,360 _
80 Tin and Articles thereof 1,784 1,630 _
7. 81 Other Base Metals; Cermets; Articles thereof NES 949 2,339 _
82 Tools, Implements, Cutlery,Spoons & Forks of Base 2,558 4,219 _
83 Miscellaneous Articles of Base Metal 4,390 3,707 _
16-Machinery and Mechanical Appliances 609,818 563,235
84 Nuclear Reactors, Boilers, Machinery and Appliance 363,058 317,521 _
85 Electrical Machinery & Equipment and Parts thereof 246,759 245,714 _
Vehicles, Aircraft, Vessels and Associated Transport 294,038 271,273
Equipment
17-
86 Railway or Tramway Locomotives rolling Stock/Parts 2,905 11,572 _
87 Vehicles other than Railway /Tramway Rolling Stock 174,778 182,519
88 Aircraft, Spacecraft and Parts Thereof 14,767 17,412 _
89 Ships, Boats and Floating Structures 101,589 59,770 _
Optical, Photographic, Cinematographer, Measuring, 62,864 49,812
Checking, Precision Apparatus
18-
90 Optical, Photographic, Measuring and Medical Inst. 61,940 48,213 _
91 Clocks and Watches and Parts Thereof 925 1,599 _
19-Arms and Ammunition, Parts and Accessories thereof 1,939 1,420
93 Arms and Ammunition; Parts and Accessories thereof 1,939 1,420 _
20-Miscellaneous Manufactured Articles 22,264 19,245
94 Furniture; Bedding, Mattresses, Lamps and lighting 11,015 6,848 _
95 Toys, Games and Sports Requisites; Parts & Acces. 1,818 1,483 _
96 Miscellaneous Manufactured Articles 9,431 10,915 _
Works of Arts, Collectors, Pieces, Antiques and Special 157,664 118,565
Transactions NES
21-
97 Works of Arts, Collectors' pieces and Antiques 0 13 _
99 Special Classification Provisions 157,664 118,551
_
(B) Freight and Insurance 393,443 408,709
(C) Other Imports unaccounted for by Scheduled Banks 236,809 315,280
(D) Total Imports of General Merchandise (A-B+C) 71,040 66,880
(E) Other Imports under BPM 56,400,755 6,718,389
(F) Imports of Goods (D+E) 6,471,795 6,785,269
11 State Bank of Pakistan
TYPE OF SERVICE
Thousand US$
AUGUST JULY - AUGUST
20
(G) Total Import of Services 1,150,256 1,208,395
12 20 11
IMPORT OF GOODS BY COMMODITY AND SERVICES BY TYPE
20 1 2 -20 13 20 1 1 -20 12
Transportation 501,280 649,873
8. Charter Of Ships With Crew 2,649 3,797
Freight On Commodity Imports – Sea 3,515 2,873
Charter Of Aircrafts With Crew 526 2,388
Freight On Commodity Imports- Air 2,397 8,496
Oper. Exp. Of Pak Rail/road Transport 10
Passage Earnings Of Foreign Air Lines 61,049 150,981
8 % Freight On Cash Imports 397,110 409,196
Freight On Foreign Economic Assistance 4,309 17,380
Pak Air /shipping Cos Expenses 29,724 54,763
Travel1 93,130 180,120
Official Travel -business 1,147 536
Commercial Travel-business 59 83
Non-official-business 351 34
Medical - Personal Travel 146 15
Students And Trainees 6,089 8,390
Holiday (on Recreational Tours Abroad) 30,470 29,871
Religious Travel - Hajj 13,901 48,898
Religious Travel - Other - By Air 02
Religious Travel - Other - By Land 0 50
Salary Of Officials On Leave Abroad 09
Payments Through Exchange Cos. 138,263 89,147
Communication Services 20,488 14,687
Postal And Courier Services 1,172 521
Telecommunication Services 19,316 14,166
Construction Services 732 10,295
Insurance Services 29,625 41,045
Treaties And Standing Open Cover-life 1,103 1,904
Rev. Surplus Funds Of F. Ins. Cos. -life 7 86
Insurance P & I Club 3 55
Treaties And Standing Open Cover-marine 3,068 2,831
Accidental And Health Insurance Services 24 4,561
Motor Vehicle Insurance 12 258
Facultative Reinsurance-life 8,782 2,701
Facultative Reinsurance-marine 6,615 7,545
Other Non-life Reinsurance Services 9,541 19,166
Auxiliary Services 12
Insurance Under Foreign Economic Assistance 469 1,935
Financial Services 27,852 17,028
Bank Comm. & And Charges-fin. Services 26,897 14,662
Remittances For Guarantees Involved 35 1,969
Other Financial Services 920 396
Computer And Information Services 37,321 24,675
Hardware Consultancy Services-com. Serv. 885 239
Software Consultancy Services 27,148 16,951
Maintenance And Repairs Of Computers 1,680 996
9. Import of Goods and Services August 2012 12
TYPE OF SERVICE
Thousand US$
AUGUST JULY - AUGUST
20 12 20 11
IMPORT OF GOODS BY COMMODITY AND SERVICES BY TYPE
20 1 2 -20 13 20 1 1 -20 12
Import Of Computer Software 3,156 2,614
Other Computer Services 2,614 1,240
Pay. To Journalist/authors-informal Ser. 874 884
Subscription To Newspapers / Periodicals 878 1,672
News Agents And Correspondents 86 78
Royalties And License Fees 22,596 11,229
Royalties And Trade Marks 22,596 11,229
Other Business Services 204,098 152,141
Merchanting Services 25 124
Charter Of Ships Without Crew-op.leasing 3,092 13,787
Charter Of Air Crafts Without Crew - Op. Leasing 6,098 1,806
Legal Services 362 333
A/c, Audit, Bookkeeping, Tax Cons. Ser. 13 37
Buss. & Mang. Consult., And Public Rel. 1,644 3,196
Agency Commission 27,002 31,252
Printing Charges Of Security Documents 28 10
Processing And Repair Fees 163 1,033
Adv., Market Res., & Public Opin. Poll. 1,696 1,897
Research And Development Services 949 305
Architect., Eng., And Technical Services 33,251 15,771
Agri., Mining, & On-site Proc. Services 12 335
Receipt Of Sec. Deposits With Tenders 19 0
Payments To Journalists 38 19
Technical Fees To Foreigners 78,894 59,507
Miscellaneous Services, N.s.e. 10,486 8,550
Exchange 49,949 34,949
Refund -- 9,623 -20,769
Personal, Cultural, And Recreational Services 258 259
Audiovisual & Related Serv.-p.c.r Serv 164 6
Other Personal, Cult., & Rec. Services 94 253
Government Services, N.i.e. 112
,875 107,044
Foreign Missions 15,802 8,163
Military Units And Agencies 628 949
Govt. Remitt. Not Specified Elsewhere 1,508 27,084
Remittances To Int. Organizations. 14,147 973
Payment Through Int. Bodies(rs. A/c) 55,321 40,682
Expenditure Of Pak Diplomatic Mission Abroad 22,027 7,690
Technical Assistance 3,441 21,503
10. (H) Total Import of Goods and Services (F+G) 7,622,051 7,993,664