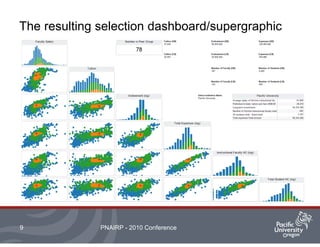
A Visualization Approach to Peer Identification
October 5, 2010
Pacific Northwest Association for Institutional Research & Planning
2010 Conference
Context and goals
• Context
– Usual set of peers was too small to provide coverage
across disciplines in CUPA faculty salary survey
• Goals
– Find a large set of peers for discipline-level salary
benchmarking via CUPA based on meaningful criteria
– Process should be transparent and accessible
– Ability to make adjustments
Initial scope
• Institutions
– Active
– Degree granting
– Private not-for-profit institutions or Public institutions
using FASB
• Faculty Salary
– 9-Month equated contracts
– All faculty ranks total
• Student
– All students total
Small multiples
• Tufte
– Envisioning Information (1990) 1
– Illustrations of postage-stamp size are indexed by
category or a label, sequenced over time like the
frames of a movie, or ordered by a quantitative
variable not used in the single image itself.
PNAIRP - 2010 Conference4
1 – Via http://www.infovis-wiki.net/index.php/Small_Multiples
Small multiples crosstab
• Few
– An Introduction to Visual
Multivariate Analysis
(2006)
– Adds another dimension to
Tufte’s model of small
multiples
– Enables additional
variables
– Better than 3D
PNAIRP - 2010 Conference5
Multiple Concurrent Views with Brushing
• Few (2006)
– Presents multiple graphs and tables of the same dataset
– These views are linked such that selecting or clicking on a
range of values in one view highlights the same records in
other views
PNAIRP - 2010 Conference6
Method
• IPEDS data compiled in SAS
• Selected variables
– Type of institution
• Sector
• Carnegie Classes
• Geographic and location
– Financial qualities
• Endowment
• Total expenses
• Tuition
– Size
• Number of students
• Number of faculty
PNAIRP - 2010 Conference7
Method (cont)
• Flag for CUPA 2009-10 participation
• Calculated deciles for quantitative variables
– Noting position of my institution
• Exported to Tableau
– Build univariate and bivariate vizes
– Assemble into matrix
– Tableau 6.0
• Build parameters for each variable
– Actually two: one for upper and the other for lower limits
• Create a variable to combine the parameters and indicate if an institution fits
the conditions
• Add parameter controls to the dashboard/supergraphic
PNAIRP - 2010 Conference8
The resulting selection dashboard/supergraphic
PNAIRP - 2010 Conference9
Supplemental views: Carnegie 2005 Classes
PNAIRP - 2010 Conference10
Supplemental views: Geographic
PNAIRP - 2010 Conference11

A data visualization approach to peer identification

  • 1.
    A Visualization Approachto Peer Identification October 5, 2010 Pacific Northwest Association for Institutional Research & Planning 2010 Conference
  • 2.
    Context and goals •Context – Usual set of peers was too small to provide coverage across disciplines in CUPA faculty salary survey • Goals – Find a large set of peers for discipline-level salary benchmarking via CUPA based on meaningful criteria – Process should be transparent and accessible – Ability to make adjustments
  • 3.
    Initial scope • Institutions –Active – Degree granting – Private not-for-profit institutions or Public institutions using FASB • Faculty Salary – 9-Month equated contracts – All faculty ranks total • Student – All students total
  • 4.
    Small multiples • Tufte –Envisioning Information (1990) 1 – Illustrations of postage-stamp size are indexed by category or a label, sequenced over time like the frames of a movie, or ordered by a quantitative variable not used in the single image itself. PNAIRP - 2010 Conference4 1 – Via http://www.infovis-wiki.net/index.php/Small_Multiples
  • 5.
    Small multiples crosstab •Few – An Introduction to Visual Multivariate Analysis (2006) – Adds another dimension to Tufte’s model of small multiples – Enables additional variables – Better than 3D PNAIRP - 2010 Conference5
  • 6.
    Multiple Concurrent Viewswith Brushing • Few (2006) – Presents multiple graphs and tables of the same dataset – These views are linked such that selecting or clicking on a range of values in one view highlights the same records in other views PNAIRP - 2010 Conference6
  • 7.
    Method • IPEDS datacompiled in SAS • Selected variables – Type of institution • Sector • Carnegie Classes • Geographic and location – Financial qualities • Endowment • Total expenses • Tuition – Size • Number of students • Number of faculty PNAIRP - 2010 Conference7
  • 8.
    Method (cont) • Flagfor CUPA 2009-10 participation • Calculated deciles for quantitative variables – Noting position of my institution • Exported to Tableau – Build univariate and bivariate vizes – Assemble into matrix – Tableau 6.0 • Build parameters for each variable – Actually two: one for upper and the other for lower limits • Create a variable to combine the parameters and indicate if an institution fits the conditions • Add parameter controls to the dashboard/supergraphic PNAIRP - 2010 Conference8
  • 9.
    The resulting selectiondashboard/supergraphic PNAIRP - 2010 Conference9
  • 10.
    Supplemental views: Carnegie2005 Classes PNAIRP - 2010 Conference10
  • 11.