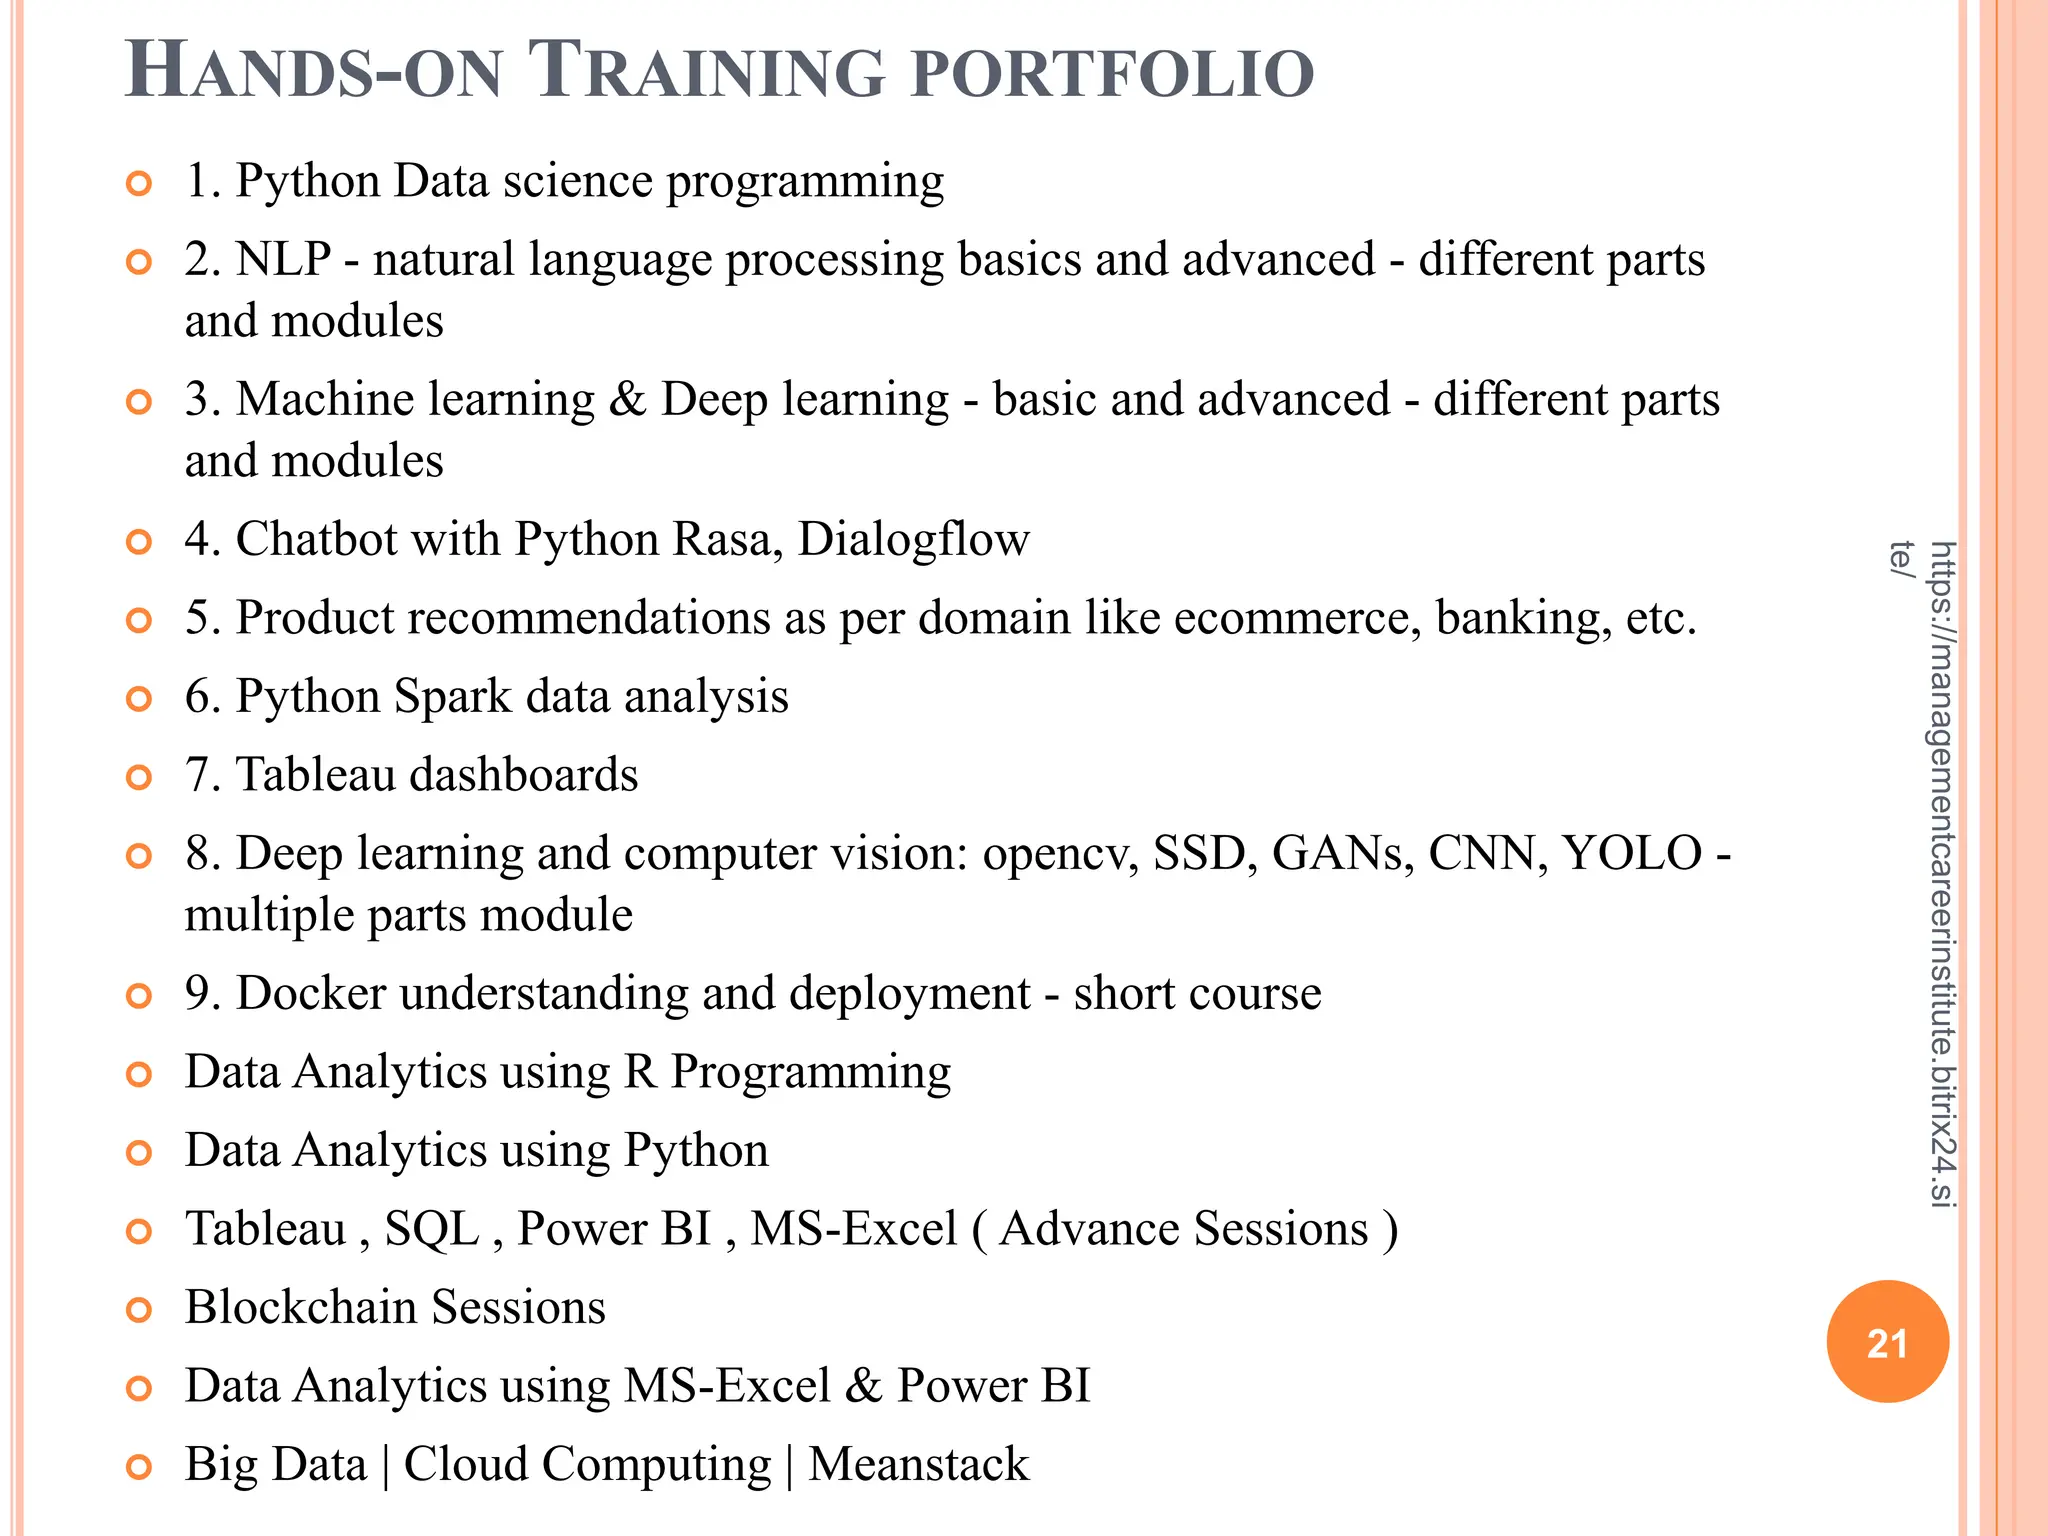
A COMPREHENSIVE LEARNING PATH TO
BECOME A DATA SCIENTIST IN 2021!
1
https://managementcareerinstitute.bitrix24.site/
WHAT’S NEW IN THE 2021 DATA SCIENCE LEARNING PATH?
 1. Extended Storytelling Skills – Storytelling is more of an art than a skill. A
good data scientist is someone who can turn insights into action with the help of
visualization. You’ll get familiarized with different visualization tools,
techniques, and strategies.
 2. Model deployment – It is perhaps the most important data science topic that
is left out of most data science courses. Any data science model is essentially
wasted unless it is deployed on an application. This learning path will introduce
you to high-quality resources to gain this important skill.
 3. Comprehensive Unsupervised learning – Dealing with unstructured data?
Unsupervised Learning is the way to go. In this edition of the learning path, we
have created a separate module for this topic so that you can perfect it!
 4. More exercises – What’s better than taking up a course just for the sake of it?
We have incorporated a high number of exercises and assignments so that you
can tickle your brain cells and give a boost to your memory.
 5. Added Projects and Jobs section – Projects are the all-powerful way to
convert conceptual and theoretical knowledge into practical knowledge. We
have introduced a new section of projects and jobs which will help you navigate
through the industry.
2
https://managementcareerinstitute.bitrix24.si
te/
SUMMARY OF THE DATA SCIENCE LEARNING PATH 2021
 Data Science Toolkit – It’s the start of your journey to becoming a
successful data scientist! In this month, you will start your journey in the
field of data science and learn about the most common and frequently
used data science tools – Python and its libraries such as Pandas,
NumPy, Matplolib, and Seaborn.
 Data Visualization – As you have cleared the basics, we will begin with
the most crucial skillset of a data scientist. The aim of this month is to
familiarize you with different data visualization tools and techniques
such as Tableau. This month will also be a starting point of your SQL
journey.
 Data Exploration – The data is hidden with important information.
Bringing out this information in the form of insights is data
exploration. In this month, you will learn how to explore your data
with Exploratory Data
Analysis (EDA). Along with this, you will also understand the important
concepts of statistics required to become a data scientist. 3
https://managementcareerinstitute.bitrix24.si
te/
 Basics of Machine Learning and the art of storytelling – Now let’s get
down to actual machine learning! From this month onwards, you will start
your Machine Learning journey. In this month, you will cover basic ML
techniques and the art of storytelling using Structured thinking.
 Advanced Machine Learning – Done with basics? It’s time to turn up
the notch! The goal of this month is to cover advanced machine learning
algorithms. You will also learn about feature engineering and how to work
with Text and Image data.
 Unsupervised Machine Learning – Dealing with unstructured data can
be challenging so let’s jump into the solution! In this month, you will learn
about unsupervised machine learning algorithms like K-Means,
Hierarchical Clustering, and finally deep dive into a project!
 Recommendation engines – Curious how Netflix, Amazon, Zomato give
such amazing recommendations? It is time for you to delve into
recommendation systems. In this month, you will learn different
techniques to build recommendation engines. We have also got an
exciting project for you fellas!
 Working with Time Series Data – Organizations around the world
depend heavily on time-series data and machine learning has made the
scenario even more exciting. In this month, you will learn how to work
with Time Series data and different techniques to solve time series
related problems.
4
https://managementcareerinstitute.bitrix24.si
te/
 Introduction to Deep Learning and Computer Vision – Deep Learning and
Computer Vision is at the forefront of the most happening projects in the field
of AI be it Self driven cars, mask detection cameras, and more. From this month
onwards, you will start your journey in the field of Deep Learning. You will
learn basic deep learning architectures and then solve different computer vision
projects.
 Basics of Natural Language Processing – Do you wonder how Social media
giants like Twitter, Facebook, Instagram process incoming text data? This
month will move your focus to the field of Natural Language Processing (NLP).
Here you will learn more deep learning architectures and solve NLP related
projects.
 Model Deployment – What is more essential than building a data science
model? Deploying it! In this month, you will learn different ways to deploy
your models. You’ll get to spend time on exploring streamlit for model
deployment, AWS, and also get to deploy the model using Flask.
 Projects and Jobs – The time has finally come to convert all your hard work
into fruition! In this final month, you will do different projects and start
applying for internships or jobs.
5
https://managementcareerinstitute.bitrix24.si
te/
SKILLS NEED TO MASTER
 Data Science Toolkit
 Data Visualization
 Data Exploration
 Basics of machine learning and the art of storytelling
 Advanced machine learning
 Unsupervised learning
 Recommendation Engine
 Time-Series data
 Deep Learning and Computer vision
 Natural Language Processing
 Model Deployments
 Projects and jobs
6
https://managementcareerinstitute.bitrix24.si
te/
 Data Science Toolkit and Python
 Key Highlights –
 What do data scientists do?
 Python for data science
 Pandas and Numpy
 Matplotlib and Seaborn
 Regular Expressions
 Data Visualization
 Key Highlights –
 Data Visualization Tools
 Introduction to Tableau | Power BI | SAS| Advance MS-Excel
 Different charts in Tableau
 SQL for Data Science
7
https://managementcareerinstitute.bitrix24.si
te/
 Data Exploration
 In this, one need to master the art of EDA (Exploratory Data Analysis) to capture insights
from our data. Another important concept to focus is Statistics. It is said that statistics is
the grammar of data science.
 Key Highlights –
 Importance of Statistics
 Descriptive Statistics
 Introduction to Probability
 Inferential Statistics
 Exploratory Data Analysis (EDA)
 Basics of machine learning and the art of storytelling.
 Key Highlights –
 Machine Learning Pipeline
 Linear Regression
 Logistic Regression
 Decision Tree
 Naive Bayes
 Support Vector Machines (SVM)
8
https://managementcareerinstitute.bitrix24.si
te/
 Advanced machine learning
 Key Highlights –
 Ensemble Learning
 Random Forest
 Boosting Algorithms
 Advanced Ensemble Learning
 Hyperparameter Tuning
 Working with Text and Image Data
 Unsupervised Learning
 Key Highlights –
 Linear Algebra Basics
 Unsupervised Machine Learning
 K-Means
 Hierarchical Clustering
 Project: Unsupervised Learning
9
https://managementcareerinstitute.bitrix24.si
te/
--- Recommendation Engines
 Key Highlights –
 Matrix Algebra
 SVD and PCA
 Recommender Sytems
 Project: Recommender System
– Time Series Data
 Key Highlights –
 Work with Time Series Data
 Time Series Forecasting Techniques
 Project: Time Series
– Deep learning and computer vision
 Key Highlights –
 Introduction to Deep Learning
 Deep Learning Architectures: MLP and CNN
 Project: Image Classification
 Transfer Learning
 Object Detection
 Project: Object Detection
10
https://managementcareerinstitute.bitrix24.si
te/
 Natural Language Processing
 Natural Language Processing has been at the forefront of the recent advancements in
machine learning in the last few years. The arrival of transfer learning in this field has
completely transformed the space.
 Key Highlights–
 Basics of Natural Language Processing (NLP)
 Deep Learning Architectures: RNN, LSTM, GRU
 Project: Text Classification
 Model deployment
 What is more essential than building a data science model? Deploying it!
 Key Highlights–
 Streamlit for Model Deployment
 Amazon Web Services (AWS)
 Deploying models using Flask
 Projects and Jobs
 You are finally ready to face the world and make a living. The time has finally come to
convert all your hard work into fruition!
 Key Highlights–
 Apply for Internships and Jobs
11
https://managementcareerinstitute.bitrix24.site/
7 TOP DATA ANALYTICS TOOLS TO USE IN
2021
 Python
 R
 SAS
 Excel
 Power BI
 Tableau
 Apache Spark
12
https://managementcareerinstitute.bitrix24.si
te/
13
https://managementcareerinstitute.bitrix24.site/
 R is the leading programming language for statistical modeling,
visualization, and data analysis. It is majorly used by statisticians for
statistical analysis, Big Data and machine learning.
 R is a free, open-source programming language and has a lot of
enhancements to it in the form of user written packages
 R is a winner when it comes to EDA(By definition - In statistics,
exploratory data analysis(EDA) is an approach to analyzing data
sets to summarize their main characteristics, often with visual
methods).
 Data manipulation in R is easy with packages such as plyr, dplyr,
and tidy.
 R is excellent when it comes to data visualization and analysis with
packages such as ggplot, lattice, ggvis, etc.
 R has a huge community of developers for support.
 R is used by
 Facebook - For behavior analysis related to status updates and profile
pictures.
 Google - For advertising effectiveness and economic forecasting.
 Twitter - For data visualization and semantic clustering
 Uber - For statistical analysis
14
https://managementcareerinstitute.bitrix24.site/
 SAS is a statistical software suite widely used for BI
(Business Intelligence), data management, and predictive
analysis.
 SAS is proprietary software, and companies need to pay
to use it.
 A free university edition has been introduced for students
to learn and use SAS.
 SAS has a simple GUI; hence it is easy to learn;
however, a good knowledge of the SAS programming
knowledge is an added advantage to use the tool.
 SAS’s DATA step (The data step is where data is created,
imported, modified, merged, or calculated) helps
inefficient data handling and manipulation. SAS’s data
analytics process is as shown:
15
https://managementcareerinstitute.bitrix24.site/
 Excel is a spreadsheet and a simple yet powerful tool for
data collection and analysis.
 Excel is not free; it is a part of the Microsoft Office “suite”
of programs.
 Excel does not need a UI to enter data; you can start right
away.
 It is readily available, widely used and easy to learn and
start on data analysis
 The Data Analysis Toolpak in Excel offers a variety of
options to perform statistical analysis of your data. The
charts and graphs in Excel give a clear interpretation and
visualization of your data, which helps in decision making
as they are easy to understand.
16
https://managementcareerinstitute.bitrix24.site/
 Power BI is yet another powerful business analytics solution by
Microsoft.
 Power BI comes in three versions – Desktop, Pro, and Premium.
 The desktop version is free for users; however, Pro and Premium
are priced versions.
 You can visualize your data connect to many data sources and
share the outcomes across your organization.
 With Power BI, you can and bring your data to life with live
dashboards and reports.
 Power BI integrates with other tools, including Microsoft Excel,
so you can get up to speed quickly and work seamlessly with
your existing solutions.
 Gartner says - Microsoft is a Magic Quadrant Leader among
analytics and business intelligence platforms
 Top companies using Power BI are Nestle, Tenneco, Ecolab, and
more.
17
https://managementcareerinstitute.bitrix24.site/
 Tableau is a BI(Business Intelligence) tool developed for data
analysts where one can visualize, analyze, and understand
their data.
 Tableau is not free software, and the pricing varies as per
different data needs
 It is easy to learn and deploy Tableau
 Tableau provides fast analytics; it can explore any type of
data – spreadsheets, databases, data on Hadoop and cloud
services
 It is easy to use as it has a powerful drag and drop features
that anyone with an intuitive mind can handle.
 The data visualization with smart dashboards can be shared
within seconds.
 Top companies that use Tableau are Amazon, Citibank,
Barclays, LinkedIn, and many more.
18
https://managementcareerinstitute.bitrix24.site/
 Skills
 Technical Skills :
 Programming Languages: As a data analyst, you should be
proficient in at least one programming language. However, the
more languages you are proficient in, the better it is. Popular
programming languages that can be used to manipulate data are
R, Python, C++, Java, MATLAB, PHP, and more.
 Data Management and Manipulation: As a data analyst, you
should be familiar with languages, such as R, HIVE, SQL, and
more.
 Building queries to extract the desired data is an essential aspect
of data analysis. Once you have analyzed the data, you would
have to create accurate reports. Some standard tools for doing the
same are SAS, Oracle Visual Analyzer, Microsoft Power BI,
Cognos, Tableau, and more.
 Soft Skills
 Domain Knowledge and Excellent Communication
Skills:
 A data analyst’s job is to provide detailed and accurate
information to the decision-makers.
 Hence, data analysts must understand the specific user
requirements, along with having a deep understanding of
the data.
 Excellent communication skills are essential for
collaboration with the various clients, executives, IT
specialists, to ensure that the data aligns well with the
business objectives.
 Ultimately, the analysis done by a data analyst
modifies/improves some business processes.
19
https://managementcareerinstitute.bitrix24.site/
20
https://managementcareerinstitute.bitrix24.site/
 Practical Skills :
 High Level of Mathematical Ability:
 Knowledge of statistics and the right comfort level with
formulae required for analyzing data to provide real-world
value.
 As a data analyst, you should have a good grasp of
mathematics, and you should be able to solve common
business problems, for example, calculating compound
interest, depreciation, statistical measures (for example, mean,
median, mode). Also, you should know how to use tables,
charts, graphs, and more. It is essential to be comfortable with
college-level algebra, thereby Making visualization of data
more appealing. Knowing linear algebra and multivariate
calculus is very helpful for data analysts as they are all
extensively used in performing Data Analysis.
 Microsoft Excel: Organizing data and calculating numbers
are among the main tasks of data analysts. Hence it is
beneficial if you are comfortable with using Excel. There are
many great online sources where you can learn how to use
Excel to its full potential.
HANDS-ON TRAINING PORTFOLIO
 1. Python Data science programming
 2. NLP - natural language processing basics and advanced - different parts
and modules
 3. Machine learning & Deep learning - basic and advanced - different parts
and modules
 4. Chatbot with Python Rasa, Dialogflow
 5. Product recommendations as per domain like ecommerce, banking, etc.
 6. Python Spark data analysis
 7. Tableau dashboards
 8. Deep learning and computer vision: opencv, SSD, GANs, CNN, YOLO -
multiple parts module
 9. Docker understanding and deployment - short course
 Data Analytics using R Programming
 Data Analytics using Python
 Tableau , SQL , Power BI , MS-Excel ( Advance Sessions )
 Blockchain Sessions
 Data Analytics using MS-Excel & Power BI
 Big Data | Cloud Computing | Meanstack
21
https://managementcareerinstitute.bitrix24.si
te/
CONTACT COORDINATES :
 Website: https://managementcareerinstitute.bitrix24.site/
 https://www.linkedin.com/school/management-career-
institute/
 https://www.linkedin.com/in/kunal-soni/
 Mobile : +91-9977220325
 Email : mcimarcommteam@gmail.com
 managementcareerinstitute@gmail.com
 Skype id : kunal2529
 kunal2529@outlook.com
22
https://managementcareerinstitute.bitrix24.site/

A Comprehensive Learning Path to Become a Data Science 2021.pptx

  • 1.
    A COMPREHENSIVE LEARNINGPATH TO BECOME A DATA SCIENTIST IN 2021! 1 https://managementcareerinstitute.bitrix24.site/
  • 2.
    WHAT’S NEW INTHE 2021 DATA SCIENCE LEARNING PATH?  1. Extended Storytelling Skills – Storytelling is more of an art than a skill. A good data scientist is someone who can turn insights into action with the help of visualization. You’ll get familiarized with different visualization tools, techniques, and strategies.  2. Model deployment – It is perhaps the most important data science topic that is left out of most data science courses. Any data science model is essentially wasted unless it is deployed on an application. This learning path will introduce you to high-quality resources to gain this important skill.  3. Comprehensive Unsupervised learning – Dealing with unstructured data? Unsupervised Learning is the way to go. In this edition of the learning path, we have created a separate module for this topic so that you can perfect it!  4. More exercises – What’s better than taking up a course just for the sake of it? We have incorporated a high number of exercises and assignments so that you can tickle your brain cells and give a boost to your memory.  5. Added Projects and Jobs section – Projects are the all-powerful way to convert conceptual and theoretical knowledge into practical knowledge. We have introduced a new section of projects and jobs which will help you navigate through the industry. 2 https://managementcareerinstitute.bitrix24.si te/
  • 3.
    SUMMARY OF THEDATA SCIENCE LEARNING PATH 2021  Data Science Toolkit – It’s the start of your journey to becoming a successful data scientist! In this month, you will start your journey in the field of data science and learn about the most common and frequently used data science tools – Python and its libraries such as Pandas, NumPy, Matplolib, and Seaborn.  Data Visualization – As you have cleared the basics, we will begin with the most crucial skillset of a data scientist. The aim of this month is to familiarize you with different data visualization tools and techniques such as Tableau. This month will also be a starting point of your SQL journey.  Data Exploration – The data is hidden with important information. Bringing out this information in the form of insights is data exploration. In this month, you will learn how to explore your data with Exploratory Data Analysis (EDA). Along with this, you will also understand the important concepts of statistics required to become a data scientist. 3 https://managementcareerinstitute.bitrix24.si te/
  • 4.
     Basics ofMachine Learning and the art of storytelling – Now let’s get down to actual machine learning! From this month onwards, you will start your Machine Learning journey. In this month, you will cover basic ML techniques and the art of storytelling using Structured thinking.  Advanced Machine Learning – Done with basics? It’s time to turn up the notch! The goal of this month is to cover advanced machine learning algorithms. You will also learn about feature engineering and how to work with Text and Image data.  Unsupervised Machine Learning – Dealing with unstructured data can be challenging so let’s jump into the solution! In this month, you will learn about unsupervised machine learning algorithms like K-Means, Hierarchical Clustering, and finally deep dive into a project!  Recommendation engines – Curious how Netflix, Amazon, Zomato give such amazing recommendations? It is time for you to delve into recommendation systems. In this month, you will learn different techniques to build recommendation engines. We have also got an exciting project for you fellas!  Working with Time Series Data – Organizations around the world depend heavily on time-series data and machine learning has made the scenario even more exciting. In this month, you will learn how to work with Time Series data and different techniques to solve time series related problems. 4 https://managementcareerinstitute.bitrix24.si te/
  • 5.
     Introduction toDeep Learning and Computer Vision – Deep Learning and Computer Vision is at the forefront of the most happening projects in the field of AI be it Self driven cars, mask detection cameras, and more. From this month onwards, you will start your journey in the field of Deep Learning. You will learn basic deep learning architectures and then solve different computer vision projects.  Basics of Natural Language Processing – Do you wonder how Social media giants like Twitter, Facebook, Instagram process incoming text data? This month will move your focus to the field of Natural Language Processing (NLP). Here you will learn more deep learning architectures and solve NLP related projects.  Model Deployment – What is more essential than building a data science model? Deploying it! In this month, you will learn different ways to deploy your models. You’ll get to spend time on exploring streamlit for model deployment, AWS, and also get to deploy the model using Flask.  Projects and Jobs – The time has finally come to convert all your hard work into fruition! In this final month, you will do different projects and start applying for internships or jobs. 5 https://managementcareerinstitute.bitrix24.si te/
  • 6.
    SKILLS NEED TOMASTER  Data Science Toolkit  Data Visualization  Data Exploration  Basics of machine learning and the art of storytelling  Advanced machine learning  Unsupervised learning  Recommendation Engine  Time-Series data  Deep Learning and Computer vision  Natural Language Processing  Model Deployments  Projects and jobs 6 https://managementcareerinstitute.bitrix24.si te/
  • 7.
     Data ScienceToolkit and Python  Key Highlights –  What do data scientists do?  Python for data science  Pandas and Numpy  Matplotlib and Seaborn  Regular Expressions  Data Visualization  Key Highlights –  Data Visualization Tools  Introduction to Tableau | Power BI | SAS| Advance MS-Excel  Different charts in Tableau  SQL for Data Science 7 https://managementcareerinstitute.bitrix24.si te/
  • 8.
     Data Exploration In this, one need to master the art of EDA (Exploratory Data Analysis) to capture insights from our data. Another important concept to focus is Statistics. It is said that statistics is the grammar of data science.  Key Highlights –  Importance of Statistics  Descriptive Statistics  Introduction to Probability  Inferential Statistics  Exploratory Data Analysis (EDA)  Basics of machine learning and the art of storytelling.  Key Highlights –  Machine Learning Pipeline  Linear Regression  Logistic Regression  Decision Tree  Naive Bayes  Support Vector Machines (SVM) 8 https://managementcareerinstitute.bitrix24.si te/
  • 9.
     Advanced machinelearning  Key Highlights –  Ensemble Learning  Random Forest  Boosting Algorithms  Advanced Ensemble Learning  Hyperparameter Tuning  Working with Text and Image Data  Unsupervised Learning  Key Highlights –  Linear Algebra Basics  Unsupervised Machine Learning  K-Means  Hierarchical Clustering  Project: Unsupervised Learning 9 https://managementcareerinstitute.bitrix24.si te/
  • 10.
    --- Recommendation Engines Key Highlights –  Matrix Algebra  SVD and PCA  Recommender Sytems  Project: Recommender System – Time Series Data  Key Highlights –  Work with Time Series Data  Time Series Forecasting Techniques  Project: Time Series – Deep learning and computer vision  Key Highlights –  Introduction to Deep Learning  Deep Learning Architectures: MLP and CNN  Project: Image Classification  Transfer Learning  Object Detection  Project: Object Detection 10 https://managementcareerinstitute.bitrix24.si te/
  • 11.
     Natural LanguageProcessing  Natural Language Processing has been at the forefront of the recent advancements in machine learning in the last few years. The arrival of transfer learning in this field has completely transformed the space.  Key Highlights–  Basics of Natural Language Processing (NLP)  Deep Learning Architectures: RNN, LSTM, GRU  Project: Text Classification  Model deployment  What is more essential than building a data science model? Deploying it!  Key Highlights–  Streamlit for Model Deployment  Amazon Web Services (AWS)  Deploying models using Flask  Projects and Jobs  You are finally ready to face the world and make a living. The time has finally come to convert all your hard work into fruition!  Key Highlights–  Apply for Internships and Jobs 11 https://managementcareerinstitute.bitrix24.site/
  • 12.
    7 TOP DATAANALYTICS TOOLS TO USE IN 2021  Python  R  SAS  Excel  Power BI  Tableau  Apache Spark 12 https://managementcareerinstitute.bitrix24.si te/
  • 13.
    13 https://managementcareerinstitute.bitrix24.site/  R isthe leading programming language for statistical modeling, visualization, and data analysis. It is majorly used by statisticians for statistical analysis, Big Data and machine learning.  R is a free, open-source programming language and has a lot of enhancements to it in the form of user written packages  R is a winner when it comes to EDA(By definition - In statistics, exploratory data analysis(EDA) is an approach to analyzing data sets to summarize their main characteristics, often with visual methods).  Data manipulation in R is easy with packages such as plyr, dplyr, and tidy.  R is excellent when it comes to data visualization and analysis with packages such as ggplot, lattice, ggvis, etc.  R has a huge community of developers for support.  R is used by  Facebook - For behavior analysis related to status updates and profile pictures.  Google - For advertising effectiveness and economic forecasting.  Twitter - For data visualization and semantic clustering  Uber - For statistical analysis
  • 14.
    14 https://managementcareerinstitute.bitrix24.site/  SAS isa statistical software suite widely used for BI (Business Intelligence), data management, and predictive analysis.  SAS is proprietary software, and companies need to pay to use it.  A free university edition has been introduced for students to learn and use SAS.  SAS has a simple GUI; hence it is easy to learn; however, a good knowledge of the SAS programming knowledge is an added advantage to use the tool.  SAS’s DATA step (The data step is where data is created, imported, modified, merged, or calculated) helps inefficient data handling and manipulation. SAS’s data analytics process is as shown:
  • 15.
    15 https://managementcareerinstitute.bitrix24.site/  Excel isa spreadsheet and a simple yet powerful tool for data collection and analysis.  Excel is not free; it is a part of the Microsoft Office “suite” of programs.  Excel does not need a UI to enter data; you can start right away.  It is readily available, widely used and easy to learn and start on data analysis  The Data Analysis Toolpak in Excel offers a variety of options to perform statistical analysis of your data. The charts and graphs in Excel give a clear interpretation and visualization of your data, which helps in decision making as they are easy to understand.
  • 16.
    16 https://managementcareerinstitute.bitrix24.site/  Power BIis yet another powerful business analytics solution by Microsoft.  Power BI comes in three versions – Desktop, Pro, and Premium.  The desktop version is free for users; however, Pro and Premium are priced versions.  You can visualize your data connect to many data sources and share the outcomes across your organization.  With Power BI, you can and bring your data to life with live dashboards and reports.  Power BI integrates with other tools, including Microsoft Excel, so you can get up to speed quickly and work seamlessly with your existing solutions.  Gartner says - Microsoft is a Magic Quadrant Leader among analytics and business intelligence platforms  Top companies using Power BI are Nestle, Tenneco, Ecolab, and more.
  • 17.
    17 https://managementcareerinstitute.bitrix24.site/  Tableau isa BI(Business Intelligence) tool developed for data analysts where one can visualize, analyze, and understand their data.  Tableau is not free software, and the pricing varies as per different data needs  It is easy to learn and deploy Tableau  Tableau provides fast analytics; it can explore any type of data – spreadsheets, databases, data on Hadoop and cloud services  It is easy to use as it has a powerful drag and drop features that anyone with an intuitive mind can handle.  The data visualization with smart dashboards can be shared within seconds.  Top companies that use Tableau are Amazon, Citibank, Barclays, LinkedIn, and many more.
  • 18.
    18 https://managementcareerinstitute.bitrix24.site/  Skills  TechnicalSkills :  Programming Languages: As a data analyst, you should be proficient in at least one programming language. However, the more languages you are proficient in, the better it is. Popular programming languages that can be used to manipulate data are R, Python, C++, Java, MATLAB, PHP, and more.  Data Management and Manipulation: As a data analyst, you should be familiar with languages, such as R, HIVE, SQL, and more.  Building queries to extract the desired data is an essential aspect of data analysis. Once you have analyzed the data, you would have to create accurate reports. Some standard tools for doing the same are SAS, Oracle Visual Analyzer, Microsoft Power BI, Cognos, Tableau, and more.
  • 19.
     Soft Skills Domain Knowledge and Excellent Communication Skills:  A data analyst’s job is to provide detailed and accurate information to the decision-makers.  Hence, data analysts must understand the specific user requirements, along with having a deep understanding of the data.  Excellent communication skills are essential for collaboration with the various clients, executives, IT specialists, to ensure that the data aligns well with the business objectives.  Ultimately, the analysis done by a data analyst modifies/improves some business processes. 19 https://managementcareerinstitute.bitrix24.site/
  • 20.
    20 https://managementcareerinstitute.bitrix24.site/  Practical Skills:  High Level of Mathematical Ability:  Knowledge of statistics and the right comfort level with formulae required for analyzing data to provide real-world value.  As a data analyst, you should have a good grasp of mathematics, and you should be able to solve common business problems, for example, calculating compound interest, depreciation, statistical measures (for example, mean, median, mode). Also, you should know how to use tables, charts, graphs, and more. It is essential to be comfortable with college-level algebra, thereby Making visualization of data more appealing. Knowing linear algebra and multivariate calculus is very helpful for data analysts as they are all extensively used in performing Data Analysis.  Microsoft Excel: Organizing data and calculating numbers are among the main tasks of data analysts. Hence it is beneficial if you are comfortable with using Excel. There are many great online sources where you can learn how to use Excel to its full potential.
  • 21.
    HANDS-ON TRAINING PORTFOLIO 1. Python Data science programming  2. NLP - natural language processing basics and advanced - different parts and modules  3. Machine learning & Deep learning - basic and advanced - different parts and modules  4. Chatbot with Python Rasa, Dialogflow  5. Product recommendations as per domain like ecommerce, banking, etc.  6. Python Spark data analysis  7. Tableau dashboards  8. Deep learning and computer vision: opencv, SSD, GANs, CNN, YOLO - multiple parts module  9. Docker understanding and deployment - short course  Data Analytics using R Programming  Data Analytics using Python  Tableau , SQL , Power BI , MS-Excel ( Advance Sessions )  Blockchain Sessions  Data Analytics using MS-Excel & Power BI  Big Data | Cloud Computing | Meanstack 21 https://managementcareerinstitute.bitrix24.si te/
  • 22.
    CONTACT COORDINATES : Website: https://managementcareerinstitute.bitrix24.site/  https://www.linkedin.com/school/management-career- institute/  https://www.linkedin.com/in/kunal-soni/  Mobile : +91-9977220325  Email : mcimarcommteam@gmail.com  managementcareerinstitute@gmail.com  Skype id : kunal2529  kunal2529@outlook.com 22 https://managementcareerinstitute.bitrix24.site/