
More Related Content
Similar to A brief of history of the 1987 stock market crash
Similar to A brief of history of the 1987 stock market crash (20)
Recently uploaded
Recently uploaded (20)
A brief of history of the 1987 stock market crash
- 1. Finance and Economics Discussion Series Divisions of Research & Statistics and Monetary Affairs Federal Reserve Board, Washington, D.C. A Brief History of the 1987 Stock Market Crash with a Discussion of the Federal Reserve Response Mark Carlson 2007-13 NOTE: Staff working papers in the Finance and Economics Discussion Series (FEDS) are preliminary materials circulated to stimulate discussion and critical comment. The analysis and conclusions set forth are those of the authors and do not indicate concurrence by other members of the research staff or the Board of Governors. References in publications to the Finance and Economics Discussion Series (other than acknowledgement) should be cleared with the author(s) to protect the tentative character of these papers.
- 2. A Brief History of the 1987 Stock Market Crash with a Discussion of the Federal Reserve Response Mark Carlson∗ Board of Governors of the Federal Reserve November 2006 Abstract The 1987 stock market crash was a major systemic shock. Not only did the prices of many financial assets tumble, but market functioning was severely impaired. This paper reviews the events surrounding the crash and discusses the response of the Federal Reserve, which responded in a number of ways to support the operation of financial markets, including the provision of liquidity, in a highly visible fashion. JEL classification: E58, G18, N22 Key words: lender of last resort, financial stability, Federal Reserve, stock market crash ∗ Board of Governors of the Federal Reserve; 20th Street and Constitution Avenuel; Washington, DC 20551. Mark.A.Carlson@frb.gov. The author is grateful to Bill English, Bill Nelson, Roberto Perli and other Federal Reserve staff for helpful comments. Kristen Payne provided valuable research assistance. All errors are my own. The views presented in this paper are solely those of the author and do not necessarily represent those of the Federal Reserve Board or its staff.
- 3. On October 19, 1987, the stock market, along with the associated futures and options markets, crashed, with the S&P 500 stock market index falling about 20 percent. The market crash of 1987 is a significant event not just because of the swiftness and severity of the market decline, but also because it showed the weaknesses of the trading systems themselves and how they could be strained and come close to breaking in extreme conditions. The problems in the trading systems interacted with the price declines to make the crisis worse. One notable problem was the difficulty gathering information in the rapidly changing and chaotic environment. The systems in place simply were not capable of processing so many transactions at once.1 Uncertainty about information likely contributed to a pull back by investors from the market. Another factor was the record margin calls that accompanied the large price changes. While necessary to protect the solvency of the clearinghouse processing the trades, the size of the margin calls and the timing of payments served to reduce market liquidity. Finally, some have argued that “program trades,” which led to notable volumes of large securities sales contributed to overwhelming the system. The Federal Reserve was active in providing highly visible liquidity support in an effort to bolster market functioning. In particular, the Federal Reserve eased short-term credit conditions by conducting more expansive open market operations at earlier-than-usual times, issuing public statements affirming its commitment to providing liquidity, and temporarily liberalizing the rules governing the lending of Treasury securities from its portfolio. The liquidity support was important by itself, but the public nature of the activities likely helped support market confidence. The Federal Reserve also encouraged the commercial banking system to extend liquidity support to other financial market participants.2 The response of the Federal Reserve was well received and was seen as important in helping financial markets return to more normal functioning. The purpose of this paper is to provide a useful history of the 1987 stock market crash and the factors contributing to its severity and also to illustrate some of the tools the Federal Reserve has at its disposal to deal with financial crises. Section 1 of the paper provides some pertinent 1 These systems have all been upgraded dramatically since the 1987 crash. Indeed, the crash may have provided some impetus for the upgrades. 2 These activities are discussed in Greenspan (1988). 2
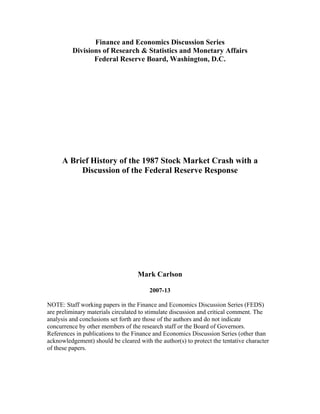
- 4. background information on developments in equity markets and trading strategies preceding the crash. A timeline of the crisis is presented in Section 2. Section 3 discusses some factors that contributed to the severity of the crisis and that threatened market functioning. Section 4 details the actions taken by the Federal Reserve. Section 5 concludes. 1 Background During the years prior to the crash, equity markets had been posting strong gains (see Figure 1). Price increases outpaced earnings growth and lifted price-earnings ratios; some com- mentators warned that the market had become overvalued (see for example Wall Street Journal (1987a) and Anders and Garcia (1987)). There had been an influx of new investors, such as pension funds, into the stock market during the 1980s, and the increased demand helped support prices (Katzenbach 1987). Equities were also boosted by some favorable tax treatments given to the financing of corporate buyouts, such as allowing firms to deduct interest expenses associated with debt issued during a buyout, which increased the number of companies that were potential takeover targets and pushed up their stock prices (Presidential Task Force on Market Mechanisms (Brady Report) 1988). Figure 1: 100 150 200 250 300 350 1980 1981 1982 1983 1984 1985 1986 1987 10 15 20 25 S&P 500 index (left scale) Price−earnings ratio (right scale) Stock market indicators Monthly Source. Market data. Oct. 1987 3
- 5. However, the macroeconomic outlook during the months leading up to the crash had become somewhat less certain. Interest rates were rising globally. A growing U.S. trade deficit and decline in the value of the dollar were leading to concerns about inflation and the need for higher interest rates in the U.S. as well (Winkler and Herman 1987). Importantly, financial markets had seen an increase in the use of “program trading” strate- gies, where computers were set up to quickly trade particular amounts of a large number of stocks, such as those in a particular stock index, when certain conditions were met.3 There were two pro- gram trading strategies that have often been tied to the stock market crash. The first was “portfolio insurance,” which was supposed to limit the losses investors might face from a declining market. Under this strategy, computer models were used to compute optimal stock-to-cash ratios at various market prices. Broadly, the models would suggest that the investor decrease the weight on stocks during falling markets, thereby reducing exposure to the falling market, while during rising markets the models would suggest an increased weight on stocks. Buying portfolio insurance was similar to buying a put option in that it allowed investors to preserve upside gains but limit downside risk. In practice, many portfolio insurers conducted their operations in the futures market rather than in the cash market. By buying stock index futures in a rising market and selling them in a falling market, portfolio insurers could provide protection against losses from falling equity prices without trading stocks. Trading in the futures market was generally preferred as it was cheaper and many of the institutions that provided portfolio insurance were not authorized to trade their clients’ stock (Brady Report 1988, p. 7). Portfolio insurers did not continually update their analysis about the optimal portfolio of stocks and cash holdings, as the procedure was time consuming and transaction costs could add up with constant re-optimizing; instead, portfolio insurers ran the models period- ically and then traded in batches (Garcia 1987). There were concerns that the use of portfolio insurance could lead many investors to sell stocks and futures simultaneously; there was an article in the Wall Street Journal on October 12 citing concerns that during a declining stock market, the use of portfolio insurance “could snowball into a stunning rout for stocks” (Garcia 1987). 3 See also Katzenbach (1987), who provides a detailed description of the different types of program trading strategies described here. 4
- 6. The second program trading strategy was “index arbitrage,” which was designed to produce profits by exploiting discrepancies between the value of stocks in an index and the value of the stock- index futures contracts. If the value of the stocks was lower than the value of the futures contract, then index arbitragers would buy the stocks in the cash market and sell the futures contract knowing that the prices would have to converge at the time the futures contract expired. The reverse transactions could be executed if the value of stocks was above that of the futures contract; however, rules restricting short-sales made this trade more difficult to implement for arbitragers that did not own stocks (Katzenbach 1987, p. 12).4 The use of program trading was facilitated on the New York Stock Exchange (NYSE) by the use of the designated order turnaround (DOT) system (Katzenbach 1987). This order processing system allowed NYSE member firms to transmit large volumes of buy and sell orders through their own connections to the NYSE common message switch and have them routed to a specialist/trading post.5 If the specialist did not report execution of the trade within three minutes, the NYSE gave confirmation of execution at a reference price. If the trade was not made with a third party, then the trade was put on the specialist’s account (Brady Report 1988, Study VI, p. 11). The automatic nature of the DOT system enabled it to handle the large number of trades needed for the successful implementation of program trading strategies. 2 Timeline of the crash The review of the crash presented here focuses on developments at the NYSE and on the the Chicago Mercantile Exchange (CME) and the Chicago Board of Trade (CBOT), exchanges where options and futures for popular stock indexes, such as the S&P 500, were traded.6 4 The Securities Exchange Act Rule 10a-1 prohibited short sales of the stocks when the bid price was lower than the last reported trading price. 5 A specialist at the NYSE is an exchange member in charge of making a market in a particular stock or stocks. All stocks are assigned to a specialist. The specialist has a monopoly on arranging the market for the stocks and in return has an obligation to make a market when there are order imbalances by buying/selling when there are numerous sell/buy orders from other market participants (Saunders and Cornett 2007, p. 259). 6 There were also notable problems in the over-the-counter stock market. Market makers in the over-the-counter market were not obligated to maintain an orderly market and many withdrew from trading. Delays in processing trades resulted in investors receiving prices very different from what they expected. Many brokers did not answer 5
- 7. 2.1 Wednesday, October 14 - Friday, October 16, 1987 Two events Wednesday morning have been pointed to as precipitating a decline in the stock market that continued for the rest of the week. First, news organizations reported that the Ways and Means Committee of the U.S. House of Representatives had filed legislation to eliminate tax benefits associated with financing mergers (Securities and Exchange Commission (SEC) Report 1988, p. 3-10).7 Stocks’ values were reassessed as investors reduced the odds that certain companies would be take-over targets. Second, the Commerce Department’s announcement of the trade deficit for August was notably above expectations. On this news, the dollar declined and expectations that the Federal Reserve would tighten policy increased (Wall Street Journal 1987b). Interest rates rose, putting further downward pressure on equity prices (see Figure 2). Figure 2: Oct. 14 Oct. 15 Oct. 16 Oct. 19 Oct. 20 Oct. 21 200 225 250 275 300 325 350 S&P 500 index around the time of the crash 5−minute intervals Source. Market data. Commerce report on trade deficit Reports that a House committee filed legislation to eliminate tax benefits associated with financing mergers 9:30 NYSE opens but many prices stale 1:09 News report of SEC Chairman’s comments 8:41 (line at 9:30) Federal Reserve announcement 11:45 CBOE suspends trading 12:15 CME suspends trading 1:04 CBOE & CME reopen their phones, leaving investors unable to reach them. Erratic price movements and quotes resulted in frequent lock- ups in the electronic trading system used in the over-the-counter market. For further details on the problems in the over-the-counter market see the discussion in the Brady Report (1998, Study VI, pp. 49-63). 7 The proposal would have eliminated the tax deductions for some interest expenses and would have started taxing “greenmail”—payments made by companies to corporate raiders to buy back their stock at above-market prices to prevent the raider from taking over the company. 6
- 8. On Thursday, equity markets continued to decline. Some of this decrease was attributed to anxiety among institutions, especially pension funds, and among individual investors, which led to a movement of funds from stocks into the relative safety of bonds (Wall Street Journal 1987c). There was also heavy selling during the last half hour of the day amid heavier-than-usual activity by portfolio insurers (Brady Report 1988, p. 21). Markets continued to decline on Friday, as ongoing anxiety was augmented by some technical factors. A variety of stock index options expired on Friday; price movements during the previous two days had eliminated many at-the-money options so that investors could not easily roll their positions into new contracts for hedging purposes. These developments pushed more investors into the futures markets, where they sold futures contracts as a hedge against falling stocks.8 Increased sales of futures contracts created a price discrepancy between the value of the stock index in the futures market and the value of the stocks on the NYSE. Index arbitrage traders reportedly took advantage of this price discrepancy to buy futures and sell stocks, which transmitted the downward pressures to the NYSE (Brady Report 1988, Study III, p. 12). By the end of the day on Friday, markets had fallen considerably, with the S&P 500 down over nine percent for the week. This decrease was one of the largest one-week declines of the preceeding couple of decades, and it helped set the stage for the turmoil the following week (Wall Street Journal 1987d). Portfolio insurers were left with an “overhang” as their models suggested that they should sell more stocks or futures contracts (SEC Report 1988, p. 2-10). Mutual funds experienced redemptions and needed to sell shares (Brady Report 1988, p. 29).9 Further, some aggressive institutions anticipated the portfolio insurance sales and mutual fund redemptions and wanted to pre-empt the sales by selling first (Brady Report 1988, p. 29; SEC Report 1988, p. 3- 12).10 There were some signs that futures markets were already starting to feel the effects of 8 This activity was similar to the technique used by portfolio insurers. 9 The SEC (1988, pp. 2-17—2-18) indicated that these sales were largely attributable to one major mutual fund complex. 10 While there were some concerns about institutions frontrunning customer accounts during the crash (see SEC Report 1988, pp. 3-30—3-33), that need not be the case described here. Institutions with knowledge of how portfolio insurance models worked, or that read newspapers with stories of investor concern about the market decline (for instance the Wall Street Journal (1987c, Oct. 16)), may well have guessed that other institutions would be entering 7
- 9. heavier-than-usual volumes, with traders on the Chicago Mercantile Exchange (CME) meeting on Saturday to try to settle positions and sort out holdings (Wall Street Journal 1987d). 2.2 Monday, October 19, 1987 There was substantial selling pressure on the NYSE at the open on Monday with a large imbalance in the number of sell orders relative to buy orders (SEC Report 1988, p. 2-13). In this situation, many specialists did not open for trading during the first hour.11 The SEC noted “by 10:00, 95 S&P stocks, representing 30% of the index value, were still not open” (1988, p. 2-13); the Wall Street Journal indicated that 11 of the 30 stocks in the Dow Jones Industrial Average opened late (1987e). The values of stock market indicies are calculated using the most recent price quotes for the underlying stocks. With stocks not trading, some of the quotes used to construct market indexes were stale, so the values of these indexes did not decline as much as they might have otherwise (SEC Report 1988, p. 2-13). By contrast, the futures market opened on time with heavy selling. With stale quotes in the cash market and declining prices in the futures market, a gap was created between the value of stock indexes in the cash market and in the futures market (Chicago Mercantile Exchange, Committee of Inquiry 1987, pp. 18-29). Index arbitrage traders reportedly sought to take advantage of this gap by entering sell-at-market orders on the NYSE. When stocks finally opened, prices gapped down and the index arbitragers discovered they had sold stocks considerably below what they had been expecting and tried to cover themselves by buying in the futures market. This activity precipitated a temporary rebound in prices, visible in Figure 2, but added to the confusion (Brady Report 1988, p. 30). As stocks opened notably lower, portfolio insurers’ models prompted them to resume sales. These institutions sold in both the cash and futures markets rather than just in the futures market as was typically the practice (SEC Report 1988, pp. 2-15—2-16). Sales by these and other insti- tutions overwhelmed the rally. Significant selling continued throughout the remainder of the day sell orders on behalf of customers on Monday morning and tried to pre-empt these sales. 11 NYSE regulations allowed specialists to delay opening the stock for trading or suspend trading during the day with the permission of a floor official if the specialist believed that amount of buying or selling needed to resolve an order imbalance exceeded his obligation to provide an orderly market. 8
- 10. with equity prices declining steeply during the last hour and a half of trading. The Dow Jones Industrial Average, S&P 500, and Wilshire 5000 declined between 18 and 23 percent on the day amid deteriorating trading conditions (Brady Report 1988, Study III, p. 21). The S&P 500 futures contract declined 29 percent (SEC Report 1988, p. 2-12). In comments following a speech, the SEC Chairman reportedly said that “there is some point, and I don’t know what point that is, that I would be interested in talking to the New York Stock Exchange about a temporary, very temporary, halt in trading” (Wall Street Journal 1987f). This news broke shortly after 1:00 and started rumors in futures exchanges that the NYSE would be closed, prompting further sales as traders reportedly worried that a market close would lock them into their existing positions (Wall Street Journal 1987f).12 The record trading volume on Oct. 19 overwhelmed many systems. On the NYSE, for example, trade executions were reported more than an hour late, which reportedly caused confusion among traders. Investors did not know whether limit orders had been executed or whether new limits needed to be set (Brady Report 1988, Study III, p. 21). Selling on Monday was reportedly highly concentrated. The top ten sellers accounted for 50 percent of non-market-maker volume in the futures market (Brady Report 1988, p. 36); many of these institutions were providers of portfolio insurance. One large institution started selling large blocks of stock around 10:00 in the morning and sold thirteen installments of just under $100 million each for a total of $1.1 billion during the day. Many of the NYSE specialists reportedly tried to lean against the wind and support their stocks (though others apparently did not). The SEC reported that many specialists were heavy buyers early on Monday (SEC Report 1988, p. 4-9). However, as prices fell and the position of many specialists deteriorated, they started to lose the ability to continue to defend the stocks they 12 In later Congressional testimony, the SEC Chairman stated that he had been misinterpreted. Chairman Ruder reported that in his comments he had noted that he had been in contact with the president of the NYSE prior to his speech and responded to a question regarding how one could respond to a volatile market, with a previously used statement that “Well, one of the things one might do is to have a temporary trading halt, a very, very temporary trading halt” (Ruder 1987, p. 69). The Chairman indicated that his statements about being in contact with the president of the NYSE and about a possible trading halt had not been linked in his comments but were in the press report. 9
- 11. were assigned (Brady Report 1988, Study VI, p. 42). 2.3 Tuesday, October 20, 1987 Before the opening of financial markets on Tuesday, the Federal Reserve issued a short statement that said: The Federal Reserve, consistent with its responsibilities as the Nation’s central bank, affirmed today its readiness to serve as a source of liquidity to support the economic and financial system. This statement reportedly contributed significantly toward supporting market sentiment (Murray 1987b). Perhaps spurred by this event, and despite precipitous declines in foreign stock markets overnight, the NYSE rebounded at the open (Brady Report 1988, p. 36-40). Still, trading on Tuesday continued to be significantly impaired. Over the course of the day, about seven percent of stocks, including some of the most active, reportedly were closed for trading by the specialists as order imbalances made maintaining orderly markets difficult (Brady Report 1988, p. 45). Prior to the start of trading, the NYSE moved to prevent index arbitrage program traders from using the DOT system to execute trades, which may have affected the depth of the market. Before it opens, the CME clearinghouse collects margin payments from members to cover losses that occurred the previous day on their open positions. (Margins will be discussed in some detail below.) Margin payments are then made to members for open positions in which the value improved the previous day. Typically these payments are completed by noon. On October 20, two CME clearinghouse members had not received margin payments due to them by noon, which started rumors about the solvency of the CME and its ability to make these payments. These rumors proved unfounded but nevertheless reportedly deterred some investors from trading on the CME (Brady Report 1988, p. 40). Bid-ask spreads widened, and trading was characterized as disorderly (Brady Report Study VI, pp. 64-65). 10
- 12. The typical program trading patterns were broken up. Portfolio insurers were active sellers in the futures market and pushed down prices there. Usually, index arbitragers would use this as an opportunity to buy in the futures market and sell in the cash market, which would mitigate pressure in the futures market. However, index arbitrage traders were not active, due, in part, to the NYSE’s restrictions regarding use of the DOT system. This unusual pattern served to partly decouple prices in the futures and cash markets (Brady Report 1988, Study III, pp. 22-26). With the number of trading halts for individual stocks on the NYSE and the possibility that the exchange might close, trading of many stock-index derivative products was suspended on the Chicago Board Options Exchange (CBOE) at 11:45 am and on the CME at 12:15 pm (SEC Report 1988, pp. 2-20—2-21).13 These closures completed the de-linkage between the futures and cash markets and stocks on the NYSE began to rebound. The rise in the market was attributed in part to the removal of a “billboard,” effect as the futures quotes had continually suggested that futures market participants expected the cash market to decline, and to a further reduction in selling associated with portfolio insurance (Brady Report 1988, p. 40; SEC Report 1988, p. 2-24). However, the stock market declined again once the futures markets re-opened just after 1:00 pm. Later in the afternoon, there was a sustained rise in financial markets as corporations announced stock buyback programs to support demand for their stocks (Brady Report 1988, p. 41). Corporations had started announcing these programs Monday afternoon, but it was not until partway through Tuesday that a critical mass had formed. 3 Factors that contributed to the severity of the crash There were several factors that are thought, at least by some, to have increased the severity of the market collapse that are worth discussing a bit more in depth. The first is the impact of margin calls on market liquidity and market operation. The second is the role of program trading strategies. The third is the difficulty obtaining reliable information. 13 The SEC reports that the NYSE informed the commission that it was considering closing the exchange (SEC Report 1988, p. 2-20). CME Executive Committee Chairman Melamed also recalls that NYSE officials indicated to him that they might close the NYSE (Melamed and Tamakin 1996, Chapter 31). 11
- 13. 3.1 Margin Calls Margin calls, as they were implemented during this period, were one factor that reduced market liquidity, especially in the futures markets, and likely contributed to the severity of the decline.14 When investors entered into a contract in futures markets, they were required to post a portion of the value of that contract, called a margin, in an account with the broker. Brokers in turn posted margins with the exchange on behalf of their clients and for their proprietary trading desk. Margin requirements could be met by posting cash or selected instruments such as Treasury securities. If the value of the investor’s position declined due to changes in market prices, his margin account was debited and he was generally required to post additional margin to his account to ensure that he would be able to meet his obligations when the contracts expired; this action is referred to as a margin call (Brady Report 1988, Study VI, pp. 23-24, Saunders and Cornett 2007). The funds debited from the accounts of investors whose positions declined were used to credit accounts of investors whose positions improved. When adjusting the margin accounts, the exchanges first made margin calls against all the positions that lost value and then later credited accounts belonging to investors whose positions gained in value (so even if an investors had offsetting positions, they would be required to post margin on the position that lost money and would only receive credit for the position that gained in value later.) Calls for additional margin could be made throughout the day, and were always done at the end of the day. For intraday margin calls, investors needed to post additional margin within the hour; for end-of-day margin calls, additional margin were required to be posted before the exchange opened the next day. Only after receiving funds to cover end-of-day margins did the exchange clearinghouse credit the accounts of investors whose positions rose in value. The sharp price movements on Oct. 19 on futures contracts resulted in record intra- and end-of-day margin calls for firms that were members of the CME clearinghouse; these margin calls were about ten times the average size.15 Because payments to investors whose positions have gained 14 This discussion closely follows the information in the Brady Report (Study VI, p. 71) and Bernanke (1990). 15 Additionally, as volatility in the futures markets increased, the CME clearinghouse increased maintenance margins 12
- 14. in value are made well after payments have been collected, these margin calls likely reduced the ability of some market participants to enter new positions, and, as noted in the Brady Report (1988, Study VI p. 73) strained institutions needing to extend credit to those meeting margin calls. Coordinating payment flows to make sure margin accounts were fully funded prior to the opening of markets also made for some tense moments. The end-of-day margin calls needed to be met on the morning of Oct. 20 before the start of business. To meet these margin calls, clearinghouse member firms drew on their credit lines with the four banks that provided settlement services for the CME. These banks were reportedly concerned as the margin calls exceeded lending limits and increased their exposure to the securities industry at a point when financial markets were tumbling. Further, the amount of intraday credit typically extended to securities firms was already a worry to some of the settlement banks. Many of the CME clearinghouse member firms were subsidiaries of Wall Street broker-dealers that had close relationships with large New York banks. Thus, the clearinghouse member firms would generally repay the credit extended by the Chicago- based settlement banks with funds borrowed from banks in New York. To help make the extensions of credit and transfers of funds proceed smoothly, the Federal Reserve Banks of Chicago and New York reportedly let commercial banks in both districts know that the Federal Reserve would help provide liquidity for the loans. Due in part to the efforts of the Federal Reserve, on Oct. 20—the day following the crash—the settlement banks extended the necessary credit, and the accounts for CME clearinghouse members were fully funded by market opening. However, some transfers from banks in New York to banks in Chicago on Oct. 20 were delayed as Fedwire transactions between New York and Chicago were disrupted from around 10:00 am to 12:30 pm (Central Standard Time) due to computer problems (Brady Report 1988, Study VI, p. 71; Greenspan 1988, pp. 119-120). Members of the Options Clearing Corporation (OCC), which cleared transactions for the CBOE, also faced substantial intraday margin calls. New York banks delayed confirming payments on OCC drafts. Banks clearing transactions for the OCC permitted clearinghouse members to overdraft their accounts until payments could be confirmed (Bernanke 1990). Morning settlement on Oct. 20 was required for open positions (Wall Street Journal 1987g). This action may have reduced the ability of investors to maintain their open positions. 13
- 15. not completed for the OCC until two and a half hours after the usual time (Brady Report 1988, Study VI, p. 75).16 Banks responded to the need to meet margin calls by extending credit, despite any concerns that they may have had about the size of their exposure to the securities industry. Without these extensions of credit, some institutions would not have been able to satisfy their margin requirement and trading would likely have been severely disrupted. Federal Reserve data related to the credit extended to brokers and dealers by banks jumped notably between the weeks of Oct. 14 and 21 (see Figure 3). Financing needs were greatest in New York and Chicago with, as noted above, Figure 3: Jan. Feb. Mar. Apr. May June July Aug. Sept. Oct. Nov. Dec. 1987 35 40 45 50 55 $ billionsSecurities loans at commercial banks* Weekly *Reverse RPs with brokers and dealers and loans to purchase and carry securities. Seasonally adjusted. Source. Federal Reserve H.8 statistical release. Oct. 21 many of the brokers and dealers in Chicago relying on banks in New York. When the expansion of loans is broken down by the location of the lender, there was a very sharp expansion of lending to brokers and dealers by banks located in New York City and a rise in lending by banks in Chicago (see Figure 4). The SEC reported that banks were more attentive to the collateral posted by the 16 Some customers of First Options of Chicago, Inc. (First Options), a significant trading and clearing institution for the CBOE, had suffered notable losses in the market turmoil and were unable to meet margin calls (Brady Report 1988, Study VI, p. 75). First Options was required to meet margin calls of its own and was faced with large financing requirements on Oct. 21. The Federal Reserve acted to enable Continental Illinois, the parent company of First Options, to inject funds into the subsidiary. Without these funds, First Options would likely not have been able to open which reportedly would have caused serious problems for the operations of the options exchange (Murray 1987a). 14
- 16. Figure 4: 10/14 10/21 10/28 11/4 11/11 11/18 1987 0 2 4 6 8 10 12 14 16 18 20 22 24 $ billions All U.S. banks New York City banks Chicago banks Loans by U.S. banks to brokers and dealers to purchase and carry securities Weekly Source. SEC (1988), p. 5−26. brokers and dealers, but in general extended credit following existing lending procedures (SEC Report 1988, pp. 5-24–5-29). Failure of retail investors to meet margin calls spurred liquidations in options markets. Brokers placed emergency margin calls to their retail investors with exposed options positions. In the absence of additional margin, these positions were supposed to be liquidated. The Brady Report indicates that this happened frequently (Study III, p. 21) and these liquidations likely added to the selling pressure in financial markets. 3.2 Program Trading There has been some debate about the extent to which program trading, especially portfolio insurance, contributed to the crash. Portfolio insurance was designed to protect individual investors from losses, but when used by many investors simultaneously, it may have helped make the fall in prices a systemic event with a feedback loop. While portfolio insurers were heavily involved in trad- ing, there were many other institutions selling stocks and futures that were not portfolio insurers, so this trading strategy cannot be entirely to blame. Consistent with the reported preference of 15
- 17. portfolio insurers to use futures markets, the largest impact of sales by these institutions seems to have been in the futures market; the Brady Report indicates that on Oct. 19, roughly 40 percent of the non-market-maker sales in the futures market was conducted by portfolio insurers (1988, p. 36). The downward pressure exerted on futures markets from sales by portfolio insurers may have contributed to the discount that formed in the futures market relative to the cash market (see Chicago Mercantile Exchange, Committee of Inquiry (1987, pp. 29-32, p. 56)), which could have been transmitted to the cash markets by other investors. Different regulators came to different conclusions about the impact of selling by portfolio insurers. The SEC report cites several ways that portfolio insurance may have had deleterious effects on the market (SEC 1988, pp. 3-14—3-16). In particular, the SEC pointed both to the inability of non-portfolio insuring investors to accurately gauge the amount of selling suggested by the portfolio insurance models, which could reduce their buying interest and to an increase in the concentration and velocity of selling, which may both distort prices and have a negative impact on the capital position of the stock specialists (if portfolio insurance sales were on the NYSE). The CME report indicated that “Portfolio insurance did contribute significantly to selling in the futures markets. However, this strategy was only one of many sources of selling, and does not by itself explain the magnitude of the crash” (Chicago Mercantile Exchange, Committee of Inquiry 1987, p. 56). The acting Chairman of the Commodity Futures Trading Commission was even more skeptical and indicated that Another significant fact involves the ’cascade’ theory, which suggests that short portfolio hedging [portfolio insurance] and stock market-futures market arbitrage can interact to cause a downward spiral in stock prices...Based on data the CFTC has amassed from firms holding large stock index futures positions around October 19, the trading patterns which actually occurred at that time do not correspond with those that would have to happen to support this theory. (Hineman 1988, p. 191) 16
- 18. 3.3 Difficulty obtaining information Uncertainty and herd behavior also contributed to the crash. With rapidly changing prices, information about current market conditions was difficult to obtain. Price quotes for stock and stock indexes were not necessarily reliable since some stocks were temporarily not open for trading (SEC Report 1988, pp. 2-13—2-14). Rumors about market closings added to the confusion (Siconolfi and Kilman 1987). Given the uncertainty, investors apparently sought to sell and close out their positions. With the dearth of reliable information, herd behavior reportedly became common. Robert Shiller surveyed market participants promptly after the crash and many conveyed to him that, on the day of the crash, they were reacting more to the price movements than to any particular news (Shiller 1989, Chapter 23). 4 Response of the Federal Reserve In an effort to restrain the declines in financial markets and to prevent any spillovers to the real economy, the Federal Reserve acted to provide liquidity to the financial system and did so in a public manner that was aimed at supporting market confidence. One of the most prominent actions of the Federal Reserve was to issue a statement on Tuesday morning (as noted above) indicating that it would support market liquidity. This statement was referred to by one market participant as “the most calming thing that was said [Tuesday]” (Murray 1987b), and likely contributed to the rebound that morning. The Federal Reserve followed-up the statement by carrying out open market operations that pushed the federal funds rate down to around 7 percent on Tuesday from over 7.5 percent on Monday (see Figure 5). This was done to “provide significant liquidity to relieve the turbulence and tension in the wake of the financial market upheaval” (FOMC transcripts, meeting of Nov. 3, 1987, comments by Peter Sternlight, p. 2). Other short-term interest rates followed the federal funds rate lower thus reducing costs for borrowers. For the next several weeks, the Federal Reserve continued to inject reserves to buoy liquidity in financial markets. Open market operations expanded the 17
- 19. Figure 5: July Aug. Sept. Oct. Nov. Dec. 1987 5.5 6.0 6.5 7.0 7.5 8.0 8.5 Percent Effective federal funds rate Overnight repo rate Overnight interest rates Daily Source. Federal Reserve H.15 statistical release and market data. Oct. 20 Federal Reserve system’s securities holdings notably (see Figure 6);17 however, it did not appear to expand exceptionally rapidly. Following the crisis, open market operations were conducted in a high profile manner in or- der to underscore to market participants that the Federal Reserve was providing liquidity support (FOMC transcripts, meeting of Nov. 3, 1987, comments by Peter Sternlight, p. 3). Open market operations were frequently conducted an hour or more before the normally scheduled market inter- vention period (Winkler 1987). When entering the market early, the Trading Desk at the Federal Reserve Bank of New York would notify dealers on the preceding afternoon (FOMC transcripts, meeting of Nov. 3, 1987, comments by Peter Sternlight, p. 3). The Federal Reserve also worked with banks and securities firms to encourage the availability of credit to support the liquidity and funding needs of brokers and dealers. As noted earlier, the extension of credit by banks to the securities firms was key to the ability of these firms to meet their clearing and settlement obligations and to continue to operate in these markets. In testimony given 17 Discount window lending was reportedly not especially prevalent after the stock market crash, other than a sharp spike on October 21 as nonborrowed reserves fell short of the intended level (Federal Reserve Bank of New York 1988, p. 57). 18
- 20. Figure 6: 0 1 2 3 4 5 6 7 8 9 Jan. Mar. May July Sept. Nov. 1987 180 190 200 210 220 230 240 250 260 $ billions $ billions Loans to depository institutions* (left scale) Securities holdings** (right scale) Components of the Federal Reserve System balance sheet Weekly *Includes adjustment, extended, and seasonal credit. **Held outright and held under repurchase agreements. Source. Federal Reserve H.4.1 statistical release. Oct. 20 in 1994 to the Senate Banking Committee, Chairman Greenspan indicated that “[t]elephone calls placed by officials of the Federal Reserve Bank of New York to senior management of the major New York City banks helped to assure a continuing supply of credit to the clearinghouse members, which enabled those members to make the necessary margin payments” (Greenspan 1994, p. 137). Contemporary newspaper articles reported similar information: John S. Reed, the chairman of Citicorp, has been quoted as saying that his bank’s lending to securities firms soared to $1.4 billion on Oct. 20, from a more normal level of $200 million to $400 million, after he received a telephone call from E. Gerald Corrigan, president of the New York Federal Reserve Bank. (Sterngold 1987) Alerted by calls about the developing credit crisis from Mr. Phelan [Chairman of the NYSE] and others, the Fed leaned heavily on the big New York banks to meet Wall Street’s soaring demand for credit. Mr. Corrigan and key aides personally telephoned top bankers to get the message across...The banks were told to keep an eye on the big 19
- 21. picture—the global financial system on which all their business ultimately depends. A senior New York banker says the Fed’s message was, ’We’re here. Whatever you need, we’ll give you.’ (Stewart and Hertzberg 1987) Government, and in particular U.S. Treasury, securities are often used as collateral in re- purchase agreements and other financial contracts (and can also be pledged to satisfy margin calls). Trading and lending these securities is an important source of market liquidity. After the stock market crash, there was reportedly some reluctance by holders of government securities to lend them as freely as they typically did, possibly owing to concerns about counterparty risk, which led to scarcity of some securities and a rise in fails to deliver (Greenspan 1988, p. 92). Problems trading government securities could potentially spill over into other markets. To respond to this trend and enhance liquidity in the government securities market, the Federal Reserve temporarily liberalized the rules governing lending of securities from its portfolio by suspending the per issue and per dealer limits on the amount of loans as well as the requirement that the loans not be made to facilitate a short sale (FOMC transcripts, meeting of Nov. 3, 1987, presentation by Peter Sternlight, p. 7). There were also a variety of supervisory efforts to ensure the soundness of the financial system. The Federal Reserve placed examiners in major banking institutions and monitored de- velopments (Greenspan 1988, pp. 90-92). This action was taken in part to identify potential runs as well as to assess the banking industry’s credit exposure to securities firms through loans, loan commitments, and letters of credit. Monitoring efforts by the Federal Reserve went beyond the banking industry and included stepped up daily monitoring of the government securities markets and of the health of primary dealer and inter-dealer brokers. These latter efforts also involved keep- ing in close touch with officials from a variety of agencies and institutions such as the Securities and Exchange Commission, National Association of Securities Dealers, New York Stock Exchange, and the Treasury Department. Finally, in an effort to facilitate settlement and clearing of transactions and loans by settle- 20
- 22. ment banks to brokers and dealers, the Federal Reserve extended Fedwire hours on several occasions (Greenspan 1988, p. 92). The response of the Federal Reserve, and other regulators, appears to have contributed to improved market conditions. Reflecting the additions of reserves through open market operations and the reduction in the federal funds rate, other short-term interest rates declined. The liquidity support likely contributed substantially toward a return to normal market functioning.18 Within a few days, some measures of market uncertainty, such as the implied volatility on the S&P 100, declined, although they remained elevated compared to pre-crash levels (see Figure 7). Figure 7: July Aug. Sept. Oct. Nov. Dec. 1987 25 50 75 100 125 150 175 PercentImplied volatility on the S&P 100 Daily Source. Market data. Oct. 20 5 Conclusion The 1987 stock market crash was a shock to the stability of the financial system, not just because of the size of the drop in price, but importantly because market functioning was significantly impaired. The volume of sell orders at times overwhelmed NYSE specialists and they 18 However, it should be noted that even though the Federal Reserve was providing liquidity support on Tuesday, Oct. 20, and certainly enabled markets to function better than they would have otherwise, that day was the one in which market functioning was most impaired. 21
- 23. were forced to suspend trading in some stocks. Stock trading suspension played a role in temporarily halting trading in some option and futures contracts on other exchanges. Difficulties ensuring the necessary credit extensions and payment flows to settle margin accounts caused concern about the clearinghouse operations. The issues raised by the crash helped spur upgrades of facilities and systems by the exchanges and clearinghouses. The Federal Reserve responses to the stock market crash illustrates three varieties of tools that can be used when responding to a crisis. The first variety of tools include the high-profile public actions taken to support market sentiment. The most obvious of these is the public statement the morning of Tuesday, Oct. 20 that indicated that the Federal Reserve was taking positive steps to meet market needs for liquidity. The second set of tools employed were those that boosted the liquidity of the financial system. These tools included the use of open market operations and lowering of the federal funds rate to support the liquidity of the banking system as well as liberalizing the rules regarding lending of securities from the system account. Finally, the Federal Reserve encouraged various market participants, in particular banks lending to brokers and dealers, to work cooperatively and flexibly with their customers. These efforts appear to have been vital in allowing markets to open Tuesday morning and made an important contribution to the improvement in market functioning in subsequent weeks. 22
- 24. References Anders, G., and B. Garcia (1987): “Raging Bull, Stock Market’s Surge is Puzzling Investors; When Will It End?,” Wall Street Journal, Jan. 19, p. 1. Bernanke, B. (1990): “Clearing and Settlement during the Crash,” Review of Financial Studies, 3(1), 133–151. Chicago Mercantile Exchange, Committee of Inquiry (1987): Preliminary Report of the Committee of Inquiry. Merton Miller (Chairman), Chicago: Chicago Mercantile Exchange. Federal Open Market Committee (1987): Transcripts of the Federal Open Market Committee. Washington: Federal Reserve System. Federal Reserve Bank of New York (1988): “Monetary Policy and Open Market Operations during 1987,” Quarterly Review, 13(1), 41–58. Garcia, B. (1987): “An Appraisal:Portfolio Insurance Could Fuel Stocks’ Fall, Critics Say,” Wall Street Journal, Oct. 12, p. 43. Greenspan, A. (1988): “Statement and comments of Alan Greenspan, Chairman of the Federal Reserve,” in ”Black Monday,” The Stock Market Crash of October 19, 1987. U.S. Congress. Senate. Committee on Banking, Housing, and Urban Affairs. Hearing, 100 Congress 1 Session, Washington: Government Printing Office. (1994): “Statement and comments of Alan Greenspan, Chairman of the Federal Reserve,” in Banking Industry Regulatory Consolidation. U.S. Congress. Senate. Committee on Banking, Housing, and Urban Affairs. Hearing, 103 Congress 2 Session, Washington: Government Printing Office. Hineman, K. (1988): “Statement and comments of Kalo Hineman, Acting Chairman of the Com- modity Futures Trading Commission,” in ”Black Monday,” The Stock Market Crash of October 19, 1987. U.S. Congress. Senate. Committee on Banking, Housing, and Urban Affairs. Hearing, 100 Congress 1 Session, Washington: Government Printing Office. Katzenbach, N. (1987): An Overview of Program Trading and Its Impact on Current Market Practices. New York: The New York Stock Exchange. Melamed, L., and B. Tamakin (1996): Escape to the Futures. New York: John Wiles and Sons, Inc. Murray, A. (1987a): “Fed’s New Chairman Wins a Lot of Praise on Handling the Crash,” Wall Street Journal, Nov. 25, p. 1. (1987b): “Stock Market’s Frenzy Puts Fed’s Greenspan in a Crucial Position,” Wall Street Journal, Oct. 21, p. 1. Presidential Task Force on Market Mechanisms (1988): Report of the Presidential Task Force on Market Mechanisms. Nicholas Brady (Chairman), U.S. Government Printing Office. Ruder, D. (1987): “Statement and comments of David Ruder, Chairman of the Securities and Exchange Commission,” in Volatility and Panic in the Nation’s Financial Markets. U.S. Congress. Senate. Committee on Banking, Housing, and Urban Affairs. Hearing, 100 Congress 1 Session, Washington: Government Printing Office. Saunders, A., and M. Cornett (2007): Financial Markets and Institutions. New York: McGraw-Hill Irwin. 23
- 25. Securities and Exchange Commission (1988): The October 1987 Market Break. Washington: The Securites and Exchange Commission. Shiller, R. (1989): “Investor Behavior in the October 1987 Stock Market Crash: Survey Evi- dence,” in Market Volatility. Boston: Massachusetts Institute of Technology. Siconolfi, M., and S. Kilman (1987): “Futures-Price Index Is Driven Down by Volatile Market, Rebounding Dollar,” Wall Street Journal, Oct. 21, p. 54. Sterngold, J. (1987): “Stock Plunge Leads to Look at the Safety Net,” New York Times, Dec. 14, p. A1. Stewart, J., and D. Hertzberg (1987): “How the Stock Market Almost Disintegrated a Day After the Crash,” Wall Street Journal, Nov. 20, p. 1. Wall Street Journal (1987a): “Raging Bull, Stock Market’s Surge is Puzzling Investors; When Will It End?,” Jan. 19, p. 1. (1987b): “Trade-Gap News Sends Stock Market Reeling Into a Record Tailspin,” Oct. 15, p. 1. (1987c): “Industrials Fall 57.61 Points Monstly on Late Sell-Off, As Rally Attempts Fail,” Oct. 16, p. 3. (1987d): “The Day the Dow Fell: Brokers Trade Stocks, Fists; Bulls and Bears Are Joined by Ducks and Chickens,” Oct. 19, p. 15. (1987e): “Stocks Plunge 508 Amid Panicky Selling,” Oct. 20, p. 1. (1987f): “Managing a Crisis,” Oct. 21, p. 36. (1987g): “Chicago Merc Margins Rise for S&P Futures Pacts,” Oct. 19, p. 47. Winkler, M. (1987): “Interest Rates Fall Again as Banks Cut Prime Rate, Fed Seems to Keep Easing,” Wall Street Journal, Oct. 23, p. 39. Winkler, M., and T. Herman (1987): “Pressure for Higher Rates is Building As Central Banks Fight Inflation Fear,” Wall Street Journal, Oct. 12, p. 3. 24