


![Thank You! Contact: Keith Knowles Vice President, Solar Consultant 503-317-6536 [email_address]](https://image.slidesharecdn.com/SolarOverview101408-122837191129-phpapp03/85/Solar-Overview-101408-26-320.jpg)

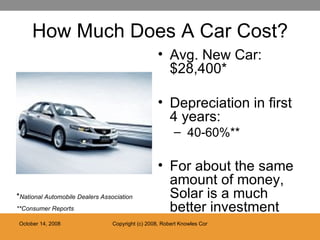
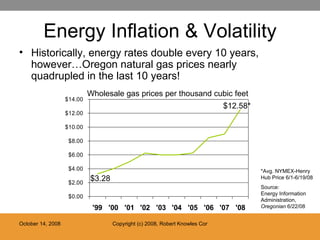
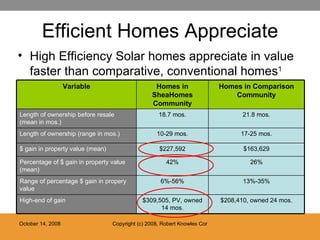
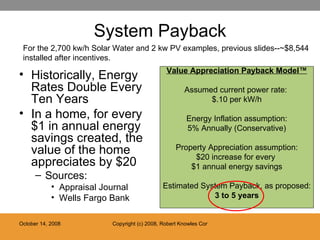
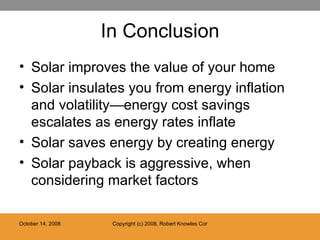
The document discusses the benefits of solar energy systems compared to traditional energy sources. It states that the upfront cost of solar is comparable to the cost of a new car but solar provides a better long term investment due to energy cost savings. Solar energy rates provide stable costs while traditional energy rates have historically doubled every 10 years. The document also notes that solar homes appreciate in value faster than comparable non-solar homes and that solar systems typically pay for themselves within 5 years or less when accounting for energy savings and tax incentives.


