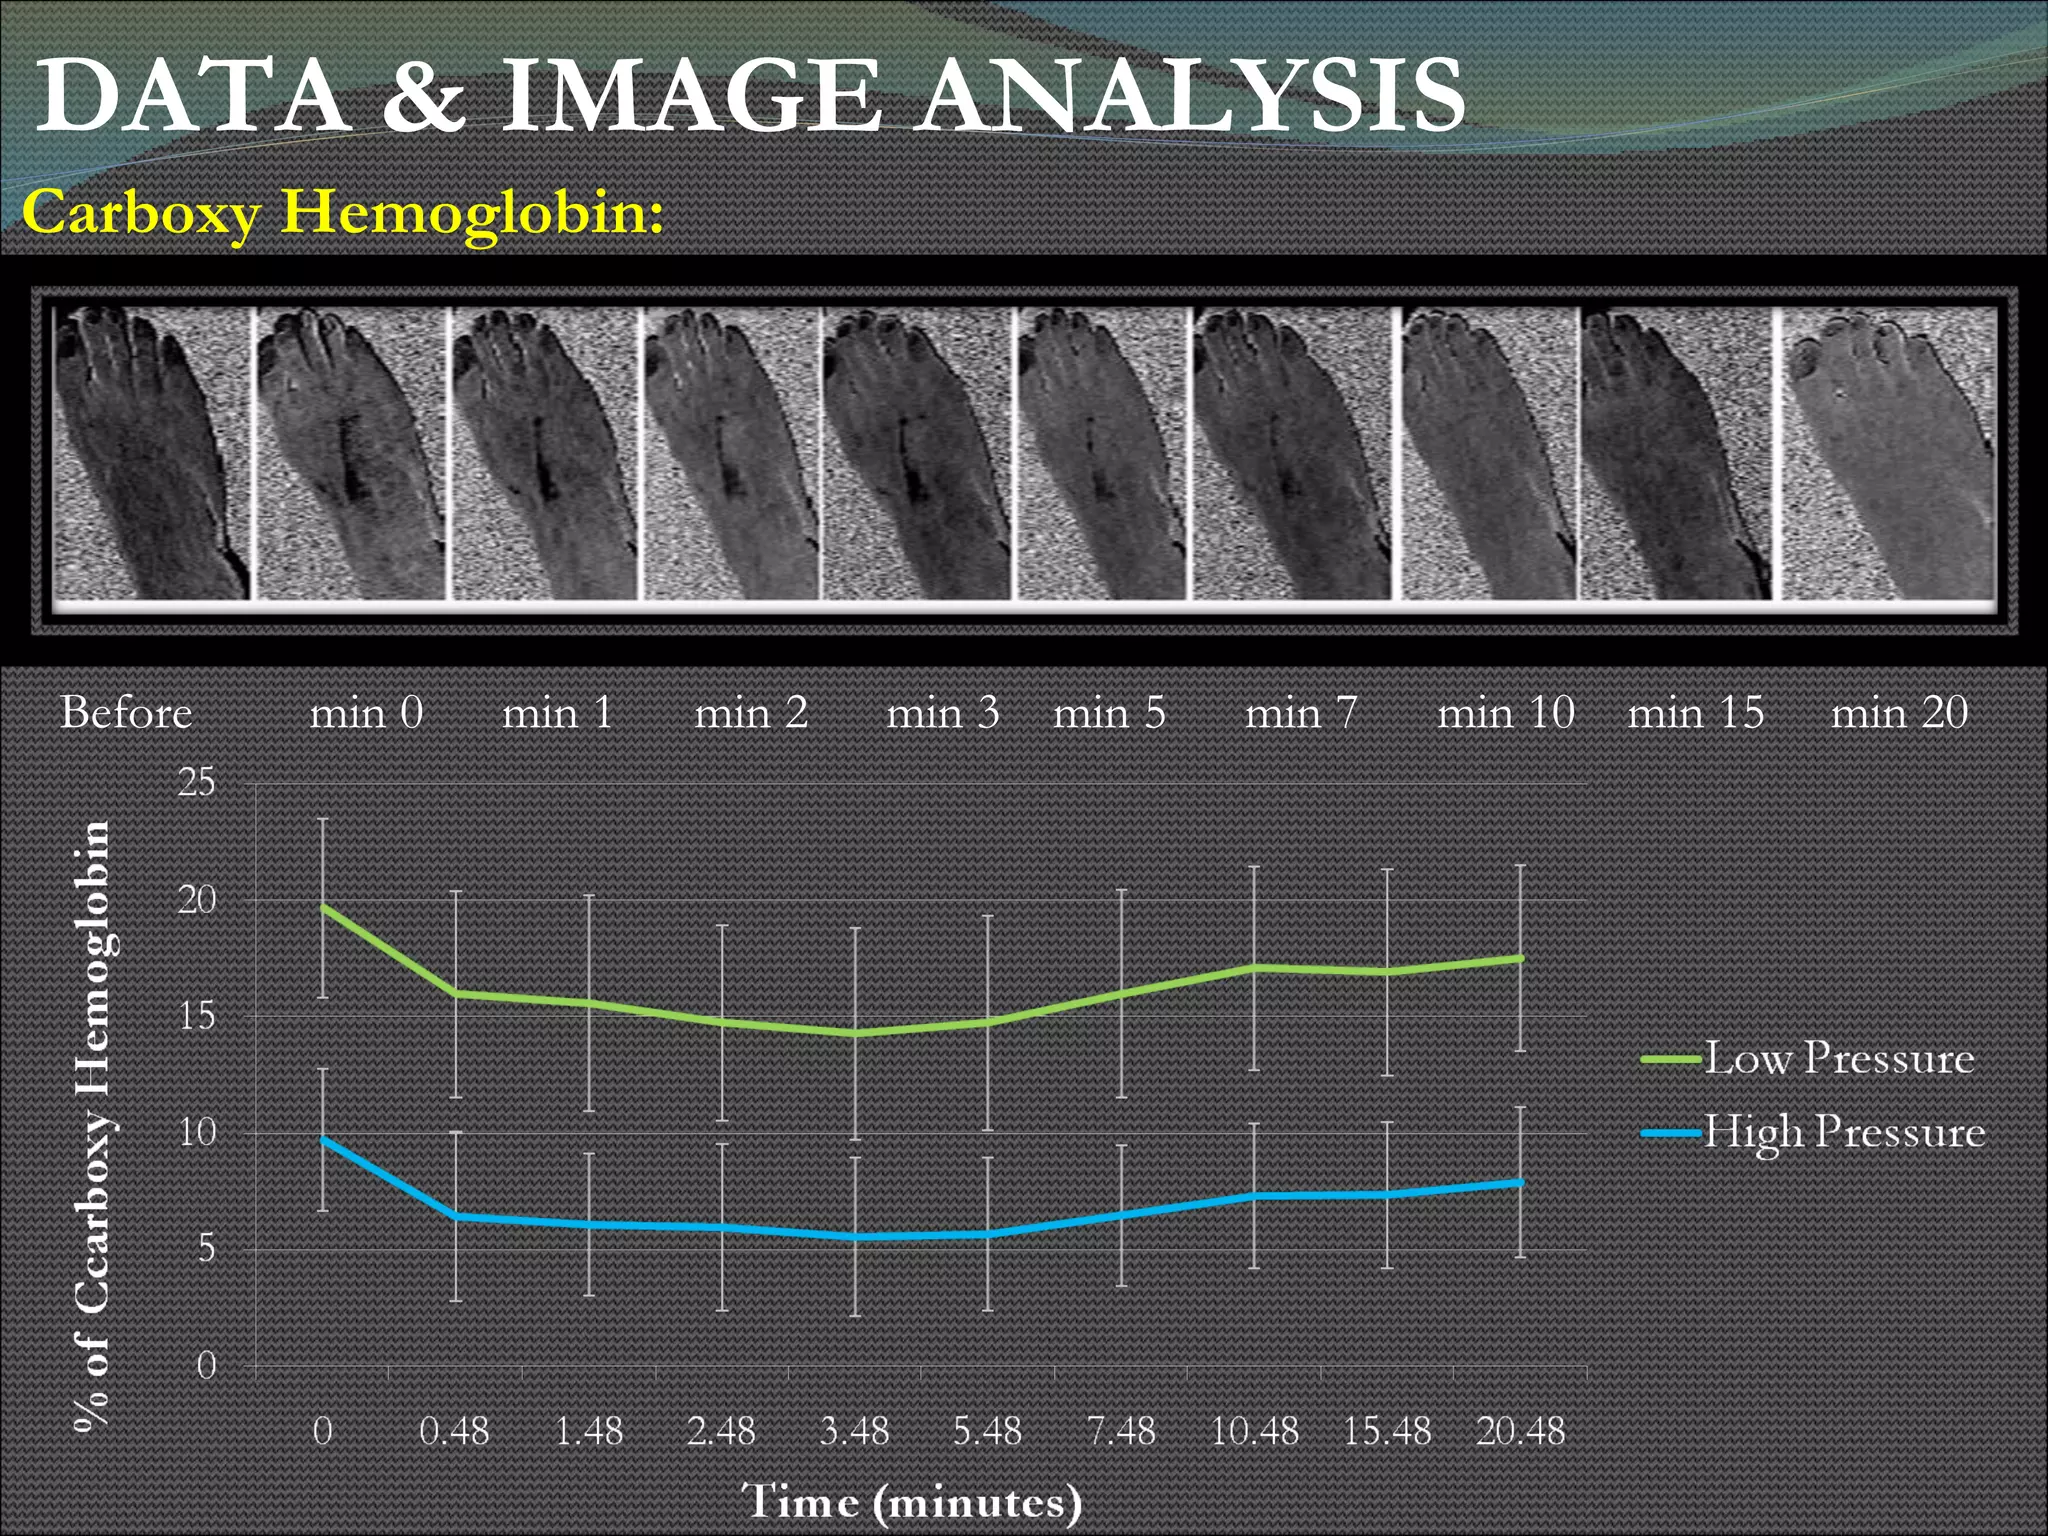
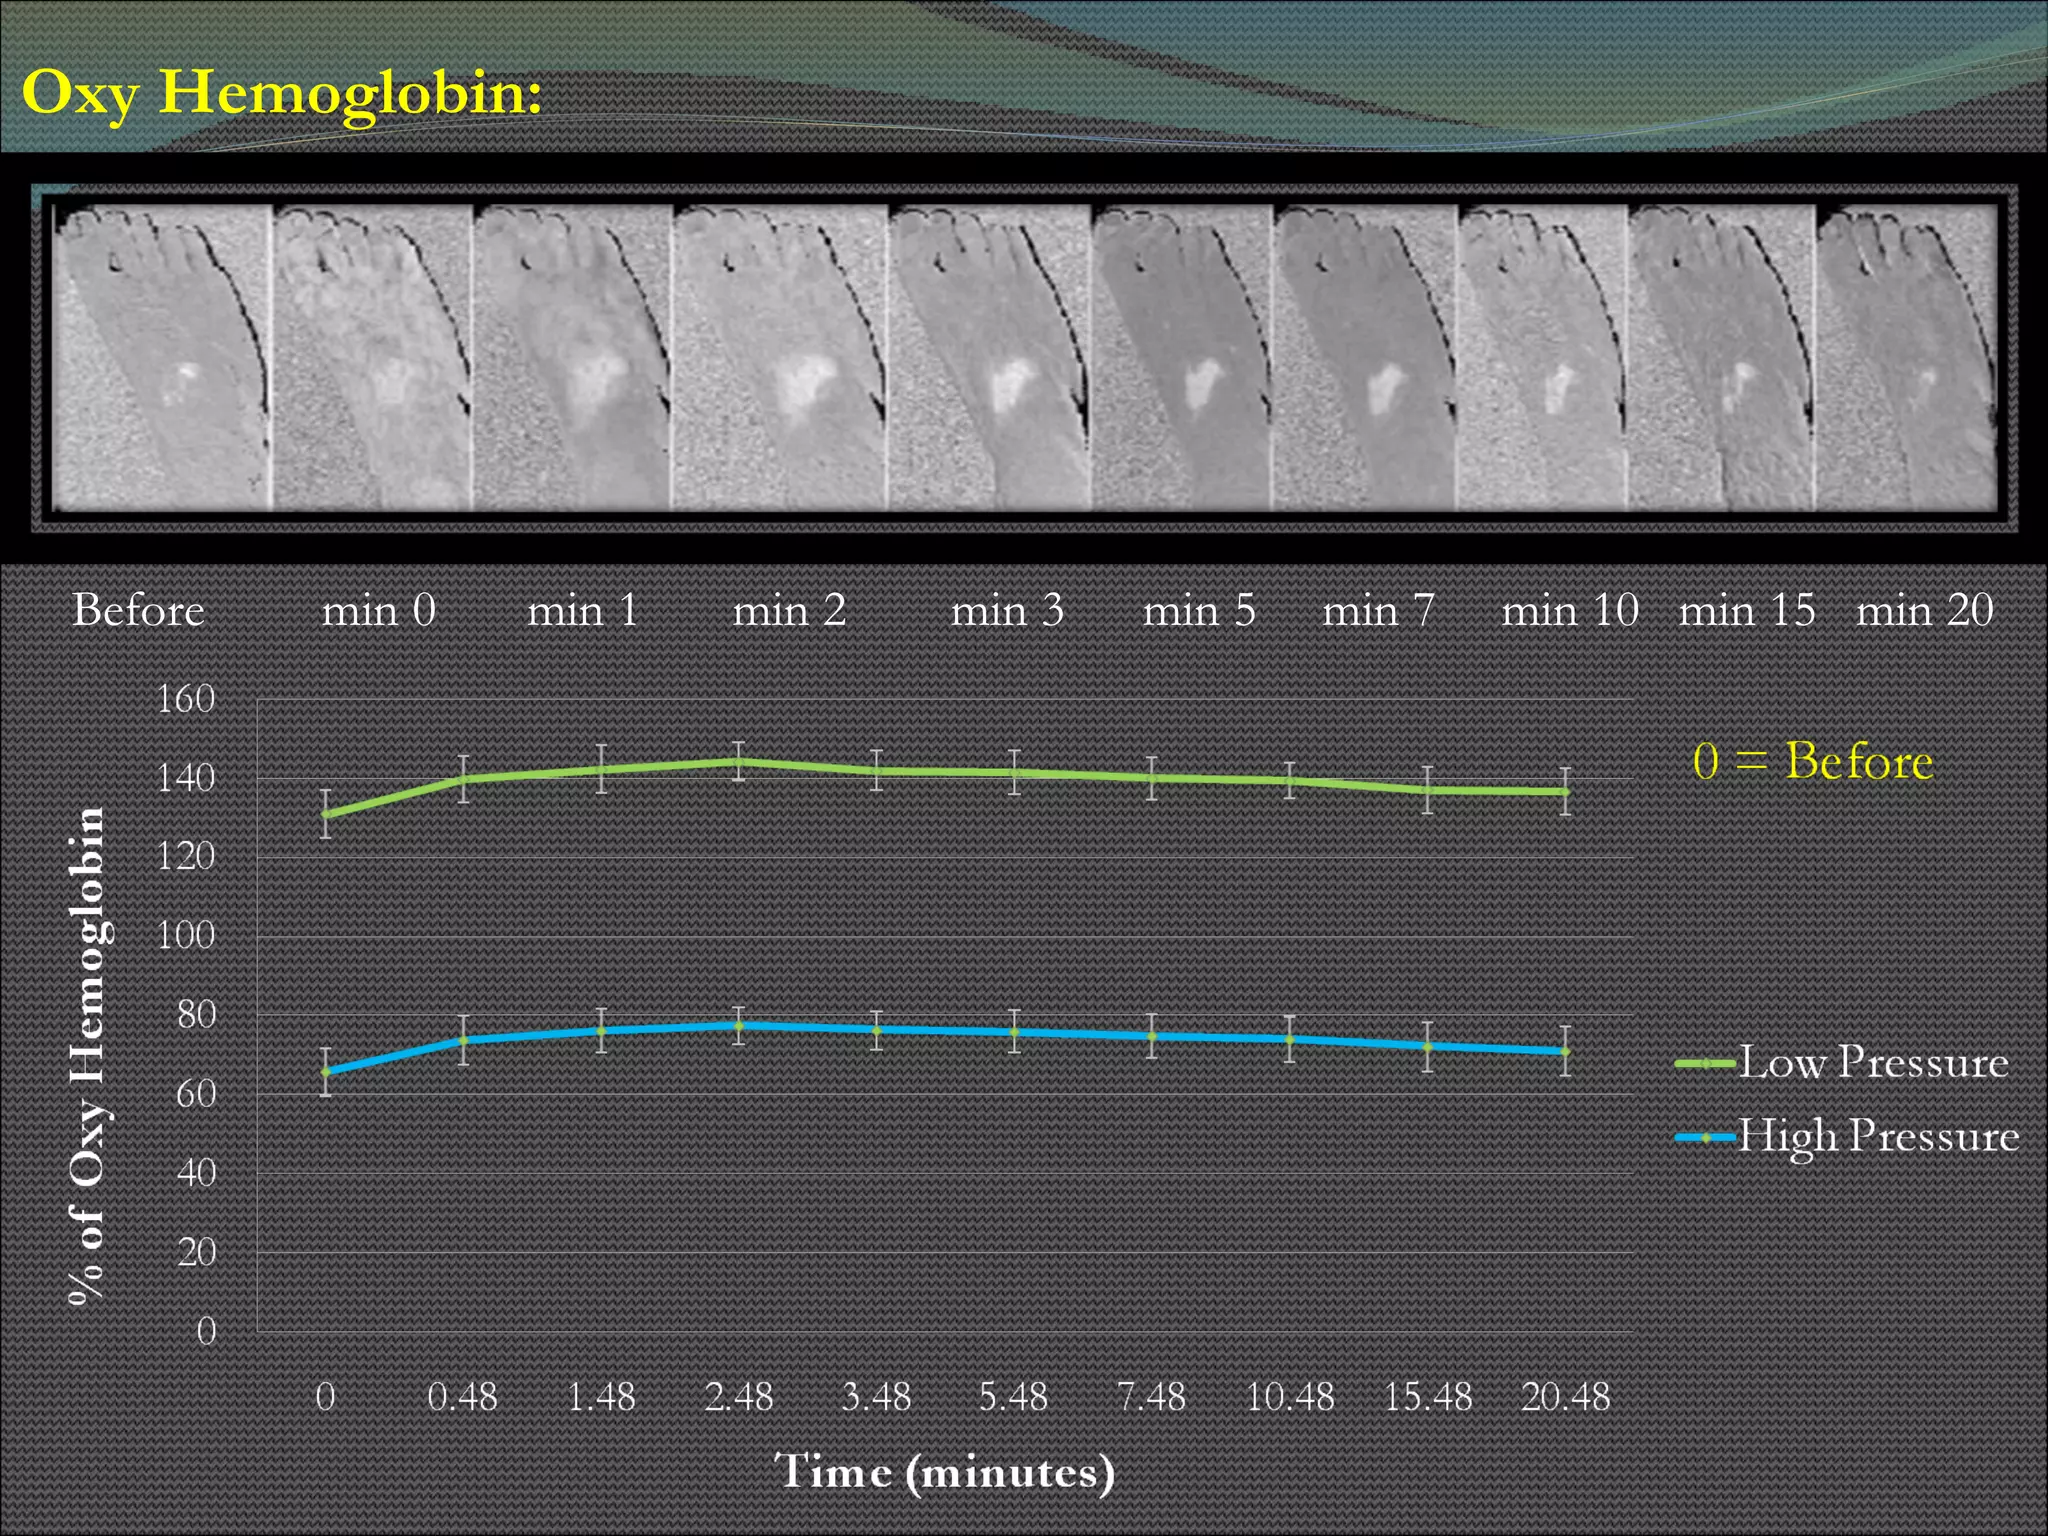
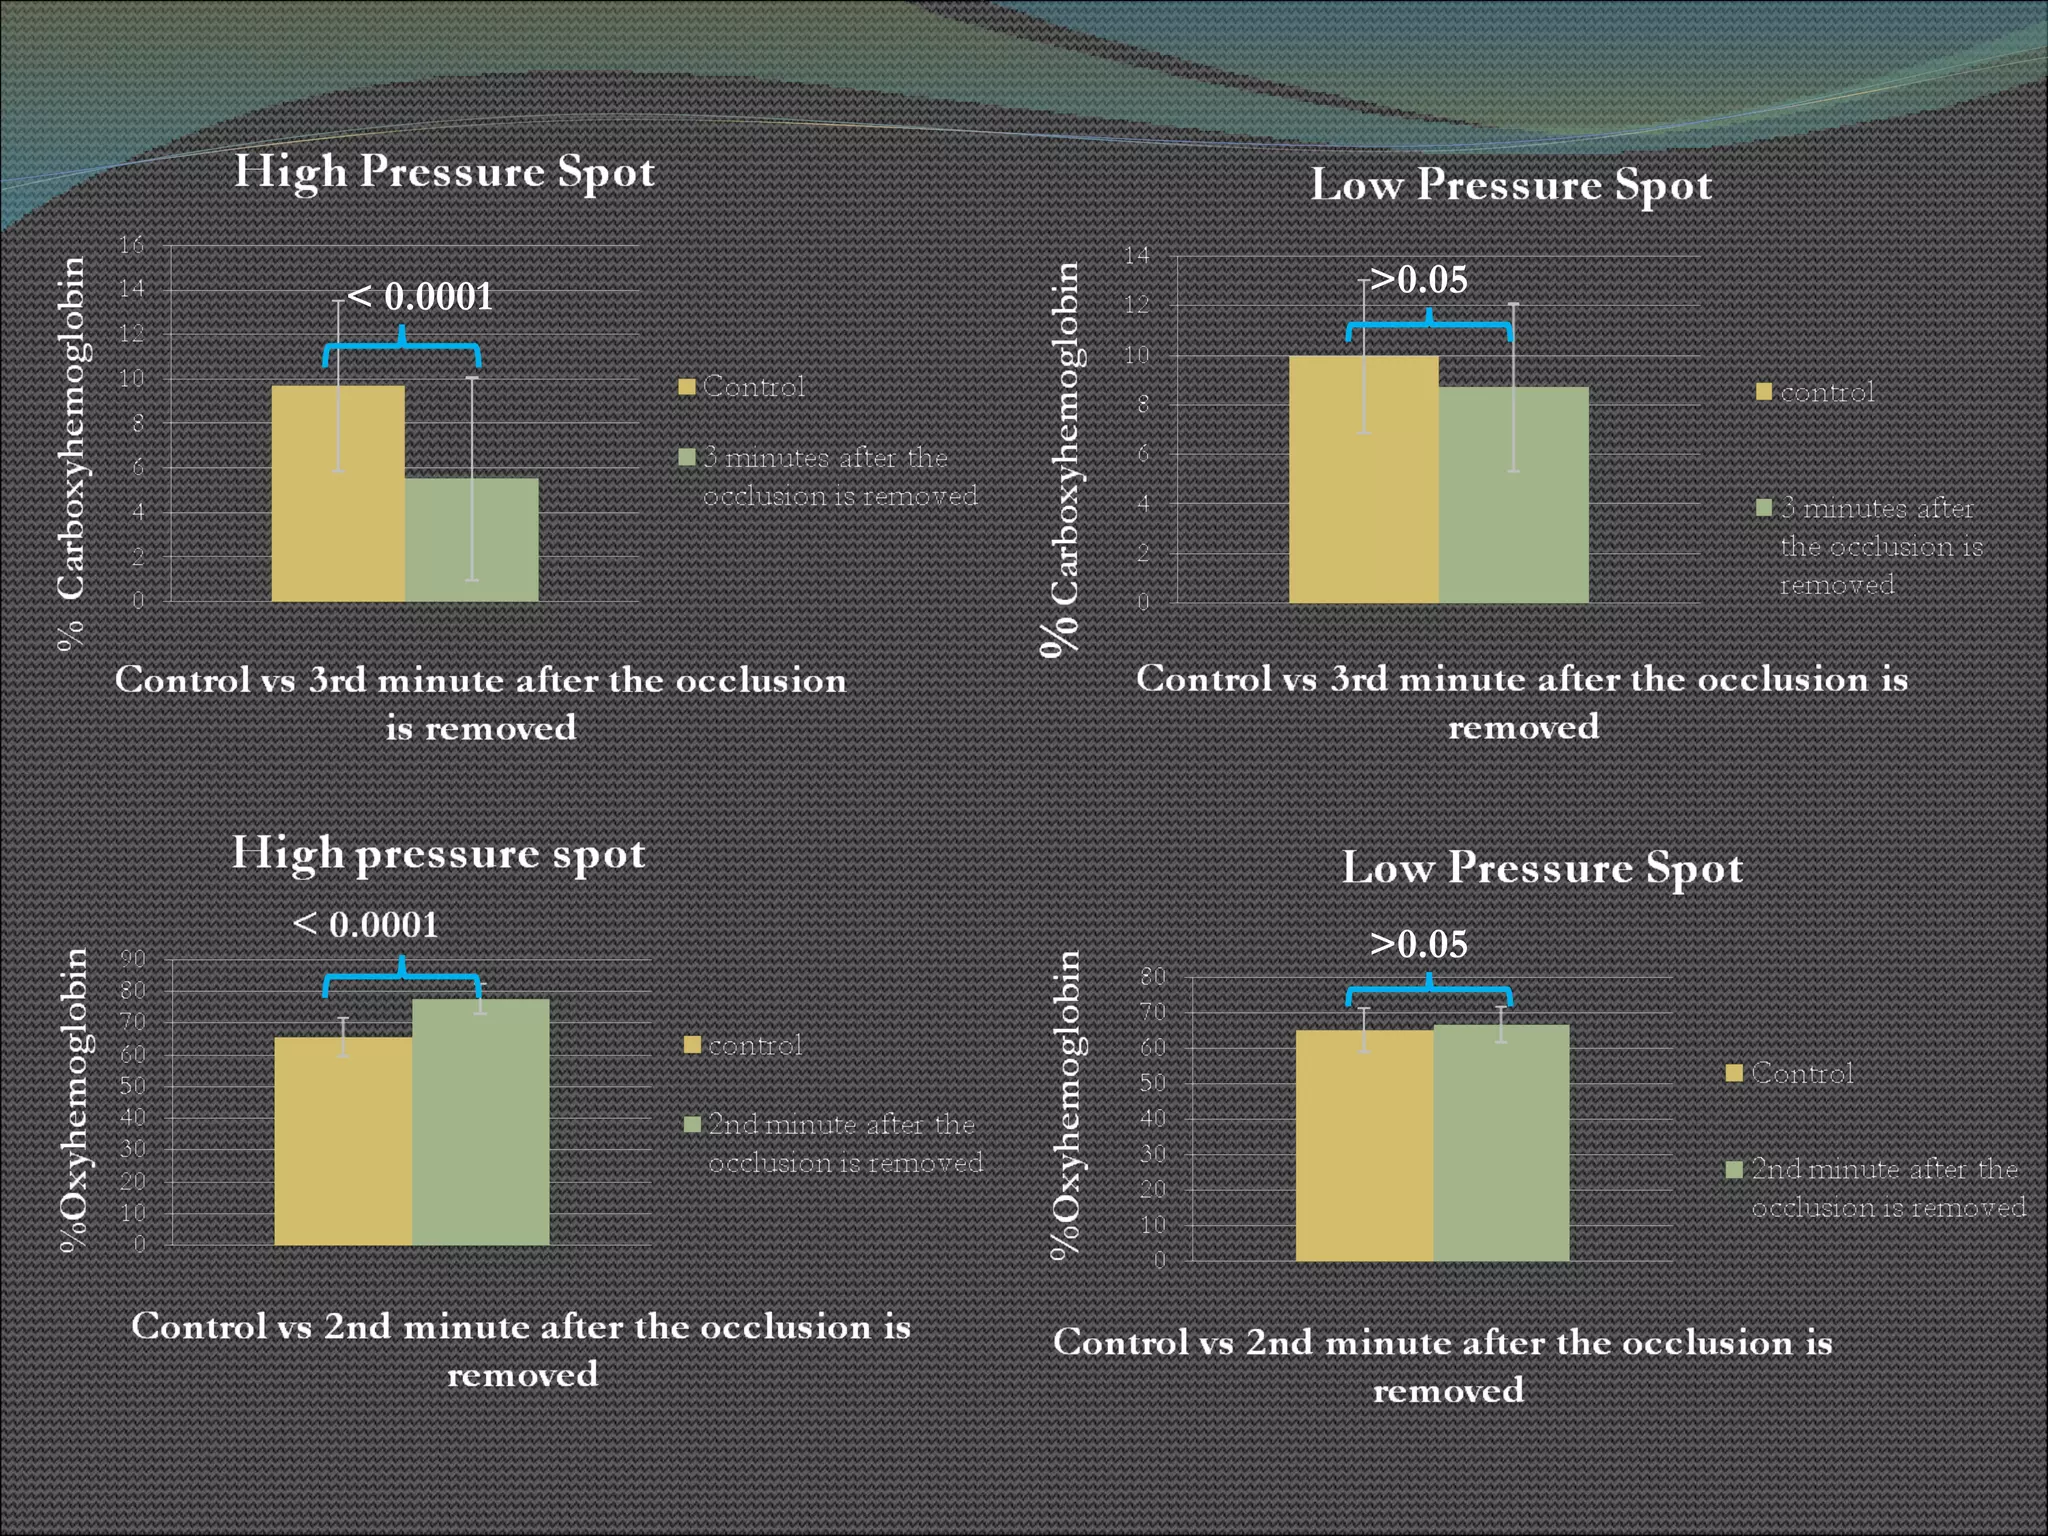
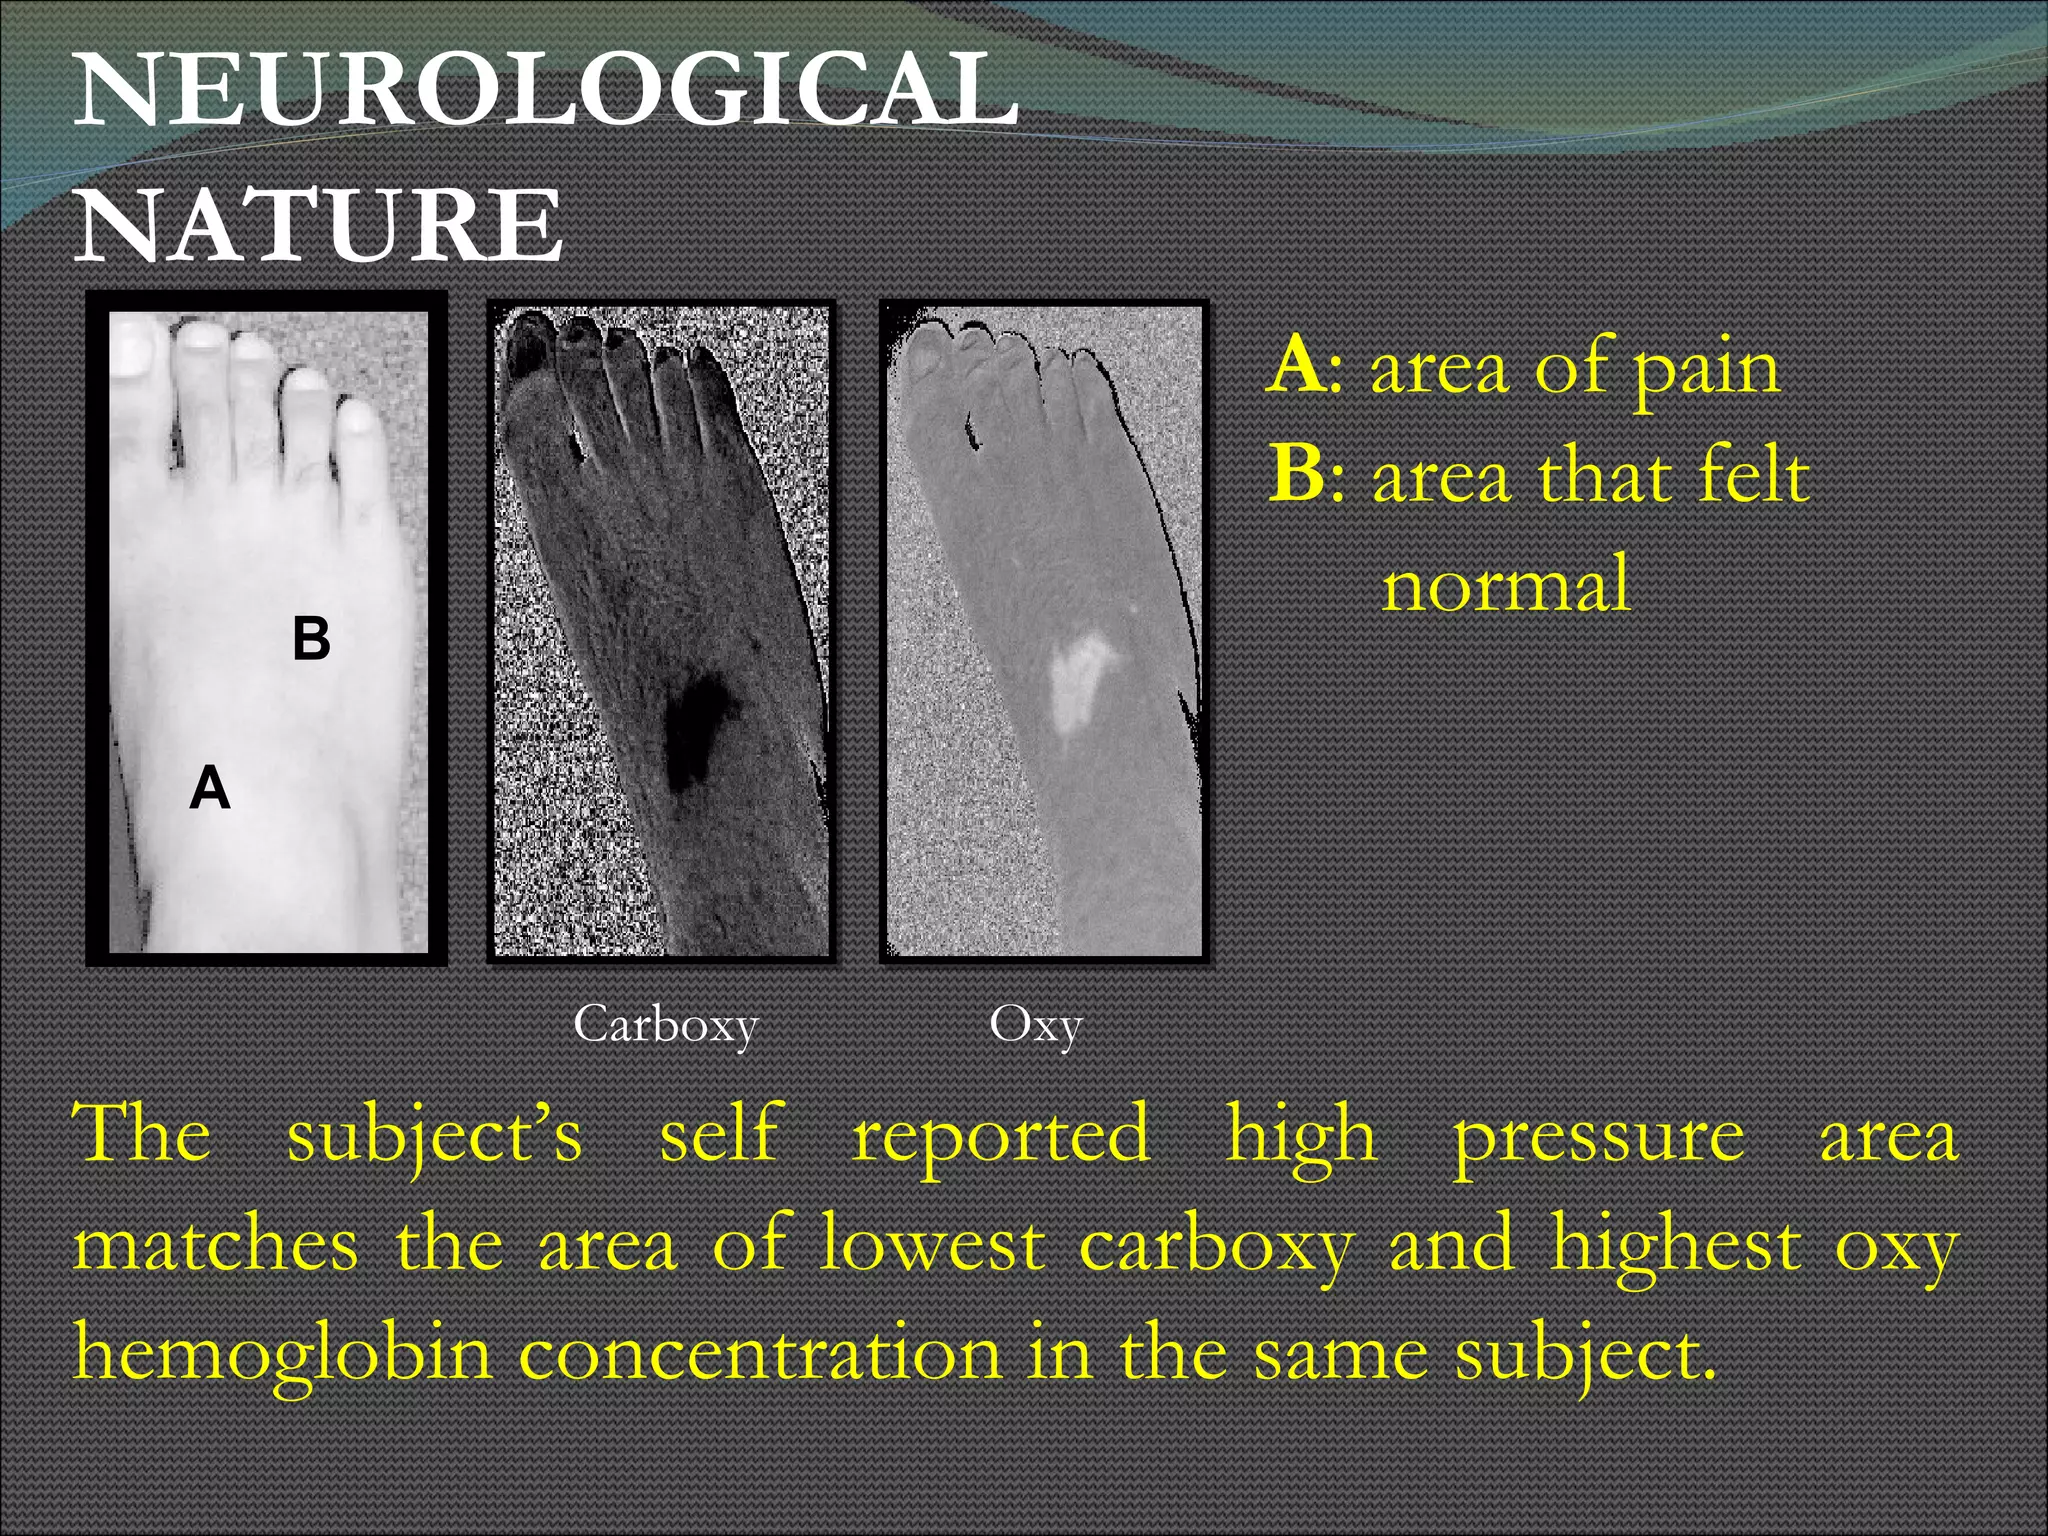
VISIBLE HYPERSPECTRAL IMAGING :  VISUALIZING THE NEUROLOGICAL AND BIOCHEMICAL NATURE OF ISCHEMIC TISSUE Presented By: Ramya  Ananthanarayanan November, 2008
INTRODUCTION Diabetic Neuropathy Diabetic Patients – foot  ulcerations Risk factors for developing foot ulcers Diabetic mediated ulceration: Neuropathy
ISCHEMIA & REACTIVE HYPEREMIA
HYPOTHESIS Hypothesizing that wearing a tight shoe, one that exerts an uncomfortable pressure on one or more locations of the foot, induces a temporary ischemia, and removing the shoe results in a significantly elevated transient bolus of blood perfusing the microvasculature of the skin, reactive hyperemia.
OBJECTIVE Develop a non-invasive, i n–vivo h yperspectral imaging system. Determine spatially distributed percentage of biochemical components. Proof of principle: Oxy and Carboxy Hemoglobin levels.
HYPERSPECTRAL IMAGING System primarily used for macroscopic applications in this study. Hyper-spectral Imaging: Many - Spectra Collect Spectral information in each detector pixel. Chemo-metric Methods – Color encode a quantity at each pixel detector
HYPERSPECTRAL IMAGE CUBE Wavelength LCTF - CCD assembly Series of  Image Planes Y X Spatial Localization of Spectra
HYPERSPECTRAL IMAGER UV and IR filters  Near Infrared  CCD Visible  CCD QTH Lamp Housing: 250 watts Lens Lens LCTF Control Boxes Near-Infrared LCTF  Visible  LCTF  Beam Shaping optics Tripod Liquid Light guide
SYSTEM BLOCK DIAGRAM Spectral Range: 520nm to 645nm CCD Camera Rail LCTF Lens Source Subjects foot is placed here 0.19  m 1.06 m Front View of the Experimental Setup
SYSTEM CHARACTERIZATION Spatial characteristics of this imaging system were determined by a  contrast  transfer function (CTF) analysis.  I max : the maximum intensity reflected by a bar of the resolution target (white bar)  I min : the minimum intensity from the nonreflecting area between the bars (dark bar) of the resolution target   The percent contrast,  C , is experimentally determined from the expression,  C =  Imax – Imin  x 100  Imax + Imin
The USAF 1951 Quartz resolution target A : a portion of the target  B : the corresponding reflected intensity taken along a row of pixels
Spatial Resolving Power: CoolSNAP ES  and Varispec LCTF Binning: 4x4 Spatial Resolution : 0.39mm
CLINICAL DESIGN Visible Reflectance Hyperspectral imaging: general, noninvasive tool Average percentage of oxy and carboxy hemoglobin from a volume of skin tissue. Penetrates the skin up to 2.5 mm. 20 subjects were studied.
PROTOCOL Subject Consent Lights will be turned off while the subject will have his feet imaged.  Briefly the imager illuminates the skin tissue with visible light.  Increase tissue safety  Minimize Motion Artifacts
Digital camera captures pictures of the skin tissue.  Introduce Occlusion creating Ischemia Foot imaged during Reactive Hyperemia:  8 over a period of 20 minutes  Self Reported pressure spots ranked on a scale of 1-10.
Spectral and Statistical analysis using computer software LCTF tuning, image acquisition, and data storage are managed by a computer program, written in V++ and PVCAM at National Institutes of Health.
EXPERIMENTAL TIMELINE
DATA & IMAGE ANALYSIS Carboxy Hemoglobin: Before  min 0  min 1  min 2  min 3  min 5  min 7  min 10  min 15  min 20
Oxy Hemoglobin:  Before  min 0  min 1  min 2  min 3  min 5  min 7  min 10  min 15  min 20
STATISTICAL ANALYSIS 65 pixel values each for 20 subjects Data analyzed using SAS programming by  Dr. Doyle Hawkins MIXED Procedure Test  Significant for High Pressure vs Control Significant at every minute starting from the 0 th  minute to the 20 th .
< 0.0001 >0.05 >0.05
NEUROLOGICAL NATURE  The subject’s self reported high pressure area matches the area of lowest carboxy and highest oxy hemoglobin concentration in the same subject. A : area of pain B : area that felt  normal Carboxy  Oxy
Established Reactive Hyperemia as a Surrogate Marker of High Pressure  Determined the time course of reactive hyperemia and the time for which the effect lasts. Levels of target constituents during the period of reactive hyperemia as opposed to the period of ischemia: Carboxy hemoglobin decreases Oxy hemoglobin increases RESULTS & DISCUSSION
CONCLUSION The Microscopic Hyperspectral Imager is capable of depicting spatially distributed percentage of oxy and carboxy hemoglobin in the field of view. The system was successfully used to conclude changes in levels of tissue constituents during reactive hyperemia.
APPLICATION Visible-reflectance hyperspectral imaging, can be utilized to visualize areas of lower limb reactive hyperemia . Indicates ischemia and a shoe exerting excessive pressure to avoid formation of foot ulcers in neuropathic patients.
REFERENCES Zuzak KJ, Schaeberle MD, Lewis NE and Levin IW. Visible reflectance hyperspectral imaging: Characterization of a noninvasive, in-vivo system for determining tissue perfusion. Anal. Chem., May 2002; 74(9):2021-2028 Priceton Instrument Manual www.cvphysiology.com/Blood%20Flow/BF006.htm
 

Visible Hyperspectral Imaging: Visualizing the Neurological and Biochemical Nature of Ischemic Tissue

  • 1.
    VISIBLE HYPERSPECTRAL IMAGING: VISUALIZING THE NEUROLOGICAL AND BIOCHEMICAL NATURE OF ISCHEMIC TISSUE Presented By: Ramya Ananthanarayanan November, 2008
  • 2.
    INTRODUCTION Diabetic NeuropathyDiabetic Patients – foot ulcerations Risk factors for developing foot ulcers Diabetic mediated ulceration: Neuropathy
  • 3.
  • 4.
    HYPOTHESIS Hypothesizing thatwearing a tight shoe, one that exerts an uncomfortable pressure on one or more locations of the foot, induces a temporary ischemia, and removing the shoe results in a significantly elevated transient bolus of blood perfusing the microvasculature of the skin, reactive hyperemia.
  • 5.
    OBJECTIVE Develop anon-invasive, i n–vivo h yperspectral imaging system. Determine spatially distributed percentage of biochemical components. Proof of principle: Oxy and Carboxy Hemoglobin levels.
  • 6.
    HYPERSPECTRAL IMAGING Systemprimarily used for macroscopic applications in this study. Hyper-spectral Imaging: Many - Spectra Collect Spectral information in each detector pixel. Chemo-metric Methods – Color encode a quantity at each pixel detector
  • 7.
    HYPERSPECTRAL IMAGE CUBEWavelength LCTF - CCD assembly Series of Image Planes Y X Spatial Localization of Spectra
  • 8.
    HYPERSPECTRAL IMAGER UVand IR filters Near Infrared CCD Visible CCD QTH Lamp Housing: 250 watts Lens Lens LCTF Control Boxes Near-Infrared LCTF Visible LCTF Beam Shaping optics Tripod Liquid Light guide
  • 9.
    SYSTEM BLOCK DIAGRAMSpectral Range: 520nm to 645nm CCD Camera Rail LCTF Lens Source Subjects foot is placed here 0.19 m 1.06 m Front View of the Experimental Setup
  • 10.
    SYSTEM CHARACTERIZATION Spatialcharacteristics of this imaging system were determined by a contrast transfer function (CTF) analysis. I max : the maximum intensity reflected by a bar of the resolution target (white bar) I min : the minimum intensity from the nonreflecting area between the bars (dark bar) of the resolution target The percent contrast, C , is experimentally determined from the expression, C = Imax – Imin x 100 Imax + Imin
  • 11.
    The USAF 1951Quartz resolution target A : a portion of the target B : the corresponding reflected intensity taken along a row of pixels
  • 12.
    Spatial Resolving Power:CoolSNAP ES and Varispec LCTF Binning: 4x4 Spatial Resolution : 0.39mm
  • 13.
    CLINICAL DESIGN VisibleReflectance Hyperspectral imaging: general, noninvasive tool Average percentage of oxy and carboxy hemoglobin from a volume of skin tissue. Penetrates the skin up to 2.5 mm. 20 subjects were studied.
  • 14.
    PROTOCOL Subject ConsentLights will be turned off while the subject will have his feet imaged. Briefly the imager illuminates the skin tissue with visible light. Increase tissue safety Minimize Motion Artifacts
  • 15.
    Digital camera capturespictures of the skin tissue. Introduce Occlusion creating Ischemia Foot imaged during Reactive Hyperemia: 8 over a period of 20 minutes Self Reported pressure spots ranked on a scale of 1-10.
  • 16.
    Spectral and Statisticalanalysis using computer software LCTF tuning, image acquisition, and data storage are managed by a computer program, written in V++ and PVCAM at National Institutes of Health.
  • 17.
  • 18.
    DATA & IMAGEANALYSIS Carboxy Hemoglobin: Before min 0 min 1 min 2 min 3 min 5 min 7 min 10 min 15 min 20
  • 19.
    Oxy Hemoglobin: Before min 0 min 1 min 2 min 3 min 5 min 7 min 10 min 15 min 20
  • 20.
    STATISTICAL ANALYSIS 65pixel values each for 20 subjects Data analyzed using SAS programming by Dr. Doyle Hawkins MIXED Procedure Test Significant for High Pressure vs Control Significant at every minute starting from the 0 th minute to the 20 th .
  • 21.
  • 22.
    NEUROLOGICAL NATURE The subject’s self reported high pressure area matches the area of lowest carboxy and highest oxy hemoglobin concentration in the same subject. A : area of pain B : area that felt normal Carboxy Oxy
  • 23.
    Established Reactive Hyperemiaas a Surrogate Marker of High Pressure Determined the time course of reactive hyperemia and the time for which the effect lasts. Levels of target constituents during the period of reactive hyperemia as opposed to the period of ischemia: Carboxy hemoglobin decreases Oxy hemoglobin increases RESULTS & DISCUSSION
  • 24.
    CONCLUSION The MicroscopicHyperspectral Imager is capable of depicting spatially distributed percentage of oxy and carboxy hemoglobin in the field of view. The system was successfully used to conclude changes in levels of tissue constituents during reactive hyperemia.
  • 25.
    APPLICATION Visible-reflectance hyperspectralimaging, can be utilized to visualize areas of lower limb reactive hyperemia . Indicates ischemia and a shoe exerting excessive pressure to avoid formation of foot ulcers in neuropathic patients.
  • 26.
    REFERENCES Zuzak KJ,Schaeberle MD, Lewis NE and Levin IW. Visible reflectance hyperspectral imaging: Characterization of a noninvasive, in-vivo system for determining tissue perfusion. Anal. Chem., May 2002; 74(9):2021-2028 Priceton Instrument Manual www.cvphysiology.com/Blood%20Flow/BF006.htm
  • 27.