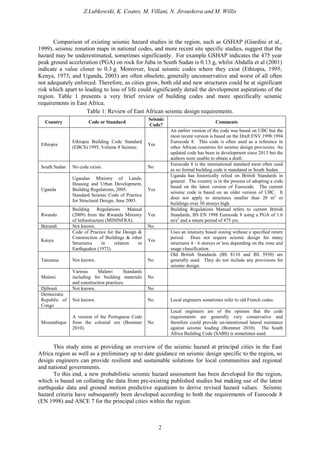
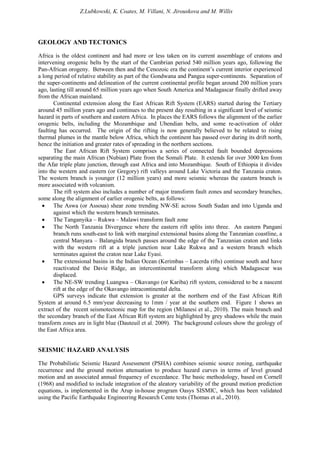
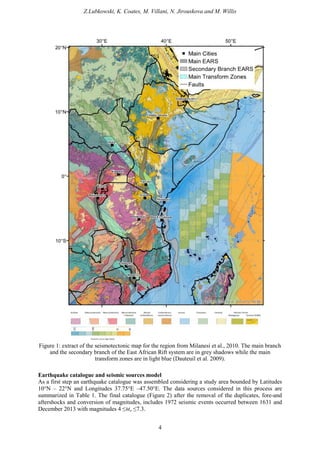
1
SEISMIC DESIGN CONSIDERATIONS FOR EAST AFRICA
Zygmunt LUBKOWSKI1
, Manuela VILLANI2
, Katherine COATES3
, Nina JIROUSKOVA4
,
Matthew WILLIS 5
ABSTRACT
It is our belief that as engineers, geologists, seismologists, architects and designers we have the
responsibility to improve the world’s infrastructure, so that the world becomes a more resilient place
to live. Too often we take the easy option of “doing what the code says” and not thinking about how
we can improve the status quo. This is important everywhere but essential in the developing regions
so the investments made can make a real difference.
This paper is an example of work carried out at Arup to investigate the suitability and
appropriateness of local codes in the East African region. The paper begins with examining the
seismic hazard, by developing a new probabilistic seismic hazard model, then reviews the codes and
makes recommendations for future development.
The East African region was chosen since several major earthquakes have occurred over the last
century but luckily there have been few fatalities. Will this continue to be the case as major cities in
the region grow at a fast pace?
Though these are still preliminary studies, and should be treated as such, we hope this
information will allow more informed discussions with local governments, NGO’s and investors so
that more informed decisions can be made and hopefully the resilience of East African communities
improved.
INTRODUCTION
East Africa is a developing market and constructing new infrastructure is one of the keys to the
successful growth and prosperity for the region. However, the region is split by the active East
African Rift Valley, which has a history of generating large earthquakes, such as:
• 7.4Ms Rukwa Tanzania earthquake on 13th
December 1910 (Ambraseys, 1991a)
• 6.9MS Subukia, Kenya earthquake on 9th
January 1928 (Ambraseys, 1991b);
• 7.4MS South Sudan earthquake on 20th
May 1990; and
• 7.0MW Manica, Mozambique earthquake on 22nd
February 2006 (Fenton and Bommer, 2006).
Though earthquakes such as these have not led to significant loss of life or destruction of key
infrastructure it is only a matter of time until this transpires. Ambraseys (1991a) was one of the first to
highlight the increasing risk in East Africa from major earthquakes.
1
Associate Director, Ove Arup & Partners, London, ziggy.lubkowski@arup.com
2
Senior Engineer, Ove Arup & Partners, London, manuela.villani@arup.com
3
Associate Ove Arup & Partners, London, katherine.coates@arup.com
4
Engineer, Ove Arup & Partners, London, nina.jirouskova @arup.com
5
Senior Geologist, Ove Arup & Partners, London, matthew.willis@arup.com
Z.Lubkowski, K. Coates, M. Villani, N. Jirouskova and M. Willis
2
Comparison of existing seismic hazard studies in the region, such as GSHAP (Giardini et al.,
1999), seismic zonation maps in national codes, and more recent site specific studies, suggest that the
hazard may be underestimated, sometimes significantly. For example GSHAP indicates the 475 year
peak ground acceleration (PGA) on rock for Juba in South Sudan is 0.13 g, whilst Abdalla et al (2001)
indicate a value closer to 0.3 g. Moreover, local seismic codes where they exist (Ethiopia, 1995;
Kenya, 1973; and Uganda, 2003) are often obsolete, generally unconservative and worst of all often
not adequately enforced. Therefore, as cities grow, both old and new structures could be at significant
risk which apart to leading to loss of life could significantly derail the development aspirations of the
region. Table 1 presents a very brief review of building codes and more specifically seismic
requirements in East Africa.
Table 1: Review of East African seismic design requirements.
Country Code or Standard
Seismic
Code?
Comments
Ethiopia
Ethiopia Building Code Standard
(EBCS) 1995, Volume 8 Seismic.
Yes
An earlier version of the code was based on UBC but the
most recent version is based on the Draft ENV 1998:1994
Eurocode 8. This code is often used as a reference in
other African countries for seismic design provisions. An
updated code has been in development since 2013 but the
authors were unable to obtain a draft.
South Sudan No code exists. No
Eurocode 8 is the international standard most often used
as no formal building code is mandated in South Sudan.
Uganda
Ugandan Ministry of Lands,
Housing and Urban Development,
Building Regulations, 2005.
Standard Seismic Code of Practice
for Structural Design, June 2003.
Yes
Uganda has historically relied on British Standards in
general. The country is in the process of adopting a code
based on the latest version of Eurocode. The current
seismic code is based on an older version of UBC. It
does not apply to structures smaller than 20 m2
or
buildings over 30 storeys high.
Rwanda
Building Regulations Manual
(2009) from the Rwanda Ministry
of Infrastructure (MININFRA).
Yes
Building Regulations Manual refers to current British
Standards, BS EN 1998 Eurocode 8 using a PGA of 1.6
m/s2
and a return period of 475 yrs.
Burundi Not known. No
Kenya
Code of Practice for the Design &
Construction of Buildings & other
Structures in relation to
Earthquakes (1973).
Yes
Uses an intensity based zoning without a specified return
period. Does not require seismic design for many
structures 4 - 6 storeys or less depending on the zone and
usage classification.
Tanzania Not known. No
Old British Standards (BS 8110 and BS 5950) are
generally used. They do not include any provisions for
seismic design.
Malawi
Various Malawi Standards
including for building materials
and construction practices.
No
Djibouti Not known. No
Democratic
Republic of
Congo
Not known. No Local engineers sometimes refer to old French codes.
Mozambique
A version of the Portuguese Code
from the colonial era (Bommer
2010).
No
Local engineers are of the opinion that the code
requirements are generally very conservative and
therefore could provide un-intentioned lateral resistance
against seismic loading (Bommer 2010). The South
Africa Building Code (SABS) is sometimes used.
This study aims at providing an overview of the seismic hazard at principal cities in the East
Africa region as well as a preliminary up to date guidance on seismic design specific to the region, so
design engineers can provide resilient and sustainable solutions for local communities and regional
and national governments.
To this end, a new probabilistic seismic hazard assessment has been developed for the region,
which is based on collating the data from pre-existing published studies but making use of the latest
earthquake data and ground motion predictive equations to derive revised hazard values. Seismic
hazard criteria have subsequently been developed according to both the requirements of Eurocode 8
(EN 1998) and ASCE 7 for the principal cities within the region.
Z.Lubkowski, K. Coates, M. Villani, N. Jirouskova and M. Willis
GEOLOGY AND TECTONICS
Africa is the oldest continent and had more or less taken on its current assemblage of cratons and
intervening orogenic belts by the start of the Cambrian period 540 million years ago, following the
Pan-African orogeny. Between then and the Cenozoic era the continent’s current interior experienced
a long period of relative stability as part of the Gondwana and Pangea super-continents. Separation of
the super-continents and delineation of the current continental profile began around 200 million years
ago, lasting till around 65 million years ago when South America and Madagascar finally drifted away
from the African mainland.
Continental extension along the East African Rift System (EARS) started during the Tertiary
around 45 million years ago and continues to the present day resulting in a significant level of seismic
hazard in parts of southern and eastern Africa. In places the EARS follows the alignment of the earlier
orogenic belts, including the Mozambique and Ubendian belts, and some re-activation of older
faulting has occurred. The origin of the rifting is now generally believed to be related to rising
thermal plumes in the mantle below Africa, which the continent has passed over during its drift north,
hence the initiation and greater rates of spreading in the northern sections.
The East African Rift System comprises a series of connected fault bounded depressions
separating the main African (Nubian) Plate from the Somali Plate. It extends for over 3000 km from
the Afar triple plate junction, through east Africa and into Mozambique. South of Ethiopia it divides
into the western and eastern (or Gregory) rift valleys around Lake Victoria and the Tanzania craton.
The western branch is younger (12 million years) and more seismic whereas the eastern branch is
more associated with volcanism.
The rift system also includes a number of major transform fault zones and secondary branches,
some along the alignment of earlier orogenic belts, as follows:
• The Aswa (or Assoua) shear zone trending NW-SE across South Sudan and into Uganda and
against which the western branch terminates.
• The Tanganyika – Rukwa – Malawi transform fault zone
• The North Tanzania Divergence where the eastern rift splits into three. An eastern Pangani
branch runs south-east to link with marginal extensional basins along the Tanzanian coastline, a
central Manyara – Balangida branch passes around the edge of the Tanzanian craton and links
with the western rift at a triple junction near Lake Rukwa and a western branch which
terminates against the craton near Lake Eyasi.
• The extensional basins in the Indian Ocean (Kerimbas – Lacerda rifts) continue south and have
reactivated the Davie Ridge, an intercontinental transform along which Madagascar was
displaced.
• The NE-SW trending Luangwa – Okavango (or Kariba) rift system, considered to be a nascent
rift at the edge of the Okavango intracontinental delta.
GPS surveys indicate that extension is greater at the northern end of the East African Rift
System at around 6.5 mm/year decreasing to 1mm / year at the southern end. Figure 1 shows an
extract of the recent seismotectonic map for the region (Milanesi et al., 2010). The main branch and
the secondary branch of the East African Rift system are highlighted by grey shadows while the main
transform zones are in light blue (Dauteuil et al. 2009). The background colours show the geology of
the East Africa area.
SEISMIC HAZARD ANALYSIS
The Probabilistic Seismic Hazard Assessment (PSHA) combines seismic source zoning, earthquake
recurrence and the ground motion attenuation to produce hazard curves in terms of level ground
motion and an associated annual frequency of exceedance. The basic methodology, based on Cornell
(1968) and modified to include integration of the aleatory variability of the ground motion prediction
equations, is implemented in the Arup in-house program Oasys SISMIC, which has been validated
using the Pacific Earthquake Engineering Research Cente tests (Thomas et al., 2010).
Z.Lubkowski, K. Coates, M. Villani, N. Jirouskova and M. Willis
4
Figure 1: extract of the seismotectonic map for the region from Milanesi et al., 2010. The main branch
and the secondary branch of the East African Rift system are in grey shadows while the main
transform zones are in light blue (Dauteuil et al. 2009).
Earthquake catalogue and seismic sources model
As a first step an earthquake catalogue was assembled considering a study area bounded by Latitudes
10°N – 22°N and Longitudes 37.75°E –47.50°E. The data sources considered in this process are
summarized in Table 1. The final catalogue (Figure 2) after the removal of the duplicates, fore-and
aftershocks and conversion of magnitudes, includes 1972 seismic events occurred between 1631 and
December 2013 with magnitudes 4 ≤Mw ≤7.3.
Z.Lubkowski, K. Coates, M. Villani, N. Jirouskova and M. Willis
Table 2: Source data for the compilation of the earthquake catalogue.
Period Reference Time Period Magnitude Notes
Historical
Period
Global Historical Earthquake
(GEH) Catalogue
1000-1903 Mw≥6 The catalogue was compiled based on
the review of 7 core references for the
region
NOAA/NGDC 2150BC-1903AD M ≥4 “uncritical” compilation of data
Instrumentalperiod
ISC-GEM 1903-2009 Mw ≥5.5 Groomed version of the ISC Catalogue
for >5.5Mw events.
EHB 1960-2008 Mw ≥4 Update of ISC catalogue based on the
hypocentrelocation algorithm by
Engdahl et al. (1998).
Reviewed International
Seismological Centre (ISC)
catalogue
2009-2011 Mw ≥4 Hypocentre location algorithm by
Bondar & Storchak (2011). From 2011
to 2013 the seismic events are not
reviewed in the catalogue
National Earthquake
Information Centre
(USGS/NEIC)
2011-2013 Mw ≥4 Preliminary earthquake data from
USGS. Source of most recent events.
The seismic source zones (SSZ) have been defined based on the distribution of observed
seismicity together with the simplified tectonic features identified in the area (see Figure 2).These
zones represent areas where the seismicity is assumed to be homogenous, i.e. there is an equal chance
that a given earthquake will occur at any point in the zone. Faults capable to produce moderate-to-
large earthquakes, with e.g. a characteristic behaviour are not considered in this preliminary model,
although they will be included in the future. Note that the simplified transform zone in the south (blue
shadow zone in Figures 1 and 2) does not have any associated event and thus, it wasn’t modelled in
the analysis. This may be reviewed in the future.
In order to evaluate the completeness of the catalogue, the seismic sources were geographically
grouped, accounting for the main seismotectonic features of the region. A visual cumulative method
with the basic assumption that on a time scale of decades, the rate of seismic occurrence for the earth
is roughly constant, was adopted and checked against the Stepp (1972) approach. Table 3 shows the
completeness results, highlighting that the catalogue cannot be considered complete between
magnitude 4 and 4.5.
Table 3: Threshold years (Tc) starting from which the earthquake catalogue is considered complete.
The last row indicates the maximum observed magnitude in each group.
Mw Group 1 Group 2 Group 3 Group 4 Group 5
4.0 - - - - -
4.5 1980 1980 1980 1980 1980
5.0 1960 1960 1960 1960 1960
5.5 1960 1960 1960 1960 1960
6.0 1900 1900 1900 1900 1900
Mmax,obs 7.1 7.1 6.8 7.3 7.3
A model of earthquake recurrence with respect to magnitude is needed for the description of the
seismicity. There are, generally, more small (low-magnitude) earthquakes than large (high-magnitude)
earthquakes. Again, observed seismicity is used to determine the earthquake recurrence relationships.
Two basic assumptions are made for these SSZs: (i) the temporal behaviour of the seismicity can be
approximated with a Poissonian distribution; and (ii) the magnitude distribution of seismicity is
represented by the truncated Gutenberg and Richter (1956) power law model. In our study the
minimum magnitude threshold is Mmin=4. The upper bound limit, Mmax. is required in order to prevent
the possibility (even small) that an infinitely large earthquake be assigned a non-zero occurrence rate
and it is estimated with consideration of the tectonic properties of the SSZ. In this study the maximum
magnitude value observed in each completeness group was assigned to each source.
The regression of the seismicity rates was performed through a maximum likelihood approach, as
formulated by Weichert (1980), which (1) accounts for the fact that the smaller the number of the
events represented by the cumulative rate and the lower the reliability of recurrence value and (2)
Z.Lubkowski, K. Coates, M. Villani, N. Jirouskova and M. Willis
6
handles varying levels of catalogue completeness. Table 4 shows the Gutenberg-Richter parameters in
terms of b-value, its standard error σb and the annual number of earthquake with Mw≥4, as well as the
observed maximum magnitude, Mmax,obs, associated with each source.
Figure 2: Final earthquake catalogue (graduate circles) and seismic source model (coloured polygons)
developed for the area. The main simplified tectonic features are also shown (grey and blue shadowed
zones) as well as the cities where the PSH results are computed.
Ground motion prediction equations
The last ingredient for estimation of seismic hazard is the description of the ground motion
attenuation, generally performed using empirical ground-motion prediction equations (GMPEs), also
referred to as or attenuation relationships. These models provide the expected ground motion
Z.Lubkowski, K. Coates, M. Villani, N. Jirouskova and M. Willis
parameters of engineering interest, such as response spectrum ordinates, as a function of a few
independent parameters (magnitude, source-to-site distance, site classification, focal mechanism, etc).
The variability of these predictions is usually referred to as aleatory variability and is represented by
the standard deviation (or standard error, σlog) of the logarithmic residuals.
Table 4: Parameters of seismicity for the 30 seismic source zones.
Zone ID Area (km2
) b σb N(M≥4)/yr. Mmax,obs Mmax,obs (group)
1 116333 1.11 0.101 7.315 6.6 7.1
2 112911 0.84 0.19 0.759 6.3 7.1
3 356011 0.97 0.039 29.233 7.1 7.1
4 250335 1.00 0.085 6.991 6.6 7.1
5 164020 0.72 0.09 2.169 6.8 7.1
6 100642 1.13 0.255 1.298 6.3 7.1
7 89133 0.65 0.223 0.302 7.0 7.1
8 82860 0.62 0.267 0.19 6.8 7.1
9 64219 0.93 0.154 1.525 7.1 6.8
10 21292 1.14 0.497 0.309 5.4 6.8
11 118191 0.91 0.062 8.692 6.6 6.8
12 207271 0.76 0.11 1.552 7.3 6.8
13 206845 0.87 0.235 0.619 6.9 7.1
14 103694 1.62 0.383 2.861 5.5 7.1
15 131725 1.23 0.107 10.352 6.5 7.1
16 153999 1.11 0.24 1.376 6.0 7.1
17 137302 0.95 0.218 0.818 6.5 7.3
18 182688 0.98 0.17 1.507 6.1 7.3
19 99815 1.01 0.132 2.81 6.3 7.3
20 110074 0.97 0.164 1.549 6.1 7.3
21 53428 1.11 0.477 0.313 5.0 7.3
22 179515 0.98 0.182 1.313 5.7 7.3
23 785114 0.80 0.165 0.819 6.1 7.3
24 315801 1.13 0.122 4.97 6.0 6.8
25 808124 1.09 0.097 7.035 6.3 7.3
26 204899 1.08 0.11 5.355 6.7 7.3
27 51291 0.85 0.117 1.92 7.2 6.8
28 101252 0.91 0.104 3.08 7.2 6.8
29 113933 1.13 0.108 6.361 6.8 6.8
30 138816 1.14 0.179 2.536 6.1 7.3
In order to capture the epistemic uncertainty related to the attenuation of ground motion in a
seismic hazard analysis, more than one ground-motion prediction equation should in general be
usedcombining multiple models is the logic tree. According to Cotton et al. (2006) and Bommer et al.
(2010) candidate GMPEs for a logic tree should be selected so as to obtain the smallest possible suite
of equations that can capture the expected range of possible ground motions in the target region. From
a comprehensive list of available equations several rejection criteria are defineds such as that the
model is from a clearly irrelevant tectonic regime.
For the East Africa area a few regional GMPEs were developed, such as those by Jonathan
(1996) and Twesigomwe (1997), both using data from Eastern and Southern Africa earthquakes.
However, these models have not been included in this analysis since they are developed only for the
peak ground acceleration (PGA) and for hard rock sites.
Ground motion models for shallow crustal environments in active tectonic regions (ASCR) have
been selected to preliminarily model the distribution of ground motions in East Africa. However, a
more detailed study is required to better investigate the type of attenuation occuring in the area. Table
5 shows the main characteristics of the attenuation equations for the SSZs included in the study: two
are from the Next Generation Attenuation (NGA West 1) project, Abrahamson and Silva (2008) and
Campbella dn Bozorgnia (2008), mainly based on Californian data and the third one is Akkar et al.
(2013) based on records from Europe and Middle East.
Z.Lubkowski, K. Coates, M. Villani, N. Jirouskova and M. Willis
8
All the computations assume rock sites with Vs30=760 m/s. The depth at which the shear wave
velocity reaches 1 km/s and 2.5 km/s, z1.0 and z2.5 respectively, have been estimated according to the
guidance in the papers.
Table 5: Selected Ground Motion Attenuation Equations
GMPE Region Regime Mean M R Focal Mech Soil Tmax (s)
Abrahamson and Silva
(2008), AS2008
Worldwide
(California)
ASCR GMro MW Rrup Rjb REV, SS, N Vs,30 10.0
Campbell and Bozorgnia
(2008), CB2008
Worldwide
(California)
ASCR GMro MW Rjb REV, SS, N Vs,30 10.0
Akkar and Bommer
(2010), AB2010
Europe and
Middle East
ASCR GM MW Rjb REV, SS, N Soil
classes
3.0
GM: geometric mean; GMro: rotated geometric mean (Boore et al, 2006); Focal Mechanism – Normal (N), strike-slip (SS)
and reverse (REV) style of faulting; Tmax (s) – Maximum response period in seconds for which a GMPE is formulated.
Treatment of uncertainties: the logic tree approach
In the PSHA the uncertainties affecting the different parameters play a critical role. They are generally
divided into epistemic and aleatory uncertainties. In simple terms, the epistemic uncertainty is due to
incomplete data and knowledge regarding the earthquake process (including the characteristics of the
seismic sources, the model of earthquake occurrence processes, the maximum magnitude, the
description of the ground motion attenuation). On the other side, the aleatory uncertainty is related to
the unpredictable nature of future earthquakes. Thus, most important among the aleatory uncertainties
are associated with the ground motion predictive equations (GMPEs), and are quantified by the
standard deviation of the prediction.
The standard procedure for accounting for the epistemic uncertainties is to include the different
possible choices of the input parameters in a logic tree. The approach was firstly introduced by
Kulkarni et al. (1984). Each branch of the tree represents a different choice regarding a specific step of
the analysis, and a normalized weight is assigned to it. The final result derives from the combination
of the “weighted” hazard curves calculated by following all the possible branches of the logic tree.
Figure 3 shows the logic tree developed for this study, as well as weights assigned to each
choice. In particular the following uncertainties have been included:
• b-value
• Mmax of the SSZ. Due to the incompleteness of the earthquake catalogue it has been assumed:
Mmax,Low= Mmax,obs, Mmax = Mmax,,obs+∆M and Mmax,High = Mmax,obs+2∆M, where Mmax,obs refers to
the maximum magnitude observed in the groups of sources (see Table 2) and ∆M=0.5.
• GMPE.
Figure 3: Logic tree adopted in the analysis.
One key question in any PSHA calculation for very low probabilities of exceedence (long return
periods) is how many standard deviations around the median value should be used in the analysis. It
has been shown (Strasser et al., 2008) that a value between three and four is probably appropriate,
though it is still subject to some debate. For the purpose of this analysis, five standard deviations have
been used.
Z.Lubkowski, K. Coates, M. Villani, N. Jirouskova and M. Willis
Seismic Hazard results
The results of a PSHA are expressed in terms of uniform hazard response spectra (UHRS) which
indicates, for a fixed annual probability of exceedance (return period), the value of the ground motion
parameter vs. the structural periods. In this study the 5%-damped UHRS on rock are computed for
return periods of 475 yr. (probability of 10 % in the next 50 yr.) and of 2,475 yr. (i.e. probability of
0.02% in the next 50 yr.) at 13 principal cities in the East Africa region.
Figure 4 shows the UHRS spectra for 475 yr.-RP at the 13 cities considered in this study (grey
curves). The EN 1998 (blue grey) elastic design spectra and the ASCE07-05 (red curves) elastic
design spectra are also plotted in the same figure. The comparison between the two design codes
highlitghts the more conservative shape of EN 1998 at intermediate and long period (T>~0.3s), while
in most cases ASCE07-05 spectra, as expected, fit better the UH spectral shape.
0 0.5 1 1.5 2
0
0.2
0.4
0.6
0.8
1
SA(g)
Addis Ababa
0 0.5 1 1.5 2
0
0.2
0.4
0.6
0.8
1
Juba
0 0.5 1 1.5 2
0
0.2
0.4
0.6
0.8
1
Kampala
0 0.5 1 1.5 2
0
0.2
0.4
0.6
0.8
1
SA(g)
Kigali
0 0.5 1 1.5 2
0
0.2
0.4
0.6
0.8
1
Bujumbura
0 0.5 1 1.5 2
0
0.2
0.4
0.6
0.8
1
Nairobi
0 0.5 1 1.5 2
0
0.2
0.4
0.6
0.8
1
SA(g)
Mombasa
0 0.5 1 1.5 2
0
0.2
0.4
0.6
0.8
1
Dar Es Salaam
0 0.5 1 1.5 2
0
0.2
0.4
0.6
0.8
1
Dodoma
0 0.5 1 1.5 2
0
0.2
0.4
0.6
0.8
1
SA(g)
Arusha
0 0.5 1 1.5 2
0
0.2
0.4
0.6
0.8
1
Lilongwe
0 0.5 1 1.5 2
0
0.2
0.4
0.6
0.8
1
Blantyre
0 0.5 1 1.5 2
0
0.2
0.4
0.6
0.8
1
T (s)
Djibouti
SA(g)
UHRS - RP=475 yr.
EC8 for RP=475 yr
ASCE07-05
Figure 4: Uniform hazard spectra at selected main cities in East Africa (grey thick curves) compared
with the elastic acceleration spectra derived from EN 1998 based on the PGA for RP=475 yr. (blue
curves) and those from ASCE07-05 (red curves).
Z.Lubkowski, K. Coates, M. Villani, N. Jirouskova and M. Willis
10
Table 6 shows the spectral values at T=0 s (PGA), 0.2 s and 1 s for both RP=475 and 2475 yr.,
as well as the values provided by GSHAP. It is highlighted that the PGA values for RP=475 yr.
derived in this study are generally larger than those provided by GHSAP with differences larger than
three times in Mombasa, Dar Es Salaam, Dodoma and Lilongwe. It also shows the highest hazard is
in Bujumbura and Djibouti, again substantially higher than the equivalent GSHAP values.
Table 6: PSHA results in terms of spectral acceleration at T=0 s (PGA), 0.2 s and 1 s for RP=475 and
2475 yr. The PGA values provided by GSHAP are also show for comparison.
SA(ζ=5% - RP=475 yr.)
(g)
SA(ζ=5% - RP=2475 yr.)
(g)
Country City PGA
PGA
GSHAP
PGA SA (T=0.2s) SA (T=1s)
Ethiopia Addis Ababa 0.13 0.11 0.29 0.71 0.17
South Sudan Juba 0.18 0.13 0.36 0.89 0.20
Uganda Kampala 0.09 0.09 0.18 0.45 0.13
Rwanda Kigali 0.15 0.06 0.31 0.76 0.19
Burundi Bujumbura 0.27 0.13 0.48 1.24 0.27
Kenya Nairobi 0.09 0.06 0.21 0.54 0.14
Kenya Mombasa 0.09 0.01 0.20 0.51 0.09
Tanzania Dar Es Salaam 0.09 0.03 0.20 0.50 0.09
Tanzania Dodoma 0.12 0.03 0.23 0.56 0.12
Tanzania Arusha 0.12 0.16 0.23 0.56 0.11
Malawi Lilongwe 0.20 0.05 0.37 0.94 0.15
Malawi Blantyre 0.12 0.09 0.25 0.62 0.10
Djibouti Djibouti 0.26 0.17 0.47 1.21 0.24
0 0.5 1 1.5 2
0
0.1
0.2
0.3
0.4
0.5
T (s)
SA(g)
Addis Ababa
UHRS - RP=475 yr.
EC8 - RP=475 yr.
Ethiopia code - Zone 2
Ethiopia code - Zone 3
0 0.5 1 1.5 2
0
0.1
0.2
0.3
0.4
0.5
T (s)
SA(g)
Kampala
UHRS - RP=475 yr.
EC8 - RP=475 yr.
Uganda code - Low ductility K=4
0 0.5 1 1.5 2
0
0.1
0.2
0.3
0.4
0.5
T (s)
SA(g)
Kigali
UHRS - RP=475 yr.
EC8 - RP=475 yr.
EC8 based on PGA=1.6 m/s2
0 0.5 1 1.5 2
0
0.1
0.2
0.3
0.4
0.5
T (s)
SA(g)
Nairobi
UHRS - RP=475 yr.
EC8 - RP=475 yr.
Kenya CoP Design
Kenya CoP Unscaled
Figure 5: Uniform hazard spectra at Addis Ababa, Kigala, Kampala and Nairobi (blue curves)
compared with the elastic acceleration spectra derived from EN 1998 based on the PGA for RP=475
yr. and country seismic code criteria.
Z.Lubkowski, K. Coates, M. Villani, N. Jirouskova and M. Willis
COMPARISON TO EAST AFRICAN SEISMIC CODES
A comparison of the UHRS in Addis Ababa, Kampala and Nairobi with the elastic seismic code
spectra for each country has been performed and the results are shown in Figure 5. The methodology
for the code criteria is described and the results of the comparison are discussed in Table 7.
Table 7: UHRS RP=475 yr. results comparison with seismic code spectra
City Seismic Code
Methodology
Code base shear
coefficient calculation
Discussion
Addis
Ababa
The EBCS 1995, Volume 8
Seismic provides a zoning
map for the country based
on a 100 yr return period.
Cs = α0Iβ0Sγ where
α0 = 0.05 for Zone 2
(Addis Ababa)
β0 = 1.2/T2/3
S = 1.0 for rock (vs30 >
800 m/s)
I = 1.0
γ = 1.0 for elastic spectra
It is not possible to directly compare our results as
the code criteria are based on a different return
period. As Addis Ababa sits so near the border to
Zone 3 (α0 = 0.07), this is also shown and it may be
advisable to adopt Zone 3 criteria for the city. Worku
(2011) also points out that the EBCS significantly
underestimates the effects of site soil amplification,
leading to significant underestimate of the hazard for
most sites.
Kampala Standard Seismic Code of
Practice for Structural
Design, June 2003 is
assumed to be based on a
475 yr. return period as it is
based on a version of UBC.
Cd(T) = C(T)ZIK where
Z= 0.7 for Zone 3
(Kampala)
I = 1.0
K = 4.0 for structures of
minimal ductility
Due to the method of multiplying up by a K factor
depending on the type of lateral system, there is not a
directly comparable elastic code spectra. The least
ductile type has been chosen instead for the purposes
of comparison. The code is capturing the hazard
well for this example when compared to our UHRS
results.
Nairobi Code of Practice for the
Design & Construction of
Buildings & other
Structures in relation to
Earthquakes (1973) does
not have a specified return
period.
C is specified by type of
ground and intensity zone
in tabular form.
For this comparison,
Table 3 was referred to
for flexible frames for
Zone VII (Nairobi) and
Hard/Medium ground
assumed
C = 0.5(0.05/T1/3
)
Once again, it is difficult to compare to the elastic
UHRS 475 yr results as the Kenyan code is based on
intensity (perception of damage) rather than
acceleration and does not specify a return period.
Response modification factors for difference
structural types are not given so a factor of 3 has
been used to scale up the design spectra. This would
be an appropriate factor for a system with limited
ductility such as an ordinary concrete moment frame.
This comparison implies that the Kenya code may
significantly underestimate the hazard for the short
period range (T< 0.7 sec) for Nairobi.
Kigali Building Regulations
Manual (2009) from the
Rwanda Ministry of
Infrastructure
(MININFRA) refers to BS
EN 1998 Eurocode 8 using
a return period of 475 yr.
agR = 1.6 m/s2
(0.16 g)
γI = 1.0
S= 1.0 for rock
η= 1 for 5% damping
The building regulations refer to the British version
of Eurocode 8 but then specifies a different return
period than in the UK Annex. No specific provisions
of the Eurocode are given in the regulations. The
regulations are capturing the hazard well for this
example when compared to our UHRS results.
CONCLUSIONS
This paper has proposed a new seismic hazard model for the East African region. Though the model
still requires further development (e.g. inclusion of specific faults etc) it shows that the existing
seismic hazard models such as GSHAP underestimate the seismic hazard in many of the major cities
in the region.
A comparison of the seismic hazard against four local codes shows a similar situation, except
for the more recent seismic codes for Uganda and Rwanda. Based on this preliminary study it would
seem more appropriate to use a more modern code such as Eurocode 8 or ASCE 7 when undertaking
new developments in the East African region.
Z.Lubkowski, K. Coates, M. Villani, N. Jirouskova and M. Willis
12
REFERENCES
Abrahamson, N. A. and W. Silva (2008). “Summary of the Abrahamson & Silva NGA Ground Motion
Relations”, Earthquake Spectra, 24(1): 67-97.
American Society of Civil Engineers, ASCE7-05 (2005) Minimum design Load for buildings and
other structures.
Bommer, JJ, Douglas, J; Scherbaum, F; Cotton, F; Bungum, H; Fah, D., (2010) “On the Selection of
Ground-Motion Prediction Equations for Seismic Hazard Analysis”, Seismological Research
Letters, 81(5): 783-793.
Campbell, K. W. and Y. Bozorgnia (2008), “NGA Ground Motion Model for the Geometric Mean
Horizontal Component of PGA, PGV, PGD and 5% Damped Linear Elastic Response Spectra
for Periods Ranging from 0.01 to 10 s”, Earthquake Spectra, 24(1): 139-171.
CEN (Comité Européen de Normalisation) (2004) Eurocode 8: Design of structures for earthquake
resistance - Part 1: General rules, seismic actions and rules for buildings, Brussels, May.
Code of Practice for the Design & Construction of Buildings & other Structures in relation to
Earthquakes (1973).[KC1]
Cornell, A.C. (1968), “Engineering seismic risk analysis”, Bulletin of the Seismological Society of
America, 58: 1583-1606.
Cotton, F., Scherbaum, F., Bommer, J.J., Bungum, H. (2006). “Criteria for selecting and adjusting
ground-motion models for specific target regions: Application to central Europe and rock sites”,
Journal of Seismology,10(2):137–156.
Dauteuil, O., Bouffette, J. and Toteu, F. (2009). The changing faces of Africa. Elements of African
geology. Commission for the Geological Map of the World (CCGM/CGMW).
Ethiopia Building Code Standard (EBCS) 1995, Volume 8 Seismic,
http://www.ethiopians.com/EBCS_8_95.htm
Giardini, D., Grünthal, G., Shedlock, K. M. and Zhang, P.: The GSHAP Global Seismic Hazard Map.
Annali di geofisica, 42(6): 1225-1230.
Gutenberg, B., and Richter, C.F., (1956), "Magnitude and energy of earthquakes", Annals of
Geophysics, 9: 1-15.
Jonathan, E., 1996.”Some Aspects of Seismicity in Zimbabwe and Eastern and Southern Africa”,
M.Sc. Thesis, Institute of Solid Earth Physics, University Bergen, Bergen, Norway, pp. 100.
Kulkarni R.B., Youngs R.R., Coppersmuth K.J., (1984). "Assessment of Confidence Intervals for
Results of Seismic Hazard Analysis", Proceedings of the 8th World Conference on Earthquake
Engineering, San Francisco, CA, (July 21-28 1984) I: 263-270.
Milesi J.P., Frizon de Lamotte D., de Kock G. and Toteu, F. (2010). Tectonic Map of Africa. 2nd
Edition. Commission for the Geological Map of the World (CCGM/CGMW).
Reiter, L. (1990), Earthquake Hazard Analysis: Issues and Insights, Columbia University Press, New
York.
Republic of Rwanda Ministry of Infrastructure, Rwanda Building Control Regulations 2009.
Stepp, J.C. (1972), "Analysis of Completeness of the Earthquake Sample in the Puget Sound Area and
its effects on Statistical Estimates of Earthquake Hazard", Proceedings of the International
Conference on Micro-zonation for Safer Construction, Research and Application, Seattle.
2: 897-909.
Thomas, P., Wong, I., and Abrahamson, N., (2010), Verification of Probabilistic Seismic Hazard
Analysis Computer Programs, PEER Report 2010/106.
Twesigomwe, E., 1997, “Probabilistic Seismic Hazard Assessment of Uganda”, Ph. D. Thesis, Dept.of
Physics, Makarere University, Uganda.
Uganda National Bureau of Standards (2003). Uganda Standard Seismic Code of Practice for
Structural Designs,US319:2003.
Weichert, D H. (1980). "Estimation of the earthquake recurrence parameters for unequal observation
periods for different magnitudes". Bulletin of the Seismological Society of America, 70: 1337-
1346.
Worku, A., (2011), “Recent developments in the definition of design earthquake ground motions
calling for a revision of the current Ethiopian Seismic Code EBCS: 1995”. Zede, Journal of
Ethiopian Engineers and Architects, Issue 28.

986

  • 1.
    1 SEISMIC DESIGN CONSIDERATIONSFOR EAST AFRICA Zygmunt LUBKOWSKI1 , Manuela VILLANI2 , Katherine COATES3 , Nina JIROUSKOVA4 , Matthew WILLIS 5 ABSTRACT It is our belief that as engineers, geologists, seismologists, architects and designers we have the responsibility to improve the world’s infrastructure, so that the world becomes a more resilient place to live. Too often we take the easy option of “doing what the code says” and not thinking about how we can improve the status quo. This is important everywhere but essential in the developing regions so the investments made can make a real difference. This paper is an example of work carried out at Arup to investigate the suitability and appropriateness of local codes in the East African region. The paper begins with examining the seismic hazard, by developing a new probabilistic seismic hazard model, then reviews the codes and makes recommendations for future development. The East African region was chosen since several major earthquakes have occurred over the last century but luckily there have been few fatalities. Will this continue to be the case as major cities in the region grow at a fast pace? Though these are still preliminary studies, and should be treated as such, we hope this information will allow more informed discussions with local governments, NGO’s and investors so that more informed decisions can be made and hopefully the resilience of East African communities improved. INTRODUCTION East Africa is a developing market and constructing new infrastructure is one of the keys to the successful growth and prosperity for the region. However, the region is split by the active East African Rift Valley, which has a history of generating large earthquakes, such as: • 7.4Ms Rukwa Tanzania earthquake on 13th December 1910 (Ambraseys, 1991a) • 6.9MS Subukia, Kenya earthquake on 9th January 1928 (Ambraseys, 1991b); • 7.4MS South Sudan earthquake on 20th May 1990; and • 7.0MW Manica, Mozambique earthquake on 22nd February 2006 (Fenton and Bommer, 2006). Though earthquakes such as these have not led to significant loss of life or destruction of key infrastructure it is only a matter of time until this transpires. Ambraseys (1991a) was one of the first to highlight the increasing risk in East Africa from major earthquakes. 1 Associate Director, Ove Arup & Partners, London, ziggy.lubkowski@arup.com 2 Senior Engineer, Ove Arup & Partners, London, manuela.villani@arup.com 3 Associate Ove Arup & Partners, London, katherine.coates@arup.com 4 Engineer, Ove Arup & Partners, London, nina.jirouskova @arup.com 5 Senior Geologist, Ove Arup & Partners, London, matthew.willis@arup.com
  • 2.
    Z.Lubkowski, K. Coates,M. Villani, N. Jirouskova and M. Willis 2 Comparison of existing seismic hazard studies in the region, such as GSHAP (Giardini et al., 1999), seismic zonation maps in national codes, and more recent site specific studies, suggest that the hazard may be underestimated, sometimes significantly. For example GSHAP indicates the 475 year peak ground acceleration (PGA) on rock for Juba in South Sudan is 0.13 g, whilst Abdalla et al (2001) indicate a value closer to 0.3 g. Moreover, local seismic codes where they exist (Ethiopia, 1995; Kenya, 1973; and Uganda, 2003) are often obsolete, generally unconservative and worst of all often not adequately enforced. Therefore, as cities grow, both old and new structures could be at significant risk which apart to leading to loss of life could significantly derail the development aspirations of the region. Table 1 presents a very brief review of building codes and more specifically seismic requirements in East Africa. Table 1: Review of East African seismic design requirements. Country Code or Standard Seismic Code? Comments Ethiopia Ethiopia Building Code Standard (EBCS) 1995, Volume 8 Seismic. Yes An earlier version of the code was based on UBC but the most recent version is based on the Draft ENV 1998:1994 Eurocode 8. This code is often used as a reference in other African countries for seismic design provisions. An updated code has been in development since 2013 but the authors were unable to obtain a draft. South Sudan No code exists. No Eurocode 8 is the international standard most often used as no formal building code is mandated in South Sudan. Uganda Ugandan Ministry of Lands, Housing and Urban Development, Building Regulations, 2005. Standard Seismic Code of Practice for Structural Design, June 2003. Yes Uganda has historically relied on British Standards in general. The country is in the process of adopting a code based on the latest version of Eurocode. The current seismic code is based on an older version of UBC. It does not apply to structures smaller than 20 m2 or buildings over 30 storeys high. Rwanda Building Regulations Manual (2009) from the Rwanda Ministry of Infrastructure (MININFRA). Yes Building Regulations Manual refers to current British Standards, BS EN 1998 Eurocode 8 using a PGA of 1.6 m/s2 and a return period of 475 yrs. Burundi Not known. No Kenya Code of Practice for the Design & Construction of Buildings & other Structures in relation to Earthquakes (1973). Yes Uses an intensity based zoning without a specified return period. Does not require seismic design for many structures 4 - 6 storeys or less depending on the zone and usage classification. Tanzania Not known. No Old British Standards (BS 8110 and BS 5950) are generally used. They do not include any provisions for seismic design. Malawi Various Malawi Standards including for building materials and construction practices. No Djibouti Not known. No Democratic Republic of Congo Not known. No Local engineers sometimes refer to old French codes. Mozambique A version of the Portuguese Code from the colonial era (Bommer 2010). No Local engineers are of the opinion that the code requirements are generally very conservative and therefore could provide un-intentioned lateral resistance against seismic loading (Bommer 2010). The South Africa Building Code (SABS) is sometimes used. This study aims at providing an overview of the seismic hazard at principal cities in the East Africa region as well as a preliminary up to date guidance on seismic design specific to the region, so design engineers can provide resilient and sustainable solutions for local communities and regional and national governments. To this end, a new probabilistic seismic hazard assessment has been developed for the region, which is based on collating the data from pre-existing published studies but making use of the latest earthquake data and ground motion predictive equations to derive revised hazard values. Seismic hazard criteria have subsequently been developed according to both the requirements of Eurocode 8 (EN 1998) and ASCE 7 for the principal cities within the region.
  • 3.
    Z.Lubkowski, K. Coates,M. Villani, N. Jirouskova and M. Willis GEOLOGY AND TECTONICS Africa is the oldest continent and had more or less taken on its current assemblage of cratons and intervening orogenic belts by the start of the Cambrian period 540 million years ago, following the Pan-African orogeny. Between then and the Cenozoic era the continent’s current interior experienced a long period of relative stability as part of the Gondwana and Pangea super-continents. Separation of the super-continents and delineation of the current continental profile began around 200 million years ago, lasting till around 65 million years ago when South America and Madagascar finally drifted away from the African mainland. Continental extension along the East African Rift System (EARS) started during the Tertiary around 45 million years ago and continues to the present day resulting in a significant level of seismic hazard in parts of southern and eastern Africa. In places the EARS follows the alignment of the earlier orogenic belts, including the Mozambique and Ubendian belts, and some re-activation of older faulting has occurred. The origin of the rifting is now generally believed to be related to rising thermal plumes in the mantle below Africa, which the continent has passed over during its drift north, hence the initiation and greater rates of spreading in the northern sections. The East African Rift System comprises a series of connected fault bounded depressions separating the main African (Nubian) Plate from the Somali Plate. It extends for over 3000 km from the Afar triple plate junction, through east Africa and into Mozambique. South of Ethiopia it divides into the western and eastern (or Gregory) rift valleys around Lake Victoria and the Tanzania craton. The western branch is younger (12 million years) and more seismic whereas the eastern branch is more associated with volcanism. The rift system also includes a number of major transform fault zones and secondary branches, some along the alignment of earlier orogenic belts, as follows: • The Aswa (or Assoua) shear zone trending NW-SE across South Sudan and into Uganda and against which the western branch terminates. • The Tanganyika – Rukwa – Malawi transform fault zone • The North Tanzania Divergence where the eastern rift splits into three. An eastern Pangani branch runs south-east to link with marginal extensional basins along the Tanzanian coastline, a central Manyara – Balangida branch passes around the edge of the Tanzanian craton and links with the western rift at a triple junction near Lake Rukwa and a western branch which terminates against the craton near Lake Eyasi. • The extensional basins in the Indian Ocean (Kerimbas – Lacerda rifts) continue south and have reactivated the Davie Ridge, an intercontinental transform along which Madagascar was displaced. • The NE-SW trending Luangwa – Okavango (or Kariba) rift system, considered to be a nascent rift at the edge of the Okavango intracontinental delta. GPS surveys indicate that extension is greater at the northern end of the East African Rift System at around 6.5 mm/year decreasing to 1mm / year at the southern end. Figure 1 shows an extract of the recent seismotectonic map for the region (Milanesi et al., 2010). The main branch and the secondary branch of the East African Rift system are highlighted by grey shadows while the main transform zones are in light blue (Dauteuil et al. 2009). The background colours show the geology of the East Africa area. SEISMIC HAZARD ANALYSIS The Probabilistic Seismic Hazard Assessment (PSHA) combines seismic source zoning, earthquake recurrence and the ground motion attenuation to produce hazard curves in terms of level ground motion and an associated annual frequency of exceedance. The basic methodology, based on Cornell (1968) and modified to include integration of the aleatory variability of the ground motion prediction equations, is implemented in the Arup in-house program Oasys SISMIC, which has been validated using the Pacific Earthquake Engineering Research Cente tests (Thomas et al., 2010).
  • 4.
    Z.Lubkowski, K. Coates,M. Villani, N. Jirouskova and M. Willis 4 Figure 1: extract of the seismotectonic map for the region from Milanesi et al., 2010. The main branch and the secondary branch of the East African Rift system are in grey shadows while the main transform zones are in light blue (Dauteuil et al. 2009). Earthquake catalogue and seismic sources model As a first step an earthquake catalogue was assembled considering a study area bounded by Latitudes 10°N – 22°N and Longitudes 37.75°E –47.50°E. The data sources considered in this process are summarized in Table 1. The final catalogue (Figure 2) after the removal of the duplicates, fore-and aftershocks and conversion of magnitudes, includes 1972 seismic events occurred between 1631 and December 2013 with magnitudes 4 ≤Mw ≤7.3.
  • 5.
    Z.Lubkowski, K. Coates,M. Villani, N. Jirouskova and M. Willis Table 2: Source data for the compilation of the earthquake catalogue. Period Reference Time Period Magnitude Notes Historical Period Global Historical Earthquake (GEH) Catalogue 1000-1903 Mw≥6 The catalogue was compiled based on the review of 7 core references for the region NOAA/NGDC 2150BC-1903AD M ≥4 “uncritical” compilation of data Instrumentalperiod ISC-GEM 1903-2009 Mw ≥5.5 Groomed version of the ISC Catalogue for >5.5Mw events. EHB 1960-2008 Mw ≥4 Update of ISC catalogue based on the hypocentrelocation algorithm by Engdahl et al. (1998). Reviewed International Seismological Centre (ISC) catalogue 2009-2011 Mw ≥4 Hypocentre location algorithm by Bondar & Storchak (2011). From 2011 to 2013 the seismic events are not reviewed in the catalogue National Earthquake Information Centre (USGS/NEIC) 2011-2013 Mw ≥4 Preliminary earthquake data from USGS. Source of most recent events. The seismic source zones (SSZ) have been defined based on the distribution of observed seismicity together with the simplified tectonic features identified in the area (see Figure 2).These zones represent areas where the seismicity is assumed to be homogenous, i.e. there is an equal chance that a given earthquake will occur at any point in the zone. Faults capable to produce moderate-to- large earthquakes, with e.g. a characteristic behaviour are not considered in this preliminary model, although they will be included in the future. Note that the simplified transform zone in the south (blue shadow zone in Figures 1 and 2) does not have any associated event and thus, it wasn’t modelled in the analysis. This may be reviewed in the future. In order to evaluate the completeness of the catalogue, the seismic sources were geographically grouped, accounting for the main seismotectonic features of the region. A visual cumulative method with the basic assumption that on a time scale of decades, the rate of seismic occurrence for the earth is roughly constant, was adopted and checked against the Stepp (1972) approach. Table 3 shows the completeness results, highlighting that the catalogue cannot be considered complete between magnitude 4 and 4.5. Table 3: Threshold years (Tc) starting from which the earthquake catalogue is considered complete. The last row indicates the maximum observed magnitude in each group. Mw Group 1 Group 2 Group 3 Group 4 Group 5 4.0 - - - - - 4.5 1980 1980 1980 1980 1980 5.0 1960 1960 1960 1960 1960 5.5 1960 1960 1960 1960 1960 6.0 1900 1900 1900 1900 1900 Mmax,obs 7.1 7.1 6.8 7.3 7.3 A model of earthquake recurrence with respect to magnitude is needed for the description of the seismicity. There are, generally, more small (low-magnitude) earthquakes than large (high-magnitude) earthquakes. Again, observed seismicity is used to determine the earthquake recurrence relationships. Two basic assumptions are made for these SSZs: (i) the temporal behaviour of the seismicity can be approximated with a Poissonian distribution; and (ii) the magnitude distribution of seismicity is represented by the truncated Gutenberg and Richter (1956) power law model. In our study the minimum magnitude threshold is Mmin=4. The upper bound limit, Mmax. is required in order to prevent the possibility (even small) that an infinitely large earthquake be assigned a non-zero occurrence rate and it is estimated with consideration of the tectonic properties of the SSZ. In this study the maximum magnitude value observed in each completeness group was assigned to each source. The regression of the seismicity rates was performed through a maximum likelihood approach, as formulated by Weichert (1980), which (1) accounts for the fact that the smaller the number of the events represented by the cumulative rate and the lower the reliability of recurrence value and (2)
  • 6.
    Z.Lubkowski, K. Coates,M. Villani, N. Jirouskova and M. Willis 6 handles varying levels of catalogue completeness. Table 4 shows the Gutenberg-Richter parameters in terms of b-value, its standard error σb and the annual number of earthquake with Mw≥4, as well as the observed maximum magnitude, Mmax,obs, associated with each source. Figure 2: Final earthquake catalogue (graduate circles) and seismic source model (coloured polygons) developed for the area. The main simplified tectonic features are also shown (grey and blue shadowed zones) as well as the cities where the PSH results are computed. Ground motion prediction equations The last ingredient for estimation of seismic hazard is the description of the ground motion attenuation, generally performed using empirical ground-motion prediction equations (GMPEs), also referred to as or attenuation relationships. These models provide the expected ground motion
  • 7.
    Z.Lubkowski, K. Coates,M. Villani, N. Jirouskova and M. Willis parameters of engineering interest, such as response spectrum ordinates, as a function of a few independent parameters (magnitude, source-to-site distance, site classification, focal mechanism, etc). The variability of these predictions is usually referred to as aleatory variability and is represented by the standard deviation (or standard error, σlog) of the logarithmic residuals. Table 4: Parameters of seismicity for the 30 seismic source zones. Zone ID Area (km2 ) b σb N(M≥4)/yr. Mmax,obs Mmax,obs (group) 1 116333 1.11 0.101 7.315 6.6 7.1 2 112911 0.84 0.19 0.759 6.3 7.1 3 356011 0.97 0.039 29.233 7.1 7.1 4 250335 1.00 0.085 6.991 6.6 7.1 5 164020 0.72 0.09 2.169 6.8 7.1 6 100642 1.13 0.255 1.298 6.3 7.1 7 89133 0.65 0.223 0.302 7.0 7.1 8 82860 0.62 0.267 0.19 6.8 7.1 9 64219 0.93 0.154 1.525 7.1 6.8 10 21292 1.14 0.497 0.309 5.4 6.8 11 118191 0.91 0.062 8.692 6.6 6.8 12 207271 0.76 0.11 1.552 7.3 6.8 13 206845 0.87 0.235 0.619 6.9 7.1 14 103694 1.62 0.383 2.861 5.5 7.1 15 131725 1.23 0.107 10.352 6.5 7.1 16 153999 1.11 0.24 1.376 6.0 7.1 17 137302 0.95 0.218 0.818 6.5 7.3 18 182688 0.98 0.17 1.507 6.1 7.3 19 99815 1.01 0.132 2.81 6.3 7.3 20 110074 0.97 0.164 1.549 6.1 7.3 21 53428 1.11 0.477 0.313 5.0 7.3 22 179515 0.98 0.182 1.313 5.7 7.3 23 785114 0.80 0.165 0.819 6.1 7.3 24 315801 1.13 0.122 4.97 6.0 6.8 25 808124 1.09 0.097 7.035 6.3 7.3 26 204899 1.08 0.11 5.355 6.7 7.3 27 51291 0.85 0.117 1.92 7.2 6.8 28 101252 0.91 0.104 3.08 7.2 6.8 29 113933 1.13 0.108 6.361 6.8 6.8 30 138816 1.14 0.179 2.536 6.1 7.3 In order to capture the epistemic uncertainty related to the attenuation of ground motion in a seismic hazard analysis, more than one ground-motion prediction equation should in general be usedcombining multiple models is the logic tree. According to Cotton et al. (2006) and Bommer et al. (2010) candidate GMPEs for a logic tree should be selected so as to obtain the smallest possible suite of equations that can capture the expected range of possible ground motions in the target region. From a comprehensive list of available equations several rejection criteria are defineds such as that the model is from a clearly irrelevant tectonic regime. For the East Africa area a few regional GMPEs were developed, such as those by Jonathan (1996) and Twesigomwe (1997), both using data from Eastern and Southern Africa earthquakes. However, these models have not been included in this analysis since they are developed only for the peak ground acceleration (PGA) and for hard rock sites. Ground motion models for shallow crustal environments in active tectonic regions (ASCR) have been selected to preliminarily model the distribution of ground motions in East Africa. However, a more detailed study is required to better investigate the type of attenuation occuring in the area. Table 5 shows the main characteristics of the attenuation equations for the SSZs included in the study: two are from the Next Generation Attenuation (NGA West 1) project, Abrahamson and Silva (2008) and Campbella dn Bozorgnia (2008), mainly based on Californian data and the third one is Akkar et al. (2013) based on records from Europe and Middle East.
  • 8.
    Z.Lubkowski, K. Coates,M. Villani, N. Jirouskova and M. Willis 8 All the computations assume rock sites with Vs30=760 m/s. The depth at which the shear wave velocity reaches 1 km/s and 2.5 km/s, z1.0 and z2.5 respectively, have been estimated according to the guidance in the papers. Table 5: Selected Ground Motion Attenuation Equations GMPE Region Regime Mean M R Focal Mech Soil Tmax (s) Abrahamson and Silva (2008), AS2008 Worldwide (California) ASCR GMro MW Rrup Rjb REV, SS, N Vs,30 10.0 Campbell and Bozorgnia (2008), CB2008 Worldwide (California) ASCR GMro MW Rjb REV, SS, N Vs,30 10.0 Akkar and Bommer (2010), AB2010 Europe and Middle East ASCR GM MW Rjb REV, SS, N Soil classes 3.0 GM: geometric mean; GMro: rotated geometric mean (Boore et al, 2006); Focal Mechanism – Normal (N), strike-slip (SS) and reverse (REV) style of faulting; Tmax (s) – Maximum response period in seconds for which a GMPE is formulated. Treatment of uncertainties: the logic tree approach In the PSHA the uncertainties affecting the different parameters play a critical role. They are generally divided into epistemic and aleatory uncertainties. In simple terms, the epistemic uncertainty is due to incomplete data and knowledge regarding the earthquake process (including the characteristics of the seismic sources, the model of earthquake occurrence processes, the maximum magnitude, the description of the ground motion attenuation). On the other side, the aleatory uncertainty is related to the unpredictable nature of future earthquakes. Thus, most important among the aleatory uncertainties are associated with the ground motion predictive equations (GMPEs), and are quantified by the standard deviation of the prediction. The standard procedure for accounting for the epistemic uncertainties is to include the different possible choices of the input parameters in a logic tree. The approach was firstly introduced by Kulkarni et al. (1984). Each branch of the tree represents a different choice regarding a specific step of the analysis, and a normalized weight is assigned to it. The final result derives from the combination of the “weighted” hazard curves calculated by following all the possible branches of the logic tree. Figure 3 shows the logic tree developed for this study, as well as weights assigned to each choice. In particular the following uncertainties have been included: • b-value • Mmax of the SSZ. Due to the incompleteness of the earthquake catalogue it has been assumed: Mmax,Low= Mmax,obs, Mmax = Mmax,,obs+∆M and Mmax,High = Mmax,obs+2∆M, where Mmax,obs refers to the maximum magnitude observed in the groups of sources (see Table 2) and ∆M=0.5. • GMPE. Figure 3: Logic tree adopted in the analysis. One key question in any PSHA calculation for very low probabilities of exceedence (long return periods) is how many standard deviations around the median value should be used in the analysis. It has been shown (Strasser et al., 2008) that a value between three and four is probably appropriate, though it is still subject to some debate. For the purpose of this analysis, five standard deviations have been used.
  • 9.
    Z.Lubkowski, K. Coates,M. Villani, N. Jirouskova and M. Willis Seismic Hazard results The results of a PSHA are expressed in terms of uniform hazard response spectra (UHRS) which indicates, for a fixed annual probability of exceedance (return period), the value of the ground motion parameter vs. the structural periods. In this study the 5%-damped UHRS on rock are computed for return periods of 475 yr. (probability of 10 % in the next 50 yr.) and of 2,475 yr. (i.e. probability of 0.02% in the next 50 yr.) at 13 principal cities in the East Africa region. Figure 4 shows the UHRS spectra for 475 yr.-RP at the 13 cities considered in this study (grey curves). The EN 1998 (blue grey) elastic design spectra and the ASCE07-05 (red curves) elastic design spectra are also plotted in the same figure. The comparison between the two design codes highlitghts the more conservative shape of EN 1998 at intermediate and long period (T>~0.3s), while in most cases ASCE07-05 spectra, as expected, fit better the UH spectral shape. 0 0.5 1 1.5 2 0 0.2 0.4 0.6 0.8 1 SA(g) Addis Ababa 0 0.5 1 1.5 2 0 0.2 0.4 0.6 0.8 1 Juba 0 0.5 1 1.5 2 0 0.2 0.4 0.6 0.8 1 Kampala 0 0.5 1 1.5 2 0 0.2 0.4 0.6 0.8 1 SA(g) Kigali 0 0.5 1 1.5 2 0 0.2 0.4 0.6 0.8 1 Bujumbura 0 0.5 1 1.5 2 0 0.2 0.4 0.6 0.8 1 Nairobi 0 0.5 1 1.5 2 0 0.2 0.4 0.6 0.8 1 SA(g) Mombasa 0 0.5 1 1.5 2 0 0.2 0.4 0.6 0.8 1 Dar Es Salaam 0 0.5 1 1.5 2 0 0.2 0.4 0.6 0.8 1 Dodoma 0 0.5 1 1.5 2 0 0.2 0.4 0.6 0.8 1 SA(g) Arusha 0 0.5 1 1.5 2 0 0.2 0.4 0.6 0.8 1 Lilongwe 0 0.5 1 1.5 2 0 0.2 0.4 0.6 0.8 1 Blantyre 0 0.5 1 1.5 2 0 0.2 0.4 0.6 0.8 1 T (s) Djibouti SA(g) UHRS - RP=475 yr. EC8 for RP=475 yr ASCE07-05 Figure 4: Uniform hazard spectra at selected main cities in East Africa (grey thick curves) compared with the elastic acceleration spectra derived from EN 1998 based on the PGA for RP=475 yr. (blue curves) and those from ASCE07-05 (red curves).
  • 10.
    Z.Lubkowski, K. Coates,M. Villani, N. Jirouskova and M. Willis 10 Table 6 shows the spectral values at T=0 s (PGA), 0.2 s and 1 s for both RP=475 and 2475 yr., as well as the values provided by GSHAP. It is highlighted that the PGA values for RP=475 yr. derived in this study are generally larger than those provided by GHSAP with differences larger than three times in Mombasa, Dar Es Salaam, Dodoma and Lilongwe. It also shows the highest hazard is in Bujumbura and Djibouti, again substantially higher than the equivalent GSHAP values. Table 6: PSHA results in terms of spectral acceleration at T=0 s (PGA), 0.2 s and 1 s for RP=475 and 2475 yr. The PGA values provided by GSHAP are also show for comparison. SA(ζ=5% - RP=475 yr.) (g) SA(ζ=5% - RP=2475 yr.) (g) Country City PGA PGA GSHAP PGA SA (T=0.2s) SA (T=1s) Ethiopia Addis Ababa 0.13 0.11 0.29 0.71 0.17 South Sudan Juba 0.18 0.13 0.36 0.89 0.20 Uganda Kampala 0.09 0.09 0.18 0.45 0.13 Rwanda Kigali 0.15 0.06 0.31 0.76 0.19 Burundi Bujumbura 0.27 0.13 0.48 1.24 0.27 Kenya Nairobi 0.09 0.06 0.21 0.54 0.14 Kenya Mombasa 0.09 0.01 0.20 0.51 0.09 Tanzania Dar Es Salaam 0.09 0.03 0.20 0.50 0.09 Tanzania Dodoma 0.12 0.03 0.23 0.56 0.12 Tanzania Arusha 0.12 0.16 0.23 0.56 0.11 Malawi Lilongwe 0.20 0.05 0.37 0.94 0.15 Malawi Blantyre 0.12 0.09 0.25 0.62 0.10 Djibouti Djibouti 0.26 0.17 0.47 1.21 0.24 0 0.5 1 1.5 2 0 0.1 0.2 0.3 0.4 0.5 T (s) SA(g) Addis Ababa UHRS - RP=475 yr. EC8 - RP=475 yr. Ethiopia code - Zone 2 Ethiopia code - Zone 3 0 0.5 1 1.5 2 0 0.1 0.2 0.3 0.4 0.5 T (s) SA(g) Kampala UHRS - RP=475 yr. EC8 - RP=475 yr. Uganda code - Low ductility K=4 0 0.5 1 1.5 2 0 0.1 0.2 0.3 0.4 0.5 T (s) SA(g) Kigali UHRS - RP=475 yr. EC8 - RP=475 yr. EC8 based on PGA=1.6 m/s2 0 0.5 1 1.5 2 0 0.1 0.2 0.3 0.4 0.5 T (s) SA(g) Nairobi UHRS - RP=475 yr. EC8 - RP=475 yr. Kenya CoP Design Kenya CoP Unscaled Figure 5: Uniform hazard spectra at Addis Ababa, Kigala, Kampala and Nairobi (blue curves) compared with the elastic acceleration spectra derived from EN 1998 based on the PGA for RP=475 yr. and country seismic code criteria.
  • 11.
    Z.Lubkowski, K. Coates,M. Villani, N. Jirouskova and M. Willis COMPARISON TO EAST AFRICAN SEISMIC CODES A comparison of the UHRS in Addis Ababa, Kampala and Nairobi with the elastic seismic code spectra for each country has been performed and the results are shown in Figure 5. The methodology for the code criteria is described and the results of the comparison are discussed in Table 7. Table 7: UHRS RP=475 yr. results comparison with seismic code spectra City Seismic Code Methodology Code base shear coefficient calculation Discussion Addis Ababa The EBCS 1995, Volume 8 Seismic provides a zoning map for the country based on a 100 yr return period. Cs = α0Iβ0Sγ where α0 = 0.05 for Zone 2 (Addis Ababa) β0 = 1.2/T2/3 S = 1.0 for rock (vs30 > 800 m/s) I = 1.0 γ = 1.0 for elastic spectra It is not possible to directly compare our results as the code criteria are based on a different return period. As Addis Ababa sits so near the border to Zone 3 (α0 = 0.07), this is also shown and it may be advisable to adopt Zone 3 criteria for the city. Worku (2011) also points out that the EBCS significantly underestimates the effects of site soil amplification, leading to significant underestimate of the hazard for most sites. Kampala Standard Seismic Code of Practice for Structural Design, June 2003 is assumed to be based on a 475 yr. return period as it is based on a version of UBC. Cd(T) = C(T)ZIK where Z= 0.7 for Zone 3 (Kampala) I = 1.0 K = 4.0 for structures of minimal ductility Due to the method of multiplying up by a K factor depending on the type of lateral system, there is not a directly comparable elastic code spectra. The least ductile type has been chosen instead for the purposes of comparison. The code is capturing the hazard well for this example when compared to our UHRS results. Nairobi Code of Practice for the Design & Construction of Buildings & other Structures in relation to Earthquakes (1973) does not have a specified return period. C is specified by type of ground and intensity zone in tabular form. For this comparison, Table 3 was referred to for flexible frames for Zone VII (Nairobi) and Hard/Medium ground assumed C = 0.5(0.05/T1/3 ) Once again, it is difficult to compare to the elastic UHRS 475 yr results as the Kenyan code is based on intensity (perception of damage) rather than acceleration and does not specify a return period. Response modification factors for difference structural types are not given so a factor of 3 has been used to scale up the design spectra. This would be an appropriate factor for a system with limited ductility such as an ordinary concrete moment frame. This comparison implies that the Kenya code may significantly underestimate the hazard for the short period range (T< 0.7 sec) for Nairobi. Kigali Building Regulations Manual (2009) from the Rwanda Ministry of Infrastructure (MININFRA) refers to BS EN 1998 Eurocode 8 using a return period of 475 yr. agR = 1.6 m/s2 (0.16 g) γI = 1.0 S= 1.0 for rock η= 1 for 5% damping The building regulations refer to the British version of Eurocode 8 but then specifies a different return period than in the UK Annex. No specific provisions of the Eurocode are given in the regulations. The regulations are capturing the hazard well for this example when compared to our UHRS results. CONCLUSIONS This paper has proposed a new seismic hazard model for the East African region. Though the model still requires further development (e.g. inclusion of specific faults etc) it shows that the existing seismic hazard models such as GSHAP underestimate the seismic hazard in many of the major cities in the region. A comparison of the seismic hazard against four local codes shows a similar situation, except for the more recent seismic codes for Uganda and Rwanda. Based on this preliminary study it would seem more appropriate to use a more modern code such as Eurocode 8 or ASCE 7 when undertaking new developments in the East African region.
  • 12.
    Z.Lubkowski, K. Coates,M. Villani, N. Jirouskova and M. Willis 12 REFERENCES Abrahamson, N. A. and W. Silva (2008). “Summary of the Abrahamson & Silva NGA Ground Motion Relations”, Earthquake Spectra, 24(1): 67-97. American Society of Civil Engineers, ASCE7-05 (2005) Minimum design Load for buildings and other structures. Bommer, JJ, Douglas, J; Scherbaum, F; Cotton, F; Bungum, H; Fah, D., (2010) “On the Selection of Ground-Motion Prediction Equations for Seismic Hazard Analysis”, Seismological Research Letters, 81(5): 783-793. Campbell, K. W. and Y. Bozorgnia (2008), “NGA Ground Motion Model for the Geometric Mean Horizontal Component of PGA, PGV, PGD and 5% Damped Linear Elastic Response Spectra for Periods Ranging from 0.01 to 10 s”, Earthquake Spectra, 24(1): 139-171. CEN (Comité Européen de Normalisation) (2004) Eurocode 8: Design of structures for earthquake resistance - Part 1: General rules, seismic actions and rules for buildings, Brussels, May. Code of Practice for the Design & Construction of Buildings & other Structures in relation to Earthquakes (1973).[KC1] Cornell, A.C. (1968), “Engineering seismic risk analysis”, Bulletin of the Seismological Society of America, 58: 1583-1606. Cotton, F., Scherbaum, F., Bommer, J.J., Bungum, H. (2006). “Criteria for selecting and adjusting ground-motion models for specific target regions: Application to central Europe and rock sites”, Journal of Seismology,10(2):137–156. Dauteuil, O., Bouffette, J. and Toteu, F. (2009). The changing faces of Africa. Elements of African geology. Commission for the Geological Map of the World (CCGM/CGMW). Ethiopia Building Code Standard (EBCS) 1995, Volume 8 Seismic, http://www.ethiopians.com/EBCS_8_95.htm Giardini, D., Grünthal, G., Shedlock, K. M. and Zhang, P.: The GSHAP Global Seismic Hazard Map. Annali di geofisica, 42(6): 1225-1230. Gutenberg, B., and Richter, C.F., (1956), "Magnitude and energy of earthquakes", Annals of Geophysics, 9: 1-15. Jonathan, E., 1996.”Some Aspects of Seismicity in Zimbabwe and Eastern and Southern Africa”, M.Sc. Thesis, Institute of Solid Earth Physics, University Bergen, Bergen, Norway, pp. 100. Kulkarni R.B., Youngs R.R., Coppersmuth K.J., (1984). "Assessment of Confidence Intervals for Results of Seismic Hazard Analysis", Proceedings of the 8th World Conference on Earthquake Engineering, San Francisco, CA, (July 21-28 1984) I: 263-270. Milesi J.P., Frizon de Lamotte D., de Kock G. and Toteu, F. (2010). Tectonic Map of Africa. 2nd Edition. Commission for the Geological Map of the World (CCGM/CGMW). Reiter, L. (1990), Earthquake Hazard Analysis: Issues and Insights, Columbia University Press, New York. Republic of Rwanda Ministry of Infrastructure, Rwanda Building Control Regulations 2009. Stepp, J.C. (1972), "Analysis of Completeness of the Earthquake Sample in the Puget Sound Area and its effects on Statistical Estimates of Earthquake Hazard", Proceedings of the International Conference on Micro-zonation for Safer Construction, Research and Application, Seattle. 2: 897-909. Thomas, P., Wong, I., and Abrahamson, N., (2010), Verification of Probabilistic Seismic Hazard Analysis Computer Programs, PEER Report 2010/106. Twesigomwe, E., 1997, “Probabilistic Seismic Hazard Assessment of Uganda”, Ph. D. Thesis, Dept.of Physics, Makarere University, Uganda. Uganda National Bureau of Standards (2003). Uganda Standard Seismic Code of Practice for Structural Designs,US319:2003. Weichert, D H. (1980). "Estimation of the earthquake recurrence parameters for unequal observation periods for different magnitudes". Bulletin of the Seismological Society of America, 70: 1337- 1346. Worku, A., (2011), “Recent developments in the definition of design earthquake ground motions calling for a revision of the current Ethiopian Seismic Code EBCS: 1995”. Zede, Journal of Ethiopian Engineers and Architects, Issue 28.