7 August Daily market report
•
0 likes•729 views

The QE index in Qatar declined 0.2% to close at 13,076.3, led by losses in the Industrials index. Medicare Group and Industries Qatar were the top losers. Islamic Holding Group and Qatari Investors Group were among the top gainers. Regional indices were mixed with Saudi Arabia and Bahrain rising while Oman declined.

Recommended
More Related Content
What's hot
What's hot (20)
Viewers also liked
Viewers also liked (20)
Similar to 7 August Daily market report
Similar to 7 August Daily market report (20)
More from QNB Group
More from QNB Group (20)
Recently uploaded
Recently uploaded (20)
7 August Daily market report
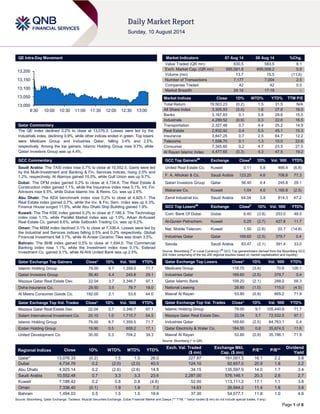
- 1. Page 1 of 6 QE Intra-Day Movement Qatar Commentary The QE index declined 0.2% to close at 13,076.3. Losses were led by the Industrials index, declining 0.9%, while other indices ended in green. Top losers were Medicare Group and Industries Qatar, falling 3.4% and 2.5%, respectively. Among the top gainers, Islamic Holding Group rose 9.7%, while Qatari Investors Group was up 4.4%. GCC Commentary Saudi Arabia: The TASI index rose 0.7% to close at 10,552.5. Gains were led by the Multi-Investment and Banking & Fin. Services indices, rising 2.0% and 1.2%, respectively. Al Alamiya gained 10.0%, while Gulf Union was up 9.7%. Dubai: The DFM index gained 0.2% to close at 4,734.8. The Real Estate & Construction index gained 1.1%, while the Insurance index rose 0.1%. Int. Fin. Advisors rose 6.5%, while Dubai Islamic Ins. & Reins. Co. was up 2.6%. Abu Dhabi: The ADX benchmark index rose 0.2% to close at 4,925.1. The Real Estate index gained 0.7%, while the Inv. & Fin. Serv. index was up 0.3%. Finance House surged 11.5%, while Abu Dhabi Ship Building gained 1.9%. Kuwait: The The KSE index gained 0.2% to close at 7,186.4. The Technology index rose 1.1%, while Parallel Market index was up 1.0%. Arkan Al-Kuwait Real Estate Co. gained 8.6%, while Salbookh Trading Co. was up 8.2%. Oman: The MSM index declined 0.1% to close at 7,336.4. Losses were led by the Industrial and Services indices falling 0.5% and 0.2% respectively. Global Financial Investment fell 3.7%, while Al Anwar Ceramic Tiles was down 3.5%. Bahrain: The BHB index gained 0.5% to close at 1,494.0. The Commercial Banking index rose 1.1%, while the Investment index rose 0.1%. Esterad Investment Co. gained 3.1%, while Al-Ahli United Bank was up 2.5%. Qatar Exchange Top Gainers Close* 1D% Vol. ‘000 YTD% Islamic Holding Group 79.00 9.7 1,359.5 71.7 Qatari Investors Group 56.40 4.4 245.8 29.1 Mazaya Qatar Real Estate Dev. 22.04 3.7 3,346.7 97.1 Doha Insurance Co. 29.50 3.5 79.7 18.0 Al Meera Consumer Goods Co. 192.00 2.1 53.6 44.0 Qatar Exchange Top Vol. Trades Close* 1D% Vol. ‘000 YTD% Mazaya Qatar Real Estate Dev. 22.04 3.7 3,346.7 97.1 Salam International Investment Co. 20.10 1.0 1,715.7 54.5 Islamic Holding Group 79.00 9.7 1,359.5 71.7 Ezdan Holding Group 19.90 0.5 808.2 17.1 United Development Co. 30.00 0.3 704.2 39.3 Market Indicators 07 Aug 14 06 Aug 14 %Chg. Value Traded (QR mn) 630.5 583.5 8.1 Exch. Market Cap. (QR mn) 695,561.8 695,508.2 0.0 Volume (mn) 13.7 15.5 (11.5) Number of Transactions 7,177 7,004 2.5 Companies Traded 42 42 0.0 Market Breadth 24:14 17:19 – Market Indices Close 1D% WTD% YTD% TTM P/E Total Return 19,503.23 (0.2) 1.5 31.5 N/A All Share Index 3,305.93 (0.0) 1.6 27.8 16.0 Banks 3,167.83 0.1 0.8 29.6 15.5 Industrials 4,289.52 (0.9) 0.3 22.6 16.5 Transportation 2,327.48 0.7 4.4 25.2 14.9 Real Estate 2,832.92 0.4 5.5 45.1 15.3 Insurance 3,847.25 0.7 2.5 64.7 12.2 Telecoms 1,598.70 0.1 1.3 10.0 22.6 Consumer 7,345.60 0.2 4.7 23.5 27.5 Al Rayan Islamic Index 4,477.65 (0.3) 4.3 47.5 19.2 GCC Top Gainers## Exchange Close# 1D% Vol. ‘000 YTD% United Real Estate Co. Kuwait 0.11 5.8 466.4 (6.8) F. A. Alhokair & Co. Saudi Arabia 123.20 4.6 706.6 77.3 Qatari Investors Group Qatar 56.40 4.4 245.8 29.1 Mabanee Co. Kuwait 1.04 4.0 1,165.8 (2.5) Zamil Industrial Inv. Saudi Arabia 64.04 3.8 814.3 47.2 GCC Top Losers## Exchange Close# 1D% Vol. ‘000 YTD% Com. Bank Of Dubai Dubai 6.40 (3.8) 253.0 48.5 Al-Qurain Petrochem. Kuwait 0.25 (2.7) 427.8 11.7 Nat. Mobile Telecom. Kuwait 1.50 (2.6) 20.7 (14.8) Industries Qatar Qatar 169.60 (2.5) 379.7 0.4 Savola Saudi Arabia 83.47 (2.1) 391.4 33.0 Source: Bloomberg ( # in Local Currency) ( ## GCC Top gainers/losers derived from the Bloomberg GCC 200 Index comprising of the top 200 regional equities based on market capitalization and liquidity) Qatar Exchange Top Losers Close* 1D% Vol. ‘000 YTD% Medicare Group 118.70 (3.4) 70.6 126.1 Industries Qatar 169.60 (2.5) 379.7 0.4 Qatar Islamic Bank 109.20 (2.1) 288.0 58.3 National Leasing 28.80 (1.0) 115.0 (4.5) Masraf Al Rayan 53.80 (0.9) 665.2 71.9 Qatar Exchange Top Val. Trades Close* 1D% Val. ‘000 YTD% Islamic Holding Group 79.00 9.7 105,440.8 71.7 Mazaya Qatar Real Estate Dev. 22.04 3.7 72,532.5 97.1 Industries Qatar 169.60 (2.5) 64,763.1 0.4 Qatar Electricity & Water Co. 184.50 0.8 35,874.5 11.6 Masraf Al Rayan 53.80 (0.9) 35,786.1 71.9 Source: Bloomberg (* in QR) Regional Indices Close 1D% WTD% MTD% YTD% Exch. Val. Traded ($ mn) Exchange Mkt. Cap. ($ mn) P/E** P/B** Dividend Yield Qatar* 13,076.33 (0.2) 1.5 1.5 26.0 227.87 191,001.3 16.1 2.2 3.8 Dubai 4,734.76 0.2 (2.0) (2.0) 40.5 124.10 92,657.0 20.9 1.8 2.2 Abu Dhabi 4,925.14 0.2 (2.6) (2.6) 14.8 34.15 135,597.9 14.0 1.7 3.4 Saudi Arabia 10,552.48 0.7 3.3 3.3 23.6 2,287.00 576,146.1 20.3 2.6 2.7 Kuwait 7,186.42 0.2 0.8 0.8 (4.8) 52.00 113,111.2 17.1 1.1 3.8 Oman 7,336.40 (0.1) 1.9 1.9 7.3 14.63 26,944.2 11.4 1.8 3.8 Bahrain 1,494.03 0.5 1.5 1.5 19.6 37.30 54,577.1 11.8 1.0 4.6 Source: Bloomberg, Qatar Exchange, Tadawul, Muscat Securities Exchange, Dubai Financial Market and Zawya (** TTM; * Value traded ($ mn) do not include special trades, if any) 13,000 13,050 13,100 13,150 13,200 9:30 10:00 10:30 11:00 11:30 12:00 12:30 13:00
- 2. Page 2 of 6 Qatar Market Commentary The QE index declined 0.2% to close at 13,076.33. The Industrials index led the losses. The index fell on the back of selling pressure from Qatari shareholders despite buying support from non-Qatari shareholders. Medicare Group and Industries Qatar were the top losers, falling 3.4% and 2.5%, respectively. Among the top gainers, Islamic Holding Group rose 9.7%, while Qatari Investors Group was up 4.4%. Volume of shares traded on Thursday fell by 11.5% to 13.7mn from 15.5mn on Wednesday. Further, as compared to the 30-day moving average of 15.0mn, volume for the day was 8.5% lower. Mazaya Qatar Real Estate Dev. and Salam International Investment Co. were the most active stocks, contributing 24.5% and 12.5% to the total volume respectively. Source: Qatar Exchange (* as a % of traded value) Ratings, Earnings and Global Economic Data Ratings Updates Company Agency Market Type* Old Rating New Rating Rating Change Outlook Outlook Change Oman Insurance Company (OIC) AM Best Dubai FSR/ICR A/a A/a – Stable – Source: News reports (* LT – Long Term, ST – Short Term, FSR- Financial Strength Rating, FCR – Foreign Credit Rating, LCR – Local Currency Rating, IDR – Issuer Default Rating, SR – Support Rating, LC – Local Currency, ICR – Issuer Credit Rating) Earnings Releases Company Market Currency Revenue (mn)2Q2014 % Change YoY Operating Profit (mn) 2Q2014 % Change YoY Net Profit (mn) 2Q2014 % Change YoY Alliance Insurance Dubai AED – – 1.9 -65.3% 9.4 -23.7% Air Arabia Dubai AED 915.0 NA – – 173.0 127.6% Emirates Insurance Co. (EIC) Abu Dhabi AED 220.5 15.8% 8.1 0.1% 40.4 85.5% Sharjah Cement & Industrial Development Co. (SCIDC) Abu Dhabi AED 206.9 33.8% – – 22.2 148.2% Arab Insurance Group (ARIG) Bahrain USD 29.5 -33.3% 0.0 -99.4% 1.9 -36.7% Source: Company data, DFM, ADX, MSM Global Economic Data Date Market Source Indicator Period Actual Consensus Previous 08/07 US Bloomberg Bloomberg Consumer Comfort 3 August 36.2 – 36.3 08/07 US MBA Mortgage Delinquencies 2Q2014 6.04% – 6.11% 08/07 US MBA MBA Mortgage Foreclosures 2Q2014 2.49% – 2.65% 08/07 US Federal Reserve Consumer Credit June $17.255B $18.650B $19.642B 08/08 US BLS Nonfarm Productivity 2Q2014 2.50% 1.60% -4.50% 08/08 US US Census Bureau Wholesale Inventories MoM June 0.30% 0.70% 0.30% 08/08 US US Census Bureau Wholesale Trade Sales MoM June 0.20% 0.70% 0.70% 08/07 EU European Central Bank ECB Main Refinancing Rate 7 August 0.15% 0.15% 0.15% 08/07 EU European Central Bank ECB Marginal Lending Facility 7 August 0.40% 0.40% 0.40% 08/07 EU European Central Bank ECB Deposit Facility Rate 7 August -0.10% -0.10% -0.10% 08/07 France Banque De France Bank of France Bus. Sentiment July 96.0 97.0 97.0 08/07 France INSEE Industrial Production MoM June 1.30% 1.00% -1.60% 08/07 France INSEE Industrial Production YoY June -0.40% -1.80% -3.40% 08/07 France INSEE Manufacturing Production MoM June 1.60% 1.50% -2.30% 08/07 France INSEE Manufacturing Production YoY June 0.10% -1.10% -2.60% 08/07 France Ministry of the Economy Budget Balance YTD June -59.4B – -64.3B 08/07 Germany Destatis Trade Balance June 16.5B 18.9B 17.8B 08/07 Germany Destatis Current Account Balance June 15.0B 18.5B 12.2B 08/07 Germany Deutsche Bundesbank Exports SA MoM June 0.90% 0.80% -1.10% 08/07 Germany Deutsche Bundesbank Imports SA MoM June 4.50% 1.00% -3.40% 08/07 UK Bank of England Bank of England Bank Rate 7 August 0.50% 0.50% 0.50% 08/07 UK Bank of England BOE Asset Purchase Target August 375B 375B 375B 08/08 UK ONS Visible Trade Balance GBP/Mn June -£9413 -£8900 -£9150 08/08 UK ONS Trade Balance Non EU GBP/Mn June -£3841 -£3700 -£4079 Overall Activity Buy %* Sell %* Net (QR) Qatari 66.84% 70.49% (23,079,430.73) Non-Qatari 33.17% 29.51% 23,079,430.73
- 3. Page 3 of 6 08/08 UK ONS Trade Balance June -£2459 -£2050 -£2364 08/08 UK ONS Construction Output SA MoM June 1.20% 1.00% -1.20% 08/08 UK ONS Construction Output SA YoY June 5.30% 4.70% 3.90% 08/07 Spain INE Industrial Output NSA YoY June 2.90% – 0.60% 08/07 Spain INE Industrial Output SA YoY June 0.80% 2.70% 2.50% 08/07 China NBS Exports YoY July 14.50% 7.00% 7.20% 08/07 China NBS Imports YoY July -1.60% 2.60% 5.50% 08/08 China NBS PPI YoY July -0.90% -0.90% -1.10% 08/08 China NBS CPI YoY July 2.30% 2.30% 2.30% 08/07 Japan Bank of Japan Housing Loans YoY 2Q2014 2.70% – 2.90% 08/07 Japan ESRI Eco Watchers Survey Current July 51.3 48.5 47.7 08/07 Japan ESRI Eco Watchers Survey Outlook July 51.5 – 53.3 Source: Bloomberg (s.a. = seasonally adjusted; n.s.a. = non-seasonally adjusted; w.d.a. = working day adjusted) News Qatar Turkey’s Bank Asya says deal with QIBK ends – Turkey's Bank Asya has announced that an exclusive deal with Qatar Islamic Bank (QIBK) to acquire a stake in the Turkish lender was annulled, paving the way for alternative suitors. Earlier this year, Bank Asya attempted to form a partnership with QIB but had ended the talks after a disagreement over price. The exclusivity deal, under which Bank Asya could not pursue an offer from another potential buyer, was terminated as of August 8, 2014 so that it could receive formal bids from Turkish investors. (Reuters) MCCS reports QR164.9mn net profit in 2Q2014, up 9.9% QoQ – Mannai Corporation (MCCS) reported a net profit of QR164.9mn in 2Q2014, indicating a QoQ and YoY increase of 9.9% and 53.7%, respectively. EPS grew to QR6.91 in 1H2014 as against QR4.25 reported in 1H2013, supported by the acquisition of the minority interests in its Damas subsidiary. Accordingly the group’s share of profit increased from QR150.1mn to QR164.9mn. Despite a marginal drop in revenue, MCCS reported an impressive growth in profit, which included successful recoveries of doubtful debts, which were provisioned in previous years. Continuing its conservative provisioning policy, the company also made provisions against future doubtful asset values. Further, overseas investments contributed significantly to MCCS’ earnings thereby enabling it to achieve growth in profits. (Peninsula Qatar, QE) QCFS posts QR1.7mn net profit in 2Q2014 – Qatar Cinema & Film Distribution (QCFS) posted a lower net profit despite a higher operating income on a QoQ basis in 2Q2014. QCFS reported a net profit of QR1.7mn in 2Q2014 as compared to QR4.2mn in 1Q2014. The Company’s EPS amounted to QR1.04 in 1H2014 verses QR0.99 in 1H2013. Meanwhile, the company’s operating income declined 15.5% YoY to QR3.5mn in 2Q2014 (+14.9% QoQ). (Gulf-Times.com) Investors in real estate eyeing Doha outskirts – With project work of Doha Metro rail picking up, real estate investors are increasingly looking to invest in the outskirts of the city, the areas covering an estimated over 100 kilometer network. There is a growing appetite to invest money in the interiors like Al Shamal, Al Khaisa, Umm Salal and Al Kharaitiyat. Work on the metro project is progressing fast. Simultaneously, the government is investing huge amount of money in the interiors to develop infrastructure facilities with the support of concerned municipal authorities. The civic bodies have also set aside enough money in their annual budgets to expand public service facilities in their areas, adding incentives for investors. Non- availability of vacant plots in Doha and the prospects of future development in the areas covering the rail network have pushed up demand in Doha’s interiors. (Peninsula Qatar) International US productivity bounce-back keeps wage pressures tame – Productivity at US nonfarm businesses rebounded strongly in the second quarter, putting a lid on wage pressures and giving the Federal Reserve room to keep interest rates low for a while. The Labor Department said productivity increased at a 2.5% annual rate after contracting at a revised 4.5% pace in the first quarter. The first quarter's drop was the sharpest since the fourth quarter of 1981. The bounce back kept labor-related production costs in check. They had surged at the start of the year as an unusually cold winter depressed output. Unit labor costs, the price of labor for any given unit of production, rose at a 0.6% rate, braking sharply from an upwardly revised 11.8% pace in the first quarter. (Reuters) Acadata: UK house prices rise to record as sales surge – According to Acadata, UK home prices rose to a record last month as sales reached the highest in seven years. Values rose 0.6% from June and were up 9.9% compared with a year earlier, pushing the average price to £270,636. About 90,000 properties were sold, marking a 21% surge over the past year. While the report adds to evidence of a booming property market, Acadata said the national picture is being skewed by London and the south east. Other reports have indicated the market is cooling after stricter lending rules were introduced this year, and Bank of England Deputy Governor Ben Broadbent said last month that the “edge is coming off” UK housing. (Bloomberg) Draghi takes aim at Italy as recession scars Euro area – Mario Draghi said that Italy can only blame itself for its third recession since 2008. The European Central Bank president singled out his country’s lack of structural reform after data showed the Euro-area’s third-biggest economy unexpectedly contracted last quarter. The comments in Draghi’s monthly press conference came a day before Italian Prime Minister Matteo Renzi won a key vote in his drive to remake the country’s political system. The remarks on his homeland are blunter than normal, adding to the contrast with countries such as Spain that have engaged in more structural adjustments. They increase pressure on Renzi to turn around an economy that threatens the 18-nation Euro area’s nascent revival. (Bloomberg) Draghi says Ukraine crisis a risk to the Eurozone – European Central Bank President Mario Draghi said the crisis in Ukraine represents a risk to the Euro zone economy, although the likely impact of European sanctions on Russia and retaliatory measures is uncertain. The European Union has imposed sanctions targeting Russia's banking, defense and energy sectors because of Moscow's support for pro-Russian separatists in eastern Ukraine, while Russia has banned fruit and vegetable imports from the European Union. Draghi said it was hard to assess the likely impact of a crisis at the beginning,
- 4. Page 4 of 6 adding that "if one looks at the figures for trade or financial flows, they would by and large reveal a picture of very limited interconnections". He said only a handful of major European financial institutions were especially exposed to Russia. He further added that however, it's very hard to assess what the actual impact is going to be once sanctions on one side and counter-sanctions on the other side are going to be undertaken. (Reuters) BOJ holds stimulus as weaker economy challenges Kuroda – The Bank of Japan (BOJ) maintained record stimulus after recent production and export data highlighted weakness that could challenge Governor Haruhiko Kuroda’s push to stoke faster inflation. BOJ said that it stuck with a pledge to increase the monetary base at an annual pace of 60tn Yen to 70tn Yen, as forecast by all 34 economists surveyed by Bloomberg News. The BOJ cited “some weakness” in exports and production, striking a note of concern about the strength of the world’s third- biggest economy. Outbound shipments unexpectedly fell in June, while output slumped the most in more than three years as retail sales dropped, showing an economy struggling to rebound from a sales-tax increase last quarter. (Bloomberg) China reports record trade surplus; Inflation remains below annual target – China’s trade surplus surged to a record in July as export growth unexpectedly accelerated and imports fell, suggesting the US and European recoveries will help sustain expansion in the world’s second-largest economy. The Beijing- based customs administration said overseas shipments increased 14.5% from a year earlier, beating all estimates in a Bloomberg News survey that had a median projection of 7%. Imports dropped 1.6%, leaving a trade surplus of $47.3bn, bigger than all analyst estimates. Sales to the biggest markets of the US and Europe surged, indicating strength in demand that will reduce pressure on Premier Li Keqiang to expand stimulus in the second half to bolster growth. The report contrasts with the International Monetary Fund’s estimate last month of a slowdown in the US economy that accompanied a cut in its global growth outlook. Meanwhile, China’s consumer inflation remained below the government’s goal in July and factory-gate deflation persisted, suggesting policy makers still have room for monetary easing amid a lack of pressure on prices. The National Bureau of Statistics said the consumer price index rose 2.3% from a year earlier, the same pace as in June and also the median estimate in a Bloomberg News survey. Factory-gate prices fell 0.9%, matching projections and extending the longest stretch of declines since 1999. (Bloomberg) Regional OPEC sees lower 2014 oil demand growth, pumps more – OPEC trimmed its 2014 global oil demand growth forecast for a second consecutive month and said the group managed to increase output in July despite violence in Iraq and Libya, pointing to more comfortable global supplies. The OPEC trimmed its projection for growth in global demand in 2014 to 1.10mn bpd, down 30,000 bpd, citing weaker-than-expected US demand. OPEC said that the slow and uneven global recovery continues. In 2014, US oil demand remains strongly dependent on the development of the US economy; however the risk is skewed to the downside compared to the previous month. OPEC’s report points to even less pressure on supplies in 2015 as partly due to the US shale boom the need for OPEC crude will fall, despite faster growth in global demand. The report made no change to 2015’s global demand forecast. OPEC said that in 2014, the lower demand forecast and a higher expectation for non-Opec supply will reduce the forecast global demand for Opec crude to 29.61mn bpd, down 70,000 bpd from the previous estimate. It left next year’s forecast unchanged at 29.36mn bpd. The report also showed OPEC’s crude output in July rose. Opec said that world oil demand will rise by 1.21mn bpd in 2015, unchanged from last month. Opec trimmed its forecast of next year’s growth in non-Opec supply by about 40,000 bpd but still expects an expansion of 1.27mn bpd, with the US leading the way. (Gulf-Times.com) IATA: Middle East airlines post 10.8% passenger growth in June 2014 – According to the International Air Transport Association (IATA), passenger demand among Middle East carriers increased 10.8% in June 2014. The capacity among Mideast carriers increased 5.9% in June 2014, while the load factor rose 3.7% points to 82.1%. Middle East carriers have recorded a 13.9% surge in passenger demand for the six months ending June 30, 2014. Globally, total revenue passenger kilometres (RPKs), a measurement for the number of passengers carried, rose 4.7% in June 2014. The figures for the month of June were down on May 2014’s 6.2% growth. IATA said the capacity across global airlines increased by 5%, which saw load factor slip 0.2% points to 81.5%. (GulfBase.com) Jordan cancels 400MW solar and wind tender – According to Jordan Times, Jordan’s Ministry of Energy and Mineral Resources has cancelled a procurement round for four 100 megawatt (MW) renewable energy projects. The process was open to wind and solar developments, but a statement on the ministry’s website has confirmed that the process has now been cancelled. According to the newspaper, Energy minister Mohammad Hamed said a request to the Gulf Cooperation Council (UAE, Saudi Arabia, Kuwait, Qatar, Oman and Bahrain) for a grid improvement grant had been rejected. (Bloomberg) Vela vessel transferred to Bahri's ownership – National Shipping Company of Saudi Arabia (Bahri) announced that Capricorn Star, one of the VLCC vessels in the Vela fleet, was transferred to Bahri's ownership on August 7, 2014 and its name was changed to Lulu. The remaining Vela vessels shall be transferred to Bahri on a staggered basis according to an agreed upon vessel delivery schedule with Vela and is expected to be completed by 2014-end. (Tadawul) SAMA approves AXA’s product sales via website – The Saudi Arabian Monetary Agency (SAMA) has approved electronic sales of AXA Cooperative Insurance Company’s (AXA) insurance products via the company's website. The products include travel insurance, motor insurance and personal accident. (Tadawul) SRO awards SR391.5mn rail track-doubling contract – Saudi Railways Organization (SRO) has signed a SR391.5mn contract with a Saudi Arabian contractor for the first phase of track- doubling on the Riyadh-Harad-Dammam freight-only line. The contract involves doubling a 214-kilometer section of the line from Hofuf to Harad, and is expected to be completed in two years. The scope of work includes reconstruction of bridges, and provision of signaling & telecommunications to enable use of the line by both freight and passenger trains. (GulfBase.com) KACST: Saudi Arabia’s petrochemical income to rise five times – King Abdulaziz City for Science and Technology’s (KACST) specialists in the field of petrochemical technology confirmed that a Saudi team has achieved a scientific discovery by inventing a new type of polymer plastics for the production of poly material, which will support the development of the petrochemical industry in Saudi Arabia, which is expected to double its income five times in 2015. (GulfBase.com) Jeddah Metro to be ready by 2022 – The Jeddah Metro, which is expected to cost SR45bn, will be ready by 2022. The CEO of the metro company, Osama Ibrahim Abdu, said the new metro
- 5. Page 5 of 6 project aims to cover 30% of the city’s traffic, and reduce traffic congestion in the business city. (GulfBase.com) VTB provides $100mn loan to Dar Al Arkan – Russia-based VTB Group has provided a $100mn margin loan to Saudi Arabia-based Dar Al Arkan Real Estate Development Company. (Reuters) Air Arabia unveils second Turkish destination – Sharjah- based low-cost airline Air Arabia has announced the start of its non-stop services to the city of Antalya, on the Mediterranean coast, in the South West of Turkey. The new service marks the airline’s second destination in Turkey and 97th worldwide. Starting July 29, 2014, Air Arabia will operate three weekly flights to Antalya, making it a convenient holiday destination for passengers travelling from the UAE. (GulfBase.com) TRA: UAE telecom sector earns AED29.18bn in 2013 – According to the Telecommunications Regulatory Authority’s (TRA) annual sector review, the UAE’s telecommunications sector reported a 6.57% increase in revenue to AED29.18bn in 2013 as compared to AED27.38 billion in 2012, fueled mainly by growth in mobile services. Postpaid subscriptions accounted for 13% of the total mobile subscriptions in 2013. The fall in penetration levels between 2011 and 2012 was due to changes in the population estimates for the UAE. The report said that the number of residential fixed telephone lines increased by nine per cent between 2012 and 2013 to over 2.08mn, while the number of business lines rose by two per cent. The fixed line penetration rate stood at 25% in 2013. (GulfBase.com) USDC: UAE and US total trade hits $11.67bn in 1H2014 – According to the United States Departments of Commerce (USDC), the total trade between UAE and the US dropped by around 22% to $11.67bn in 1H2014 as compared to $14.92bn in 1H2013. UAE imports from the US fell by around 23% to $10.41bn in 1H2014 as compared to $13.52bn in 1H2013, while the UAE’s exports to the US fell by around 9% to $1.27bn in 1H2014 as compared to $1.4bn in 1H2013. By this, the deficit of the UAE’s balance of trade with the US dropped by around 25% from $12.12bn in 1H2013 to $9.14bn in 1H2014. (GulfBase.com) Amlak agrees $2.7bn debt deal with creditors – Amlak Finance has agreed to a $2.7 billion debt restructuring that may pave the way for its shares to resume trading after they were suspended in 2008. Under the terms of the agreement, the company will make an initial payment of $545mn to lenders. The remaining debt will be repaid over a period of 12 years. Also as part of the restructuring, financiers will exchange AED1.4bn of their original debt for a convertible instrument that Amlak plans to repay from gains by selling real estate assets. (Bloomberg) Meraas plans IPO – According to sources, Dubai government- owned property developer Meraas Holding is considering an IPO as the regional real-estate market continues its rapid recovery from the financial crisis. (GulfBase.com) Etihad to buy 49% stake in Alitalia – Etihad Airways is investing €560mn and taking a 49% stake in Alitalia after 12 months of negotiations. Etihad is spending €387.5mn on the equity stake, €60mn on buying five London Heathrow slots off Alitalia and a further €112.5mn to acquire 75% of Alitalia’s frequent-flyer program. The Heathrow slots will be leased back to Alitalia. The transaction is due to be completed on December 31, 2014. Apart from Etihad’s investment existing core investors have approved a €300mn capital increase, and Italian financial institutions will supply the same amount in new loans. Some €598mn of short- and medium-term debt will also be restructured. (GulfBase.com, Bloomberg) TAQA suspends activities in Kurdistan block due to instability – Abu Dhabi National Energy Company (TAQA) has suspended its activities at the Atrush Block in Kurdistan due to the instability prevailing in the region. The TAQA-operated Atrush Block, which is located 85 kilometer northwest of Arbil, Iraq's Kurdish capital, is expected to initially produce approximately 30,000 barrels of oil per day (bpd) with first oil expected by early 2015. (Reuters) Etisalat Nigeria to sell and lease back 2,136 towers to IHS Holding – Etisalat Nigeria, an affiliate of Emirates Telecommunications Corporation, said it would sell 2,136 of its towers to Nigeria's IHS Holding and lease them back as part of plans to expand its coverage in the country. Under the terms of the agreement, IHS has committed to invest a further $100mn in the towers, on areas such as advanced generators and efficient batteries. The deal will leave IHS owning and managing over 6,540 towers in Nigeria. The deal is reportedly expected to close later in 2014. (Reuters) Dana Gas to recover overdue Egypt payments by 2018 – Dana Gas is expecting to recover the vast majority of overdue payments which the Egyptian government owes it by 2018. The company is putting in place a new arrangement with the government that will permit it to invest in new Egyptian wells and redevelop existing wells. The new arrangement in Egypt will result in increased production from Dana’s operations there. It will take all the additional condensate production and sell it on the international market, using revenues from those sales to pay down overdue receivables. (GulBase.com) NCSI: 170% jump in visitors to Salalah – According to the National Centre for Statistics and Information (NCSI), the number of visitors to Salalah during the Khareef Season has grown by 170% – it stood at 203,171 visitors from June 21, 2014 through August 6, 2014, as compared to 75,262 visitors during the same period in 2013. According to the updated figures, 58,048 visitors flew to Salalah, with 51,235 on domestic flights and 6,813 on international flights, while the total number of visitors travelling to the Dhofar region by road stood at 145,123. The NCSI revealed that the majority of visitors were GCC citizens, totaling 178,131, with 46,458 arriving via the airport, 41,235 domestically and 5,223 internationally, while 131,673 visitors arrived by road. (Bloomberg) ASBB reports net profit of BHD8.17mn in 1H2014 – Al Salam Bank-Bahrain (ASBB) reported net profit of BHD8.17mn in 1H2014 as compared to BHD6.02mn in 1H2013. The net profit for 2Q2014 was BHD4.15mn as against BHD2.97mn in 2Q2013. The operating income for 1H2014 was BHD34.15mn as compared to BHD21.17mn in 1H2013. EPS for 1H2014 amounted to 4.6 fils as against 4 fils during 1H2013. ASBB’s total assets as of June 30, 2014 stood at BHD1.96bn as compared to BHD1.09bn as of December 31, 2013. (DFM) EIU: Bahrain’s food import costs set to hit $1bn – According to London-based Economic Intelligence Unit (EIU), food import costs are expected to top the $1bn mark for the first time in Bahrain in 2014 as the country increases its reliance on imported goods. Bahrain is expected to spend an additional $100mn on food every year from now until 2020 when the import bill is forecasted to hit $1.6bn. (GulfBase.com)
- 6. Contacts Saugata Sarkar Abdullah Amin, CFA Shahan Keushgerian Head of Research Senior Research Analyst Senior Research Analyst Tel: (+974) 4476 6534 Tel: (+974) 4476 6569 Tel: (+974) 4476 6509 saugata.sarkar@qnbfs.com.qa abdullah.amin@qnbfs.com.qa shahan.keushgerian@qnbfs.com.qa Sahbi Kasraoui Ahmed Al-Khoudary QNB Financial Services SPC Manager – HNWI Head of Sales Trading – Institutional Contact Center: (+974) 4476 6666 Tel: (+974) 4476 6544 Tel: (+974) 4476 6548 PO Box 24025 sahbi.alkasraoui@qnbfs.com.qa ahmed.alkhoudary@qnbfs.com.qa Doha, Qatar DISCLAIMER: This publication has been prepared by QNB Financial Services SPC (“QNBFS”) a wholly-owned subsidiary of Qatar National Bank (“QNB”). QNBFS is regulated by the Qatar Financial Markets Authority and the Qatar Exchange; QNB is regulated by the Qatar Central Bank. This publication expresses the views and opinions of QNBFS at a given time only. It is not an offer, promotion or recommendation to buy or sell securities or other investments, nor is it intended to constitute legal, tax, accounting, or financial advice. We therefore strongly advise potential investors to seek independent professional advice before making any investment decision. Although the information in this report has been obtained from sources that QNBFS believes to be reliable, we have not independently verified such information and it may not be accurate or complete. While this publication has been prepared with the utmost degree of care by our analysts, QNBFS does not make any representations or warranties as to the accuracy and completeness of the information it may contain, and declines any liability in that respect. QNBFS reserves the right to amend the views and opinions expressed in this publication at any time. It may also express viewpoints or make investment decisions that differ significantly from, or even contradict, the views and opinions included in this report. COPYRIGHT: No part of this document may be reproduced without the explicit written permission of QNBFS. Page 6 of 6 Rebased Performance Daily Index Performance Source: Bloomberg Source: Bloomberg Source: Bloomberg Source: Bloomberg 80.0 90.0 100.0 110.0 120.0 130.0 140.0 150.0 160.0 170.0 180.0 190.0 200.0 210.0 Jul-10 Jul-11 Jul-12 Jul-13 Jul-14 QE Index S&P Pan Arab S&P GCC 0.7% (0.2%) 0.2% 0.5% (0.1%) 0.2% 0.2% (0.4%) (0.2%) 0.0% 0.2% 0.4% 0.6% 0.8% SaudiArabia Qatar Kuwait Bahrain Oman AbuDhabi Dubai Asset/Currency Performance Close ($) 1D% WTD% YTD% Global Indices Performance Close 1D% WTD% YTD% Gold/Ounce 1,310.95 (0.1) 1.4 8.7 DJ Industrial 16,553.93 1.1 0.4 (0.1) Silver/Ounce 19.89 (0.3) (2.1) 2.2 S&P 500 1,931.59 1.2 0.3 4.5 Crude Oil (Brent)/Barrel (FM Future) 105.02 (0.4) 0.2 (5.2) NASDAQ 100 4,370.90 0.8 0.4 4.7 Natural Gas (Henry Hub)/MMBtu 3.91 (1.3) 4.4 (9.9) STOXX 600 324.91 (0.6) (2.1) (1.0) LPG Propane (Arab Gulf)/Ton 102.50 0.9 2.1 (18.8) DAX 9,009.32 (0.3) (2.2) (5.7) LPG Butane (Arab Gulf)/Ton 118.63 0.6 2.5 (13.1) FTSE 100 6,567.36 (0.5) (1.7) (2.7) Euro 1.34 0.3 (0.1) (2.4) CAC 40 4,147.81 (0.0) (1.3) (3.4) Yen 102.04 (0.1) (0.6) (3.1) Nikkei 14,778.37 (3.0) (4.8) (9.3) GBP 1.68 (0.4) (0.3) 1.3 MSCI EM 1,045.51 (0.5) (1.4) 4.3 CHF 1.10 0.4 0.1 (1.4) SHANGHAI SE Composite 2,194.43 0.3 0.4 3.7 AUD 0.93 0.0 (0.4) 4.0 HANG SENG 24,331.41 (0.2) (0.8) 4.4 USD Index 81.39 (0.2) 0.1 1.7 BSE SENSEX 25,329.14 (1.0) (0.6) 19.6 RUB 36.18 (0.4) 1.1 10.1 Bovespa 55,572.93 (1.1) (0.6) 7.9 BRL 0.44 0.5 (1.1) 3.5 RTS 1,170.60 1.1 (3.5) (18.9) 187.9 161.3 145.4