73549-financial analysis powerpoint.pptx
•Download as PPTX, PDF•
0 likes•2 views
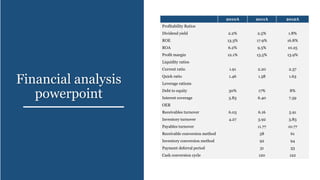
This financial analysis document shows various profitability, liquidity, and leverage ratios for a company over the years 2010-2012. The ratios indicate the company's profitability increased from 2010 to 2012 as profit margin, ROE, and ROA ratios rose each year. Liquidity also improved as current and quick ratios increased. Leverage decreased as debt to equity fell from 30% in 2010 to 8% in 2012. Inventory and receivables turnover declined slightly from 2010 to 2012 while payables turnover decreased more sharply.
Report
Share
Report
Share
Recommended
SCM Case- Barilla Spa section operations case study
The document summarizes Barilla's Just-In-Time Distribution (JITD) program. It discusses that the program aimed to address issues like fluctuating demand, inventory imbalance, and high costs caused by inefficient inventory management. It provides benefits of JITD like efficient demand fulfillment and cost reduction, but also drawbacks around data requirements, demand prediction challenges, and resistance from teams. It then analyzes potential conflicts the program could create and strategies to address them. Finally, it discusses perspectives of a Barilla customer on the program and whether JITD would be feasible and effective in Barilla's 1990 context.
Moduel 2 Readings.pptx
This document discusses strategies for managing differences in global expansion using the AAA framework of adaptation, aggregation, and arbitrage.
It explains that the central challenge for global managers is balancing local responsiveness through adaptation with global integration through aggregation. Firms must consider whether to pursue economies of scale through global or regional operations or boost local performance through adaptation. Managing differences across borders involves exploiting differences through arbitrage opportunities.
The document cautions against solely pursuing any single AAA strategy. Adaptation increases costs but improves local fit, while aggregation achieves scale but risks mismatches. Arbitrage provides quick gains but differences can erode over time. An effective strategy balances these factors based on the tensions between them in a given industry and competitive environment
financial instruments.pptx
The document discusses financial instruments and their accounting treatment under IndAS 32 and IndAS 109. It defines key terms like financial assets, financial liabilities, equity instruments, and compound financial instruments. It explains the different measurement bases of financial assets and liabilities, including amortized cost, fair value through profit or loss, and fair value through other comprehensive income. It provides examples of accounting for financial instruments under the different measurement bases, including the treatment of gains and losses. It also discusses share-based payments under IndAS 102.
Session 3-4 CB.pptx
This document discusses consumer perception and the key dynamics that influence how consumers perceive and interpret reality. It covers topics like absolute threshold, just noticeable difference (JND), subliminal perception, and perceptual mapping. The key points are:
1) Perception is how consumers are aware of and interpret reality based on their selection, organization, and interpretation of stimuli.
2) Dynamics like absolute threshold, JND, and Weber's Law influence how consumers detect differences between stimuli. Marketers must understand these to ensure product changes or improvements are discernible.
3) Perceptual mapping is a technique that graphs consumer perceptions of product attributes to position brands.
9781292145150_pp07.ppt
The document discusses business strategy and competitive models. It introduces Porter's generic strategies of cost leadership, differentiation, and focus. It also discusses hybrid strategies, the strategy clock, hypercompetitive environments, cooperative strategies, game theory, and business models. Business strategy aims to achieve competitive advantage at the business unit level through these various strategic approaches.
Chap002t.ppt
The document describes three classic applications of linear programming (LP):
1) A plywood company used LP to determine the optimal product mix, increasing profits by 20%.
2) An airline used LP to design employee work schedules most efficiently, saving $6 million annually.
3) An oil company used LP to coordinate supply, distribution, and marketing, reducing inventory and adding $14 million to profits.
2024 State of Marketing Report – by Hubspot
https://www.hubspot.com/state-of-marketing
· Scaling relationships and proving ROI
· Social media is the place for search, sales, and service
· Authentic influencer partnerships fuel brand growth
· The strongest connections happen via call, click, chat, and camera.
· Time saved with AI leads to more creative work
· Seeking: A single source of truth
· TLDR; Get on social, try AI, and align your systems.
· More human marketing, powered by robots
Everything You Need To Know About ChatGPT
ChatGPT is a revolutionary addition to the world since its introduction in 2022. A big shift in the sector of information gathering and processing happened because of this chatbot. What is the story of ChatGPT? How is the bot responding to prompts and generating contents? Swipe through these slides prepared by Expeed Software, a web development company regarding the development and technical intricacies of ChatGPT!
5 Tips for Creating Standard Financial Reports
Well-crafted financial reports serve as vital tools for decision-making and transparency within an organization. By following the undermentioned tips, you can create standardized financial reports that effectively communicate your company's financial health and performance to stakeholders.
OAT_RI_Ep20 WeighingTheRisks_May24_Trade Wars.pptx
How will new technology fields affect economic trade?
1. Elemental Economics - Introduction to mining.pdf
After this first you should: Understand the nature of mining; have an awareness of the industry’s boundaries, corporate structure and size; appreciation the complex motivations and objectives of the industries’ various participants; know how mineral reserves are defined and estimated, and how they evolve over time.
University of North Carolina at Charlotte degree offer diploma Transcript
办理美国UNCC毕业证书制作北卡大学夏洛特分校假文凭定制Q微168899991做UNCC留信网教留服认证海牙认证改UNCC成绩单GPA做UNCC假学位证假文凭高仿毕业证GRE代考如何申请北卡罗莱纳大学夏洛特分校University of North Carolina at Charlotte degree offer diploma Transcript
Bridging the gap: Online job postings, survey data and the assessment of job ...
Bridging the gap: Online job postings, survey data and the assessment of job ...Labour Market Information Council | Conseil de l’information sur le marché du travail
OJP data from firms like Vicinity Jobs have emerged as a complement to traditional sources of labour demand data, such as the Job Vacancy and Wages Survey (JVWS). Ibrahim Abuallail, PhD Candidate, University of Ottawa, presented research relating to bias in OJPs and a proposed approach to effectively adjust OJP data to complement existing official data (such as from the JVWS) and improve the measurement of labour demand.How Non-Banking Financial Companies Empower Startups With Venture Debt Financing
How Non-Banking Financial Companies Empower Startups With Venture Debt Financing
falcon-invoice-discounting-a-strategic-approach-to-optimize-investments
Falcon stands out as a top-tier P2P Invoice Discounting platform in India, bridging esteemed blue-chip companies and eager investors. Our goal is to transform the investment landscape in India by establishing a comprehensive destination for borrowers and investors with diverse profiles and needs, all while minimizing risk. What sets Falcon apart is the elimination of intermediaries such as commercial banks and depository institutions, allowing investors to enjoy higher yields.
Tdasx: In-Depth Analysis of Cryptocurrency Giveaway Scams and Security Strate...
Tdasx: In-Depth Analysis of Cryptocurrency Giveaway Scams and Security Strategies
Tdasx: In-Depth Analysis of Cryptocurrency Giveaway Scams and Security Strate...
Tdasx: In-Depth Analysis of Cryptocurrency Giveaway Scams and Security Strategies
2. Elemental Economics - Mineral demand.pdf
After this second you should be able to: Explain the main determinants of demand for any mineral product, and their relative importance; recognise and explain how demand for any product is likely to change with economic activity; recognise and explain the roles of technology and relative prices in influencing demand; be able to explain the differences between the rates of growth of demand for different products.
Discover the Future of Dogecoin with Our Comprehensive Guidance
Learn in-depth about Dogecoin's trajectory and stay informed with 36crypto's essential and up-to-date information about the crypto space.
Our presentation delves into Dogecoin's potential future, exploring whether it's destined to skyrocket to the moon or face a downward spiral. In addition, it highlights invaluable insights. Don't miss out on this opportunity to enhance your crypto understanding!
https://36crypto.com/the-future-of-dogecoin-how-high-can-this-cryptocurrency-reach/
一比一原版美国新罕布什尔大学(unh)毕业证学历认证真实可查
永久可查学历认证【微信:A575476】【美国新罕布什尔大学(unh)毕业证成绩单Offer】【微信:A575476】(留信学历认证永久存档查询)采用学校原版纸张、特殊工艺完全按照原版一比一制作(包括:隐形水印,阴影底纹,钢印LOGO烫金烫银,LOGO烫金烫银复合重叠,文字图案浮雕,激光镭射,紫外荧光,温感,复印防伪)行业标杆!精益求精,诚心合作,真诚制作!多年品质 ,按需精细制作,24小时接单,全套进口原装设备,十五年致力于帮助留学生解决难题,业务范围有加拿大、英国、澳洲、韩国、美国、新加坡,新西兰等学历材料,包您满意。
【业务选择办理准则】
一、工作未确定,回国需先给父母、亲戚朋友看下文凭的情况,办理一份就读学校的毕业证【微信:A575476】文凭即可
二、回国进私企、外企、自己做生意的情况,这些单位是不查询毕业证真伪的,而且国内没有渠道去查询国外文凭的真假,也不需要提供真实教育部认证。鉴于此,办理一份毕业证【微信:A575476】即可
三、进国企,银行,事业单位,考公务员等等,这些单位是必需要提供真实教育部认证的,办理教育部认证所需资料众多且烦琐,所有材料您都必须提供原件,我们凭借丰富的经验,快捷的绿色通道帮您快速整合材料,让您少走弯路。
留信网认证的作用:
1:该专业认证可证明留学生真实身份
2:同时对留学生所学专业登记给予评定
3:国家专业人才认证中心颁发入库证书
4:这个认证书并且可以归档倒地方
5:凡事获得留信网入网的信息将会逐步更新到个人身份内,将在公安局网内查询个人身份证信息后,同步读取人才网入库信息
6:个人职称评审加20分
7:个人信誉贷款加10分
8:在国家人才网主办的国家网络招聘大会中纳入资料,供国家高端企业选择人才
→ 【关于价格问题(保证一手价格)
我们所定的价格是非常合理的,而且我们现在做得单子大多数都是代理和回头客户介绍的所以一般现在有新的单子 我给客户的都是第一手的代理价格,因为我想坦诚对待大家 不想跟大家在价格方面浪费时间
对于老客户或者被老客户介绍过来的朋友,我们都会适当给一些优惠。
选择实体注册公司办理,更放心,更安全!我们的承诺:可来公司面谈,可签订合同,会陪同客户一起到教育部认证窗口递交认证材料,客户在教育部官方认证查询网站查询到认证通过结果后付款,不成功不收费!
一比一原版(RMIT毕业证)皇家墨尔本理工大学毕业证如何办理
RMIT硕士学位证成绩单【微信95270640】《皇家墨尔本理工大学毕业证书》《QQ微信95270640》学位证书电子版:在线制作皇家墨尔本理工大学毕业证成绩单GPA修改(制作RMIT毕业证成绩单RMIT文凭证书样本)、皇家墨尔本理工大学毕业证书与成绩单样本图片、《RMIT学历证书学位证书》、皇家墨尔本理工大学毕业证案例毕业证书制作軟體、在线制作加拿大硕士学历证书真实可查.
【本科硕士】皇家墨尔本理工大学皇家墨尔本理工大学本科学位证成绩单(GPA修改);学历认证(教育部认证);大学Offer录取通知书留信认证使馆认证;雅思语言证书等高仿类证书。
办理流程:
1客户提供办理皇家墨尔本理工大学皇家墨尔本理工大学本科学位证成绩单信息:姓名生日专业学位毕业时间等(如信息不确定可以咨询顾问:我们有专业老师帮你查询);
2开始安排制作毕业证成绩单电子图;
3毕业证成绩单电子版做好以后发送给您确认;
4毕业证成绩单电子版您确认信息无误之后安排制作成品;
5成品做好拍照或者视频给您确认;
6快递给客户(国内顺丰国外DHLUPS等快读邮寄)
真实网上可查的证明材料
1教育部学历学位认证留服官网真实存档可查永久存档。
2留学回国人员证明(使馆认证)使馆网站真实存档可查。
我们对海外大学及学院的毕业证成绩单所使用的材料尺寸大小防伪结构(包括:皇家墨尔本理工大学皇家墨尔本理工大学本科学位证成绩单隐形水印阴影底纹钢印LOGO烫金烫银LOGO烫金烫银复合重叠。文字图案浮雕激光镭射紫外荧光温感复印防伪)都有原版本文凭对照。质量得到了广大海外客户群体的认可同时和海外学校留学中介做到与时俱进及时掌握各大院校的(毕业证成绩单资格证结业证录取通知书在读证明等相关材料)的版本更新信息能够在第一时间掌握最新的海外学历文凭的样版尺寸大小纸张材质防伪技术等等并在第一时间收集到原版实物以求达到客户的需求。
本公司还可以按照客户原版印刷制作且能够达到客户理想的要求。有需要办理证件的客户请联系我们在线客服中心微信:95270640 或咨询在线父亲的家很狭小除了一张单人床和一张小方桌几乎没有多余的空间山娃一下子就联想起学校的男小便处山娃很想笑却怎么也笑不出来山娃很迷惑父亲的家除了一扇小铁门连窗户也没有墓穴一般阴森森有些骇人父亲的城也便成了山娃的城父亲的家也便成了山娃的家父亲让山娃呆在屋里做作业看电视最多只能在门口透透气不能跟陌生人搭腔更不能乱跑一怕迷路二怕拐子拐人山娃很惊惧去年村里的田鸡就因为跟父亲进城一不小心被人拐跑了至今不见踪影害不
South Dakota State University degree offer diploma Transcript
办理美国SDSU毕业证书制作南达科他州立大学假文凭定制Q微168899991做SDSU留信网教留服认证海牙认证改SDSU成绩单GPA做SDSU假学位证假文凭高仿毕业证GRE代考如何申请南达科他州立大学South Dakota State University degree offer diploma Transcript
How Does CRISIL Evaluate Lenders in India for Credit Ratings
CRISIL evaluates lenders in India by analyzing financial performance, loan portfolio quality, risk management practices, capital adequacy, market position, and adherence to regulatory requirements. This comprehensive assessment ensures a thorough evaluation of creditworthiness and financial strength. Each criterion is meticulously examined to provide credible and reliable ratings.
Tdasx: Unveiling the Trillion-Dollar Potential of Bitcoin DeFi
Tdasx: Unveiling the Trillion-Dollar Potential of Bitcoin DeFi
What's a worker’s market? Job quality and labour market tightness
What's a worker’s market? Job quality and labour market tightnessLabour Market Information Council | Conseil de l’information sur le marché du travail
In a tight labour market, job-seekers gain bargaining power and leverage it into greater job quality—at least, that’s the conventional wisdom.
Michael, LMIC Economist, presented findings that reveal a weakened relationship between labour market tightness and job quality indicators following the pandemic. Labour market tightness coincided with growth in real wages for only a portion of workers: those in low-wage jobs requiring little education. Several factors—including labour market composition, worker and employer behaviour, and labour market practices—have contributed to the absence of worker benefits. These will be investigated further in future work.Solution Manual For Financial Accounting, 8th Canadian Edition 2024, by Libby...
Solution Manual For Financial Accounting, 8th Canadian Edition 2024, by Libby, Hodge, Verified Chapters 1 - 13, Complete Newest Version Solution Manual For Financial Accounting, 8th Canadian Edition by Libby, Hodge, Verified Chapters 1 - 13, Complete Newest Version Solution Manual For Financial Accounting 8th Canadian Edition Pdf Chapters Download Stuvia Solution Manual For Financial Accounting 8th Canadian Edition Ebook Download Stuvia Solution Manual For Financial Accounting 8th Canadian Edition Pdf Solution Manual For Financial Accounting 8th Canadian Edition Pdf Download Stuvia Financial Accounting 8th Canadian Edition Pdf Chapters Download Stuvia Financial Accounting 8th Canadian Edition Ebook Download Stuvia Financial Accounting 8th Canadian Edition Pdf Financial Accounting 8th Canadian Edition Pdf Download Stuvia
International Sustainability Standards Board
Issb standards
New standard for reporting sustainability on lines of tcfd
Product Design Trends in 2024 | Teenage Engineerings
The realm of product design is a constantly changing environment where technology and style intersect. Every year introduces fresh challenges and exciting trends that mold the future of this captivating art form. In this piece, we delve into the significant trends set to influence the look and functionality of product design in the year 2024.
How Race, Age and Gender Shape Attitudes Towards Mental Health
Mental health has been in the news quite a bit lately. Dozens of U.S. states are currently suing Meta for contributing to the youth mental health crisis by inserting addictive features into their products, while the U.S. Surgeon General is touring the nation to bring awareness to the growing epidemic of loneliness and isolation. The country has endured periods of low national morale, such as in the 1970s when high inflation and the energy crisis worsened public sentiment following the Vietnam War. The current mood, however, feels different. Gallup recently reported that national mental health is at an all-time low, with few bright spots to lift spirits.
To better understand how Americans are feeling and their attitudes towards mental health in general, ThinkNow conducted a nationally representative quantitative survey of 1,500 respondents and found some interesting differences among ethnic, age and gender groups.
Technology
For example, 52% agree that technology and social media have a negative impact on mental health, but when broken out by race, 61% of Whites felt technology had a negative effect, and only 48% of Hispanics thought it did.
While technology has helped us keep in touch with friends and family in faraway places, it appears to have degraded our ability to connect in person. Staying connected online is a double-edged sword since the same news feed that brings us pictures of the grandkids and fluffy kittens also feeds us news about the wars in Israel and Ukraine, the dysfunction in Washington, the latest mass shooting and the climate crisis.
Hispanics may have a built-in defense against the isolation technology breeds, owing to their large, multigenerational households, strong social support systems, and tendency to use social media to stay connected with relatives abroad.
Age and Gender
When asked how individuals rate their mental health, men rate it higher than women by 11 percentage points, and Baby Boomers rank it highest at 83%, saying it’s good or excellent vs. 57% of Gen Z saying the same.
Gen Z spends the most amount of time on social media, so the notion that social media negatively affects mental health appears to be correlated. Unfortunately, Gen Z is also the generation that’s least comfortable discussing mental health concerns with healthcare professionals. Only 40% of them state they’re comfortable discussing their issues with a professional compared to 60% of Millennials and 65% of Boomers.
Race Affects Attitudes
As seen in previous research conducted by ThinkNow, Asian Americans lag other groups when it comes to awareness of mental health issues. Twenty-four percent of Asian Americans believe that having a mental health issue is a sign of weakness compared to the 16% average for all groups. Asians are also considerably less likely to be aware of mental health services in their communities (42% vs. 55%) and most likely to seek out information on social media (51% vs. 35%).
More Related Content
Recently uploaded
5 Tips for Creating Standard Financial Reports
Well-crafted financial reports serve as vital tools for decision-making and transparency within an organization. By following the undermentioned tips, you can create standardized financial reports that effectively communicate your company's financial health and performance to stakeholders.
OAT_RI_Ep20 WeighingTheRisks_May24_Trade Wars.pptx
How will new technology fields affect economic trade?
1. Elemental Economics - Introduction to mining.pdf
After this first you should: Understand the nature of mining; have an awareness of the industry’s boundaries, corporate structure and size; appreciation the complex motivations and objectives of the industries’ various participants; know how mineral reserves are defined and estimated, and how they evolve over time.
University of North Carolina at Charlotte degree offer diploma Transcript
办理美国UNCC毕业证书制作北卡大学夏洛特分校假文凭定制Q微168899991做UNCC留信网教留服认证海牙认证改UNCC成绩单GPA做UNCC假学位证假文凭高仿毕业证GRE代考如何申请北卡罗莱纳大学夏洛特分校University of North Carolina at Charlotte degree offer diploma Transcript
Bridging the gap: Online job postings, survey data and the assessment of job ...
Bridging the gap: Online job postings, survey data and the assessment of job ...Labour Market Information Council | Conseil de l’information sur le marché du travail
OJP data from firms like Vicinity Jobs have emerged as a complement to traditional sources of labour demand data, such as the Job Vacancy and Wages Survey (JVWS). Ibrahim Abuallail, PhD Candidate, University of Ottawa, presented research relating to bias in OJPs and a proposed approach to effectively adjust OJP data to complement existing official data (such as from the JVWS) and improve the measurement of labour demand.How Non-Banking Financial Companies Empower Startups With Venture Debt Financing
How Non-Banking Financial Companies Empower Startups With Venture Debt Financing
falcon-invoice-discounting-a-strategic-approach-to-optimize-investments
Falcon stands out as a top-tier P2P Invoice Discounting platform in India, bridging esteemed blue-chip companies and eager investors. Our goal is to transform the investment landscape in India by establishing a comprehensive destination for borrowers and investors with diverse profiles and needs, all while minimizing risk. What sets Falcon apart is the elimination of intermediaries such as commercial banks and depository institutions, allowing investors to enjoy higher yields.
Tdasx: In-Depth Analysis of Cryptocurrency Giveaway Scams and Security Strate...
Tdasx: In-Depth Analysis of Cryptocurrency Giveaway Scams and Security Strategies
Tdasx: In-Depth Analysis of Cryptocurrency Giveaway Scams and Security Strate...
Tdasx: In-Depth Analysis of Cryptocurrency Giveaway Scams and Security Strategies
2. Elemental Economics - Mineral demand.pdf
After this second you should be able to: Explain the main determinants of demand for any mineral product, and their relative importance; recognise and explain how demand for any product is likely to change with economic activity; recognise and explain the roles of technology and relative prices in influencing demand; be able to explain the differences between the rates of growth of demand for different products.
Discover the Future of Dogecoin with Our Comprehensive Guidance
Learn in-depth about Dogecoin's trajectory and stay informed with 36crypto's essential and up-to-date information about the crypto space.
Our presentation delves into Dogecoin's potential future, exploring whether it's destined to skyrocket to the moon or face a downward spiral. In addition, it highlights invaluable insights. Don't miss out on this opportunity to enhance your crypto understanding!
https://36crypto.com/the-future-of-dogecoin-how-high-can-this-cryptocurrency-reach/
一比一原版美国新罕布什尔大学(unh)毕业证学历认证真实可查
永久可查学历认证【微信:A575476】【美国新罕布什尔大学(unh)毕业证成绩单Offer】【微信:A575476】(留信学历认证永久存档查询)采用学校原版纸张、特殊工艺完全按照原版一比一制作(包括:隐形水印,阴影底纹,钢印LOGO烫金烫银,LOGO烫金烫银复合重叠,文字图案浮雕,激光镭射,紫外荧光,温感,复印防伪)行业标杆!精益求精,诚心合作,真诚制作!多年品质 ,按需精细制作,24小时接单,全套进口原装设备,十五年致力于帮助留学生解决难题,业务范围有加拿大、英国、澳洲、韩国、美国、新加坡,新西兰等学历材料,包您满意。
【业务选择办理准则】
一、工作未确定,回国需先给父母、亲戚朋友看下文凭的情况,办理一份就读学校的毕业证【微信:A575476】文凭即可
二、回国进私企、外企、自己做生意的情况,这些单位是不查询毕业证真伪的,而且国内没有渠道去查询国外文凭的真假,也不需要提供真实教育部认证。鉴于此,办理一份毕业证【微信:A575476】即可
三、进国企,银行,事业单位,考公务员等等,这些单位是必需要提供真实教育部认证的,办理教育部认证所需资料众多且烦琐,所有材料您都必须提供原件,我们凭借丰富的经验,快捷的绿色通道帮您快速整合材料,让您少走弯路。
留信网认证的作用:
1:该专业认证可证明留学生真实身份
2:同时对留学生所学专业登记给予评定
3:国家专业人才认证中心颁发入库证书
4:这个认证书并且可以归档倒地方
5:凡事获得留信网入网的信息将会逐步更新到个人身份内,将在公安局网内查询个人身份证信息后,同步读取人才网入库信息
6:个人职称评审加20分
7:个人信誉贷款加10分
8:在国家人才网主办的国家网络招聘大会中纳入资料,供国家高端企业选择人才
→ 【关于价格问题(保证一手价格)
我们所定的价格是非常合理的,而且我们现在做得单子大多数都是代理和回头客户介绍的所以一般现在有新的单子 我给客户的都是第一手的代理价格,因为我想坦诚对待大家 不想跟大家在价格方面浪费时间
对于老客户或者被老客户介绍过来的朋友,我们都会适当给一些优惠。
选择实体注册公司办理,更放心,更安全!我们的承诺:可来公司面谈,可签订合同,会陪同客户一起到教育部认证窗口递交认证材料,客户在教育部官方认证查询网站查询到认证通过结果后付款,不成功不收费!
一比一原版(RMIT毕业证)皇家墨尔本理工大学毕业证如何办理
RMIT硕士学位证成绩单【微信95270640】《皇家墨尔本理工大学毕业证书》《QQ微信95270640》学位证书电子版:在线制作皇家墨尔本理工大学毕业证成绩单GPA修改(制作RMIT毕业证成绩单RMIT文凭证书样本)、皇家墨尔本理工大学毕业证书与成绩单样本图片、《RMIT学历证书学位证书》、皇家墨尔本理工大学毕业证案例毕业证书制作軟體、在线制作加拿大硕士学历证书真实可查.
【本科硕士】皇家墨尔本理工大学皇家墨尔本理工大学本科学位证成绩单(GPA修改);学历认证(教育部认证);大学Offer录取通知书留信认证使馆认证;雅思语言证书等高仿类证书。
办理流程:
1客户提供办理皇家墨尔本理工大学皇家墨尔本理工大学本科学位证成绩单信息:姓名生日专业学位毕业时间等(如信息不确定可以咨询顾问:我们有专业老师帮你查询);
2开始安排制作毕业证成绩单电子图;
3毕业证成绩单电子版做好以后发送给您确认;
4毕业证成绩单电子版您确认信息无误之后安排制作成品;
5成品做好拍照或者视频给您确认;
6快递给客户(国内顺丰国外DHLUPS等快读邮寄)
真实网上可查的证明材料
1教育部学历学位认证留服官网真实存档可查永久存档。
2留学回国人员证明(使馆认证)使馆网站真实存档可查。
我们对海外大学及学院的毕业证成绩单所使用的材料尺寸大小防伪结构(包括:皇家墨尔本理工大学皇家墨尔本理工大学本科学位证成绩单隐形水印阴影底纹钢印LOGO烫金烫银LOGO烫金烫银复合重叠。文字图案浮雕激光镭射紫外荧光温感复印防伪)都有原版本文凭对照。质量得到了广大海外客户群体的认可同时和海外学校留学中介做到与时俱进及时掌握各大院校的(毕业证成绩单资格证结业证录取通知书在读证明等相关材料)的版本更新信息能够在第一时间掌握最新的海外学历文凭的样版尺寸大小纸张材质防伪技术等等并在第一时间收集到原版实物以求达到客户的需求。
本公司还可以按照客户原版印刷制作且能够达到客户理想的要求。有需要办理证件的客户请联系我们在线客服中心微信:95270640 或咨询在线父亲的家很狭小除了一张单人床和一张小方桌几乎没有多余的空间山娃一下子就联想起学校的男小便处山娃很想笑却怎么也笑不出来山娃很迷惑父亲的家除了一扇小铁门连窗户也没有墓穴一般阴森森有些骇人父亲的城也便成了山娃的城父亲的家也便成了山娃的家父亲让山娃呆在屋里做作业看电视最多只能在门口透透气不能跟陌生人搭腔更不能乱跑一怕迷路二怕拐子拐人山娃很惊惧去年村里的田鸡就因为跟父亲进城一不小心被人拐跑了至今不见踪影害不
South Dakota State University degree offer diploma Transcript
办理美国SDSU毕业证书制作南达科他州立大学假文凭定制Q微168899991做SDSU留信网教留服认证海牙认证改SDSU成绩单GPA做SDSU假学位证假文凭高仿毕业证GRE代考如何申请南达科他州立大学South Dakota State University degree offer diploma Transcript
How Does CRISIL Evaluate Lenders in India for Credit Ratings
CRISIL evaluates lenders in India by analyzing financial performance, loan portfolio quality, risk management practices, capital adequacy, market position, and adherence to regulatory requirements. This comprehensive assessment ensures a thorough evaluation of creditworthiness and financial strength. Each criterion is meticulously examined to provide credible and reliable ratings.
Tdasx: Unveiling the Trillion-Dollar Potential of Bitcoin DeFi
Tdasx: Unveiling the Trillion-Dollar Potential of Bitcoin DeFi
What's a worker’s market? Job quality and labour market tightness
What's a worker’s market? Job quality and labour market tightnessLabour Market Information Council | Conseil de l’information sur le marché du travail
In a tight labour market, job-seekers gain bargaining power and leverage it into greater job quality—at least, that’s the conventional wisdom.
Michael, LMIC Economist, presented findings that reveal a weakened relationship between labour market tightness and job quality indicators following the pandemic. Labour market tightness coincided with growth in real wages for only a portion of workers: those in low-wage jobs requiring little education. Several factors—including labour market composition, worker and employer behaviour, and labour market practices—have contributed to the absence of worker benefits. These will be investigated further in future work.Solution Manual For Financial Accounting, 8th Canadian Edition 2024, by Libby...
Solution Manual For Financial Accounting, 8th Canadian Edition 2024, by Libby, Hodge, Verified Chapters 1 - 13, Complete Newest Version Solution Manual For Financial Accounting, 8th Canadian Edition by Libby, Hodge, Verified Chapters 1 - 13, Complete Newest Version Solution Manual For Financial Accounting 8th Canadian Edition Pdf Chapters Download Stuvia Solution Manual For Financial Accounting 8th Canadian Edition Ebook Download Stuvia Solution Manual For Financial Accounting 8th Canadian Edition Pdf Solution Manual For Financial Accounting 8th Canadian Edition Pdf Download Stuvia Financial Accounting 8th Canadian Edition Pdf Chapters Download Stuvia Financial Accounting 8th Canadian Edition Ebook Download Stuvia Financial Accounting 8th Canadian Edition Pdf Financial Accounting 8th Canadian Edition Pdf Download Stuvia
International Sustainability Standards Board
Issb standards
New standard for reporting sustainability on lines of tcfd
Recently uploaded (20)
OAT_RI_Ep20 WeighingTheRisks_May24_Trade Wars.pptx
OAT_RI_Ep20 WeighingTheRisks_May24_Trade Wars.pptx
1. Elemental Economics - Introduction to mining.pdf
1. Elemental Economics - Introduction to mining.pdf
University of North Carolina at Charlotte degree offer diploma Transcript
University of North Carolina at Charlotte degree offer diploma Transcript
Bridging the gap: Online job postings, survey data and the assessment of job ...
Bridging the gap: Online job postings, survey data and the assessment of job ...
How Non-Banking Financial Companies Empower Startups With Venture Debt Financing
How Non-Banking Financial Companies Empower Startups With Venture Debt Financing
falcon-invoice-discounting-a-strategic-approach-to-optimize-investments
falcon-invoice-discounting-a-strategic-approach-to-optimize-investments
Tdasx: In-Depth Analysis of Cryptocurrency Giveaway Scams and Security Strate...
Tdasx: In-Depth Analysis of Cryptocurrency Giveaway Scams and Security Strate...
Tdasx: In-Depth Analysis of Cryptocurrency Giveaway Scams and Security Strate...
Tdasx: In-Depth Analysis of Cryptocurrency Giveaway Scams and Security Strate...
Discover the Future of Dogecoin with Our Comprehensive Guidance
Discover the Future of Dogecoin with Our Comprehensive Guidance
South Dakota State University degree offer diploma Transcript
South Dakota State University degree offer diploma Transcript
How Does CRISIL Evaluate Lenders in India for Credit Ratings
How Does CRISIL Evaluate Lenders in India for Credit Ratings
Tumelo-deep-dive-into-pass-through-voting-Feb23 (1).pdf
Tumelo-deep-dive-into-pass-through-voting-Feb23 (1).pdf
Tdasx: Unveiling the Trillion-Dollar Potential of Bitcoin DeFi
Tdasx: Unveiling the Trillion-Dollar Potential of Bitcoin DeFi
What's a worker’s market? Job quality and labour market tightness
What's a worker’s market? Job quality and labour market tightness
Solution Manual For Financial Accounting, 8th Canadian Edition 2024, by Libby...
Solution Manual For Financial Accounting, 8th Canadian Edition 2024, by Libby...
Featured
Product Design Trends in 2024 | Teenage Engineerings
The realm of product design is a constantly changing environment where technology and style intersect. Every year introduces fresh challenges and exciting trends that mold the future of this captivating art form. In this piece, we delve into the significant trends set to influence the look and functionality of product design in the year 2024.
How Race, Age and Gender Shape Attitudes Towards Mental Health
Mental health has been in the news quite a bit lately. Dozens of U.S. states are currently suing Meta for contributing to the youth mental health crisis by inserting addictive features into their products, while the U.S. Surgeon General is touring the nation to bring awareness to the growing epidemic of loneliness and isolation. The country has endured periods of low national morale, such as in the 1970s when high inflation and the energy crisis worsened public sentiment following the Vietnam War. The current mood, however, feels different. Gallup recently reported that national mental health is at an all-time low, with few bright spots to lift spirits.
To better understand how Americans are feeling and their attitudes towards mental health in general, ThinkNow conducted a nationally representative quantitative survey of 1,500 respondents and found some interesting differences among ethnic, age and gender groups.
Technology
For example, 52% agree that technology and social media have a negative impact on mental health, but when broken out by race, 61% of Whites felt technology had a negative effect, and only 48% of Hispanics thought it did.
While technology has helped us keep in touch with friends and family in faraway places, it appears to have degraded our ability to connect in person. Staying connected online is a double-edged sword since the same news feed that brings us pictures of the grandkids and fluffy kittens also feeds us news about the wars in Israel and Ukraine, the dysfunction in Washington, the latest mass shooting and the climate crisis.
Hispanics may have a built-in defense against the isolation technology breeds, owing to their large, multigenerational households, strong social support systems, and tendency to use social media to stay connected with relatives abroad.
Age and Gender
When asked how individuals rate their mental health, men rate it higher than women by 11 percentage points, and Baby Boomers rank it highest at 83%, saying it’s good or excellent vs. 57% of Gen Z saying the same.
Gen Z spends the most amount of time on social media, so the notion that social media negatively affects mental health appears to be correlated. Unfortunately, Gen Z is also the generation that’s least comfortable discussing mental health concerns with healthcare professionals. Only 40% of them state they’re comfortable discussing their issues with a professional compared to 60% of Millennials and 65% of Boomers.
Race Affects Attitudes
As seen in previous research conducted by ThinkNow, Asian Americans lag other groups when it comes to awareness of mental health issues. Twenty-four percent of Asian Americans believe that having a mental health issue is a sign of weakness compared to the 16% average for all groups. Asians are also considerably less likely to be aware of mental health services in their communities (42% vs. 55%) and most likely to seek out information on social media (51% vs. 35%).
AI Trends in Creative Operations 2024 by Artwork Flow.pdf
Creative operations teams expect increased AI use in 2024. Currently, over half of tasks are not AI-enabled, but this is expected to decrease in the coming year. ChatGPT is the most popular AI tool currently. Business leaders are more actively exploring AI benefits than individual contributors. Most respondents do not believe AI will impact workforce size in 2024. However, some inhibitions still exist around AI accuracy and lack of understanding. Creatives primarily want to use AI to save time on mundane tasks and boost productivity.
Skeleton Culture Code
Organizational culture includes values, norms, systems, symbols, language, assumptions, beliefs, and habits that influence employee behaviors and how people interpret those behaviors. It is important because culture can help or hinder a company's success. Some key aspects of Netflix's culture that help it achieve results include hiring smartly so every position has stars, focusing on attitude over just aptitude, and having a strict policy against peacocks, whiners, and jerks.
PEPSICO Presentation to CAGNY Conference Feb 2024
PepsiCo provided a safe harbor statement noting that any forward-looking statements are based on currently available information and are subject to risks and uncertainties. It also provided information on non-GAAP measures and directing readers to its website for disclosure and reconciliation. The document then discussed PepsiCo's business overview, including that it is a global beverage and convenient food company with iconic brands, $91 billion in net revenue in 2023, and nearly $14 billion in core operating profit. It operates through a divisional structure with a focus on local consumers.
Content Methodology: A Best Practices Report (Webinar)
This document provides an overview of content methodology best practices. It defines content methodology as establishing objectives, KPIs, and a culture of continuous learning and iteration. An effective methodology focuses on connecting with audiences, creating optimal content, and optimizing processes. It also discusses why a methodology is needed due to the competitive landscape, proliferation of channels, and opportunities for improvement. Components of an effective methodology include defining objectives and KPIs, audience analysis, identifying opportunities, and evaluating resources. The document concludes with recommendations around creating a content plan, testing and optimizing content over 90 days.
How to Prepare For a Successful Job Search for 2024
The document provides guidance on preparing a job search for 2024. It discusses the state of the job market, focusing on growth in AI and healthcare but also continued layoffs. It recommends figuring out what you want to do by researching interests and skills, then conducting informational interviews. The job search should involve building a personal brand on LinkedIn, actively applying to jobs, tailoring resumes and interviews, maintaining job hunting as a habit, and continuing self-improvement. Once hired, the document advises setting new goals and keeping skills and networking active in case of future opportunities.
Social Media Marketing Trends 2024 // The Global Indie Insights
A report by thenetworkone and Kurio.
The contributing experts and agencies are (in an alphabetical order): Sylwia Rytel, Social Media Supervisor, 180heartbeats + JUNG v MATT (PL), Sharlene Jenner, Vice President - Director of Engagement Strategy, Abelson Taylor (USA), Alex Casanovas, Digital Director, Atrevia (ES), Dora Beilin, Senior Social Strategist, Barrett Hoffher (USA), Min Seo, Campaign Director, Brand New Agency (KR), Deshé M. Gully, Associate Strategist, Day One Agency (USA), Francesca Trevisan, Strategist, Different (IT), Trevor Crossman, CX and Digital Transformation Director; Olivia Hussey, Strategic Planner; Simi Srinarula, Social Media Manager, The Hallway (AUS), James Hebbert, Managing Director, Hylink (CN / UK), Mundy Álvarez, Planning Director; Pedro Rojas, Social Media Manager; Pancho González, CCO, Inbrax (CH), Oana Oprea, Head of Digital Planning, Jam Session Agency (RO), Amy Bottrill, Social Account Director, Launch (UK), Gaby Arriaga, Founder, Leonardo1452 (MX), Shantesh S Row, Creative Director, Liwa (UAE), Rajesh Mehta, Chief Strategy Officer; Dhruv Gaur, Digital Planning Lead; Leonie Mergulhao, Account Supervisor - Social Media & PR, Medulla (IN), Aurelija Plioplytė, Head of Digital & Social, Not Perfect (LI), Daiana Khaidargaliyeva, Account Manager, Osaka Labs (UK / USA), Stefanie Söhnchen, Vice President Digital, PIABO Communications (DE), Elisabeth Winiartati, Managing Consultant, Head of Global Integrated Communications; Lydia Aprina, Account Manager, Integrated Marketing and Communications; Nita Prabowo, Account Manager, Integrated Marketing and Communications; Okhi, Web Developer, PNTR Group (ID), Kei Obusan, Insights Director; Daffi Ranandi, Insights Manager, Radarr (SG), Gautam Reghunath, Co-founder & CEO, Talented (IN), Donagh Humphreys, Head of Social and Digital Innovation, THINKHOUSE (IRE), Sarah Yim, Strategy Director, Zulu Alpha Kilo (CA).
Trends In Paid Search: Navigating The Digital Landscape In 2024
The search marketing landscape is evolving rapidly with new technologies, and professionals, like you, rely on innovative paid search strategies to meet changing demands.
It’s important that you’re ready to implement new strategies in 2024.
Check this out and learn the top trends in paid search advertising that are expected to gain traction, so you can drive higher ROI more efficiently in 2024.
You’ll learn:
- The latest trends in AI and automation, and what this means for an evolving paid search ecosystem.
- New developments in privacy and data regulation.
- Emerging ad formats that are expected to make an impact next year.
Watch Sreekant Lanka from iQuanti and Irina Klein from OneMain Financial as they dive into the future of paid search and explore the trends, strategies, and technologies that will shape the search marketing landscape.
If you’re looking to assess your paid search strategy and design an industry-aligned plan for 2024, then this webinar is for you.
5 Public speaking tips from TED - Visualized summary
From their humble beginnings in 1984, TED has grown into the world’s most powerful amplifier for speakers and thought-leaders to share their ideas. They have over 2,400 filmed talks (not including the 30,000+ TEDx videos) freely available online, and have hosted over 17,500 events around the world.
With over one billion views in a year, it’s no wonder that so many speakers are looking to TED for ideas on how to share their message more effectively.
The article “5 Public-Speaking Tips TED Gives Its Speakers”, by Carmine Gallo for Forbes, gives speakers five practical ways to connect with their audience, and effectively share their ideas on stage.
Whether you are gearing up to get on a TED stage yourself, or just want to master the skills that so many of their speakers possess, these tips and quotes from Chris Anderson, the TED Talks Curator, will encourage you to make the most impactful impression on your audience.
See the full article and more summaries like this on SpeakerHub here: https://speakerhub.com/blog/5-presentation-tips-ted-gives-its-speakers
See the original article on Forbes here:
http://www.forbes.com/forbes/welcome/?toURL=http://www.forbes.com/sites/carminegallo/2016/05/06/5-public-speaking-tips-ted-gives-its-speakers/&refURL=&referrer=#5c07a8221d9b
ChatGPT and the Future of Work - Clark Boyd
Everyone is in agreement that ChatGPT (and other generative AI tools) will shape the future of work. Yet there is little consensus on exactly how, when, and to what extent this technology will change our world.
Businesses that extract maximum value from ChatGPT will use it as a collaborative tool for everything from brainstorming to technical maintenance.
For individuals, now is the time to pinpoint the skills the future professional will need to thrive in the AI age.
Check out this presentation to understand what ChatGPT is, how it will shape the future of work, and how you can prepare to take advantage.
Getting into the tech field. what next
The document provides career advice for getting into the tech field, including:
- Doing projects and internships in college to build a portfolio.
- Learning about different roles and technologies through industry research.
- Contributing to open source projects to build experience and network.
- Developing a personal brand through a website and social media presence.
- Networking through events, communities, and finding a mentor.
- Practicing interviews through mock interviews and whiteboarding coding questions.
Google's Just Not That Into You: Understanding Core Updates & Search Intent
1. Core updates from Google periodically change how its algorithms assess and rank websites and pages. This can impact rankings through shifts in user intent, site quality issues being caught up to, world events influencing queries, and overhauls to search like the E-A-T framework.
2. There are many possible user intents beyond just transactional, navigational and informational. Identifying intent shifts is important during core updates. Sites may need to optimize for new intents through different content types and sections.
3. Responding effectively to core updates requires analyzing "before and after" data to understand changes, identifying new intents or page types, and ensuring content matches appropriate intents across video, images, knowledge graphs and more.
How to have difficult conversations
Stop putting off having difficult conversations. Seven practical tips to ensure your next difficult conversation go smoothly.
Introduction to Data Science
A brief introduction to DataScience with explaining of the concepts, algorithms, machine learning, supervised and unsupervised learning, clustering, statistics, data preprocessing, real-world applications etc.
It's part of a Data Science Corner Campaign where I will be discussing the fundamentals of DataScience, AIML, Statistics etc.
Time Management & Productivity - Best Practices
Here's my presentation on by proven best practices how to manage your work time effectively and how to improve your productivity. It includes practical tips and how to use tools such as Slack, Google Apps, Hubspot, Google Calendar, Gmail and others.
The six step guide to practical project management
The six step guide to practical project management
If you think managing projects is too difficult, think again.
We’ve stripped back project management processes to the
basics – to make it quicker and easier, without sacrificing
the vital ingredients for success.
“If you’re looking for some real-world guidance, then The Six Step Guide to Practical Project Management will help.”
Dr Andrew Makar, Tactical Project Management
Beginners Guide to TikTok for Search - Rachel Pearson - We are Tilt __ Bright...
A presentation for absolute beginners who have never touched TikTok and may be a bit scared of it!
Unlocking the Power of ChatGPT and AI in Testing - A Real-World Look, present...
During this webinar, Anand Bagmar demonstrates how AI tools such as ChatGPT can be applied to various stages of the software development life cycle (SDLC) using an eCommerce application case study. Find the on-demand recording and more info at https://applitools.info/b59
Key takeaways:
• Learn how to use ChatGPT to add AI power to your testing and test automation
• Understand the limitations of the technology and where human expertise is crucial
• Gain insight into different AI-based tools
• Adopt AI-based tools to stay relevant and optimize work for developers and testers
* ChatGPT and OpenAI belong to OpenAI, L.L.C.
12 Ways to Increase Your Influence at Work
To succeed in your career, you need a strategy for sending out ripples of influence. Here are 12 ways you can start doing just that.
Featured (20)
Product Design Trends in 2024 | Teenage Engineerings
Product Design Trends in 2024 | Teenage Engineerings
How Race, Age and Gender Shape Attitudes Towards Mental Health
How Race, Age and Gender Shape Attitudes Towards Mental Health
AI Trends in Creative Operations 2024 by Artwork Flow.pdf
AI Trends in Creative Operations 2024 by Artwork Flow.pdf
Content Methodology: A Best Practices Report (Webinar)
Content Methodology: A Best Practices Report (Webinar)
How to Prepare For a Successful Job Search for 2024
How to Prepare For a Successful Job Search for 2024
Social Media Marketing Trends 2024 // The Global Indie Insights
Social Media Marketing Trends 2024 // The Global Indie Insights
Trends In Paid Search: Navigating The Digital Landscape In 2024
Trends In Paid Search: Navigating The Digital Landscape In 2024
5 Public speaking tips from TED - Visualized summary
5 Public speaking tips from TED - Visualized summary
Google's Just Not That Into You: Understanding Core Updates & Search Intent
Google's Just Not That Into You: Understanding Core Updates & Search Intent
The six step guide to practical project management
The six step guide to practical project management
Beginners Guide to TikTok for Search - Rachel Pearson - We are Tilt __ Bright...
Beginners Guide to TikTok for Search - Rachel Pearson - We are Tilt __ Bright...
Unlocking the Power of ChatGPT and AI in Testing - A Real-World Look, present...
Unlocking the Power of ChatGPT and AI in Testing - A Real-World Look, present...
73549-financial analysis powerpoint.pptx
- 1. Financial analysis powerpoint 2010A 2011A 2012A Profitability Ratios Dividend yield 2.2% 2.5% 1.8% ROE 13.3% 17.9% 16.8% ROA 6.2% 9.5% 10.25 Profit margin 12.1% 13.5% 13.9% Liquidity ratios Current ratio 1.91 2.20 2.37 Quick ratio 1.46 1.58 1.63 Leverage rations Debt to equity 30% 17% 8% Interest coverage 5.83 6.40 7.59 OER Receivables turnover 6.03 6.16 5.91 Inventory turnover 4.27 3.92 3.83 Payables turnover 11.77 10.77 Receivable conversion method 58 61 Inventory conversion method 92 94 Payment deferral period 31 33 Cash conversion cycle 120 122