Download as PDF, PPTX

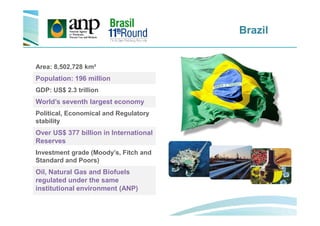
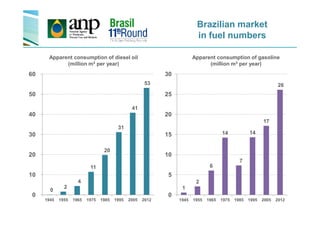
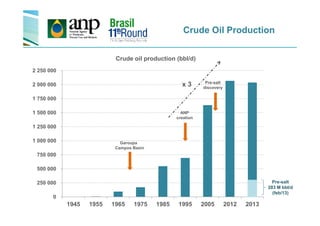
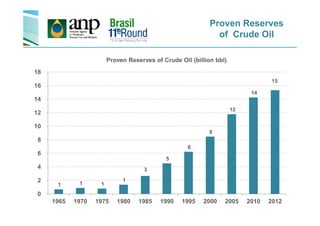
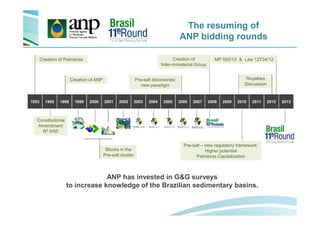
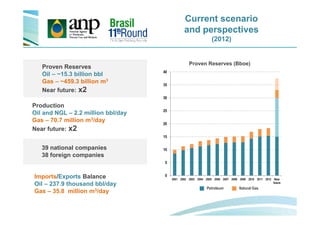
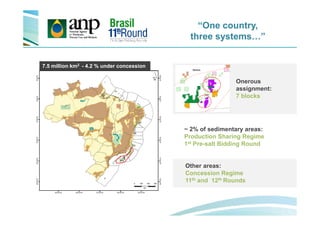
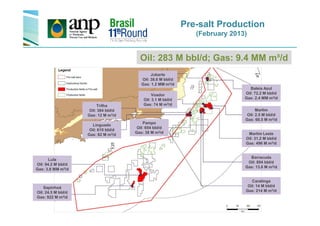
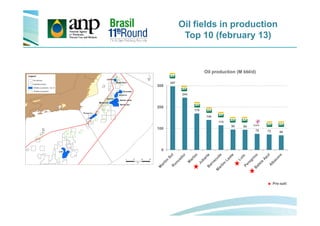
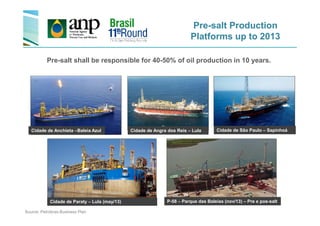
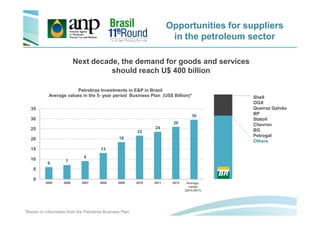
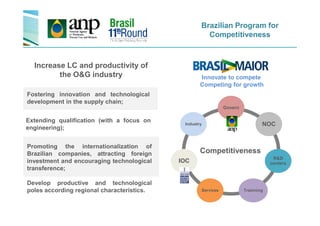
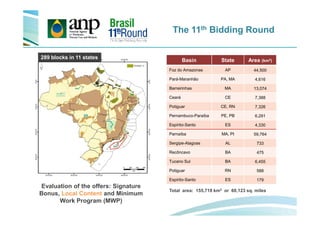
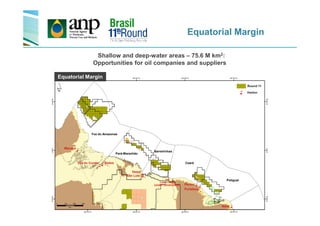
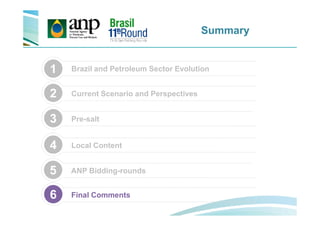
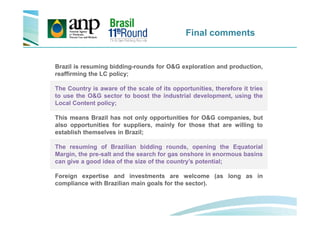

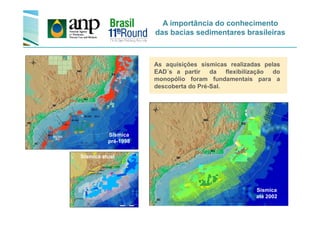
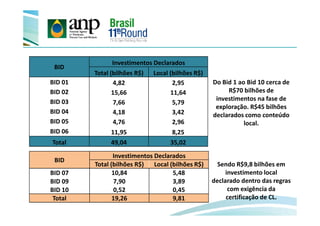
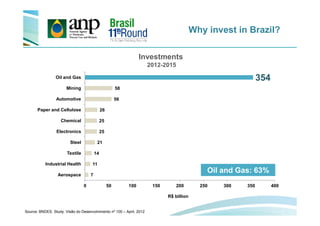
The document discusses the evolution and current state of Brazil's petroleum sector, highlighting its significant reserves and the impact of pre-salt discoveries on production. It outlines the regulatory framework, local content policies, and ongoing bidding rounds by the National Agency of Petroleum, Natural Gas, and Biofuels (ANP) to encourage domestic and foreign investment. Furthermore, it emphasizes the need for local infrastructure and services, projecting substantial opportunities for suppliers in the oil and gas industry.