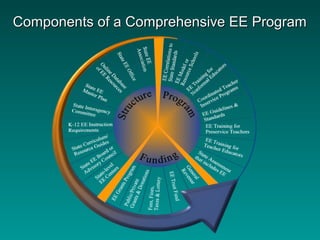
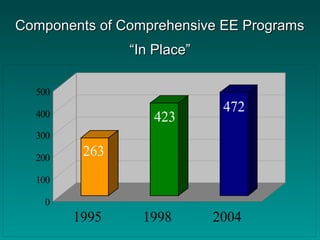
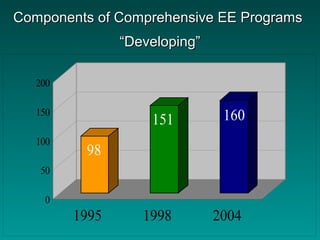
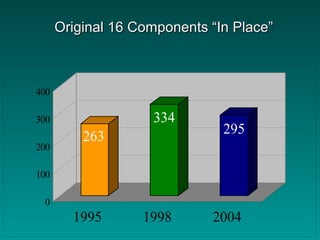
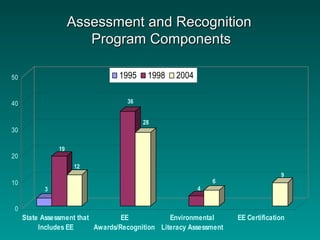
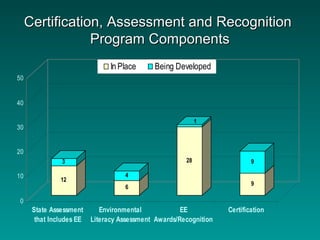
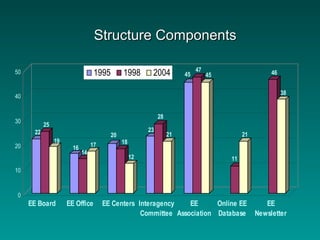
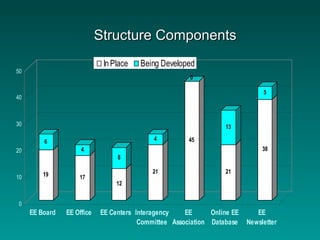
This document summarizes the results of a longitudinal survey examining the status of state-level comprehensive environmental education programs from 1995 to 2004. Some key findings include:
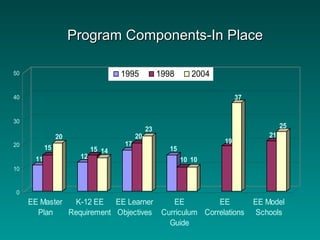
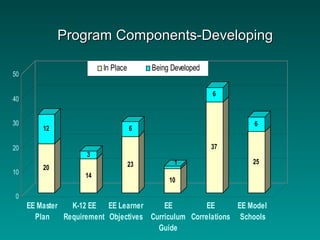
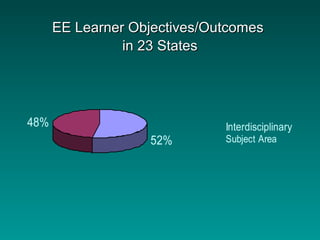
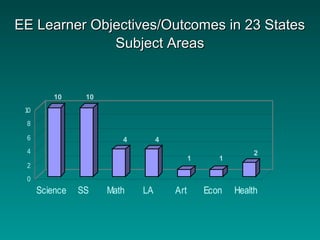
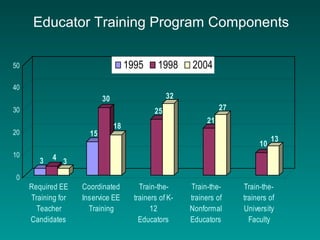
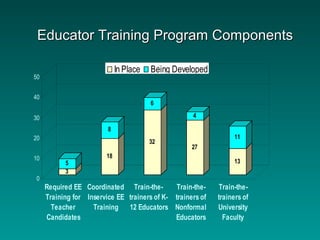
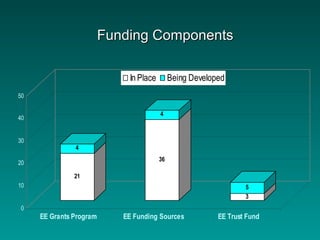
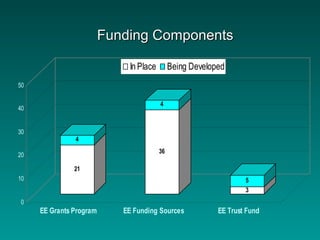
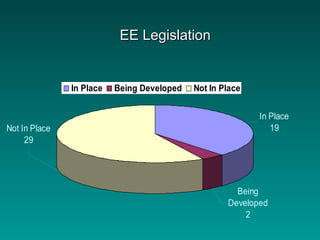
- The number of states reporting components of comprehensive EE programs as "in place" increased over time for elements like EE learner objectives, curriculum guides, and model schools.
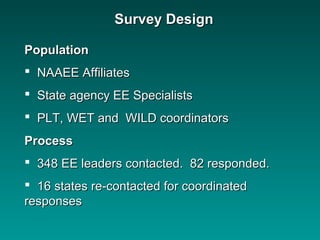
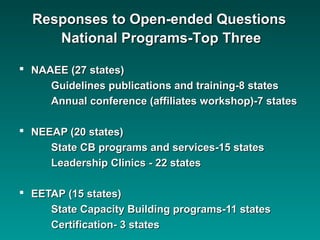
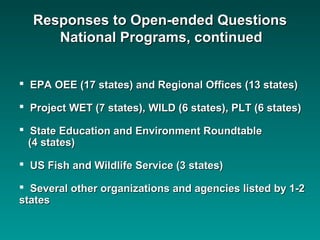
- National organizations like NAAEE, NEEAP, and EETAP were most frequently cited as providing helpful support to states in developing comprehensive EE programs.
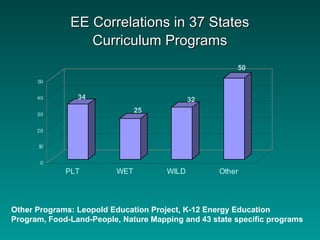
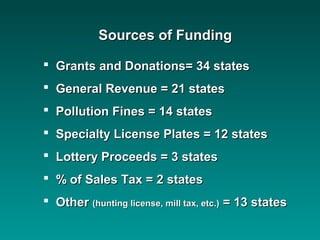
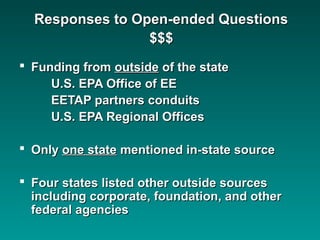
- Outside funding from the EPA and regional offices, as well as programs like Project WET, were commonly reported as important resources by states.


![Retaining Top Performers[1]](https://cdn.slidesharecdn.com/ss_thumbnails/RetainingTopPerformers1-122585472053-phpapp02-thumbnail.jpg?width=640&height=640&fit=bounds)


