Quantitative and Qualitative Approach-Data Collection,
Analysis and Interpretation:
 The Data Collection Methods;
• The general differences between quantitative data and
qualitative data collection methods are summarized in
following Table
Tables 1a and 1b Down Loaded from Web
• Some common forms of data collections methods
under each approach will be discussed here:
o Quantitative Research Approach-Data
Collection
 In quantitative research approach
 Data collection relies heavily on random
sampling and structured data collection
methods 1
Table 1a. Differences between quantitative and qualitative data collection methods
2
*A structured interview relies on a set of standardized and premeditated questions in order to
gather information. While an unstructured interview is a type of interview that does not rely on a
set of premeditated questions in its data-gathering process.
http://kwangaikamed.weebly.com/data-collection-analysis--interpretation.html
*
3
Table 1b. Qualitative vs. quantitative data: what's the difference?
https://www.fullstory.com/blog/qualitative-vs-quantitative-data/
Introduction to Research
(Scientific Inquiry)
 Each strategy of inquiry - true experiment,
quasi-experiment or non-experiment employs
several unique ways of data collection tools
 Some of which are given in the following
figure
Fig 1 Down Loaded from Web
o Qualitative Research Approach-Data Collection
 In qualitative research approach
 Data collection is usually unstructured and
data is collected for non-numerical analysis
 Usually, the methods of data collection all the
strategies of qualitative inquiry-ethnography,
phenomenological, grounded theory, narrative
and case studies-are similar
4
Fig 1. Quantitative data collection. http://kwangaikamed.weebly.com/data-collection-
analysis--interpretation.html 5
 Also, in qualitative research, multiple methods
of data collection or collection of data from
multiple sources is practiced
 This is called triangulation and is employed in
order to collect data that
 provide sufficient data
 provide more information on a phenomenon
or
 enhance deeper analysis and understanding
of a research study
 Types of triangulation may include
 method triangulation
 source triangulation
 analysis triangulation and 6
 even theory triangulation (Denzin, 1978;
Patton, 1999)
 All forms of data gathering done in a
research study form what is known as
a bricolage - a French for DIY or "do-it-
yourself projects"
 Main forms of data collection under each
strategy are given in the following chart:
Fig 2 Down Loaded from Web
o Data Analysis and Interpretation
Figs 3 and 4 Down Loaded from Web
 After identifying
 a research topic
 doing a literature background research
7
Fig 2. Qualitative data collection. http://kwangaikamed.weebly.com/data-collection-analysis--
interpretation.html 8
Fig 3. Data analysis - Vague questions. 9
Fig 4. Data analysis with clarity.
10
 establishing philosophical assumptions and
focus problem
 deciding on an appropriate research paradigm
(hypothesis) and methodology with specific
purpose
 designing a research plan and collecting
sufficient data
 the next step in the research process is data
analysis and interpretation
 which precedes reporting of research
 Therefore data analysis is a process that involves
 examining and molding collected data for
interpretation to
 discover relevant information
 draw or propose conclusions and 11
.
 support decision-making to solve a research
problem
 This involves interpreting data to answer research
questions and making research findings be ready
for dissemination
 Data analysis also serves as a reference for future
data collection and other research activities
 During data analysis (Bala, 2005):
 data collected is transformed into information
and knowledge about a research performed
 relationships between variables are explored
 meanings are identified and information is
interpreted
12
 Like other research methods, data analysis
procedures in quantitative research approach are
different from those in qualitative research
approach
 The general differences of data analysis
procedures between these two approaches are
summarized in the Chart (Bala, 2005) and a Table
Chart 5 Down Loaded from Web
Table 2 Down Loaded from Web
 Now we briefly describe some specific methods
of data analysis under each approach
o Quantitative Research Approach - Data Analysis
 Statistical analysis is the usual method used in
quantitative research approach
13
Chart 5. Data analysis procedures. http://kwangaikamed.weebly.com/data-collection-analysis-
-interpretation.html
(Theory of interpretation) (Related to signs and symbols)
Istiarah
14
Table 2. General differences of data analysis procedures between these two approaches.
15
 However, quantitative data can be analyzed in
several ways
 Data collected has a certain level of
measurements which initially influences the
analysis
 The identification of a particular level of
measurement is the usually the first step in
quantitative data analysis
 The four levels of measurements include
(Yamashita & Espinosa, 2015)
 Nominal Data: basic classification data; lack
logical order - e.g. male or female
 Ordinal Data: has logical order but lack
constant differences between values - e.g.
Pizza size (large, medium, small)
16
 Interval Data: has logical order, is
continuous, has standardized differences
between values but lacks natural zero - e.g.
Celsius degrees
 Ratio Data: has logical order, is continuous,
has standardized differences between values,
and has a natural zero - e.g. height, weight,
age, length
 After identifying a level of measurement, the
next step is now to use a specific analysis
technique in analyzing data
 There are several procedures that can be used to
analyze data
 Main ones include (Yamashita & Espinosa,
2015): 17
o Data Tabulation - e.g. frequency distributions
and percent distributions
o Data Descriptive - Mean, median, mode,
minimum and maximum values, etc.
o Data Disaggregation - tabulation of data
across multiple categories
o Moderate and Advanced Analytical Methods
- (regression, correlation, variance analysis)
 The above methods can be used invariably by all
different true experimental, quasi-experimental
and non-experimental quantitative research
strategies
18
o Qualitative Research Approach - Data Analysis
 Textual data analysis is the usual method used in
qualitative research approach
 This involves identifying patterns and themes in
data collected and then
 examining and interpreting these patterns and
themes
 to draw meaning and answer research
questions
 The five strategies of qualitative research
mentioned:
 Ethnography - the scientific description of
peoples and cultures with their customs,
habits, and mutual differences
19
20
 Phenomenological - to explain the nature of
things through the way people experience
them
 Grounded theory - attempts to unravel the
meanings of people's interactions, social
actions, and experiences
 Narrative and case studies - to explore and
conceptualize human experience as it is
represented in textual form
 However, preliminary and some general steps in
data analysis are common to all. These include
(Yamashita & Espinosa, 2015):
i. Immediate processing and recording of data
(important information, date/time details,
observations, etc.)
ii. Commencement of data analysis soon after
collection
. iii. Reduction of data to meaningful information
iv. Identification of meaningful patterns and
themes” via
 Content analysis achieved by:
▫ Coding the data for certain words or
content
▫ Identifying their patterns
▫ Interpreting their meanings
 Thematic analysis achieved by
▫ grouping data into themes that answers
research problem
v. Display of data which include organizing data
in forms of graphics, maps, tables, etc., to
draw conclusions
vi. Drawing of conclusion and verification 21
 Graphical representation is a way of analyzing
numerical data
 It exhibits the relation between data, ideas,
information and concepts in a diagram
 It is easy to understand and it is one of the most
important learning strategies
 It always depends on the type of information in
a particular domain
 There are different types of graphical
representation. Some of them are as follows
 Line Graphs - Linear graphs are used to
display the continuous data and it is useful
for predicting the future events over time
 Bar Graphs - Bar Graph is used to display
the category of data and it compares the data
using solid bars to represent the quantities
22
 Histograms - The graph that uses bars to
represent the frequency of numerical data that
are organized into intervals
 Since all the intervals are equal and
continuous, all the bars have the same
width
 Line Plot - It shows the frequency of data on
a given number line
 ‘ x ‘ is placed above a number line each
time when that data occurs again
 Frequency Table - The table shows the
number of pieces of data that falls within the
given interval
 Circle Graph - Also known as pie chart that
shows the relationships of the parts of the
whole 23
 The circle is considered with 100% and the
categories occupied is represented with that
specific percentage like 15%, 56% etc.
 Stem and Leaf Plot - In stem and leaf plot ,
the data are organized from least value to the
greatest value
 The digits of the least place values from the
leaves and the next place value digit forms
the stems
 Box and Whisker Plot - The plot diagram
summarizes the data by dividing into four
parts
 Box and whisker shows the range (spread)
and the middle (median) of the data
Figs 4A and B and 5A, B and C Down
Loaded from Web 24
25
Fig 4A. Display of data by different types of graphical presentation.
https://byjus.com/maths/graphical-representation/
26
Fig 4B. Display of data by different types of graphical presentation.
https://byjus.com/maths/graphical-representation/
27
Fig 5A. Graphical representation of analyzed survey data on working conditions within
biomedical research in the UK.
https://www.blendspace.com/lessons/b_GC7HHbxB68Tw/topic-using-graphs-to-display-
data-in-graphical-ways
28
Fig 5B. Graphical representation of analyzed survey data on working conditions within
biomedical research in the UK.
https://www.blendspace.com/lessons/b_GC7HHbxB68Tw/topic-using-graphs-to-display-data-
in-graphical-ways
Fig 5C. Graphical representation of analyzed survey data on working conditions within
biomedical research in the UK.
https://www.blendspace.com/lessons/b_GC7HHbxB68Tw/topic-using-graphs-to-display-
data-in-graphical-ways
29
o Data Interpretation
 “All meanings, we know, depend on the key of
interpretation” - George Eliot (Pen name of an
English Victorian novelist, Mary Ann Evans known
for the psychological depth of her characters and her
descriptions of English rural life)
 Methods of Data Interpretation
 Direct visual observations of raw data
 After organizing the data in tables
 After making graphical representations
 After calculations using numerical/statistical
methods
 Data
 Data is known to be crude information and not
knowledge by itself
 The sequence from data to knowledge is
 from data to information 30
 from Information to Facts and finally
 from Facts to Knowledge
 Data becomes information, when it becomes
relevant to your decision problem
 Information becomes fact, when the data can
support it
 Facts are what the data reveals
 However the decisive instrumental (i.e.
applied) knowledge is expressed together
with some statistical degree of confidence
 Fact becomes knowledge, when it is used in
the successful completion of a decision
process
 Massive amount of facts are integrated as
knowledge
Fig 6 Down Loaded from Web 31
Fig 6. Levels through which data becomes knowledge.
https://www.slideshare.net/bala1957/research-data-interpretation
32
Transforming Data into Knowledge:
To be effectively used in making
decisions, data must go through a
transformation process that involves
six basic steps:
1) Data collection
2) Data organization
3) Data processing
4) Data integration
5) Data reporting and finally
6) Data utilization
 Why Interpretation?
 Interpretation is essential for the simple
reason that the usefulness and utility of
research findings lie in proper interpretation
 It is being considered a basic component of
research process
 Researcher must pay attention to the
following points for correct interpretation:
i. At the start, researcher must invariably
satisfy himself that
(a) the data are appropriate, trustworthy
and adequate for drawing inferences
(b) the data reflect good homogeneity and
that
(c) proper analysis has been done through
statistical methods
33
ii. The researcher must remain cautious about
the errors that can possibly arise in the
process of interpreting results
 One should always remember that even if the
data are properly collected and analyzed
 wrong interpretation would lead to inaccurate
conclusions
 Therefore, it is absolutely essential that the task
of interpretation be accomplished with patience
in an impartial manner and also in correct
perspective
 Data Interpretation Methods
o Data interpretation may be the most important
key in proving or disproving your hypothesis
o It is important to select the proper statistical tool
to make useful interpretation of data 34
 If an improper data analysis method has been
selected, the results may be suspected and
lack credibility
 Decision making process must be based on
data neither on personal opinion nor on any
belief
 What is Statistical Data Analysis?
 Data are not information!
 To determine what statistical data analysis is,
one must first define statistics
 Statistics is a set of methods that are used
to collect, analyze, present, and interpret
data
 Kinds of Statistical Analysis
 Frequency distributions 35
 Graphs and graphing
 Measures of central tendency and
variability
 Measures of relations
 Analysis of differences
 Analysis of variance and related methods
 Profile analysis
 Multivariate analysis
o Drawing Conclusions
 The final step in the research process,
conclusion provides a significant and vital
opportunity
 to explain to the reader exactly what the
research means to the various audiences
who have an interest in the research i.e.36
 significance of study
 The conclusion provides the potential
 to explore in depth and detail the broader
implications of the findings
▫ while stating the limitations of the
research
▫ clearly describing the parameters and
▫ recommendations for future research
x------------------x------------------x-------------------x
37

5-Research Methodology (Quantitative and Qualitative Approach-Data Collection, Analysis and Interpretation).pdf

  • 1.
    Quantitative and QualitativeApproach-Data Collection, Analysis and Interpretation:  The Data Collection Methods; • The general differences between quantitative data and qualitative data collection methods are summarized in following Table Tables 1a and 1b Down Loaded from Web • Some common forms of data collections methods under each approach will be discussed here: o Quantitative Research Approach-Data Collection  In quantitative research approach  Data collection relies heavily on random sampling and structured data collection methods 1
  • 2.
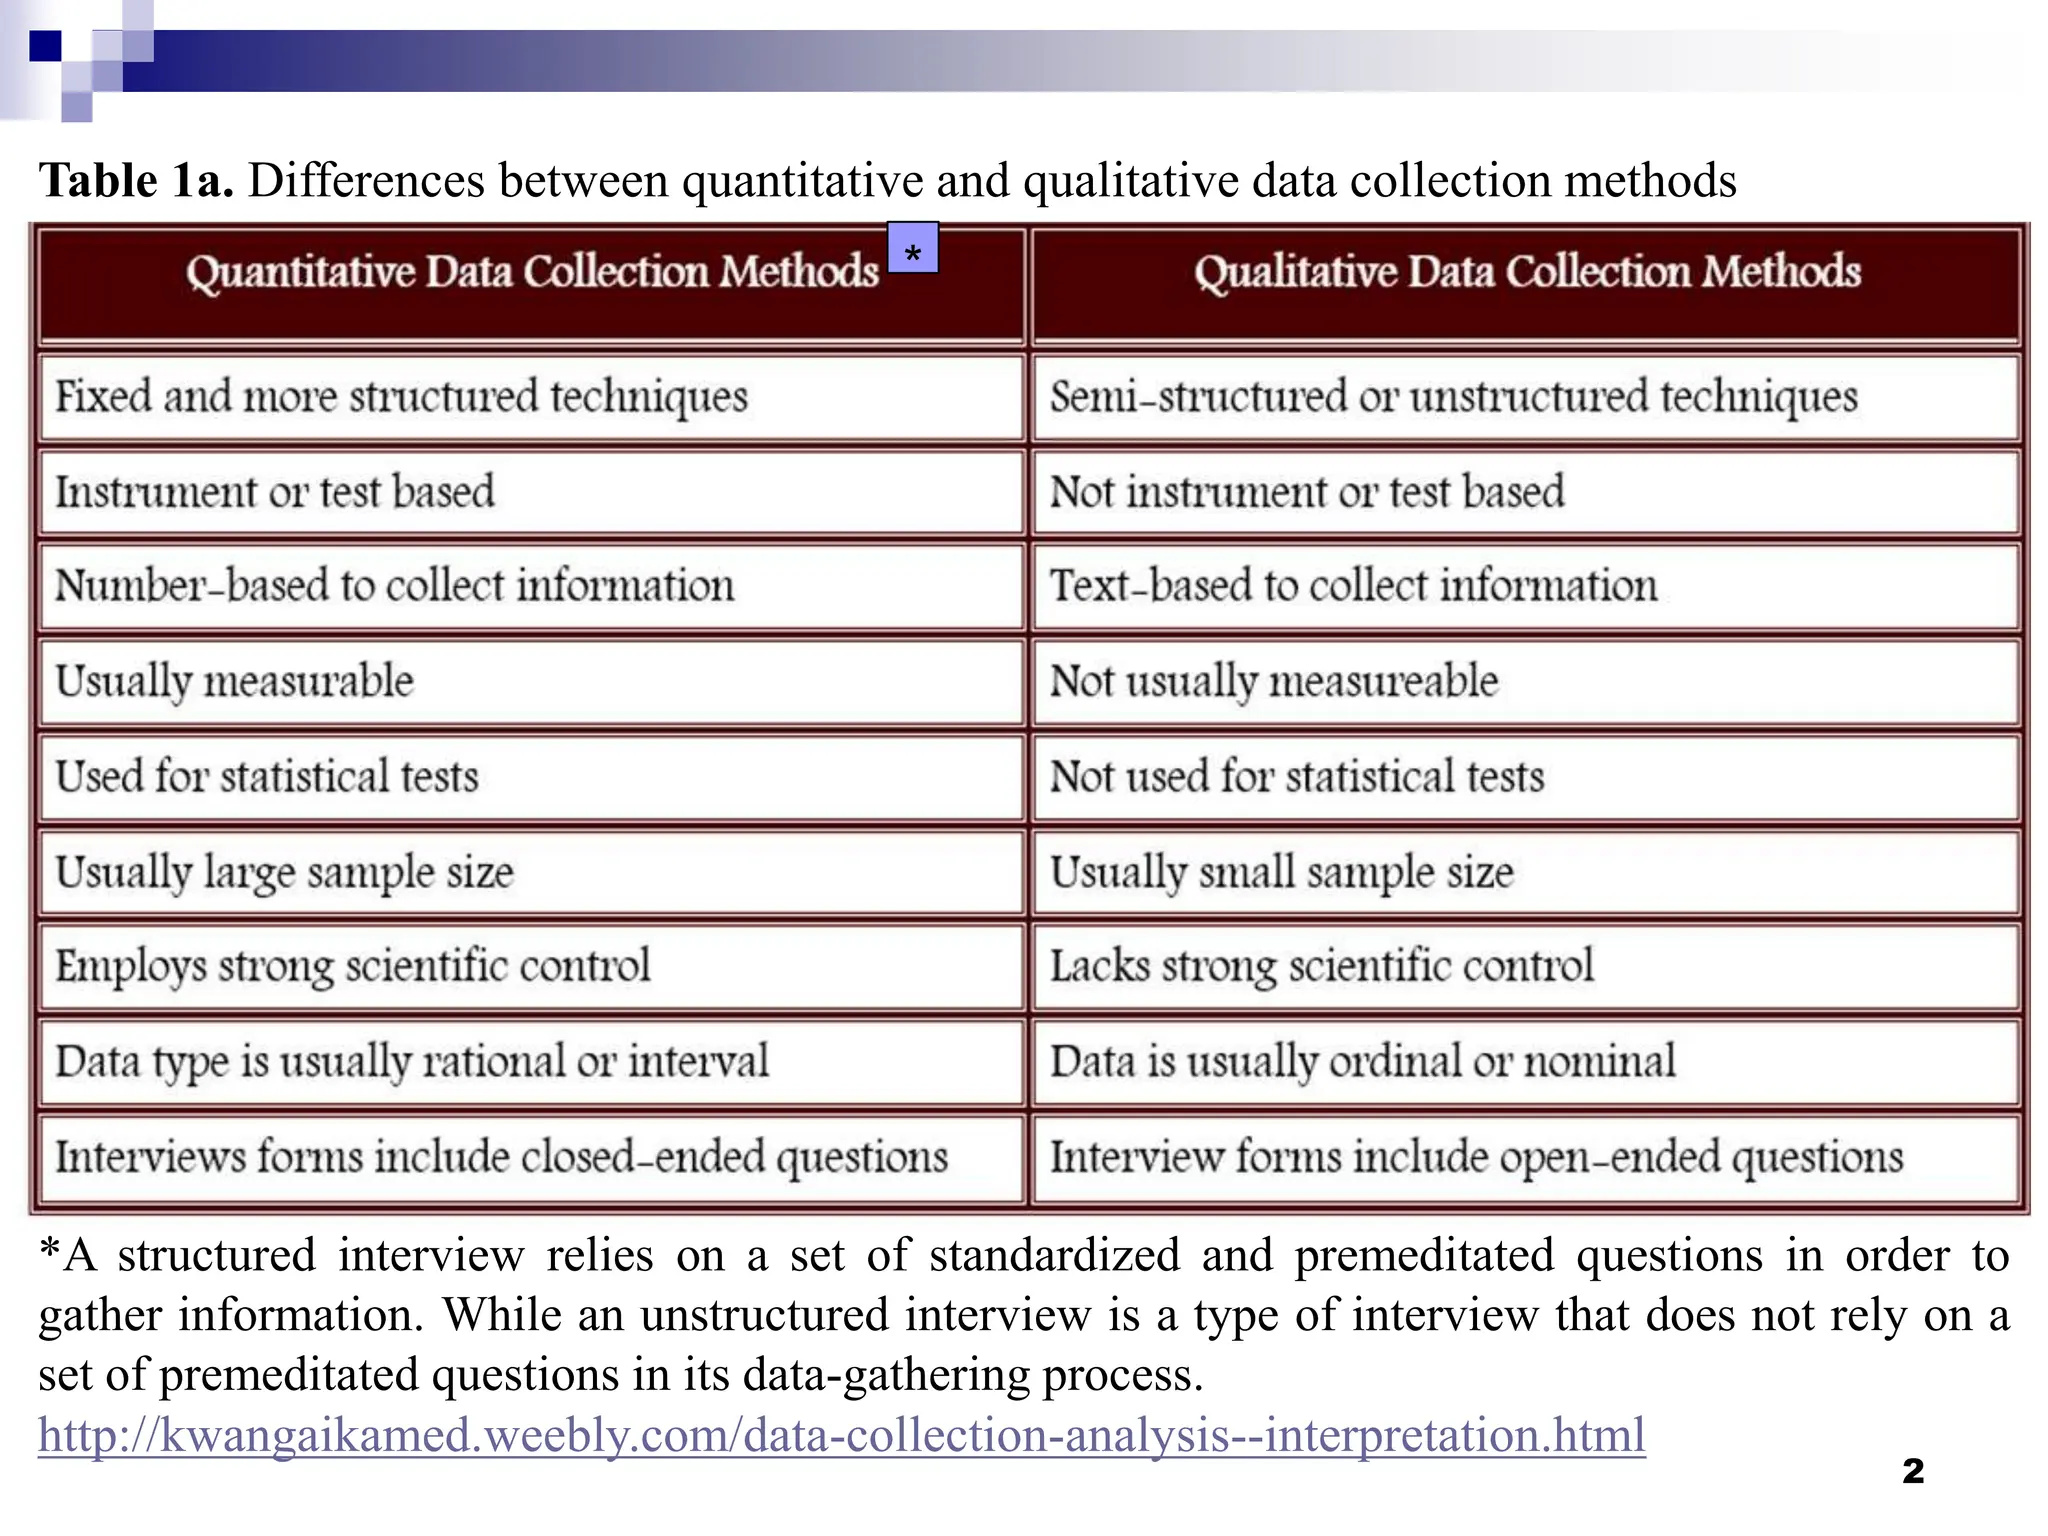
    Table 1a. Differencesbetween quantitative and qualitative data collection methods 2 *A structured interview relies on a set of standardized and premeditated questions in order to gather information. While an unstructured interview is a type of interview that does not rely on a set of premeditated questions in its data-gathering process. http://kwangaikamed.weebly.com/data-collection-analysis--interpretation.html *
  • 3.
    3 Table 1b. Qualitativevs. quantitative data: what's the difference? https://www.fullstory.com/blog/qualitative-vs-quantitative-data/
  • 4.
    Introduction to Research (ScientificInquiry)  Each strategy of inquiry - true experiment, quasi-experiment or non-experiment employs several unique ways of data collection tools  Some of which are given in the following figure Fig 1 Down Loaded from Web o Qualitative Research Approach-Data Collection  In qualitative research approach  Data collection is usually unstructured and data is collected for non-numerical analysis  Usually, the methods of data collection all the strategies of qualitative inquiry-ethnography, phenomenological, grounded theory, narrative and case studies-are similar 4
  • 5.
    Fig 1. Quantitativedata collection. http://kwangaikamed.weebly.com/data-collection- analysis--interpretation.html 5
  • 6.
     Also, inqualitative research, multiple methods of data collection or collection of data from multiple sources is practiced  This is called triangulation and is employed in order to collect data that  provide sufficient data  provide more information on a phenomenon or  enhance deeper analysis and understanding of a research study  Types of triangulation may include  method triangulation  source triangulation  analysis triangulation and 6
  • 7.
     even theorytriangulation (Denzin, 1978; Patton, 1999)  All forms of data gathering done in a research study form what is known as a bricolage - a French for DIY or "do-it- yourself projects"  Main forms of data collection under each strategy are given in the following chart: Fig 2 Down Loaded from Web o Data Analysis and Interpretation Figs 3 and 4 Down Loaded from Web  After identifying  a research topic  doing a literature background research 7
  • 8.
    Fig 2. Qualitativedata collection. http://kwangaikamed.weebly.com/data-collection-analysis-- interpretation.html 8
  • 9.
    Fig 3. Dataanalysis - Vague questions. 9
  • 10.
    Fig 4. Dataanalysis with clarity. 10
  • 11.
     establishing philosophicalassumptions and focus problem  deciding on an appropriate research paradigm (hypothesis) and methodology with specific purpose  designing a research plan and collecting sufficient data  the next step in the research process is data analysis and interpretation  which precedes reporting of research  Therefore data analysis is a process that involves  examining and molding collected data for interpretation to  discover relevant information  draw or propose conclusions and 11
  • 12.
    .  support decision-makingto solve a research problem  This involves interpreting data to answer research questions and making research findings be ready for dissemination  Data analysis also serves as a reference for future data collection and other research activities  During data analysis (Bala, 2005):  data collected is transformed into information and knowledge about a research performed  relationships between variables are explored  meanings are identified and information is interpreted 12
  • 13.
     Like otherresearch methods, data analysis procedures in quantitative research approach are different from those in qualitative research approach  The general differences of data analysis procedures between these two approaches are summarized in the Chart (Bala, 2005) and a Table Chart 5 Down Loaded from Web Table 2 Down Loaded from Web  Now we briefly describe some specific methods of data analysis under each approach o Quantitative Research Approach - Data Analysis  Statistical analysis is the usual method used in quantitative research approach 13
  • 14.
    Chart 5. Dataanalysis procedures. http://kwangaikamed.weebly.com/data-collection-analysis- -interpretation.html (Theory of interpretation) (Related to signs and symbols) Istiarah 14
  • 15.
    Table 2. Generaldifferences of data analysis procedures between these two approaches. 15
  • 16.
     However, quantitativedata can be analyzed in several ways  Data collected has a certain level of measurements which initially influences the analysis  The identification of a particular level of measurement is the usually the first step in quantitative data analysis  The four levels of measurements include (Yamashita & Espinosa, 2015)  Nominal Data: basic classification data; lack logical order - e.g. male or female  Ordinal Data: has logical order but lack constant differences between values - e.g. Pizza size (large, medium, small) 16
  • 17.
     Interval Data:has logical order, is continuous, has standardized differences between values but lacks natural zero - e.g. Celsius degrees  Ratio Data: has logical order, is continuous, has standardized differences between values, and has a natural zero - e.g. height, weight, age, length  After identifying a level of measurement, the next step is now to use a specific analysis technique in analyzing data  There are several procedures that can be used to analyze data  Main ones include (Yamashita & Espinosa, 2015): 17
  • 18.
    o Data Tabulation- e.g. frequency distributions and percent distributions o Data Descriptive - Mean, median, mode, minimum and maximum values, etc. o Data Disaggregation - tabulation of data across multiple categories o Moderate and Advanced Analytical Methods - (regression, correlation, variance analysis)  The above methods can be used invariably by all different true experimental, quasi-experimental and non-experimental quantitative research strategies 18
  • 19.
    o Qualitative ResearchApproach - Data Analysis  Textual data analysis is the usual method used in qualitative research approach  This involves identifying patterns and themes in data collected and then  examining and interpreting these patterns and themes  to draw meaning and answer research questions  The five strategies of qualitative research mentioned:  Ethnography - the scientific description of peoples and cultures with their customs, habits, and mutual differences 19
  • 20.
    20  Phenomenological -to explain the nature of things through the way people experience them  Grounded theory - attempts to unravel the meanings of people's interactions, social actions, and experiences  Narrative and case studies - to explore and conceptualize human experience as it is represented in textual form  However, preliminary and some general steps in data analysis are common to all. These include (Yamashita & Espinosa, 2015): i. Immediate processing and recording of data (important information, date/time details, observations, etc.) ii. Commencement of data analysis soon after collection
  • 21.
    . iii. Reductionof data to meaningful information iv. Identification of meaningful patterns and themes” via  Content analysis achieved by: ▫ Coding the data for certain words or content ▫ Identifying their patterns ▫ Interpreting their meanings  Thematic analysis achieved by ▫ grouping data into themes that answers research problem v. Display of data which include organizing data in forms of graphics, maps, tables, etc., to draw conclusions vi. Drawing of conclusion and verification 21
  • 22.
     Graphical representationis a way of analyzing numerical data  It exhibits the relation between data, ideas, information and concepts in a diagram  It is easy to understand and it is one of the most important learning strategies  It always depends on the type of information in a particular domain  There are different types of graphical representation. Some of them are as follows  Line Graphs - Linear graphs are used to display the continuous data and it is useful for predicting the future events over time  Bar Graphs - Bar Graph is used to display the category of data and it compares the data using solid bars to represent the quantities 22
  • 23.
     Histograms -The graph that uses bars to represent the frequency of numerical data that are organized into intervals  Since all the intervals are equal and continuous, all the bars have the same width  Line Plot - It shows the frequency of data on a given number line  ‘ x ‘ is placed above a number line each time when that data occurs again  Frequency Table - The table shows the number of pieces of data that falls within the given interval  Circle Graph - Also known as pie chart that shows the relationships of the parts of the whole 23
  • 24.
     The circleis considered with 100% and the categories occupied is represented with that specific percentage like 15%, 56% etc.  Stem and Leaf Plot - In stem and leaf plot , the data are organized from least value to the greatest value  The digits of the least place values from the leaves and the next place value digit forms the stems  Box and Whisker Plot - The plot diagram summarizes the data by dividing into four parts  Box and whisker shows the range (spread) and the middle (median) of the data Figs 4A and B and 5A, B and C Down Loaded from Web 24
  • 25.
    25 Fig 4A. Displayof data by different types of graphical presentation. https://byjus.com/maths/graphical-representation/
  • 26.
    26 Fig 4B. Displayof data by different types of graphical presentation. https://byjus.com/maths/graphical-representation/
  • 27.
    27 Fig 5A. Graphicalrepresentation of analyzed survey data on working conditions within biomedical research in the UK. https://www.blendspace.com/lessons/b_GC7HHbxB68Tw/topic-using-graphs-to-display- data-in-graphical-ways
  • 28.
    28 Fig 5B. Graphicalrepresentation of analyzed survey data on working conditions within biomedical research in the UK. https://www.blendspace.com/lessons/b_GC7HHbxB68Tw/topic-using-graphs-to-display-data- in-graphical-ways
  • 29.
    Fig 5C. Graphicalrepresentation of analyzed survey data on working conditions within biomedical research in the UK. https://www.blendspace.com/lessons/b_GC7HHbxB68Tw/topic-using-graphs-to-display- data-in-graphical-ways 29
  • 30.
    o Data Interpretation “All meanings, we know, depend on the key of interpretation” - George Eliot (Pen name of an English Victorian novelist, Mary Ann Evans known for the psychological depth of her characters and her descriptions of English rural life)  Methods of Data Interpretation  Direct visual observations of raw data  After organizing the data in tables  After making graphical representations  After calculations using numerical/statistical methods  Data  Data is known to be crude information and not knowledge by itself  The sequence from data to knowledge is  from data to information 30
  • 31.
     from Informationto Facts and finally  from Facts to Knowledge  Data becomes information, when it becomes relevant to your decision problem  Information becomes fact, when the data can support it  Facts are what the data reveals  However the decisive instrumental (i.e. applied) knowledge is expressed together with some statistical degree of confidence  Fact becomes knowledge, when it is used in the successful completion of a decision process  Massive amount of facts are integrated as knowledge Fig 6 Down Loaded from Web 31
  • 32.
    Fig 6. Levelsthrough which data becomes knowledge. https://www.slideshare.net/bala1957/research-data-interpretation 32 Transforming Data into Knowledge: To be effectively used in making decisions, data must go through a transformation process that involves six basic steps: 1) Data collection 2) Data organization 3) Data processing 4) Data integration 5) Data reporting and finally 6) Data utilization
  • 33.
     Why Interpretation? Interpretation is essential for the simple reason that the usefulness and utility of research findings lie in proper interpretation  It is being considered a basic component of research process  Researcher must pay attention to the following points for correct interpretation: i. At the start, researcher must invariably satisfy himself that (a) the data are appropriate, trustworthy and adequate for drawing inferences (b) the data reflect good homogeneity and that (c) proper analysis has been done through statistical methods 33
  • 34.
    ii. The researchermust remain cautious about the errors that can possibly arise in the process of interpreting results  One should always remember that even if the data are properly collected and analyzed  wrong interpretation would lead to inaccurate conclusions  Therefore, it is absolutely essential that the task of interpretation be accomplished with patience in an impartial manner and also in correct perspective  Data Interpretation Methods o Data interpretation may be the most important key in proving or disproving your hypothesis o It is important to select the proper statistical tool to make useful interpretation of data 34
  • 35.
     If animproper data analysis method has been selected, the results may be suspected and lack credibility  Decision making process must be based on data neither on personal opinion nor on any belief  What is Statistical Data Analysis?  Data are not information!  To determine what statistical data analysis is, one must first define statistics  Statistics is a set of methods that are used to collect, analyze, present, and interpret data  Kinds of Statistical Analysis  Frequency distributions 35
  • 36.
     Graphs andgraphing  Measures of central tendency and variability  Measures of relations  Analysis of differences  Analysis of variance and related methods  Profile analysis  Multivariate analysis o Drawing Conclusions  The final step in the research process, conclusion provides a significant and vital opportunity  to explain to the reader exactly what the research means to the various audiences who have an interest in the research i.e.36
  • 37.
     significance ofstudy  The conclusion provides the potential  to explore in depth and detail the broader implications of the findings ▫ while stating the limitations of the research ▫ clearly describing the parameters and ▫ recommendations for future research x------------------x------------------x-------------------x 37