This document discusses using k-means clustering to analyze urban road traffic stream data. Stream data arrives continuously over time and is challenging to process due to its high volume, velocity and volatility. The document proposes using a sliding window technique with k-means clustering to analyze recent urban traffic data and visualize clusters in real-time to provide insights into traffic patterns and congested roads. This analysis could help travelers and authorities respond to traffic issues more quickly.
![Mining Stream Data using k-Means clustering Algorithm
1
Medi Manishankar, 2
Dr. K. Venkateswara Rao
1
PG Scholar in CSE, CVRCE, Hyderabad, India,
manishankarmedi@gmail.com
2
Professor of CSE, CVRCE, Hyderabad, India,
kvenkat.cse@gmail.com
Abstract-Stream data is the data coming continuously with time-stamped sequences. It may come from
various locations with varying update rates and with high dimensionality. With the reason, stream data flows fast
and changes quickly, sometimes it may not be possible to process every element, and storage is also a typical
issue. Numerous methods such as random sampling, sliding windows and histograms are available to handle
stream data. Stream data has many applications such as Traffic data analysis, Telecommunications and network
data analysis, stock market data analysis. Data mining techniques such as association analysis, classification and
clustering are generally used for stream data analysis. In this paper, k-means clustering algorithm is used for
mining urban road traffic stream data of a particular city. The stream data is handled using sliding window
technique. The clusters are shown graphically using visualization techniques in python. The clusters are updated
in-real-time to enable people to understand behavior of the traffic. The results are described in this paper.
Keywords: Stream data, clustering, sliding windows, k-Means clustering, urban road traffic
1. INTRODUCTION
In this era of big data, the data is produced at
extremely high speed and in huge volumes. In many
cases the data is in the form of data streams, making
the approach of storing and querying the data
offline is infeasible. According to the Digital
Universe study [3] over 2.8ZB of data were created
and processed in 2012, with a projected increase of
15 times by 2020. This growth in the production of
digital data results from our surrounding
environments equipped with lot of sensors. The
sensors sense the information and send various
parameters forcing it need to be analyzed online.
In contrast, a data stream is large volume [9] of
data arriving continuously with a time stamp and it
is either unnecessary or impractical to store the data
in some form of memory.
For many recent applications [3], the word data
stream is best suitable than a dataset. Examples of
domains producing stream data are
Telecommunications and networking, Stock
marketing, e-commerce and etc. Considering
telecommunications; it needs to analyze the calling
records, Weblogs and Web page clicks as they arrive
continuously. Stream data, having characteristics
such as it comes continuously, is difficult to handle
due to its characteristics such as it temporally
ordered, fast-changing and potentially infinite.
So the biggest challenge in stream data is
handling it before it is going to be expired [3], [4],
and performing required analysis. In handling, we
have to consider the single scan best output
algorithm since multiple scans are not possible in
the stream data. Sometimes stream data is likely to
have high dimensionality as the number of
attributes for each record in some large,
multipurpose applications like satellite mounted
remote sensors, real-time robotic applications. And
For each record, there might be a chance of the
high range of possible values for each attribute.
International Journal of Research
Volume 7, Issue IX, September/2018
ISSN NO: 2236-6124
Page No:390](https://image.slidesharecdn.com/cjgr1xh4rwjqg6vwokwx-signature-81e9106f9331e97f2cd610c13875e81bdf75d2a7e7ee686c1762d3f6b57f158b-poli-180927203411/75/Mining-Stream-Data-using-k-Means-clustering-Algorithm-1-2048.jpg)
![For effective processing of stream data, new
data structures, techniques, and algorithms are
needed. Because we do not have an infinite amount
of space to store stream data, we often do tradeoff
between accuracy and storage. That is, we generally
are willing to settle for approximate rather than
exact solutions. Many data stream based algorithms
compute an approximate answer within a factor e of
the actual answer, with high probability. Generally,
as the approximation factor goes down, the space
requirements go up. Some common data structures
and techniques used for stream data processing are
sliding window, random sampling, and histograms
[1], [10].
Throughout the stream data processing
techniques, the sliding window is the feasible
technique since it makes decisions based on recent
data instead of running computations on all of the
data seen so far. And it runs computations in main
memory. So, these criteria result in effective and
reducing memory usage which helps in limiting
storage consumption. The main problem in data
stream mining is discovering knowledge or trends
using supervised or unsupervised learning
techniques. In unsupervised learning, clustering
leads to the discovery of hidden information.
Clustering can be defined as the grouping of
similar objects based on their properties (attributes).
Clustering should be done in such a way that the
objects are very similar with the other objects within
the same cluster and dissimilar with objects in the
other clusters.
This paper describes clustering of urban road
traffic stream data. Our objective is visualization
and discovering density of the traffic. This will helps
the users who traveling in the urban road getting to
know the busy roads and for the traffic authorities
to keep track of road traffic in real time, to make
decisions in less time to avoid traffic congestion.
Updating visual graphs in real-time to enable people
to easily understand traffic patterns.
2. STREAM DATA PROCESSING
In the following sections, we discuss stream
data processing techniques, applications, challenges,
and issues. Data Stream Management Systems also
discussed.
2.1 Techniques for Stream Data Processing
For processing stream data there exist,
numerous methods present like random sampling
[1], [10], [11] by taking a sample of data from the
entire data stream reservoir sampling is the inside
technique in the random sampling , sliding window
performing computations on recent data [2], [9],
partitioning histograms which involves the data
stream in to buckets and further process.
In the sliding window concept, the main idea is
instead of running computations on all the data so
far, it runs computations on the recent data and
makes decisions [1]. More formally, at every time t,
a new data element arrives. This element “expires”
at time t +w, where w is the window “size” or
length.
The sliding window model is useful for stocks
or sensor networks, where only recent events are
important. It also reduces memory requirements
because only a small window of data is stored. In
the sliding window, there are two types of methods
present: Count- based sliding window and time-
based sliding window. In the count based sliding
window, we fix the number of records to be
processed at one pass, and in the time stamp sliding
window, after how much time new records to be
entered into sliding window will mentioned.
Clustering streaming data is particularly challenging
because it involves dynamically merging and
splitting evolving clusters over which statistical
summaries are maintained in real-time as the stream
progresses [2].
2.2 Data Stream Processing Applications,
Challenges, and Issues
In the recent days, many applications [4], [5] are
producing massive amounts of data.
International Journal of Research
Volume 7, Issue IX, September/2018
ISSN NO: 2236-6124
Page No:391](https://image.slidesharecdn.com/cjgr1xh4rwjqg6vwokwx-signature-81e9106f9331e97f2cd610c13875e81bdf75d2a7e7ee686c1762d3f6b57f158b-poli-180927203411/75/Mining-Stream-Data-using-k-Means-clustering-Algorithm-2-2048.jpg)
![For example, Telecommunications and network area,
where the central database system keep tracking on
user calling records, web clicks, network
monitoring, fraud calls, call drops and etc.., With all
these data as they arrive online need to be analyzed
in order to make decisions which leads to rectifying
the problems in real time.
In the Business area, it is very common in the
financial market or stock market number of buyers
and sellers performing the actions by exchanging
equities. So, there need to analyze the data in the
real-time to give knowledge to the people about the
trends in the stock market.
In the urban road traffic, numbers of vehicles are
traveling on the road. With the IoT comes into the
real world, automobiles equipped with advanced
sensors that help in collect data useful for stream
data analysis which lead us to discover knowledge
on density areas in the real-time road traffic, and
decision making in modifications of signaling
systems for hassle-free traveling to the users.
But, while dealing with stream data there are
some challenges and issues arises that data is
coming from complex environments with
continuous flow and high dimensionality.
Sometimes there might be missing data in some
records. So, here three principal challenges [3] are
involving: Volume, Velocity, and Volatility. Here
data preprocessing is important to avoid noisy data,
redundant data, outlier elimination and fill fabricate
missing values.
However, some other challenges [4] also to be
mentioned are
• Data Uncertainty
• Data type treatment
• Cluster validity
• High Dimensionality of Data.
2.3 Data Stream Management Systems (DSMS)
For processing stream data, Data stream
management is needed. DataStream Management
systems are software systems that manage and
support querying of continuous data streams. In
Data stream management system, it handles the data
as input and processes it with the help of query
processor stores the results in the databases.
Data stream management systems [2] [7] emerge
to support a large class of applications such as stack
trade marketing, network traffic monitoring, sensor
data analysis, real-time data warehousing, etc..,
DSMS process continues queries over a high
volume and time-varying data streams. In a
Continuous Query (CQ) system, a user registers
queries specifying their interests over unbounded,
streaming data sources.
A query engine continuously evaluates the
query results such as a new data arrives from the
sources and delivers unbounded streaming outputs
to the appropriate users. A core operator in a CQ
system is sliding window join among streams.
The following figure depicts the DSMS
architecture.
Fig 1 Data stream Management Systems (DSMS)
Various components of the DSMS are as follows.
Local DB- summary data, historical data, Indices.
Meta-database stores schema used to express queries.
The local database maintains in main memory data
representing current data summaries as well as
historical data using main-memory indexes for
efficient search.
The continuous query processor optimizes and executes
continuous queries over the data streams by
accessing the meta-data and the local database.
Continuous queries can span both streaming and
local data.
International Journal of Research
Volume 7, Issue IX, September/2018
ISSN NO: 2236-6124
Page No:392](https://image.slidesharecdn.com/cjgr1xh4rwjqg6vwokwx-signature-81e9106f9331e97f2cd610c13875e81bdf75d2a7e7ee686c1762d3f6b57f158b-poli-180927203411/75/Mining-Stream-Data-using-k-Means-clustering-Algorithm-3-2048.jpg)
![But, there are some requirements to achieve
efficiency with DSMS that affects scalability issues.
Those are
1. Arriving elements have to be processed on the fly.
2. Processing data streams on a single pass or scan on
data.
3. Processing engine needs to have low latency and
high throughput.
4. For high streams rates and large window sizes, a
sliding window join might consume a large amount
of memory to store tuples.
3. DATA STREAM CLUSTERING
Clustering is the process of grouping similar
objects into the same group. A cluster is a collection
of data objects that are similar to one another with in
the same cluster and are dissimilar to the objects in
other clusters. Clustering algorithms, in general,
have been categorized into five types: partitioning,
hierarchical, density-based, grid-based, and model-
based. Due to the need of computation on the data
in a single scan, partitioning based algorithms are
best suitable which are based on Divide-and-
Conquer strategy (One scan Divide-and- Conquer
approaches have been widely used to cluster data
streams [6]).
In Partitioning based techniques, K-Means
and K-Medoids [1] [6], are very popular in the data
mining world. Recently, Alkermann proposed an
online K-Means algorithm by maintaining a small
sketch of the input using the merge reduce
technique. K-means algorithm is the best suitable
algorithm while dealing with numerical data. If
variables are huge, then K-Means is most of the
times computationally faster than hierarchical
clustering, if we keep ‘k’ small.
3.1 k-Means Clustering Algorithm for Stream
Data Processing
Below are the main steps in K-Means clustering
algorithm.
Algorithm: k-Means Clustering Algorithm
Input: D={r1, r2, r3, …,rn} and K value
Output: K clusters
Method:
Initialize mean values for K-clusters randomly;
Say m1, m2, m3, …, mk;
Repeat
Assign each record in D to the cluster based on
similarity;
Calculate new mean for each cluster;
Until convergence criteria are met;
Following flow chart in Fig 3 describes the
algorithm.
Fig 3 k-Means clustering algorithm flow chart
While performing clustering of data with the k-
Means clustering algorithm, first it need to set the
‘k’ value. It is known as number of clusters. After
fixing of k value, initialize the centroid values of
each cluster with a random value. For mining urban
road traffic, it is needed to take two-coordinate
values as the location has two coordinates in two
dimensional views. Say, for each cluster set a cluster
centroid value C(x, y). Here, centroid is a data point
(imaginary or real) at the center of a cluster.
Here, in clustering first, it randomly selects k of
the objects, each of which initially represents a
cluster mean or center. For each of the remaining
objects, an object is assigned to the cluster to which
it is the most similar, based on the distance between
the object and the cluster mean. The distance can be
calculated by using equation (1).
International Journal of Research
Volume 7, Issue IX, September/2018
ISSN NO: 2236-6124
Page No:393](https://image.slidesharecdn.com/cjgr1xh4rwjqg6vwokwx-signature-81e9106f9331e97f2cd610c13875e81bdf75d2a7e7ee686c1762d3f6b57f158b-poli-180927203411/75/Mining-Stream-Data-using-k-Means-clustering-Algorithm-4-2048.jpg)
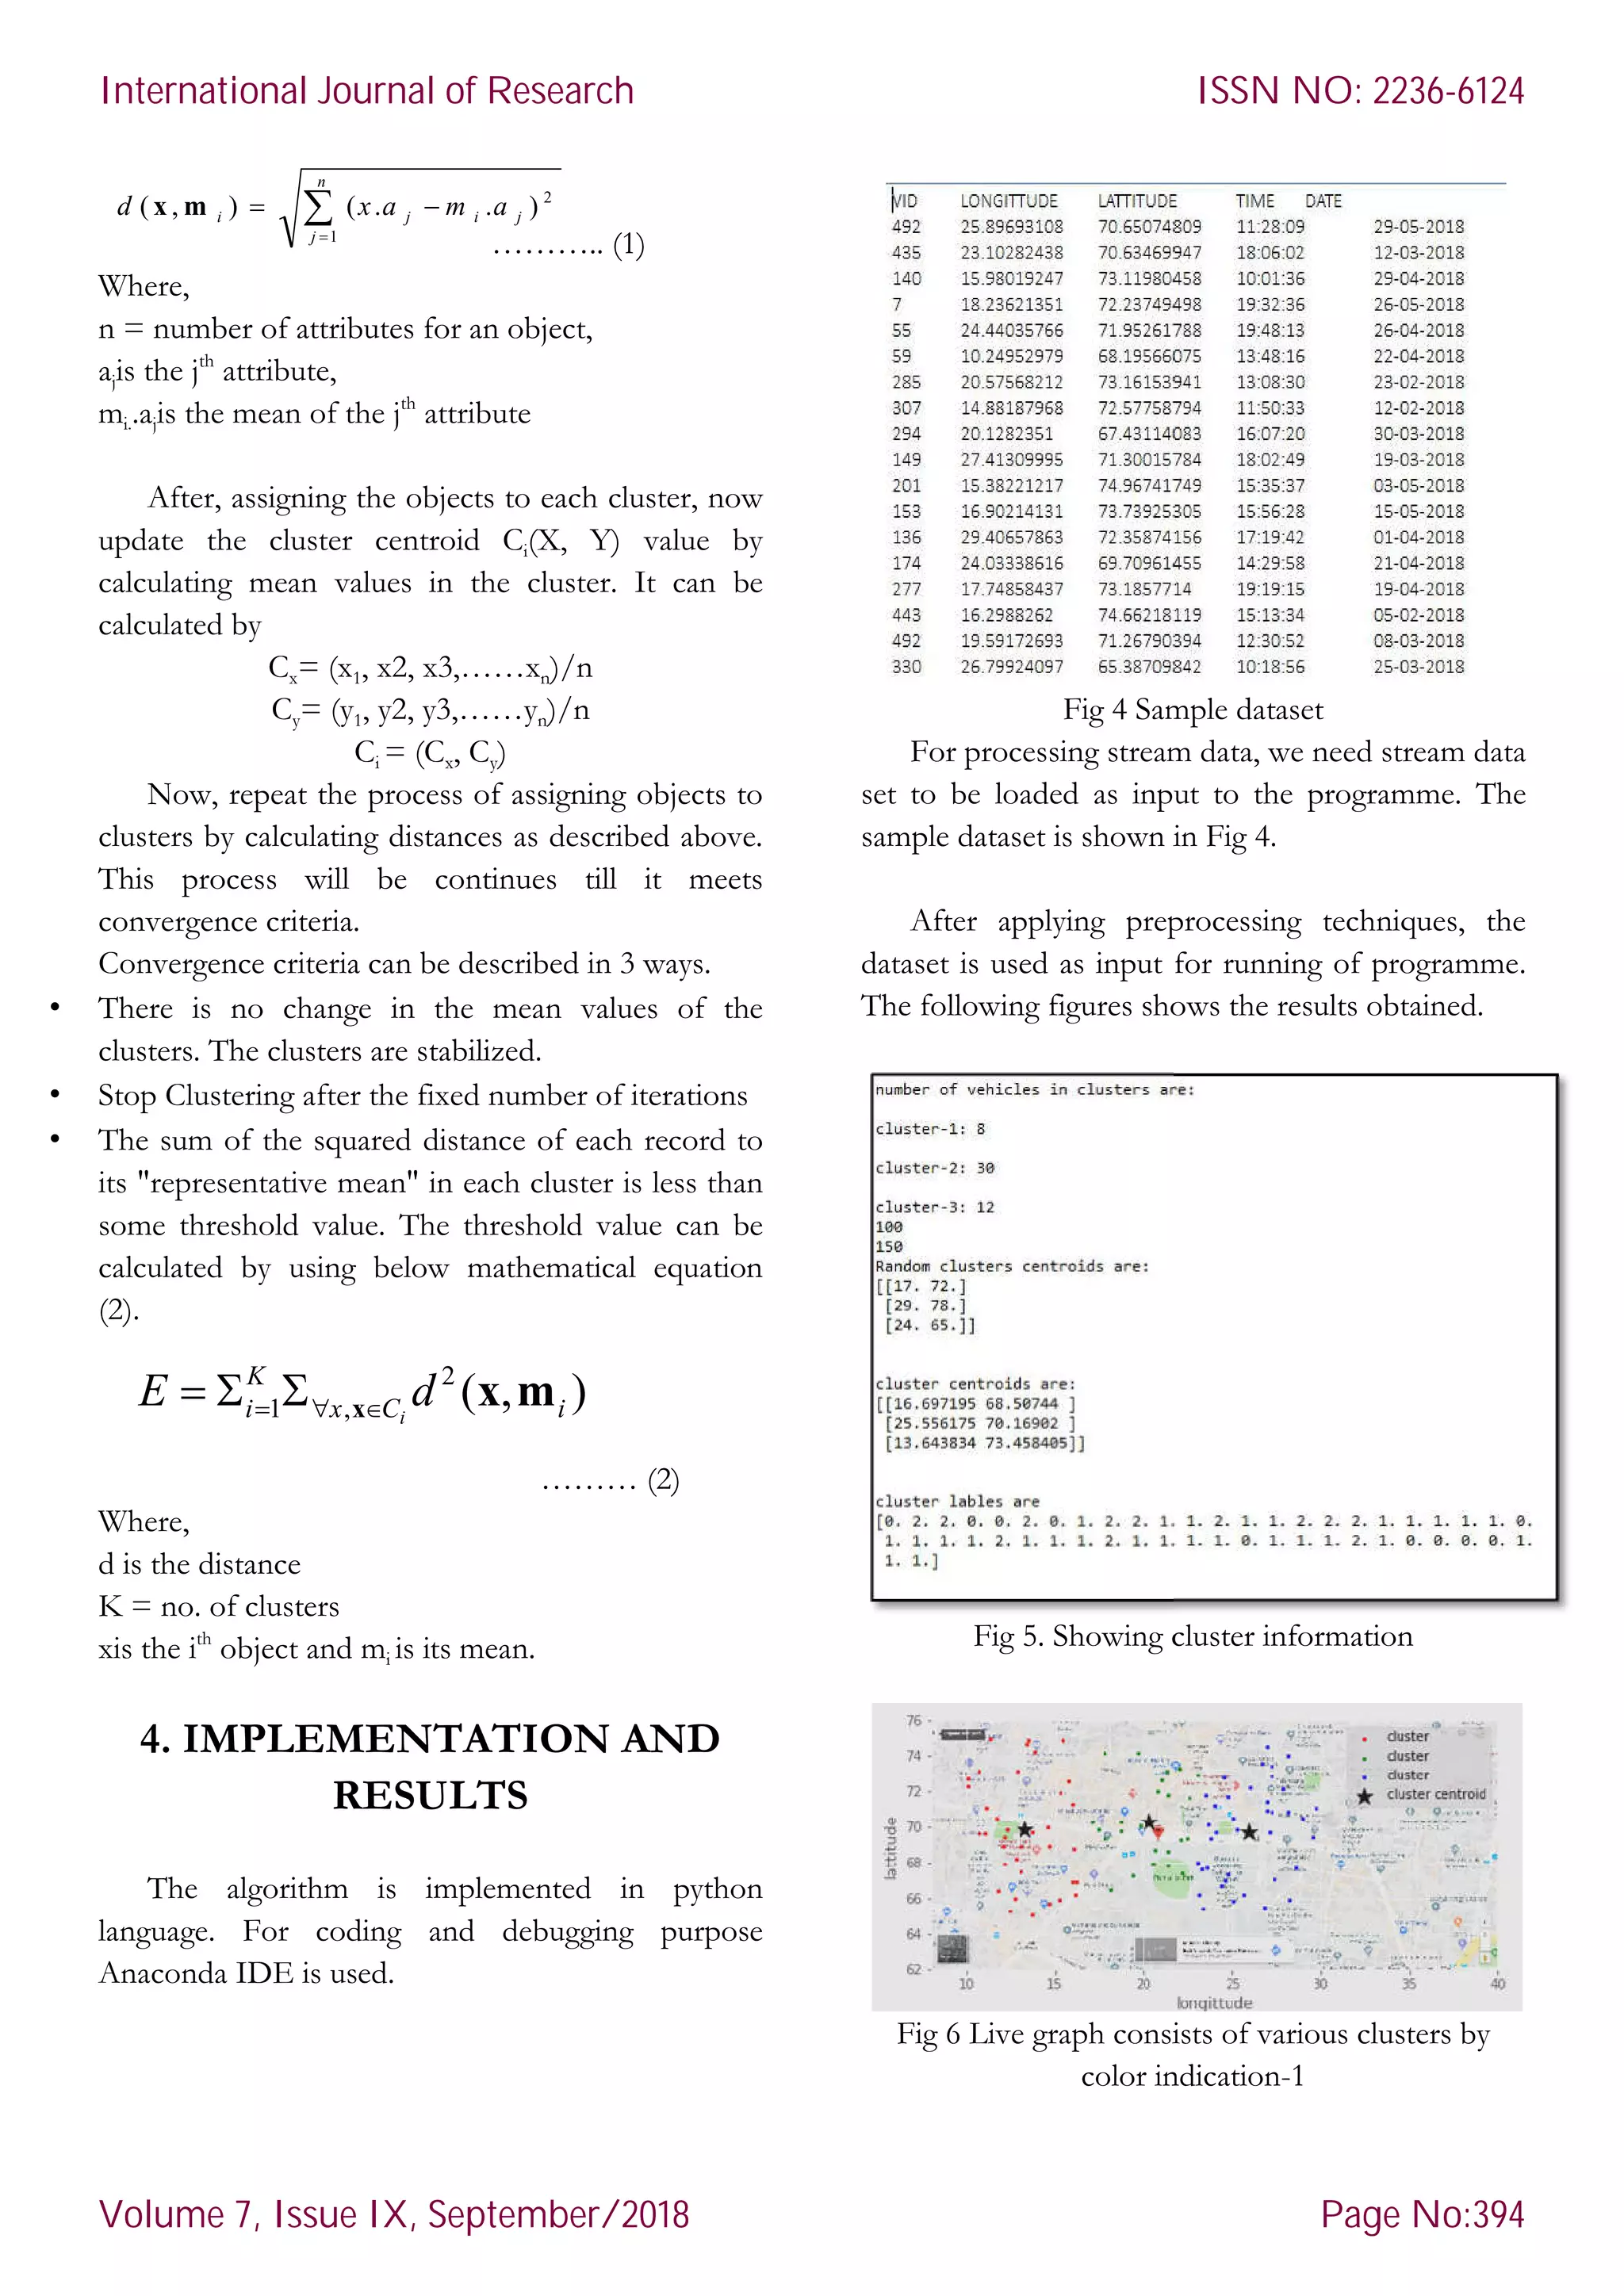
![Here, in fig 5, it shows the cluster
after processing the data stream. In fig 6 and fig 7, it
shows live traffic updates in graphs format. In fig 8,
the database table is shown which stores the results
after real-time clustering is done.
Fig 7 Live graph consists of various clus
color indication-2
Fig 8 Stream database log table
CONCLUSION
In this paper, working of k-Means
algorithm for processing stream data is
is implemented using python language.
help of matplotlib dependency, graph
for visualization. Clusters information is shown as
textual data. The cluster densities are shown as
visual graphs. The results obtained are encouraging.
Only numerical data type attributes
present. There is a scope for improving the
considering more types of data (categorical, ordinal,
hybrid and etc..,).
REFERENCES
[1] Jiawei Han and Michelin Kamber ,”Data mining Concepts
and techniques”, second edition, Pg No. 383-
Here, in fig 5, it shows the cluster information
after processing the data stream. In fig 6 and fig 7, it
shows live traffic updates in graphs format. In fig 8,
the database table is shown which stores the results
ph consists of various clusters by
8 Stream database log table
Means clustering
algorithm for processing stream data is discussed. It
is implemented using python language. With the
graphs are drawn
Clusters information is shown as
textual data. The cluster densities are shown as
are encouraging.
are used at
ing the work by
considering more types of data (categorical, ordinal,
Data mining Concepts
-531, 2006.
[2] Sobhan Badiozamany, “Real
over sliding windows, Digital Comprehensive Summaries of
Uppsala Dissertations from the Faculty of Science and
Technology 1431”, ISBN 1651
[3] Georg Krempel, Ammar Shaker,
Data Stream Mining Research, IEEE transa
data”, vol 16, 1-9, pp. 2013.
[4] MadjidKhalilian, Norwati Mustapha, "
stream Clustering: Challenges and Issues"
[5] T. SoniMadulatha, “ACIJ:
algorithms”, vol. 2, 151-160, pp. 2011.
[6] Xiangliang Zhang, Cyril Furtlehner, Cécile Germain
Renaud, and MichèleSebag, "
knowledge and data engineering:
with Affinity Propagation", vol. 26, 1644
[7] Abhirup Chakraborty , School of Informatics and Computer
Science, Ajit Singh Department of Electrical and Computer
Engineering, “IEEE transactions,
Stream Joins In A Shared-Nothing Cluster"
[8] Springer Link, “Evolution of real
based on data stream mining"
[9] Fabio Fumarola, Anna Ciampi, Annalisa Appice, Donato
Malerba, “A Sliding Window Algorithm For Relational
Frequent Patterns Mining From Data Streams”
[10] Rayane El Sibai. “International Conference on Digital
Economy (ICDEc): Sampling Algorithms in Data Stream
Environments,pp. 2016.
[11] Srikanta Tirthapura1 and David P. Woodruff2, “
Random Sampling from Distributed Stream
Medi Manishankar
Masters of Technology in CVR
College of Engineering,
Hyderabad, India in Computer
Science
specialization. He will complete his
PG in 2018.
Dr. K. Venkateswara Rao
working as a professor in
Department of Computer
Science and Engineering at
CVR College of Engineering
Hyderabad since 2005.
Real-time data stream clustering
over sliding windows, Digital Comprehensive Summaries of
Uppsala Dissertations from the Faculty of Science and
1651-6214, pp. 2016.
Georg Krempel, Ammar Shaker, “Open Challenges for
Data Stream Mining Research, IEEE transactions on BIG
9, pp. 2013.
MadjidKhalilian, Norwati Mustapha, " IMECS: Data
stream Clustering: Challenges and Issues", vol. 1,pp. 2010.
ACIJ:Overview of Stream data
160, pp. 2011.
ang, Cyril Furtlehner, Cécile Germain-
Renaud, and MichèleSebag, "IEEE transactions on
knowledge and data engineering: Data Stream Clustering
vol. 26, 1644-1656.
Abhirup Chakraborty , School of Informatics and Computer
Ajit Singh Department of Electrical and Computer
IEEE transactions, Parallelizing Windowed
Nothing Cluster", pp. 2013.
Springer Link, “Evolution of real-time traffic applications
based on data stream mining"
arola, Anna Ciampi, Annalisa Appice, Donato
Malerba, “A Sliding Window Algorithm For Relational
Frequent Patterns Mining From Data Streams”,.
International Conference on Digital
Sampling Algorithms in Data Stream
Srikanta Tirthapura1 and David P. Woodruff2, “Optimal
Random Sampling from Distributed Stream Revisited”.
Manishankar is pursuing his
Masters of Technology in CVR
College of Engineering,
, India in Computer
Science and Engineering
specialization. He will complete his
Venkateswara Rao is
working as a professor in
Department of Computer
Science and Engineering at
CVR College of Engineering,
Hyderabad since 2005.
International Journal of Research
Volume 7, Issue IX, September/2018
ISSN NO: 2236-6124
Page No:395](https://image.slidesharecdn.com/cjgr1xh4rwjqg6vwokwx-signature-81e9106f9331e97f2cd610c13875e81bdf75d2a7e7ee686c1762d3f6b57f158b-poli-180927203411/75/Mining-Stream-Data-using-k-Means-clustering-Algorithm-6-2048.jpg)


![[IJCT-V3I2P32] Authors: Amarbir Singh, Palwinder Singh](https://cdn.slidesharecdn.com/ss_thumbnails/ijct-v3i2p32-160609071950-thumbnail.jpg?width=640&height=640&fit=bounds)


![[DSC Europe 25] Boris Perkovic - Lost in performance.pptx](https://cdn.slidesharecdn.com/ss_thumbnails/uq5hrp7vsuahqkxzifux-1-251204082258-fd2ee09d-thumbnail.jpg?width=640&height=640&fit=bounds)
![[DSC Europe 25] Dragana Ilic - AI for Big Data in Astronomy.pptx](https://cdn.slidesharecdn.com/ss_thumbnails/8palya86qaatvjhva1ms-2-dragana-ilic-ai-ilic-251208151906-652b819c-thumbnail.jpg?width=640&height=640&fit=bounds)


![[DSC Europe 25] Jim Sterne - Adopting Generative AI Capabilities Into the Ent...](https://cdn.slidesharecdn.com/ss_thumbnails/sxhpofuorcagxsaulkmt-3-251204082258-7e66bc48-thumbnail.jpg?width=640&height=640&fit=bounds)


![[DSC Europe 25] Bogdan Daniel Maruneac - AI - It starts with you.pptx](https://cdn.slidesharecdn.com/ss_thumbnails/odov3snhrcqs9hx5ny2n-4-251205085715-f1daacfe-thumbnail.jpg?width=640&height=640&fit=bounds)


![[DSC Europe 25] Marija Vlajkovic & Andrea Radonjanin - Integration of AI tool...](https://cdn.slidesharecdn.com/ss_thumbnails/qf1jrglttoc3bm8s3aop-final-integration-of-ai-tools-251208151905-394f3a6a-thumbnail.jpg?width=640&height=640&fit=bounds)