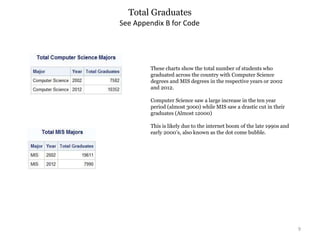
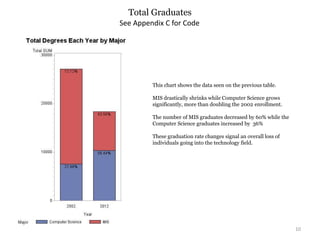
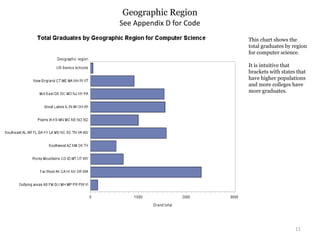
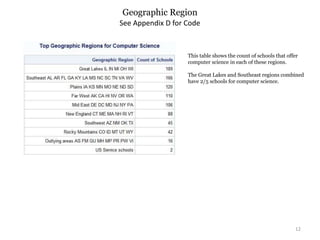
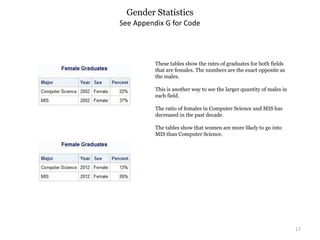
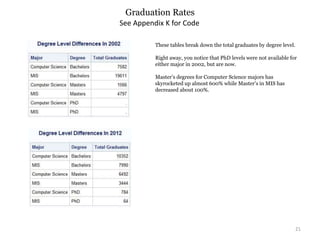
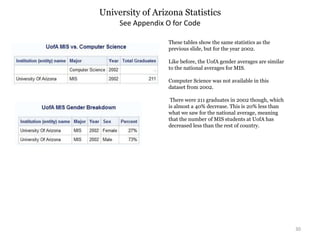
3. 3
Table of Contents
I. Table of Contents…………………………………………………………………………………………………………………………………….. 3
II. Supporting Documentation…………………………………………………………………………………………………………….. 4
III. Research Purpose..…………………………………………………………………………………………………………………………. 5
IV. Data Description…………………………………………………………………………………………………………………………….. 6
V. VI. Variables……………………………………………………………………………………………………………………………………….. 7
VI. Data Contents……………………………………………………………………………………………………………………………….….. 8
VII. Total Graduates…………………………………………………………………………………………………………………………….. 9 – 10
VIII.. Geographic Regions………………………………………………………………………………………………………………………. 11 – 14
IX. Second Major…………………………………………………………………………………………………………………………….…15
X. Gender Breakdown……………………………………………………………………………………………………………………… 16 – 17
XI. Growth/Decline…………………………………………………………………………………………………………………………... 18
XII. Race Breakdown…………………………………………………………………………………………………………………………. 19 – 20
XIII. Continued Education…………………………………………………………………………………………………………………… 21
XIV. Top 20 Schools…………………………………………………………………………………………………………………………… 22 – 28
XV. UofA…………………………………………………………………………………………………………………………………………….. 29 – 30
XVI. Conclusion…………………………………………………………………………………………………………………………………. 31
XVII. Appendix …………………………………………………………………………………………………………….…….…………….. 32 – 46
4. 4
Supporting Documentation
When looking at Management Information Systems (MIS) and computer science, it is important to know the
differences between the two. This could help one understand why there might be a trend in one direction or
the other. Computer science focuses more on why technology works the way it does. It is programming and
math intensive. MIS is a more of a broad information technology degree. It touches on various topics such as
programming, networking, database management, and other general technology needs of business. Computer
science is more specific and technical, while MIS is more broad and less technical.
Source: http://www.geteducated.com/careers/521-computer-information-systems-vs-computer-science
It is known that there has been a declining number of students who choose MIS as their degree in college.
This has declined significantly since the early 2000s. Because of this drastic decline, there is now a shortage
of MIS majors to fill the roles necessary for IT management. There seems to be a misconception of what the
MIS major teaches, with some students fearing it is very technical and thinking that there is a high possibility
of outsourcing. These issues, combined with an overall disinterest in tech after the burst of the dot come
bubble, make it a promising major for students who want to enter a job market that is short in supply.
Source: http://www.redandblack.com/news/mis-major-enrollment-continues-to-decline/article_90dc4f61-
05e4-5c52-8a2f-20173f3b4d58.html
5. 5
Research Purpose & Motivation
The research in this project aims to answer various questions regarding the MIS and computer science
degrees. The analysis compares the years 2002 and 2012 so an idea can be formed of how the demand of both
degrees have changed over time. We will be looking at various aspects of the degrees including, but not
limited to:
Total graduates rates for both years
Gender differences for each major and across years
Racial differences between majors and over time
What significance the geographic region has for MIS and CS degrees
What the top 20 schools are for the degrees
How UofA compares to the national trends
It is important to know these things so one can understand the trends of these two important degrees. In an
increasing technology driven world, these computer science and management information systems can be
beneficial to any graduate, even if not desiring to go into an extremely technical field. If your area of study is
business, these degrees can be beneficial in understanding how the technology around you works. It can be
useful in both analysis and decision making.
6. 6
Data Description
The data used in this research is taken from the IPEDS database, the primary source for data on
colleges, universities, and technical and vocational postsecondary institutions in the United
States. Two datasets were obtained for the analysis. One from the year 2002 and one from 2012.
The data include the completion information for graduates for each year and the institutional
characteristics for the schools as well. The data was merged for each year to have all of the
information in one location.
The original datasets track many more variables than what was of interest for the purpose of the
research. We dropped some of the variables from the dataset and only kept the ones that were
going to be relevant. See the next slide for a list of variables kept for each dataset with
descriptions.
7. 7
Variables
2002 Data
Variable Meaning
unitid School Identification Number
instnm Name of institution
cipcode Degree code
majornum Primary or second major
awlevel Type of Degree
obereg Regional code
iclevel School type
crace03 Black Men
crace04 Black Women
crace05 American Indian Men
crace06 American Indian Women
crace07 Asian men
crace08 Asian Women
crace09 Hispanic Men
crace10 Hispanic Women
crace11 White Men
crace12 White Women
crace15 Total Men
crace16 Total Women
crace18 Total Black
crace19 Total American Indian
crace20 Total Asian
crace21 Total Hispanic
crace22 Total White
crace24 Grand Total
2012 Data
Variable Meaning
unitid School Identification Number
instnm Name of institution
cipcode Degree code
majornum Primary or second major
awlevel Type of Degree
obereg Regional code
iclevel School type
ctotalt Grand Total
ctotalm Total Men
ctotalw Total Women
caiant American IndianAlaskan Total
caianm American IndianAlaskan Men
caianw American IndianAlaskan Women
casiat Total Asian
casiam Asian Men
casiaw Asian Women
cbkaat Total Black
cbkaam Black Men
cbkaaw Black Women
chispt Total Hispanic
chispm Hispanic Men
chispw Hispanic Women
cwhitt Total White
cwhitm White Men
whittw White Women
9. Total Graduates
See Appendix B for Code
9
These charts show the total number of students who
graduated across the country with Computer Science
degrees and MIS degrees in the respective years or 2002
and 2012.
Computer Science saw a large increase in the ten year
period (almost 3000) while MIS saw a drastic cut in their
graduates (Almost 12000)
This is likely due to the internet boom of the late 1990s and
early 2000’s, also known as the dot come bubble.
10. Total Graduates
10
See Appendix C for Code
This chart shows the data seen on the previous table.
MIS drastically shrinks while Computer Science grows
significantly, more than doubling the 2002 enrollment.
The number of MIS graduates decreased by 60% while the
Computer Science graduates increased by 36%
These graduation rate changes signal an overall loss of
individuals going into the technology field.
11. Geographic Region
11
See Appendix D for Code
This chart shows the
total graduates by region
for computer science.
It is intuitive that
brackets with states that
have higher populations
and more colleges have
more graduates.
12. Geographic Region
12
See Appendix D for Code
This table shows the count of schools that offer
computer science in each of these regions.
The Great Lakes and Southeast regions combined
have 2/5 schools for computer science.
13. Geographic Region
13
See Appendix E for Code
This graph shows the total
number of graduates for
each bracketed region.
As you can see the southern
areas have a much larger
presence in the MIS field as
opposed to all other regions,
but especially the far west.
14. Geographic Regions
14
See Appendix E for Code
This table shows the count of schools that
offer MIS in each of these regions.
As confirmed in the previous slide, the
south has a large amount of schools, to
go along with their graduates.
This also could display that schools in
those regions may offer more tech focus.
15. Second Major
15
See Appendix F for Code
These tables show that number of graduates that
chose either Computer Science or MIS as a second
major in both 2002 and 2012.
The numbers directly correlate with the total number
of graduates in each respective field as time
progressed.
Not only are people choosing MIS less as a primary
major, they are choosing it less as a second major as
well. This is a 34% decrease.
Computer science second majors grew slightly over
the 10 year period by 50%
16. Gender Statistics
16
See Appendix G for Code
The tables seen here show the percent of
graduates in each field that were male.
They include both Computer Science and MIS
and the years 2002 and 2012
Both majors are a male dominated field, much
like economics, which can be seen as a similar
field.
17. Gender Statistics
17
See Appendix G for Code
These tables show the rates of graduates for both fields
that are females. The numbers are the exact opposite as
the males.
This is another way to see the larger quantity of males in
each field.
The ratio of females in Computer Science and MIS has
decreased in the past decade.
The tables show that women are more likely to go into
MIS than Computer Science.
18. Degree Growth/Decline
18
See Appendix H for Code
These tables show the change in the number of
schools offering each degree from the year 2002 to
the year 2012.
They represent basic supply and demand.
Less students are demanding MIS now as opposed
to Computer Science so while MIS has stayed
essentially constant(a few less institutions),
Computer Science has seen an increase in the
number of institutions(168 total).
19. Race Statistics
19
See Appendix I for Code
These tables show the race breakdown for each
major in 2002.
Computer science had a higher percentage of
White then the breakdown of higher education in
general stats (66.7% total) , while MIS is right on
par with the 2002 overall breakdown.
Both show a slightly lower percent of Black, but
very small (1%).
Everything else seems to be the average across the
total population of colleges.
20. Race Statistics
20
See Appendix J for Code
These tables show the same stats as seen in the
previous slide, but are for 2012 instead of 2002.
The stats are similar, but white has shrunken,
getting closer to the average (61%), but are still not
the same.
Asian has seen a large increase in the computer
science field and is twice the level of higher
education averages.
21. Graduation Rates
21
See Appendix K for Code
These tables break down the total graduates by degree level.
Right away, you notice that PhD levels were not available for
either major in 2002, but are now.
Master’s degrees for Computer Science majors has
skyrocketed up almost 600% while Master’s in MIS has
decreased about 100%.
22. See Appendix L for Code
Top Schools
22
This table shows the total graduate count for
the 20 schools that graduate the most in
Computer Science.
The University of Arizona is not present on
this list
23. Top Schools
23
See Appendix L for Code
This table shows the same thing, but is forwarded
to the year 2012.
Now we see Arizona on this list at #12.
We also see a new number one (Previously
University of Minn.)
24. Top Schools
24
See Appendix L for Code
This table shows the same thing, but is taken
back to the year 2002
We can see that Arizona is on this list at #15.
The grand totals for all of these institutions is
drastically higher than in 2012, which correlates
to the overall shrink in the number of MIS
graduates in 2012 as opposed to 2002.
25. Top Schools
25
See Appendix L for Code
This table shows the total graduate count for the
20 schools that graduate the most in MIS.
The University of Arizona is ranked #8 on this list
which makes sense since we our well know for our
MIS program.
The decline in students is seen across the board at
all of the schools, showing that even the top
schools did not sustain the level of graduates that
they did in 2002.
26. Top 20 Gender Rates
26
See Appendix M for Code
The table on the left breaks down the
percentage of graduates in Computer
Science, in 2012, at a institution in the top
20, by gender.
The rate at such schools in 85% male to 15%
female which is about the same as the entire
average across the board.
The table on the right breaks down the
percentage of graduates in MIS, in 2012, at a
institution in the top 20, by gender.
The rate at such schools in 70% male to 30%
female which is slightly more balanced than the
average.
27. Geographic Statistics
27
See Appendix N for Code
This table shows the distribution of top 20
schools by geographic location.
This shows that while the Great Lakes region
and Southeast have majority of the schools
for MIS and Computer Science, the Far West
is more likely to have top schools based on
volume.
28. Geographic Statistics
28
See Appendix N for Code
It is seen that the Far West region has
significantly more graduates. This has
some correlation to the fact that of
the top 20 schools, 5 come from the
Far West
California is part of this geographic
region, which has the largest
population in the United States. This
could account for the large number of
graduates. (Double what any other
region has)
29. University of Arizona Statistics
29
See Appendix O for Code
These tables compare Computer Science and
MIS at the University of Arizona.
The tables show total grads in 2012, the
percent of Male in each field in 2012, and %
of female in each field for the same year.
The numbers are similar to the national
averages.
Men are more likely to be In both fields,
however, women are more likely to be in MIS
than Computer Science
30. University of Arizona Statistics
30
See Appendix O for Code
These tables show the same statistics as the
previous slide, but for the year 2002.
Like before, the UofA gender averages are similar
to the national averages for MIS.
Computer Science was not available in this
dataset from 2002.
There were 211 graduates in 2002 though, which
is almost a 40% decrease. This is 20% less than
what we saw for the national average, meaning
that the number of MIS students at UofA has
decreased less than the rest of country.
31. 31
Conclusion
Our suspicions of a decline of graduates in the tech field has been confirmed through the analysis performed here.
In conclusion, we find that the number of MIS graduates has been decreasing at a rapid rate while computer
science graduates has been increasing slightly.
Men are much more likely to go into either field of study than women. However, the gender gap is smaller in MIS
compared to computer science.
The typical race of an MIS major is white, with all of the other races significantly less present in each major.
The far west region of the United States has more graduates in the tech fields than other region. However, when
combing the various east coast regions, their number of graduates becomes greater than the western coast.
The University of Arizona is one of the top schools for both MIS and computer science in the United States. The
UofA has a slightly greater gender gap for both majors when compared to the average.
32. Appendix A
32
/* Merging 2012 Completions &
Institutional Characteristics */
proc sort data=c2012;
by unitid;
run;
proc sort data=hd2012;
by unitid;
run;
data Data_2012;
merge c2012 hd2012;
by unitid;
run;
/* Merging 2002 Completions & Institutional
Characteristics */
proc sort data=c2002;
by unitid;
run;
proc sort data=hd2002;
by unitid;
run;
data Data_2002;
merge c2002 hd2002;
by unitid;
run;
/* Creating permanent dataset for 2012 */
data perm.d2012;
set work.Data_2012;
keep unitid instnm cipcode majornum awlevel ctotalt
ctotalm ctotalw caiant caianm caianw casiat casiam casiaw
cbkaat cbkaam cbkaaw chispt chispm chispw cwhitt cwhitm
cwhitw obereg iclevel instsize;
instnm=propcase(instnm);
run;
/* Creating permanent dataset for 2002 */
data perm.d2002;
set work.Data_2002;
keep unitid instnm cipcode majornum awlevel crace03
crace04 crace05 crace06 crace07 crace08 crace09 crace10
crace11 crace12 crace15 crace16 crace18 crace19 crace20
crace21 crace22 crace24
obereg iclevel;
instnm=propcase(instnm);
run;
proc contents data=perm.d2002;
run;
proc contents data=perm.d2012;
run;
33. Appendix B
33
/* How many people get degrees in MIS for a
Bachelors? 2002 and 2012 */
proc sql;
title "Total MIS Majors";
select 'MIS' AS Major, '2002' AS Year, sum(crace24) AS Total
"Total Graduates"
from perm.d2002
where cipcode='52.1201' and awlevel=5
union
select 'MIS' AS Major, '2012' AS Year, sum(ctotalt) AS Total
"Total Graduates"
from perm.d2012
where cipcode='52.1201' and awlevel=5;
run;quit;
/* How many people get degrees in Computer Science for a
Bachelors? 2002 and 2012 */
proc sql;
title "Total Computer Science Majors";
select 'Computer Science' AS Major, '2002' AS Year,
sum(crace24) AS Total "Total Graduates"
from perm.d2002
where cipcode='11.0701' and awlevel=5
union
select 'Computer Science' AS Major, '2012' AS Year, sum(ctotalt)
AS Total "Total Graduates"
from perm.d2012
where cipcode='11.0701' and awlevel=5;
run;quit;
34. Appendix C
34
/* Stacked Bar Graph */
/* MIS in 2002 */
proc sql;
create table mis02 AS
Select '2002' as Year, 'MIS' as Major,
sum(crace15)+sum(crace16) AS Total
from perm.d2002
where cipcode='52.1201' and awlevel=5;
quit;
/* Computer Science in 2002*/
proc sql;
create table cs02 AS
Select '2002' as Year, 'CS' as Major, sum(crace15)+sum(crace16)
AS Total
from perm.d2002
where cipcode='11.0701' and awlevel=5;
quit;
/* MIS in 2012*/
proc sql;
create table mis12 AS
Select '2012' as Year, 'MIS' as Major, sum(ctotalt) AS Total
from perm.d2012
where cipcode='52.1201' and awlevel=5;
quit;
(Continued on right)
/* Computer Science in 2012*/
proc sql;
create table cs12 AS
Select '2012' as Year, 'CS' as Major, sum(ctotalt) AS Total
from perm.d2012
where cipcode='11.0701' and awlevel=5;
quit;
/*Merging all of them together */
data FirstSet;
merge mis02 cs02 mis12 cs12;
by Total;
run;
proc print data=FirstSet;
run;
proc format;
value $Major_f
'MIS' = 'MIS'
'CS' = 'Computer Science';
run;
/*Creating a Graph */
proc gchart data=FirstSet;
title 'Total Degrees Each Year by Major';
vbar Year / subgroup=Major type=sum
sumvar=Total inside=subpct width=10 space=5;
format Major $Major_f.;
run;
35. Appendix D
35
/* Geographic Region for all Computer Science */
proc sql;
create table geocs AS
select obereg, ctotalt
from perm.d2012
where cipcode='11.0701' and awlevel=5
order by ctotalt desc;
run; quit;
proc sql;
title "Top Geographic Regions for Computer Science";
select obereg "Geographic Region" FORMAT=obereg., count(obereg) AS
Count "Count of Schools"
from geocs
where obereg=0
union
select obereg "Geographic Region" FORMAT=obereg., count(obereg) AS
Count "Count of Schools"
from geocs
where obereg=1
union
select obereg "Geographic Region" FORMAT=obereg., count(obereg) AS
Count "Count of Schools"
from geocs
where obereg=2
union
select obereg "Geographic Region"FORMAT=obereg., count(obereg) AS
Count "Count of Schools"
from geocs
where obereg=3
union
select obereg "Geographic Region" FORMAT=obereg., count(obereg) AS
Count "Count of Schools"
from geocs
where obereg=4
Union (Continued on Right)
select obereg "Geographic Region" FORMAT=obereg., count(obereg) AS
Count "Count of Schools"
from geocs
where obereg=5
union
select obereg "Geographic Region" FORMAT=obereg., count(obereg) AS
Count "Count of Schools"
from geocs
where obereg=6
union
select obereg "Geographic Region" FORMAT=obereg., count(obereg) AS
Count "Count of Schools"
from geocs
where obereg=7
union
select obereg "Geographic Region" FORMAT=obereg., count(obereg) AS
Count "Count of Schools"
from geocs
where obereg=8
union
select obereg "Geographic Region" FORMAT=obereg., count(obereg) AS
Count "Count of Schools"
from geocs
where obereg=9
order by Count desc;
quit;
proc gchart data=geocs;
title 'Total Graduates by Geographic Region for Computer
Science';
hbar obereg / type=sum sumvar=ctotalt
midpoints=0,1,2,3,4,5,6,7,8,9 nostats;
format obereg obereg.;
run;
36. Appendix E
36
/* Geographic Region for all MIS */
proc sql;
create table geomis AS
select obereg, ctotalt
from perm.d2012
where cipcode='52.1201' and awlevel=5
order by ctotalt desc;
run; quit;
proc sql;
title "Top Geographic Regions for MIS";
select obereg "Geographic Region" FORMAT=obereg., count(obereg) AS
Count "Count of Schools"
from geomis
where obereg=0
union
select obereg "Geographic Region" FORMAT=obereg., count(obereg) AS
Count "Count of Schools"
from geomis
where obereg=1
union
select obereg "Geographic Region" FORMAT=obereg., count(obereg) AS
Count "Count of Schools"
from geomis
where obereg=2
union
select obereg "Geographic Region"FORMAT=obereg., count(obereg) AS
Count "Count of Schools"
from geomis
where obereg=3
union
select obereg "Geographic Region" FORMAT=obereg., count(obereg) AS
Count "Count of Schools"
from geomis
where obereg=4 (Continued on Right)
union
select obereg "Geographic Region" FORMAT=obereg.,
count(obereg) AS Count "Count of Schools"
from geomis
where obereg=5
union
select obereg "Geographic Region" FORMAT=obereg.,
count(obereg) AS Count "Count of Schools"
from geomis
where obereg=6
union
select obereg "Geographic Region" FORMAT=obereg.,
count(obereg) AS Count "Count of Schools"
from geomis
where obereg=7
union
select obereg "Geographic Region" FORMAT=obereg.,
count(obereg) AS Count "Count of Schools"
from geomis
where obereg=8
union
select obereg "Geographic Region" FORMAT=obereg.,
count(obereg) AS Count "Count of Schools"
from geomis
where obereg=9
order by Count desc;
quit;
proc gchart data=geomis;
title 'Total Graduates by Geographic Region for
MIS';
hbar obereg / type=sum sumvar=ctotalt
midpoints=0,1,2,3,4,5,6,7,8,9 nostats;
format obereg obereg.;
run;
37. Appendix F
37
/* second major 2012 */
proc sql;
title "Degrees as Second Major";
select 'MIS' AS Major, '2012' AS Year, sum(ctotalt) AS Total "Total Graduates"
from perm.d2012
where cipcode='52.1201' and awlevel=5 and majornum=2
union
select 'Computer Science' AS Major, '2012' AS Year, sum(ctotalt) AS Total_Graduates
from perm.d2012
where cipcode='11.0701' and awlevel=5 and majornum=2;
run;quit;
/* second major? 2002*/
proc sql;
title "Degrees as Second Major";
select 'MIS' AS Major, '2002' AS Year, sum(crace24) AS Total "Total Graduates"
from perm.d2002
where cipcode='52.1201' and awlevel=5 and majornum=2
union
select 'Computer Science' AS Major, '2002' AS Year, sum(crace24) AS Total_Graduates
from perm.d2002
where cipcode='11.0701' and awlevel=5 and majornum=2;
run;quit;
38. Appendix G
38
/* Male 2002 (MIS vs. Computer Science) */
proc sql;
title "Male Graduates";
select 'MIS' AS Major, '2002' AS Year, 'Male' AS Sex,
sum(crace15)/sum(crace15+crace16) AS Percent FORMAT=Percent.
from perm.d2002
where cipcode='52.1201' and awlevel=5
union
select 'Computer Science' AS Major, '2002' AS Year, 'Male' AS Sex,
sum(crace15)/sum(crace15+crace16) AS Percent FORMAT=Percent.
from perm.d2002
where cipcode='11.0701' and awlevel=5;
run;quit;
/* Male 2012 (MIS vs. Computer Science) */
proc sql;
title "Male Graduates";
select 'MIS' AS Major, '2012' AS Year, 'Male' AS Sex,
sum(ctotalm)/sum(ctotalm+ctotalw) AS Percent FORMAT=Percent.
from perm.d2012
where cipcode='52.1201' and awlevel=5
union
select 'Computer Science' AS Major, '2012' AS Year, 'Male' AS Sex,
sum(ctotalm)/sum(ctotalm+ctotalw) AS Percent FORMAT=Percent.
from perm.d2012
where cipcode='11.0701' and awlevel=5;
run;quit;
/* Female 2002 (MIS vs Computer Science) */
proc sql;
title "Female Graduates";
select 'MIS' AS Major, '2002' AS Year, 'Female' AS Sex,
sum(crace16)/sum(crace15+crace16) AS Percent FORMAT=Percent.
from perm.d2002
where cipcode='52.1201' and awlevel=5
union
select 'Computer Science' AS Major, '2002' AS Year, 'Female' AS Sex,
sum(crace16)/sum(crace15+crace16) AS Percent FORMAT=Percent.
from perm.d2002
where cipcode='11.0701' and awlevel=5;
run; quit;
/* Female 2012 (MIS vs Computer Science) */
proc sql;
title "Female Graduates";
select 'MIS' AS Major, '2012' AS Year, 'Female' AS Sex,
sum(ctotalw)/sum(ctotalm+ctotalw) AS Percent FORMAT=Percent.
from perm.d2012
where cipcode='52.1201' and awlevel=5
union
select 'Computer Science' AS Major, '2012' AS Year, 'Female' AS Sex,
sum(ctotalw)/sum(ctotalm+ctotalw) AS Percent FORMAT=Percent.
from perm.d2012
where cipcode='11.0701' and awlevel=5;
run; quit;
39. Appendix H
39
/* How many more/less schools are there offering MIS degrees now? (Compared to 2002) */
proc sql;
title "Change in Schools offering MIS Degrees";
select 'MIS' AS Major,'2002' AS Year, count(distinct unitid) AS NumberOfSchools "Number of Schools"
from perm.d2002
where cipcode='52.1201' and awlevel=5 and crace15+crace16>0
union
select 'MIS' AS Major, '2012' AS Year, count(distinct unitid) AS NumberOfSchools "Number of Schools"
from perm.d2012
where cipcode='52.1201' and awlevel=5 and ctotalt >0;
run; quit;
/* How many more/less schools are there offering Computer Science degrees now? (Compared to 2002) */
proc sql;
title "Change in Schools offering Computer Science Degrees";
select 'Computer Science' AS Major,'2002' AS Year, count(distinct unitid) AS NumberOfSchools "Number of Schools"
from perm.d2002
where cipcode='11.0701' and awlevel=5 and crace15+crace16>0
union
select 'Computer Science' AS Major, '2012' AS Year, count(distinct unitid) AS NumberOfSchools "Number of Schools"
from perm.d2012
where cipcode='11.0701' and awlevel=5 and ctotalt >0;
run; quit;
40. Appendix I
40
/* Breakdown by race? Computer Science 2002 */
proc sql;
title "Breakdown by Race";
select 'Computer Science' AS Major, 'White' AS Race, '2002' AS Year,
sum(crace22) AS Total "Total Graduates",
sum(crace22)/sum(crace22+crace18+crace19+crace20+crace21) AS
Percent FORMAT=Percent.
from perm.d2002
where cipcode='11.0701' and awlevel=5
union
select 'Computer Science' AS Major, 'Black' AS Race, '2002' AS Year,
sum(crace18) AS Total "Total Graduates",
sum(crace18)/sum(crace22+crace18+crace19+crace20+crace21) AS
Percent
from perm.d2002
where cipcode='11.0701' and awlevel=5
union
select 'Computer Science' AS Major,'American Indian' AS Race, '2002'
AS Year, sum(crace19) AS Total "Total Graduates",
sum(crace19)/sum(crace22+crace18+crace19+crace20+crace21) AS
Percent
from perm.d2002
where cipcode='11.0701' and awlevel=5
union
select 'Computer Science' AS Major, 'Asian' AS Race,'2002' AS Year,
sum(crace20) AS Total "Total Graduates" ,
sum(crace20)/sum(crace22+crace18+crace19+crace20+crace21) AS
Percent
from perm.d2002
where cipcode='11.0701' and awlevel=5
union
select 'Computer Science' AS Major, 'Hispanic' AS Race, '2002' AS Year,
sum(crace21) AS Total "Total Graduates",
sum(crace21)/sum(crace22+crace18+crace19+crace20+crace21) AS
Percent
from perm.d2002
where cipcode='11.0701' and awlevel=5
order by Percent descending;
run; quit;
/* Breakdown by race? MIS 2002 */
proc sql;
title "Breakdown by Race";
select 'MIS' AS Major, 'White' AS Race, '2002' AS Year, sum(crace22) AS
Total "Total Graduates",
sum(crace22)/sum(crace22+crace18+crace19+crace20+crace21) AS
Percent FORMAT=Percent.
from perm.d2002
where cipcode='52.1201' and awlevel=5
union
select 'MIS' AS Major, 'Black' AS Race, '2002' AS Year, sum(crace18) AS
Total "Total Graduates",
sum(crace18)/sum(crace22+crace18+crace19+crace20+crace21) AS
Percent
from perm.d2002
where cipcode='52.1201' and awlevel=5
union
select 'MIS' AS Major,'American Indian' AS Race, '2002' AS Year,
sum(crace19) AS Total "Total Graduates",
sum(crace19)/sum(crace22+crace18+crace19+crace20+crace21) AS
Percent
from perm.d2002
where cipcode='52.1201' and awlevel=5
union
select 'MIS' AS Major, 'Asian' AS Race,'2002' AS Year, sum(crace20) AS
Total "Total Graduates",
sum(crace20)/sum(crace22+crace18+crace19+crace20+crace21) AS
Percent
from perm.d2002
where cipcode='52.1201' and awlevel=5
union
select 'MIS' AS Major, 'Hispanic' AS Race, '2002' AS Year, sum(crace21)
AS Total "Total Graduates",
sum(crace21)/sum(crace22+crace18+crace19+crace20+crace21) AS
Percent
from perm.d2002
where cipcode='52.1201' and awlevel=5
order by Percent descending;
run; quit;
41. Appendix J
41
/* Breakdown by race? MIS 2012 */
proc sql;
title "Breakdown by Race";
select 'MIS' AS Major, 'White' AS Race, '2012' AS Year,
sum(cwhitt) AS Total "Total Graduates",
sum(cwhitt)/sum(cwhitt+cbkaat+caiant+casiat+chispt) AS Percent
FORMAT=Percent.
from perm.d2012
where cipcode='52.1201' and awlevel=5
union
select 'MIS' AS Major, 'Black' AS Race, '2012' AS Year,
sum(cbkaat) AS Total "Total Graduates",
sum(cbkaat)/sum(cwhitt+cbkaat+caiant+casiat+chispt) AS Percent
FORMAT=Percent.
from perm.d2012
where cipcode='52.1201' and awlevel=5
union
select 'MIS' AS Major,'American Indian' AS Race,
'2012' AS Year, sum(caiant) AS Total "Total Graduates",
sum(caiant)/sum(cwhitt+cbkaat+caiant+casiat+chispt) AS Percent
FORMAT=Percent.
from perm.d2012
where cipcode='52.1201' and awlevel=5
union
select 'MIS' AS Major, 'Asian' AS Race,'2012' AS Year,
sum(casiat) AS Total "Total Graduates" ,
sum(casiat)/sum(cwhitt+cbkaat+caiant+casiat+chispt) AS Percent
FORMAT=Percent.
from perm.d2012
where cipcode='52.1201' and awlevel=5
union
select 'MIS' AS Major, 'Hispanic' AS Race, '2012' AS
Year, sum(chispt) AS Total "Total Graduates" ,
sum(chispt)/sum(cwhitt+cbkaat+caiant+casiat+chispt) AS Percent
FORMAT=Percent.
from perm.d2012
where cipcode='52.1201' and awlevel=5
order by Percent descending;
run; quit;
/* Breakdown by race? Computer Science 2012 */
proc sql;
title "Breakdown by Race";
select 'Computer Science' AS Major, 'White' AS Race,
'2012' AS Year, sum(cwhitt) AS Total "Total Graduates",
sum(cwhitt)/sum(cwhitt+cbkaat+caiant+casiat+chispt) AS Percent
FORMAT=Percent.
from perm.d2012
where cipcode='11.0701' and awlevel=5
union
select 'Computer Science' AS Major, 'Black' AS Race,
'2012' AS Year, sum(cbkaat) AS Total "Total Graduates",
sum(cbkaat)/sum(cwhitt+cbkaat+caiant+casiat+chispt) AS Percent
FORMAT=Percent.
from perm.d2012
where cipcode='11.0701' and awlevel=5
union
select 'Computer Science' AS Major,'American Indian'
AS Race, '2012' AS Year, sum(caiant) AS Total "Total Graduates",
sum(caiant)/sum(cwhitt+cbkaat+caiant+casiat+chispt) AS Percent
FORMAT=Percent.
from perm.d2012
where cipcode='11.0701' and awlevel=5
union
select 'Computer Science' AS Major, 'Asian' AS
Race,'2012' AS Year, sum(casiat) AS Total "Total Graduates",
sum(casiat)/sum(cwhitt+cbkaat+caiant+casiat+chispt) AS Percent
FORMAT=Percent.
from perm.d2012
where cipcode='11.0701' and awlevel=5
union
select 'Computer Science' AS Major, 'Hispanic' AS Race,
'2012' AS Year, sum(chispt) AS Total "Total Graduates",
sum(chispt)/sum(cwhitt+cbkaat+caiant+casiat+chispt) AS Percent
FORMAT=Percent.
from perm.d2012
where cipcode='11.0701' and awlevel=5
order by Percent descending;
run; quit;
42. Appendix K
42
/* How many people are pursuing Master and higher vs.
Bachelors? 2012 */
proc sql;
title "Degree Level Differences In 2012";
select 'MIS' AS Major, 'Bachelors' AS Degree, sum(ctotalt) AS Total
"Total Graduates"
from perm.d2012
where cipcode='52.1201' and awlevel IN (5)
union
select 'Computer Science' AS Major, 'Bachelors' AS Degree,
sum(ctotalt) AS Total "Total Graduates"
from perm.d2012
where cipcode='11.0701' and awlevel IN (5)
union
select 'MIS' AS Major, 'Masters' AS Degree, sum(ctotalt) AS Total
"Total Graduates"
from perm.d2012
where cipcode='52.1201' and awlevel IN (7)
union
select 'Computer Science' AS Major, 'Masters' AS Degree,
sum(ctotalt) AS Total "Total Graduates"
from perm.d2012
where cipcode='11.0701' and awlevel IN (7)
union
select 'MIS' AS Major, 'PhD' AS Degree, sum(ctotalt) AS Total
"Total Graduates"
from perm.d2012
where cipcode='52.1201' and awlevel IN (17, 18, 19)
union
select 'Computer Science' AS Major, 'PhD' AS Degree, sum(ctotalt)
AS Total "Total Graduates"
from perm.d2012
where cipcode='11.0701' and awlevel IN (17, 18, 19)
order by Degree asc;
run;quit;
/* How many people are pursuing Master and higher vs. Bachelors? 2002
*/
proc sql;
title "Degree Level Differences In 2002";
select 'MIS' AS Major, 'Bachelors' AS Degree, sum(crace24) AS Total
"Total Graduates"
from perm.d2002
where cipcode='52.1201' and awlevel IN (5)
union
select 'Computer Science' AS Major, 'Bachelors' AS Degree, sum(crace24)
AS Total "Total Graduates"
from perm.d2002
where cipcode='11.0701' and awlevel IN (5)
union
select 'MIS' AS Major, 'Masters' AS Degree, sum(crace24) AS Total "Total
Graduates"
from perm.d2002
where cipcode='52.1201' and awlevel IN (7)
union
select 'Computer Science' AS Major, 'Masters' AS Degree, sum(crace24)
AS Total "Total Graduates"
from perm.d2002
where cipcode='11.0701' and awlevel IN (7)
union
select 'MIS' AS Major, 'PhD' AS Degree, sum(crace24) AS Total "Total
Graduates"
from perm.d2002
where cipcode='52.1201' and awlevel IN (17, 18, 19)
union
select 'Computer Science' AS Major, 'PhD' AS Degree, sum(crace24) AS
Total "Total Graduates"
from perm.d2002
where cipcode='11.0701' and awlevel IN (17, 18, 19)
order by Degree asc;
run;quit;
43. Appendix L
43
/* Top 20 Schools for Computer Science 2002*/
proc sql outobs=20;
title "Top 20 Schools for Computer Science in 2002";
select instnm, 'Computer Science' AS Major, crace24
from perm.d2002
where cipcode='11.0701' and awlevel=5
order by crace24 desc;
run; quit;
/* Top 20 Schools for MIS 2002 */
proc sql outobs=20;
title "Top 20 Schools for MIS in 2002";
select instnm, 'MIS' AS Major, crace24
from perm.d2002
where cipcode='52.1201' and awlevel=5
order by crace24 desc;
run; quit;
/* Top 20 Schools for Computer Science 2012*/
proc sql outobs=20;
title "Top 20 Schools for Computer Science in 2012";
select unitid, instnm, 'Computer Science' AS Major, ctotalt
from perm.d2012
where cipcode='11.0701' and awlevel=5
order by ctotalt desc;
run; quit;
/* Top 20 Schools for MIS 2012*/
proc sql outobs=20;
title "Top 20 Schools for MIS in 2012";
select instnm, 'MIS' AS Major, ctotalt
from perm.d2012
where cipcode='52.1201' and awlevel=5
order by ctotalt desc;
run; quit;
44. Appendix M
44
/* Gender Top 20 MIS */
proc sql;
title "Graduation Rate By Gender for Top 20 Schools in MIS";
select 'MIS' AS Major, '2012' AS Year, 'Female' AS Gender, sum(ctotalw)/sum(ctotalt) AS Total FORMAT=Percent.
from perm.d2012
where cipcode='52.1201' and awlevel=5 and unitid IN (178721,189228, 139959,137351,243601,154022,225511, 104179,
236939, 433387, 232982, 151801, 204857, 232557, 241739,228769, 230764, 153603, 100751, 228778)
union
select 'MIS' AS Major, '2012' AS Year, 'Male' AS Gender, sum(ctotalm)/sum(ctotalt) AS Total FORMAT=Percent.
from perm.d2012
where cipcode='52.1201' and awlevel=5 and unitid IN(178721,189228, 139959,137351,243601,154022,225511, 104179,
236939, 433387, 232982, 151801, 204857, 232557, 241739,228769, 230764, 153603, 100751, 228778);
quit;
/* Gender Top 20 Computer Science */
proc sql;
title "Graduation Rate By Gender for Top 20 Schools in CS";
select 'Computer Science' AS Major, '2012' AS Year, 'Female' AS Gender, sum(ctotalw)/sum(ctotalt) AS Total FORMAT=Percent.
from perm.d2012
where cipcode='11.0701' and awlevel=5 and unitid IN (145637,
110680,166683,211440,243744,174066,199139,236948,199193,
110662, 195003,104179, 110635, 110529, 243780, 104151, 190415, 196079, 110653, 194824)
union
select 'Computer Science' AS Major, '2012' AS Year, 'Male' AS Gender, sum(ctotalm)/sum(ctotalt) AS Total FORMAT=Percent.
from perm.d2012
where cipcode='11.0701' and awlevel=5 and unitid IN(145637,
110680,166683,211440,243744,174066,199139,236948,199193,
110662, 195003,104179, 110635, 110529, 243780, 104151, 190415, 196079, 110653, 194824);
quit;
45. Appendix N
45
/* Top 20 Schools for both combined 2012 and geographic region */
proc sql outobs=20;
create table top20geoboth AS
select obereg, instnm, ctotalt
from perm.d2012
where cipcode='11.0701' or cipcode='52.1201' and awlevel=5
order by ctotalt desc;
run; quit;
proc sql;
title "Top Geographic Regions for Top 20 Schools";
select obereg "Geographic Region" FORMAT=obereg., count(obereg) AS Count
"Count of Schools"
from top20geoboth
where obereg=0
union
select obereg "Geographic Region" FORMAT=obereg., count(obereg) AS Count
"Count of Schools"
from top20geoboth
where obereg=1
union
select obereg "Geographic Region" FORMAT=obereg., count(obereg) AS Count
"Count of Schools"
from top20geoboth
where obereg=2
union
select obereg "Geographic Region"FORMAT=obereg., count(obereg) AS Count
"Count of Schools"
from top20geoboth
where obereg=3
union
select obereg "Geographic Region" FORMAT=obereg., count(obereg) AS Count
"Count of Schools"
from top20geoboth
where obereg=4
union
select obereg "Geographic Region" FORMAT=obereg., count(obereg) AS Count
"Count of Schools"
from top20geoboth
(continued on right)
where obereg=5
union
select obereg "Geographic Region" FORMAT=obereg.,
count(obereg) AS Count "Count of Schools"
from top20geoboth
where obereg=6
union
select obereg "Geographic Region" FORMAT=obereg.,
count(obereg) AS Count "Count of Schools"
from top20geoboth
where obereg=7
union
select obereg "Geographic Region" FORMAT=obereg.,
count(obereg) AS Count "Count of Schools"
from top20geoboth
where obereg=8
union
select obereg "Geographic Region" FORMAT=obereg.,
count(obereg) AS Count "Count of Schools"
from top20geoboth
where obereg=9
order by Count desc;
quit;
proc gchart data=top20geoboth;
title 'Total Graduates for Top 20 Schools by
Geographic Region';
hbar obereg / type=sum sumvar=ctotalt
midpoints=0,1,2,3,4,5,6,7,8,9 nostats;
format obereg obereg.;
run;
46. Appendix O
46
/* UofA MIS vs. Computer Science in 2002 */
proc sql;
title "UofA MIS vs. Computer Science";
select instnm, 'MIS' AS Major, '2002' AS Year, sum(crace24) AS Total "Total
Graduates"
from perm.d2002
where cipcode='52.1201' and awlevel=5 and unitid=104179
union
select instnm, 'Computer Science' AS Major, '2002' AS Year, sum(crace24) AS
Total
from perm.d2002
where cipcode='11.0701' and awlevel=5 and unitid=104179;
run;quit;
/* UofA MIS vs. Computer Science 2012 */
proc sql;
title "UofA MIS vs. Computer Science";
select instnm, 'MIS' AS Major, '2012' AS Year, sum(ctotalt) AS Total "Total
Graduates”from perm.d2012
where cipcode='52.1201' and awlevel=5 and unitid=104179 union
select instnm, 'Computer Science' AS Major, '2012' AS Year, sum(ctotalt) AS Total
"Total Graduates"
from perm.d2012
where cipcode='11.0701' and awlevel=5 and unitid=104179;
run;quit;
/* UofA Male and Female 2002 (MIS)Because there are no computer science
majors in 2002 at UofA */
proc sql;
title "UofA MIS Gender Breakdown";
select instnm, 'MIS' AS Major, '2002' AS Year, 'Male' AS Sex,
sum(crace15)/sum(crace15+crace16) AS Percent FORMAT=Percent.
from perm.d2002
where cipcode='52.1201' and awlevel=5 and unitid=104179 union
select instnm, 'MIS' AS Major, '2002' AS Year, 'Female' AS Sex,
sum(crace16)/sum(crace15+crace16) AS Percent FORMAT=Percent.
from perm.d2002
where cipcode='52.1201' and awlevel=5 and unitid=104179;
run;quit;
/* UofA Female 2012 (MIS vs Computer Science) */
proc sql;
title "UofA Female MIS vs. Computer Science";
select instnm, 'MIS' AS Major, '2012' AS Year, 'Female' AS Sex,
sum(ctotalw)/sum(ctotalm+ctotalw) AS Percent
FORMAT=Percent.
from perm.d2012
where cipcode='52.1201' and awlevel=5 and unitid=104179
union
select instnm, 'Computer Science' AS Major, '2012' AS Year,
'Female' AS Sex, sum(ctotalw)/sum(ctotalm+ctotalw) AS
Percent FORMAT=Percent.
from perm.d2012
where cipcode='11.0701' and awlevel=5 and unitid=104179;
run; quit;
/* UofA Male 2012 (MIS vs. Computer Science) */
proc sql;
title "UofA Male MIS vs. Computer Science";
select instnm, 'MIS' AS Major, '2012' AS Year, 'Male' AS Sex,
sum(ctotalm)/sum(ctotalm+ctotalw) AS Percent
FORMAT=Percent.
from perm.d2012
where cipcode='52.1201' and awlevel=5 and unitid=104179
union
select instnm, 'Computer Science' AS Major, '2012' AS Year,
'Male' AS Sex, sum(ctotalm)/sum(ctotalm+ctotalw) AS Percent
FORMAT=Percent.
from perm.d2012
where cipcode='11.0701' and awlevel=5 and unitid=104179;
run;quit;