Download as DOC, PPTX
![Polynomial Fits and Predictions to and from Population Estimates [1]
Подбор уравнений [аппроксимирующих многочленов] на основе оценок численности населения и для их прогноза [тыс. человек; столбец «Переписи» добавлен для сравнения с математической моделью, у Раммеля в данной
таблице отсутствует]
POLYNOMIAL FITS [2]
ПЕРЕПИСИ OVERALL [3] LON NOL PERIOD [4] KHMER ROUGE PERIOD [5] SAMRIN PERIOD [6] FORECAST PREDICTED POPULATION [8]
Year Month № LOW MID HIGH № LOW MID HIGH № LOW MID HIGH № LOW MID HIGH № [7] № LOW MID HIGH
1953 7 1 3819 4018 4105
1954 7 2 4099 4234 4338
1955 7 3 4254 4375 4475
1956 7 4 4346 4484 4571
1957 7 5 4419 4592 4661
1958 7 6 4505 4719 4771
1959 7 7 4621 4875 4916
1960 7 8 4776 5064 5099
1961 7 9 4971 5283 5322
1962 5728,771 7 10 5201 5527 5576
1963 7 11 5456 5785 5853
1964 7 12 5725 6043 6140
1965 7 13 5994 6302 6424
1966 7 14 6248 6538 6692
1967 7 15 6475 6743 6934
1968 7 16 6664 6911 7138 49 6561 6753 7151
1969 7 17 6804 7033 7297 50 6829 7081 7414
1970 2 13 6862 7083 7368 51 6874 7115 7454
1970 3 19 6868 7088 7376 52 6877 7115 7457
1970 7 20 6891 7107 7406 53 6390 7111 7461
1971 7 21 6920 7131 7464 54 6954 7108 7467 96 7434 124 7127 7454 7990
1972 7 22 6893 7107 7472 55 7093 7197 7523 97 7647 125 7304 7685 8315
1973 7 23 6813 7039 7434 56 7241 7365 7628 62 7158 7393 7621 98 7809 126 7431 7921 8652
1974 7 24 6688 6936 7358 57 7197 7462 7700 63 7124 7300 7643 99 7972 127 7657 8160 9001
1975 4 25 6570 6840 7283 58 6837 7319 7630 64 6930 7089 7529 100 8094 128 7789 8342 9270
1975 7 26 6527 6806 7255 59 6613 7199 7565 65 6843 7001 7470 101 8135 129 7832 3404 9362
1976 1 27 6438 6734 7197 60 5984 6805 7342 66 6645 6808 7331 102 8216 130 7920 8527 9547
1976 7 28 6345 6661 7137 61 5027 6150 6965 67 6428 6603 7173 103 8298 131 8008 8651 9734
1977 1 29 6250 6587 7076 68 6205 6399 7006 104 8379 132 8095 8776 9925
1977 7 30 6154 6515 7017 69 5991 6209 6842 76 6071 6562 6820 105 8460 133 8182 3903 10119
1978 1 31 6062 6445 6961 70 5799 6046 6690 77 5816 6291 6593 106 8542 134 8269 9030 10315
1978 7 32 5973 6381 6910 71 5645 5923 6562 78 5642 6113 6503 107 8623 135 8356 9153 10515
1979 1 33 5390 6323 6866 72 5541 5853 6468 79 5536 6023 6505 108 8705 136 8443 9288 10718
1979 7 34 5816 6273 6831 73 5502 5843 6420 80 5436 5990 6566 109 8786 137 8530 9413 10923
1979 12 35 5761 6238 6809 74 5530 5903 6421 81 5478 5999 6643 110 8854 138 8603 9529 11098
1980 7 36 5699 6202 6792 75 5675 6086 6500 82 5509 6050 6762 111 8949 139 8704 9682 11343
1980 6589,954 11 37 5671 6139 6790 83 5543 6094 6832 112 9004 140 8762 9773 11489
1981 3 38 5650 6182 6793 84 5585 6143 6395 113 9058 141 8820 9861 11631
1981 5 39 5641 6180 6798 85 5609 6170 6926 114 9086 142 8849 9907 11705
1981 7 40 5635 6180 6803 86 5634 6196 6953 115 9112 143 8877 9950 11775
1981 12 41 5627 6187 6824 87 5702 6264 7016 116 9130 144 8949 10064 11960
1982 7 42 5634 6213 6870 88 5802 6354 7084 117 9274 145 9049 10222 12219
1983 7 43 5700 6302 6993 89 5973 6478 7159 118 9437 146 9221 10499 12675
1984 7 44 5829 6442 7165 90 6125 6547 7213 119 9600 147 9393 10779 13142
1985 7 45 6011 6621 7368 91 6251 6569 7309 120 9763 143 9564 11063 13621
1986 7 46 6223 6814 7575 92 6366 6577 7465 121 9926 149 9734 11352 14112
1987 7 47 6427 6988 7743 93 6500 6634 7678 122 10088 150 9905 11645 14615
1988 7 48 6573 7094 7814 94 6702 6329 7376 123 10251 151 10074 11941 15130](https://image.slidesharecdn.com/42-130110015737-phpapp01/85/42-1-320.jpg)
![Polynomial Fits and Predictions to and from Population Estimates [1]
Подбор уравнений [аппроксимирующих многочленов] на основе оценок численности населения и для их прогноза [тыс. человек; столбец «Переписи» добавлен для сравнения с математической моделью, у Раммеля в данной
таблице отсутствует]
POLYNOMIAL FITS [2]
ПЕРЕПИСИ OVERALL [3] LON NOL PERIOD [4] KHMER ROUGE PERIOD [5] SAMRIN PERIOD [6] FORECAST PREDICTED POPULATION [8]
Year Month № LOW MID HIGH № LOW MID HIGH № LOW MID HIGH № LOW MID HIGH № [7] № LOW MID HIGH
1953 7 1 3819 4018 4105
1954 7 2 4099 4234 4338
1955 7 3 4254 4375 4475
1956 7 4 4346 4484 4571
1957 7 5 4419 4592 4661
1958 7 6 4505 4719 4771
1959 7 7 4621 4875 4916
1960 7 8 4776 5064 5099
1961 7 9 4971 5283 5322
1962 5728,771 7 10 5201 5527 5576
1963 7 11 5456 5785 5853
1964 7 12 5725 6043 6140
1965 7 13 5994 6302 6424
1966 7 14 6248 6538 6692
1967 7 15 6475 6743 6934
1968 7 16 6664 6911 7138 49 6561 6753 7151
1969 7 17 6804 7033 7297 50 6829 7081 7414
1970 2 13 6862 7083 7368 51 6874 7115 7454
1970 3 19 6868 7088 7376 52 6877 7115 7457
1970 7 20 6891 7107 7406 53 6390 7111 7461
1971 7 21 6920 7131 7464 54 6954 7108 7467 96 7434 124 7127 7454 7990
1972 7 22 6893 7107 7472 55 7093 7197 7523 97 7647 125 7304 7685 8315
1973 7 23 6813 7039 7434 56 7241 7365 7628 62 7158 7393 7621 98 7809 126 7431 7921 8652
1974 7 24 6688 6936 7358 57 7197 7462 7700 63 7124 7300 7643 99 7972 127 7657 8160 9001
1975 4 25 6570 6840 7283 58 6837 7319 7630 64 6930 7089 7529 100 8094 128 7789 8342 9270
1975 7 26 6527 6806 7255 59 6613 7199 7565 65 6843 7001 7470 101 8135 129 7832 3404 9362
1976 1 27 6438 6734 7197 60 5984 6805 7342 66 6645 6808 7331 102 8216 130 7920 8527 9547
1976 7 28 6345 6661 7137 61 5027 6150 6965 67 6428 6603 7173 103 8298 131 8008 8651 9734
1977 1 29 6250 6587 7076 68 6205 6399 7006 104 8379 132 8095 8776 9925
1977 7 30 6154 6515 7017 69 5991 6209 6842 76 6071 6562 6820 105 8460 133 8182 3903 10119
1978 1 31 6062 6445 6961 70 5799 6046 6690 77 5816 6291 6593 106 8542 134 8269 9030 10315
1978 7 32 5973 6381 6910 71 5645 5923 6562 78 5642 6113 6503 107 8623 135 8356 9153 10515
1979 1 33 5390 6323 6866 72 5541 5853 6468 79 5536 6023 6505 108 8705 136 8443 9288 10718
1979 7 34 5816 6273 6831 73 5502 5843 6420 80 5436 5990 6566 109 8786 137 8530 9413 10923
1979 12 35 5761 6238 6809 74 5530 5903 6421 81 5478 5999 6643 110 8854 138 8603 9529 11098
1980 7 36 5699 6202 6792 75 5675 6086 6500 82 5509 6050 6762 111 8949 139 8704 9682 11343
1980 6589,954 11 37 5671 6139 6790 83 5543 6094 6832 112 9004 140 8762 9773 11489
1981 3 38 5650 6182 6793 84 5585 6143 6395 113 9058 141 8820 9861 11631
1981 5 39 5641 6180 6798 85 5609 6170 6926 114 9086 142 8849 9907 11705
1981 7 40 5635 6180 6803 86 5634 6196 6953 115 9112 143 8877 9950 11775
1981 12 41 5627 6187 6824 87 5702 6264 7016 116 9130 144 8949 10064 11960
1982 7 42 5634 6213 6870 88 5802 6354 7084 117 9274 145 9049 10222 12219
1983 7 43 5700 6302 6993 89 5973 6478 7159 118 9437 146 9221 10499 12675
1984 7 44 5829 6442 7165 90 6125 6547 7213 119 9600 147 9393 10779 13142
1985 7 45 6011 6621 7368 91 6251 6569 7309 120 9763 143 9564 11063 13621
1986 7 46 6223 6814 7575 92 6366 6577 7465 121 9926 149 9734 11352 14112
1987 7 47 6427 6988 7743 93 6500 6634 7678 122 10088 150 9905 11645 14615
1988 7 48 6573 7094 7814 94 6702 6329 7376 123 10251 151 10074 11941 15130](https://image.slidesharecdn.com/42-130110015737-phpapp01/75/42-1-2048.jpg)
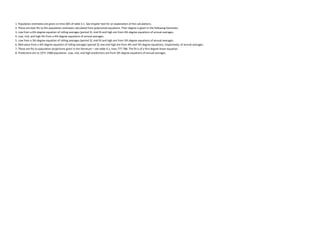

The document describes polynomial fits and predictions made to population estimates from Cambodia between 1953-1988. Polynomial equations were used to generate low, mid, and high population estimates based on data from censuses and different historical periods of Cambodia. Predictions of future population from 1971-1988 were also made using polynomial fits to population projections found in other literature.


