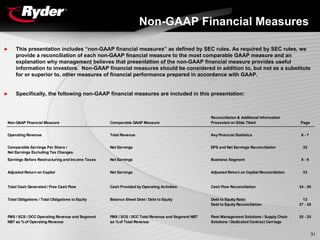
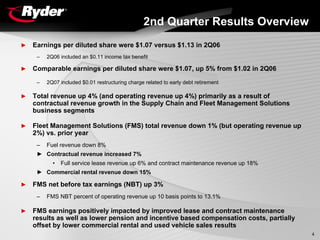
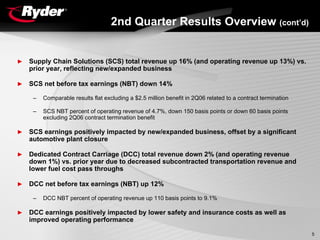
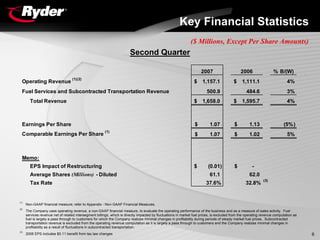
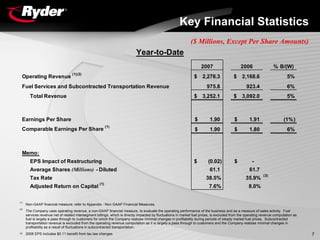
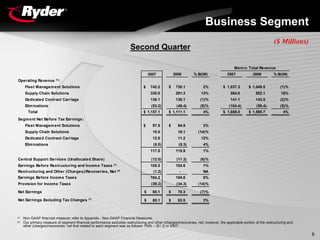
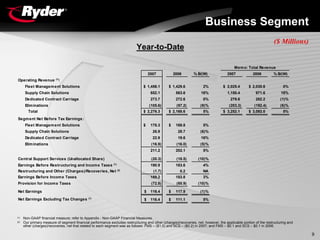
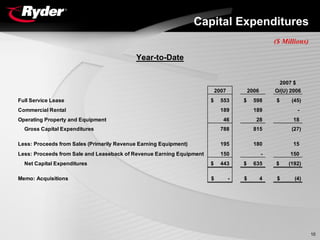
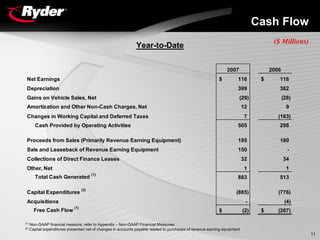
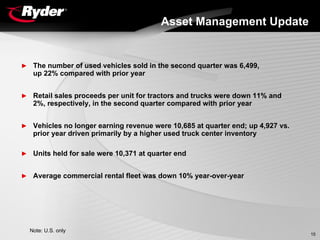
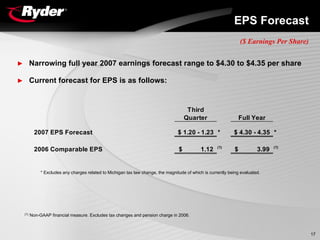
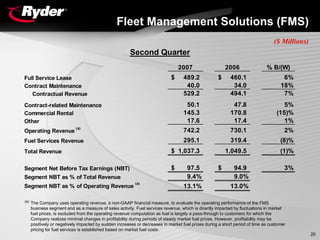
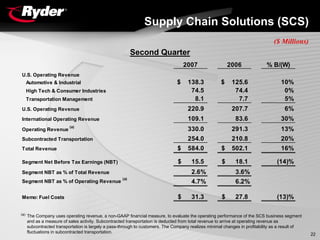
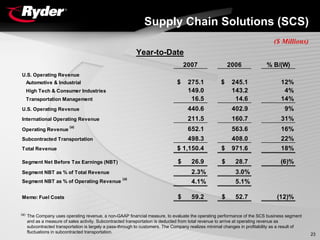
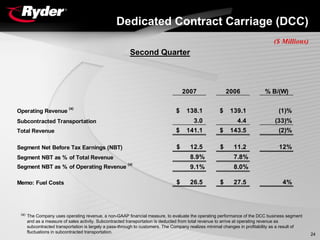
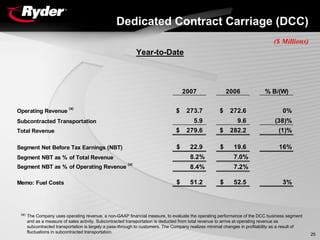
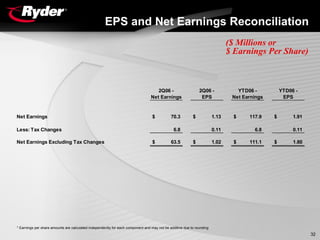
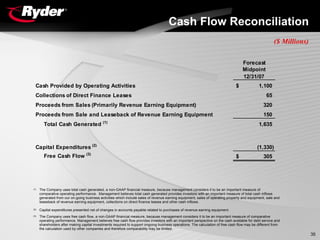
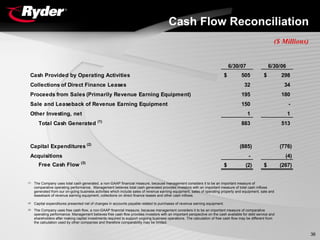
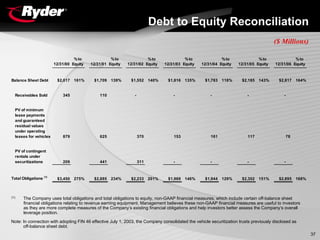
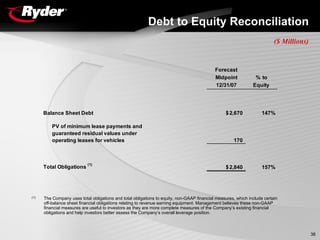
- Revenue and earnings per share increased in the second quarter of 2007 compared to the same period in 2006. Operating revenue grew 4% and earnings per share grew 5% to $1.07, excluding tax benefits.
- Fleet Management Solutions saw growth in contractual revenue but declines in fuel and commercial rental revenue. Supply Chain Solutions had strong revenue growth of 13% due to new business.
- The presentation reviewed key financial statistics such as revenue and earnings for the second quarter and year-to-date, provided business segment details, discussed capital expenditures and cash flow, and showed trends in the debt to equity ratio.
What website can I sell pi coins securely.DOT TECH
Currently there are no website or exchange that allow buying or selling of pi coins..
But you can still easily sell pi coins, by reselling it to exchanges/crypto whales interested in holding thousands of pi coins before the mainnet launch.
Who is a pi merchant?
A pi merchant is someone who buys pi coins from miners and resell to these crypto whales and holders of pi..
This is because pi network is not doing any pre-sale. The only way exchanges can get pi is by buying from miners and pi merchants stands in between the miners and the exchanges.
How can I sell my pi coins?
Selling pi coins is really easy, but first you need to migrate to mainnet wallet before you can do that. I will leave the telegram contact of my personal pi merchant to trade with.
Tele-gram.
@Pi_vendor_247
Turin Startup Ecosystem 2024 - Ricerca sulle Startup e il Sistema dell'Innov...Quotidiano Piemontese
Turin Startup Ecosystem 2024
Una ricerca de il Club degli Investitori, in collaborazione con ToTeM Torino Tech Map e con il supporto della ESCP Business School e di Growth Capital
The secret way to sell pi coins effortlessly.DOT TECH
Well as we all know pi isn't launched yet. But you can still sell your pi coins effortlessly because some whales in China are interested in holding massive pi coins. And they are willing to pay good money for it. If you are interested in selling I will leave a contact for you. Just telegram this number below. I sold about 3000 pi coins to him and he paid me immediately.
Telegram: @Pi_vendor_247
how can I sell pi coins after successfully completing KYCDOT TECH
Pi coins is not launched yet in any exchange 💱 this means it's not swappable, the current pi displaying on coin market cap is the iou version of pi. And you can learn all about that on my previous post.
RIGHT NOW THE ONLY WAY you can sell pi coins is through verified pi merchants. A pi merchant is someone who buys pi coins and resell them to exchanges and crypto whales. Looking forward to hold massive quantities of pi coins before the mainnet launch.
This is because pi network is not doing any pre-sale or ico offerings, the only way to get my coins is from buying from miners. So a merchant facilitates the transactions between the miners and these exchanges holding pi.
I and my friends has sold more than 6000 pi coins successfully with this method. I will be happy to share the contact of my personal pi merchant. The one i trade with, if you have your own merchant you can trade with them. For those who are new.
Message: @Pi_vendor_247 on telegram.
I wouldn't advise you selling all percentage of the pi coins. Leave at least a before so its a win win during open mainnet. Have a nice day pioneers ♥️
#kyc #mainnet #picoins #pi #sellpi #piwallet
#pinetwork
how can i use my minded pi coins I need some funds.DOT TECH
If you are interested in selling your pi coins, i have a verified pi merchant, who buys pi coins and resell them to exchanges looking forward to hold till mainnet launch.
Because the core team has announced that pi network will not be doing any pre-sale. The only way exchanges like huobi, bitmart and hotbit can get pi is by buying from miners.
Now a merchant stands in between these exchanges and the miners. As a link to make transactions smooth. Because right now in the enclosed mainnet you can't sell pi coins your self. You need the help of a merchant,
i will leave the telegram contact of my personal pi merchant below. 👇 I and my friends has traded more than 3000pi coins with him successfully.
@Pi_vendor_247
Even tho Pi network is not listed on any exchange yet.
Buying/Selling or investing in pi network coins is highly possible through the help of vendors. You can buy from vendors[ buy directly from the pi network miners and resell it]. I will leave the telegram contact of my personal vendor.
@Pi_vendor_247
How to get verified on Coinbase Account?_.docxBuy bitget
t's important to note that buying verified Coinbase accounts is not recommended and may violate Coinbase's terms of service. Instead of searching to "buy verified Coinbase accounts," follow the proper steps to verify your own account to ensure compliance and security.
how to sell pi coins in South Korea profitably.DOT TECH
Yes. You can sell your pi network coins in South Korea or any other country, by finding a verified pi merchant
What is a verified pi merchant?
Since pi network is not launched yet on any exchange, the only way you can sell pi coins is by selling to a verified pi merchant, and this is because pi network is not launched yet on any exchange and no pre-sale or ico offerings Is done on pi.
Since there is no pre-sale, the only way exchanges can get pi is by buying from miners. So a pi merchant facilitates these transactions by acting as a bridge for both transactions.
How can i find a pi vendor/merchant?
Well for those who haven't traded with a pi merchant or who don't already have one. I will leave the telegram id of my personal pi merchant who i trade pi with.
Tele gram: @Pi_vendor_247
#pi #sell #nigeria #pinetwork #picoins #sellpi #Nigerian #tradepi #pinetworkcoins #sellmypi
how to swap pi coins to foreign currency withdrawable.DOT TECH
As of my last update, Pi is still in the testing phase and is not tradable on any exchanges.
However, Pi Network has announced plans to launch its Testnet and Mainnet in the future, which may include listing Pi on exchanges.
The current method for selling pi coins involves exchanging them with a pi vendor who purchases pi coins for investment reasons.
If you want to sell your pi coins, reach out to a pi vendor and sell them to anyone looking to sell pi coins from any country around the globe.
Below is the contact information for my personal pi vendor.
Telegram: @Pi_vendor_247
how to sell pi coins at high rate quickly.DOT TECH
Where can I sell my pi coins at a high rate.
Pi is not launched yet on any exchange. But one can easily sell his or her pi coins to investors who want to hold pi till mainnet launch.
This means crypto whales want to hold pi. And you can get a good rate for selling pi to them. I will leave the telegram contact of my personal pi vendor below.
A vendor is someone who buys from a miner and resell it to a holder or crypto whale.
Here is the telegram contact of my vendor:
@Pi_vendor_247
The European Unemployment Puzzle: implications from population agingGRAPE
We study the link between the evolving age structure of the working population and unemployment. We build a large new Keynesian OLG model with a realistic age structure, labor market frictions, sticky prices, and aggregate shocks. Once calibrated to the European economy, we quantify the extent to which demographic changes over the last three decades have contributed to the decline of the unemployment rate. Our findings yield important implications for the future evolution of unemployment given the anticipated further aging of the working population in Europe. We also quantify the implications for optimal monetary policy: lowering inflation volatility becomes less costly in terms of GDP and unemployment volatility, which hints that optimal monetary policy may be more hawkish in an aging society. Finally, our results also propose a partial reversal of the European-US unemployment puzzle due to the fact that the share of young workers is expected to remain robust in the US.
Introduction to Indian Financial System ()Avanish Goel
The financial system of a country is an important tool for economic development of the country, as it helps in creation of wealth by linking savings with investments.
It facilitates the flow of funds form the households (savers) to business firms (investors) to aid in wealth creation and development of both the parties
2. Safe Harbor
Certain statements and information included in this presentation are quot;forward-looking statementsquot; under
the Federal Private Securities Litigation Reform Act of 1995. Accordingly, these forward-looking
statements should be evaluated with consideration given to the many risks and uncertainties inherent in
our business that could cause actual results and events to differ materially from those in the forward-
looking statements. Important factors that could cause such differences include, among others, our ability
to obtain adequate profit margins for our services, our inability to maintain current pricing levels due to
customer acceptance or competition, customer retention levels, unexpected volume declines, loss of key
customers in the Supply Chain Solutions (SCS) business segment, our failure to successfully implement
sales growth initiatives in our Fleet Management Solutions business segment, unexpected reserves or
write-offs due to the deterioration of the credit worthiness or bankruptcy of certain customers in our SCS
business segment, changes in financial, tax or regulatory requirements or changes in customers’
business environments that will limit their ability to commit to long-term vehicle leases, changes in market
conditions affecting the commercial rental market or the sale of used vehicles, the effect of severe
weather events, labor strikes or work stoppages affecting our or our customers’ business operations,
adequacy of accounting estimates and accruals particularly with respect to pension, taxes and revenue,
changes in general economic conditions, sudden changes in fuel prices, availability of qualified drivers,
our ability to manage our cost structure, new accounting pronouncements, rules or interpretations,
changes in government regulations including regulations regarding vehicle emissions and the risks
described in our filings with the Securities and Exchange Commission. The risks included here are not
exhaustive. New risks emerge from time to time and it is not possible for management to predict all such
risk factors or to assess the impact of such risks on our business. Accordingly, we undertake no
obligation to publicly update or revise any forward-looking statements, whether as a result of new
information, future events, or otherwise.
2
3. Contents
► Second Quarter 2007 Results Overview
► Asset Management Update
► Earnings Outlook
►Q & A
3
4. 2nd Quarter Results Overview
► Earnings per diluted share were $1.07 versus $1.13 in 2Q06
– 2Q06 included an $0.11 income tax benefit
► Comparable earnings per diluted share were $1.07, up 5% from $1.02 in 2Q06
– 2Q07 included $0.01 restructuring charge related to early debt retirement
► Total revenue up 4% (and operating revenue up 4%) primarily as a result of
contractual revenue growth in the Supply Chain and Fleet Management Solutions
business segments
► Fleet Management Solutions (FMS) total revenue down 1% (but operating revenue up
2%) vs. prior year
– Fuel revenue down 8%
► Contractual revenue increased 7%
• Full service lease revenue up 6% and contract maintenance revenue up 18%
► Commercial rental revenue down 15%
► FMS net before tax earnings (NBT) up 3%
– FMS NBT percent of operating revenue up 10 basis points to 13.1%
► FMS earnings positively impacted by improved lease and contract maintenance
results as well as lower pension and incentive based compensation costs, partially
offset by lower commercial rental and used vehicle sales results
4
5. 2nd Quarter Results Overview (cont’d)
► Supply Chain Solutions (SCS) total revenue up 16% (and operating revenue up 13%) vs.
prior year, reflecting new/expanded business
► SCS net before tax earnings (NBT) down 14%
– Comparable results flat excluding a $2.5 million benefit in 2Q06 related to a contract termination
– SCS NBT percent of operating revenue of 4.7%, down 150 basis points or down 60 basis points
excluding 2Q06 contract termination benefit
► SCS earnings positively impacted by new/expanded business, offset by a significant
automotive plant closure
► Dedicated Contract Carriage (DCC) total revenue down 2% (and operating revenue
down 1%) vs. prior year due to decreased subcontracted transportation revenue and
lower fuel cost pass throughs
► DCC net before tax earnings (NBT) up 12%
– DCC NBT percent of operating revenue up 110 basis points to 9.1%
► DCC earnings positively impacted by lower safety and insurance costs as well as
improved operating performance
5
6. Key Financial Statistics
($ Millions, Except Per Share Amounts)
Second Quarter
2007 2006 % B/(W)
(1)(2)
Operating Revenue $ 1,157.1 $ 1,111.1 4%
Fuel Services and Subcontracted Transportation Revenue 500.9 484.6 3%
Total Revenue $ 1,658.0 $ 1,595.7 4%
Earnings Per Share $ 1.07 $ 1.13 (5% )
(1)
Comparable Earnings Per Share $ 1.07 $ 1.02 5%
Memo:
EPS Impact of Restructuring $ (0.01) $ -
Average Shares (Millions) - Diluted 61.1 62.0
(3)
Tax Rate 37.6% 32.8%
(1)
Non-GAAP financial measure; refer to Appendix - Non-GAAP Financial Measures.
(2)
The Company uses operating revenue, a non-GAAP financial measure, to evaluate the operating performance of the business and as a measure of sales activity. Fuel
services revenue net of related intersegment billings, which is directly impacted by fluctuations in market fuel prices, is excluded from the operating revenue computation as
fuel is largely a pass through to customers for which the Company realizes minimal changes in profitability during periods of steady market fuel prices. Subcontracted
transportation revenue is excluded from the operating revenue computation as it is largely a pass through to customers and the Company realizes minimal changes in
profitability as a result of fluctuations in subcontracted transportation.
(3)
6
2006 EPS includes $0.11 benefit from tax law changes
7. Key Financial Statistics
($ Millions, Except Per Share Amounts)
Year-to-Date
2007 2006 % B/(W)
(1)(2)
Operating Revenue $ 2,276.3 $ 2,168.6 5%
Fuel Services and Subcontracted Transportation Revenue 975.8 923.4 6%
Total Revenue $ 3,252.1 $ 3,092.0 5%
Earnings Per Share $ 1.90 $ 1.91 (1% )
(1)
Comparable Earnings Per Share $ 1.90 $ 1.80 6%
Memo:
EPS Impact of Restructuring $ (0.02) $ -
Average Shares (Millions) - Diluted 61.1 61.7
(3)
Tax Rate 38.5% 35.9%
(1)
Adjusted Return on Capital 7.6% 8.0%
(1)
Non-GAAP financial measure; refer to Appendix - Non-GAAP Financial Measures.
(2)
The Company uses operating revenue, a non-GAAP financial measure, to evaluate the operating performance of the business and as a measure of sales activity. Fuel
services revenue net of related intersegment billings, which is directly impacted by fluctuations in market fuel prices, is excluded from the operating revenue computation as
fuel is largely a pass through to customers for which the Company realizes minimal changes in profitability during periods of steady market fuel prices. Subcontracted
transportation revenue is excluded from the operating revenue computation as it is largely a pass through to customers and the Company realizes minimal changes in
profitability as a result of fluctuations in subcontracted transportation.
7
2006 EPS includes $0.11 benefit from tax law changes
(3)
8. Business Segment
($ Millions)
Second Quarter
Mem o: Total Revenue
2007 2006 % B/(W) 2007 2006 % B/(W)
(1)
Operating Revenue :
Fleet Managem ent Solutions $ 742.2 $ 730.1 2% $ 1,037.3 $ 1,049.5 (1)%
Supply Chain Solutions 330.0 291.3 13% 584.0 502.1 16%
Dedicated Contract Carriage 138.1 139.1 (1)% 141.1 143.5 (2)%
Elim inations (53.2) (49.4) (8)% (104.4) (99.4) (5)%
Total $ 1,157.1 $ 1,111.1 4% $ 1,658.0 $ 1,595.7 4%
Segm ent Net Before Tax Earnings:
Fleet Managem ent Solutions $ 97.5 $ 94.9 3%
Supply Chain Solutions 15.5 18.1 (14)%
Dedicated Contract Carriage 12.5 11.2 12%
Elim inations (8.0) (8.3) 4%
117.5 115.9 1%
Central Support Services (Unallocated Share) (12.0) (11.3) (6)%
(1)
105.5 104.6 1%
Earnings Before Restructuring and Incom e Taxes
(2)
Restructuring and Other (Charges)/Recoveries, Net (1.2) - NA
Earnings Before Incom e Taxes 104.3 104.6 0%
Provision for Incom e Taxes (39.2) (34.3) (14)%
Net Earnings $ 65.1 $ 70.3 (7)%
(1)
Net Earnings Excluding Tax Changes $ 65.1 $ 63.5 3%
Non-GAAP financial measure; refer to Appendix - Non-GAAP Financial Measures.
(1)
Our primary measure of segment financial performance excludes restructuring and other (charges)/recoveries, net; however, the applicable portion of the restructuring and
(2)
other (charges)/recoveries, net that related to each segment was as follows: FMS – ($1.2) in 2007.
8
9. Business Segment
($ Millions)
Year-to-Date
Mem o: Total Revenue
2007 2006 % B/(W) 2007 2006 % B/(W)
(1)
Operating Revenue :
Fleet Managem ent Solutions $ 1,456.1 $ 1,429.6 2% $ 2,025.4 $ 2,030.6 0%
Supply Chain Solutions 652.1 563.6 16% 1,150.4 971.6 18%
Dedicated Contract Carriage 273.7 272.6 0% 279.6 282.2 (1)%
Elim inations (105.6) (97.2) (9)% (203.3) (192.4) (6)%
Total $ 2,276.3 $ 2,168.6 5% $ 3,252.1 $ 3,092.0 5%
Segm ent Net Before Tax Earnings:
Fleet Managem ent Solutions $ 178.3 $ 169.8 5%
Supply Chain Solutions 26.9 28.7 (6)%
Dedicated Contract Carriage 22.9 19.6 16%
Elim inations (16.9) (16.0) (5)%
211.2 202.1 5%
Central Support Services (Unallocated Share) (20.3) (18.5) (10)%
(1)
Earnings Before Restructuring and Incom e Taxes 190.9 183.6 4%
Restructuring and Other (Charges)/Recoveries, Net (2) (1.7) 0.2 NA
Earnings Before Incom e Taxes 189.2 183.8 3%
Provision for Incom e Taxes (72.8) (65.9) (10)%
Net Earnings $ 116.4 $ 117.9 (1)%
(1)
Net Earnings Excluding Tax Changes $ 116.4 $ 111.1 5%
Non-GAAP financial measure; refer to Appendix - Non-GAAP Financial Measures.
(1)
Our primary measure of segment financial performance excludes restructuring and other (charges)/recoveries, net; however, the applicable portion of the restructuring and
(2)
other (charges)/recoveries, net that related to each segment was as follows: FMS – ($1.5) and SCS – ($0.2) in 2007; and FMS – $0.1 and SCS – $0.1 in 2006.
9
10. Capital Expenditures
($ Millions)
Year-to-Date
2007 $
2007 2006 O/(U) 2006
Full Service Lease $ 553 $ 598 $ (45)
Commercial Rental 189 189 -
Operating Property and Equipment 46 28 18
Gross Capital Expenditures 788 815 (27)
Less: Proceeds from Sales (Primarily Revenue Earning Equipment) 195 180 15
Less: Proceeds from Sale and Leaseback of Revenue Earning Equipment 150 - 150
Net Capital Expenditures $ 443 $ 635 $ (192)
Memo: Acquisitions $ - $ 4 $ (4)
10
11. Cash Flow
($ Millions)
Year-to-Date
2007 2006
Net Earnings $ 116 $ 118
Depreciation 399 362
Gains on Vehicle Sales, Net (29) (28)
Amortization and Other Non-Cash Charges, Net 12 9
Changes in Working Capital and Deferred Taxes 7 (163)
Cash Provided by Operating Activities 505 298
Proceeds from Sales (Primarily Revenue Earning Equipment) 195 180
Sale and Leaseback of Revenue Earning Equipment 150 -
Collections of Direct Finance Leases 32 34
Other, Net 1 1
(1)
Total Cash Generated 883 513
(2)
Capital Expenditures (885) (776)
Acquisitions - (4)
(1)
Free Cash Flow $ (2) $ (267)
(1) Non-GAAP financial measure; refer to Appendix – Non-GAAP Financial Measures
(2) Capital expenditures presented net of changes in accounts payable related to purchases of revenue earning equipment
11
12. Debt to Equity Ratio
($ Millions)
300% 275%
275%
234%
250% (1)
Total Obligations to Equity
201%
200%
Balance Sheet Debt to Equity
168% 172%
151%
146%
129%
150%
100%
50%
0%
12/31/00 12/31/01 12/31/02 12/31/03 12/31/04 12/31/05 12/31/06 6/30/07 Long
Term
Target (2)
Midpoint
6/30/07 12/31/06 6/30/06
Balance Sheet Debt $ 2,900 $ 2,817 $ 2,489
161% 164% 151%
Percent To Equity
(1)
$ 3,096 $ 2,895 $ 2,578
Total Obligations
(1)
172% 168% 156%
Percent To Equity
Total Equity $ 1,799 $ 1,721 $ 1,648
Note: Includes impact of accumulated net pension related equity charge of $185 million as of 6/30/07, $201 million as of 12/31/06, and $221 million as of 6/30/06.
(1) Non-GAAP financial measure. Total obligations include the present value of minimum lease payments and guaranteed residual values under operating leases of
$196 million at 6/30/07, $78 million at 12/31/06 and $89 million at 6/30/06.
(2) Represents long term total obligations to equity target of 250 - 300% while maintaining a strong investment grade rating.
12
13. (1)
Financial Indicators Forecast
($ Millions)
Total Cash Generated (2) Gross Capital Expenditures
$1,760
$1,635 Revenue Earning Equipment
$1,381 PP&E/Other $1,411
$1,255 $1,255
$1,289
$1,183
$1,091 $1,165
$1,054
$949
$835
$725
$657 $600
2000 2001 2002 2003 2004 2005 2006 2007 2000 2001 2002 2003 2004 2005 2006 2007
Forecast Forecast
Midpoint Midpoint
Memo: Free Cash Flow (2)
(270) 131 367 260 140 (231)(3) (444) 305
(2)
Total Obligations to Equity Ratio
275% Equity
234% Total Obligations (2)
201%
168%
157%
151%
146%
Significant and predictable cash generation
129%
Invest in growth
Increase assets under management
2000 2001 2002 2003 2004 2005 2006 2007
Forecast Increase financial leverage
Midpoint
Memo: Assets Under Management
7,030 6,928 6,626 6,751 7,301 7,534 8,141 8,205
Free Cash Flow and Debt to Equity include acquisitions. Gross Capital Expenditures exclude acquisitions.
(1)
Non-GAAP financial measure; refer to Appendix - Non-GAAP Financial Measures.
(2)
13
Includes $176 million payment to the IRS related to full resolution of 1998 - 2000 tax period matters.
(3)
14. Contents
► Second Quarter 2007 Results Overview
► Asset Management Update
► Earnings Outlook
►Q & A
14
15. Asset Management Update
► The number of used vehicles sold in the second quarter was 6,499,
up 22% compared with prior year
► Retail sales proceeds per unit for tractors and trucks were down 11% and
2%, respectively, in the second quarter compared with prior year
► Vehicles no longer earning revenue were 10,685 at quarter end; up 4,927 vs.
prior year driven primarily by a higher used truck center inventory
► Units held for sale were 10,371 at quarter end
► Average commercial rental fleet was down 10% year-over-year
Note: U.S. only
15
16. Contents
► Second Quarter 2007 Results Overview
► Asset Management Update
► Earnings Outlook
►Q & A
16
17. EPS Forecast
($ Earnings Per Share)
► Narrowing full year 2007 earnings forecast range to $4.30 to $4.35 per share
► Current forecast for EPS is as follows:
Third
Quarter Full Year
2007 EPS Forecast $ 1.20 - 1.23 * $ 4.30 - 4.35 *
(1) (1)
2006 Comparable EPS $ 1.12 $ 3.99
* Excludes any charges related to Michigan tax law change, the magnitude of which is currently being evaluated.
(1) Non-GAAP financial measure. Excludes tax changes and pension charge in 2006.
17
20. Fleet Management Solutions (FMS)
($ Millions)
Second Quarter
2007 2006 % B/(W)
$ 489.2 $ 460.1 6%
Full Service Lease
40.0 34.0 18%
Contract Maintenance
529.2 494.1 7%
Contractual Revenue
50.1 47.8 5%
Contract-related Maintenance
145.3 170.8 (15)%
Commercial Rental
17.6 17.4 1%
Other
(a)
742.2 730.1 2%
Operating Revenue
295.1 319.4 (8)%
Fuel Services Revenue
$ 1,037.3 1,049.5 (1)%
Total Revenue
$ 97.5 $ 94.9 3%
Segment Net Before Tax Earnings (NBT)
9.4% 9.0%
Segment NBT as % of Total Revenue
(a)
13.1% 13.0%
Segment NBT as % of Operating Revenue
(a)
The Company uses operating revenue, a non-GAAP financial measure, to evaluate the operating performance of the FMS
business segment and as a measure of sales activity. Fuel services revenue, which is directly impacted by fluctuations in market
fuel prices, is excluded from the operating revenue computation as fuel is largely a pass-through to customers for which the
Company realizes minimal changes in profitability during periods of steady market fuel prices. However, profitability may be
positively or negatively impacted by sudden increases or decreases in market fuel prices during a short period of time as customer
pricing for fuel services is established based on market fuel costs.
20
21. Fleet Management Solutions (FMS)
($ Millions)
Year-to-Date
2007 2006 % B/(W)
$ 965.2 $ 911.5 6%
Full Service Lease
77.2 66.8 16%
Contract Maintenance
1,042.4 978.3 7%
Contractual Revenue
102.2 95.1 7%
Contract-related Maintenance
276.3 320.8 (14)%
Commercial Rental
35.2 35.4 (1)%
Other
(a)
1,456.1 1,429.6 2%
Operating Revenue
569.3 601.0 (5)%
Fuel Services Revenue
$ 2,025.4 $ 2,030.6 0%
Total Revenue
$ 178.3 $ 169.8 5%
Segment Net Before Tax Earnings (NBT)
8.8% 8.4%
Segment NBT as % of Total Revenue
(a)
12.2% 11.9%
Segment NBT as % of Operating Revenue
(a)
The Company uses operating revenue, a non-GAAP financial measure, to evaluate the operating performance of the FMS
business segment and as a measure of sales activity. Fuel services revenue, which is directly impacted by fluctuations in market
fuel prices, is excluded from the operating revenue computation as fuel is largely a pass-through to customers for which the
Company realizes minimal changes in profitability during periods of steady market fuel prices. However, profitability may be
positively or negatively impacted by sudden increases or decreases in market fuel prices during a short period of time as customer
pricing for fuel services is established based on market fuel costs.
21
22. Supply Chain Solutions (SCS)
($ Millions)
Second Quarter
2007 2006 % B/(W)
U.S. Operating Revenue
$ 138.3 $ 125.6 10%
Automotive & Industrial
74.5 74.4 0%
High Tech & Consumer Industries
8.1 7.7 5%
Transportation Management
220.9 207.7 6%
U.S. Operating Revenue
109.1 83.6 30%
International Operating Revenue
(a)
330.0 291.3 13%
Operating Revenue
254.0 210.8 20%
Subcontracted Transportation
$ 584.0 $ 502.1 16%
Total Revenue
$ 15.5 $ 18.1 (14)%
Segment Net Before Tax Earnings (NBT)
2.6% 3.6%
Segment NBT as % of Total Revenue
(a)
4.7% 6.2%
Segment NBT as % of Operating Revenue
$ 31.3 $ 27.8 (13)%
Memo: Fuel Costs
(a)
The Company uses operating revenue, a non-GAAP financial measure, to evaluate the operating performance of the SCS business segment
and as a measure of sales activity. Subcontracted transportation is deducted from total revenue to arrive at operating revenue as
subcontracted transportation is largely a pass-through to customers. The Company realizes minimal changes in profitability as a result of
fluctuations in subcontracted transportation.
22
23. Supply Chain Solutions (SCS)
($ Millions)
Year-to-Date
2007 2006 % B/(W)
U.S. Operating Revenue
$ 275.1 $ 245.1 12%
Automotive & Industrial
149.0 143.2 4%
High Tech & Consumer Industries
16.5 14.6 14%
Transportation Management
440.6 402.9 9%
U.S. Operating Revenue
211.5 160.7 31%
International Operating Revenue
(a)
652.1 563.6 16%
Operating Revenue
498.3 408.0 22%
Subcontracted Transportation
$ 1,150.4 $ 971.6 18%
Total Revenue
$ 26.9 $ 28.7 (6)%
Segment Net Before Tax Earnings (NBT)
2.3% 3.0%
Segment NBT as % of Total Revenue
(a)
4.1% 5.1%
Segment NBT as % of Operating Revenue
$ 59.2 $ 52.7 (12)%
Memo: Fuel Costs
(a)
The Company uses operating revenue, a non-GAAP financial measure, to evaluate the operating performance of the SCS business segment
and as a measure of sales activity. Subcontracted transportation is deducted from total revenue to arrive at operating revenue as
subcontracted transportation is largely a pass-through to customers. The Company realizes minimal changes in profitability as a result of
fluctuations in subcontracted transportation.
23
24. Dedicated Contract Carriage (DCC)
($ Millions)
Second Quarter
2007 2006 % B/(W)
(a)
$ 138.1 $ 139.1 (1)%
Operating Revenue
3.0 4.4 (33)%
Subcontracted Transportation
$ 141.1 $ 143.5 (2)%
Total Revenue
$ 12.5 $ 11.2 12%
Segment Net Before Tax Earnings (NBT)
8.9% 7.8%
Segment NBT as % of Total Revenue
(a)
9.1% 8.0%
Segment NBT as % of Operating Revenue
$ 26.5 $ 27.5 4%
Memo: Fuel Costs
(a)
The Company uses operating revenue, a non-GAAP financial measure, to evaluate the operating performance of the DCC business segment
and as a measure of sales activity. Subcontracted transportation is deducted from total revenue to arrive at operating revenue as
subcontracted transportation is largely a pass-through to customers. The Company realizes minimal changes in profitability as a result of
fluctuations in subcontracted transportation.
24
25. Dedicated Contract Carriage (DCC)
($ Millions)
Year-to-Date
2007 2006 % B/(W)
(a)
$ 273.7 $ 272.6 0%
Operating Revenue
5.9 9.6 (38)%
Subcontracted Transportation
$ 279.6 $ 282.2 (1)%
Total Revenue
$ 22.9 $ 19.6 16%
Segment Net Before Tax Earnings (NBT)
8.2% 7.0%
Segment NBT as % of Total Revenue
(a)
8.4% 7.2%
Segment NBT as % of Operating Revenue
$ 51.2 $ 52.5 3%
Memo: Fuel Costs
(a)
The Company uses operating revenue, a non-GAAP financial measure, to evaluate the operating performance of the DCC business segment
and as a measure of sales activity. Subcontracted transportation is deducted from total revenue to arrive at operating revenue as
subcontracted transportation is largely a pass-through to customers. The Company realizes minimal changes in profitability as a result of
fluctuations in subcontracted transportation.
25
26. Central Support Services (CSS)
($ Millions)
Second Quarter
2007 2006 % B/(W)
$ 36.2 $ 37.6 4%
Allocated CSS Costs
12.0 11.3 (6)%
Unallocated CSS Costs
$ 48.2 $ 48.9 2%
Total CSS Costs
26
30. (a)
Assets Under Management
($ Millions)
Forecast
Midpoint
2007 (b)
2000 2001 2002 2003 2004 2005 2006 6/30/07
Revenue Earning Equipment $ 4,588 $ 4,148 $ 4,493 $ 5,809 $ 6,352 $ 6,658 $ 7,335 $ 7,339 $ 7,300
Direct Finance Leases 637 640 622 656 649 624 592 586 580
Operating Leases 1,805 2,140 1,511 286 300 252 214 326 325
Assets Under Management $ 7,030 $ 6,928 $ 6,626 $ 6,751 $ 7,301 $ 7,534 $ 8,141 $ 8,251 $ 8,205
(a) Assets under management represent the original cost of all vehicles owned and held under lease by Ryder.
(b) Excludes impact of foreign exchange movements in 2007.
30
31. Non-GAAP Financial Measures
► This presentation includes “non-GAAP financial measures” as defined by SEC rules. As required by SEC rules, we
provide a reconciliation of each non-GAAP financial measure to the most comparable GAAP measure and an
explanation why management believes that presentation of the non-GAAP financial measure provides useful
information to investors. Non-GAAP financial measures should be considered in addition to, but not as a substitute
for or superior to, other measures of financial performance prepared in accordance with GAAP.
► Specifically, the following non-GAAP financial measures are included in this presentation:
Reconciliation & Additional Information
Non-GAAP Financial Measure Comparable GAAP Measure Presented on Slide Titled Page
Operating Revenue Total Revenue Key Financial Statistics 6-7
Comparable Earnings Per Share / Net Earnings EPS and Net Earnings Reconciliation 32
Net Earnings Excluding Tax Changes
Earnings Before Restructuring and Income Taxes Net Earnings Business Segment 8-9
Adjusted Return on Capital Net Earnings Adjusted Return on Capital Reconciliation 33
Total Cash Generated / Free Cash Flow Cash Provided by Operating Activities Cash Flow Reconciliation 34 - 36
Total Obligations / Total Obligations to Equity Balance Sheet Debt / Debt to Equity Debt to Equity Ratio 12
Debt to Equity Reconciliation 37 - 38
FMS / SCS / DCC Operating Revenue and Segment FMS / SCS / DCC Total Revenue and Segment NBT Fleet Management Solutions / Supply Chain 20 - 25
NBT as % of Operating Revenue as % of Total Revenue Solutions / Dedicated Contract Carriage
31
32. EPS and Net Earnings Reconciliation
($ Millions or
$ Earnings Per Share)
2Q06 - 2Q06 - YTD06 - YTD06 -
Net Earnings EPS Net Earnings EPS
Net Earnings $ 70.3 $ 1.13 $ 117.9 $ 1.91
Less: Tax Changes 6.8 0.11 6.8 0.11
Net Earnings Excluding Tax Changes $ 63.5 $ 1.02 $ 111.1 $ 1.80
* Earnings per share amounts are calculated independently for each component and may not be additive due to rounding
32
33. Adjusted Return on Capital Reconciliation
($ Millions)
6/30/07 6/30/06
(1)
Net Earnings $ 247 $ 240
Discontinued Operations - (2)
Cumulative Effect of Changes in Accounting Principles - 2
Income Taxes 151 143
Adjusted Earnings Before Income Taxes 398 383
(2)
Adjusted Interest Expense 161 136
(3)
Adjusted Income Taxes (212) (202)
Adjusted Net Earnings $ 347 $ 317
Average Total Debt $ 2,755 $ 2,265
Average Off-Balance Sheet Debt 98 124
(4)
Average Adjusted Total Shareholders' Equity 1,712 1,562
Adjusted Average Total Capital $ 4,565 $ 3,951
(5)
Adjusted Return on Capital 7.6% 8.0%
Earnings calculated based on a 12-month rolling period.
(1)
Interest expense includes implied interest on off-balance sheet vehicle obligations.
(2)
Income taxes were calculated using the effective income tax rate for the period exclusive of benefits from tax law changes recognized in 2006 and 2005.
(3)
Represents shareholders’ equity adjusted for discontinued operations, accounting changes and the tax benefits in those periods.
(4)
The Company adopted adjusted return on capital, a non GAAP financial measure, as the Company believes that both debt (including off-balance sheet debt)
(5)
and equity should be included in evaluating how effectively capital is utilized across the business.
Note: Prior year has been restated to conform with current year presentation
33
34. Cash Flow Reconciliation
($ Millions)
12/31/00 (4) 12/31/01 12/31/02 12/31/03 12/31/04 12/31/05 12/31/06
Cash Provided by Operating Activities $ 1,023 $ 365 $ 617 $ 803 $ 867 $ 779 $ 854
Less: Changes in Balance of Trade Receivables Sold (270) 235 110 - - - -
Collections of Direct Finance Leases 67 66 66 61 64 70 66
230 173 152 210 331 334 333
Proceeds from Sales (Primarily Revenue Earning Equipment)
Proceeds from Sale and Leaseback of Assets - - - 13 118 - -
Other Investing, Net 4 (4) 4 4 1 - 2
(1)
1,054 835 949 1,091 1,381 1,183 1,255
Total Cash Generated
Capital Expenditures (2) (1,296) (704) (582) (734) (1,092) (1,399) (1,695)
Acquisitions (28) - - (97) (149) (15) (4)
(3)
Free Cash Flow $ (270) $ 131 $ 367 $ 260 $ 140 $ (231) $ (444)
Memo:
Depreciation Expense $ 580 $ 545 $ 552 $ 625 $ 706 $ 740 $ 743
Gains on Vehicle Sales, Net $ 19 $ 12 $ 14 $ 16 $ 35 $ 47 $ 51
The Company uses total cash generated, a non-GAAP financial measure, because management considers it to be an important measure of comparative operating performance.
(1)
Management believes total cash generated provides investors with an important measure of total cash inflows generated from our on-going business activities which include sales of
revenue earning equipment, sales of operating property and equipment, sale and leaseback of revenue earning equipment, collections on direct finance leases and other cash inflows.
Capital expenditures presented net of changes in accounts payable related to purchases of revenue earning equipment.
(2)
The Company uses free cash flow, a non-GAAP financial measure, because management considers it to be an important measure of comparative operating performance. Management
(3)
believes free cash flow provides investors with an important perspective on the cash available for debt service and shareholders after making capital investments required to support
ongoing business operations. The calculation of free cash flow may be different from the calculation used by other companies and therefore comparability may be limited.
Amounts have not been recasted to give effect for the impact of foreign exchange movements on cash for which the impact is not expected to be significant.
(4)
34
35. Cash Flow Reconciliation
($ Millions)
Forecast
Midpoint
12/31/07
Cash Provided by Operating Activities $ 1,100
Collections of Direct Finance Leases 65
Proceeds from Sales (Primarily Revenue Earning Equipment) 320
Proceeds from Sale and Leaseback of Revenue Earning Equipment 150
(1)
Total Cash Generated 1,635
Capital Expenditures (2) (1,330)
Free Cash Flow (3) $ 305
The Company uses total cash generated, a non-GAAP financial measure, because management considers it to be an important measure of
(1)
comparative operating performance. Management believes total cash generated provides investors with an important measure of total cash inflows
generated from our on-going business activities which include sales of revenue earning equipment, sales of operating property and equipment, sale and
leaseback of revenue earning equipment, collections on direct finance leases and other cash inflows.
Capital expenditures presented net of changes in accounts payable related to purchases of revenue earning equipment.
(2)
The Company uses free cash flow, a non-GAAP financial measure, because management considers it to be an important measure of comparative
(3)
operating performance. Management believes free cash flow provides investors with an important perspective on the cash available for debt service and
shareholders after making capital investments required to support ongoing business operations. The calculation of free cash flow may be different from
the calculation used by other companies and therefore comparability may be limited.
35
36. Cash Flow Reconciliation
($ Millions)
6/30/07 6/30/06
Cash Provided by Operating Activities $ 505 $ 298
Collections of Direct Finance Leases 32 34
Proceeds from Sales (Primarily Revenue Earning Equipment) 195 180
Sale and Leaseback of Revenue Earning Equipment 150 -
Other Investing, net 1 1
(1)
Total Cash Generated 883 513
Capital Expenditures (2) (885) (776)
Acquisitions - (4)
Free Cash Flow (3) $ (2) $ (267)
The Company uses total cash generated, a non-GAAP financial measure, because management considers it to be an important measure of
(1)
comparative operating performance. Management believes total cash generated provides investors with an important measure of total cash inflows
generated from our on-going business activities which include sales of revenue earning equipment, sales of operating property and equipment, sale and
leaseback of revenue earning equipment, collections on direct finance leases and other cash inflows.
Capital expenditures presented net of changes in accounts payable related to purchases of revenue earning equipment.
(2)
The Company uses free cash flow, a non-GAAP financial measure, because management considers it to be an important measure of comparative
(3)
operating performance. Management believes free cash flow provides investors with an important perspective on the cash available for debt service and
shareholders after making capital investments required to support ongoing business operations. The calculation of free cash flow may be different from
the calculation used by other companies and therefore comparability may be limited.
36
37. Debt to Equity Reconciliation
($ Millions)
% to % to % to % to % to % to % to
12/31/00 Equity 12/31/01 Equity 12/31/02 Equity 12/31/03 Equity 12/31/04 Equity 12/31/05 Equity 12/31/06 Equity
Balance Sheet Debt $2,017 161% $1,709 139% $1,552 140% $1,816 135% $1,783 118% $2,185 143% $2,817 164%
Receivables Sold 345 110 - - - - -
PV of minimum
lease payments
and guaranteed
residual values
under operating
leases for vehicles 879 625 370 153 161 117 78
PV of contingent
rentals under
securitizations 209 441 311 - - - -
Total Obligations (1) $3,450 275% $2,885 234% $2,233 201% $1,969 146% $1,944 129% $2,302 151% $2,895 168%
(1) The Company uses total obligations and total obligations to equity, non-GAAP financial measures, which include certain off-balance sheet
financial obligations relating to revenue earning equipment. Management believes these non-GAAP financial measures are useful to investors
as they are more complete measures of the Company’s existing financial obligations and help investors better assess the Company’s overall
leverage position.
Note: In connection with adopting FIN 46 effective July 1, 2003, the Company consolidated the vehicle securitization trusts previously disclosed as
off-balance sheet debt.
37
38. Debt to Equity Reconciliation
($ Millions)
Forecast
Midpoint % to
12/31/07 Equity
Balance Sheet Debt $ 2,670 147%
PV of minimum lease payments and
guaranteed residual values under
operating leases for vehicles 170
(1)
Total Obligations $ 2,840 157%
(1) The Company uses total obligations and total obligations to equity, non-GAAP financial measures, which include certain
off-balance sheet financial obligations relating to revenue earning equipment. Management believes these non-GAAP
financial measures are useful to investors as they are more complete measures of the Company’s existing financial
obligations and help investors better assess the Company’s overall leverage position.
38