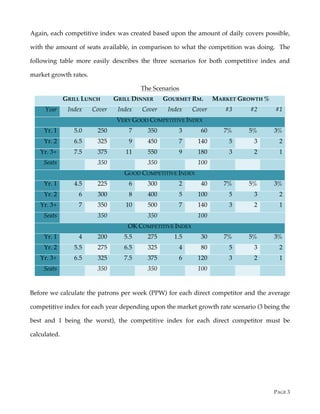
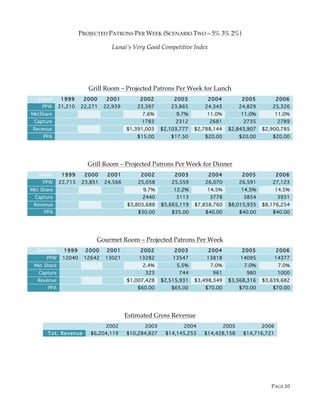
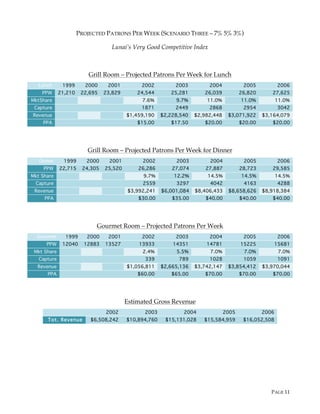
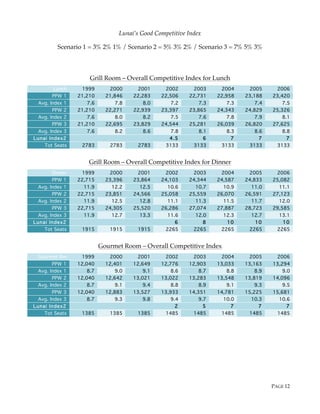
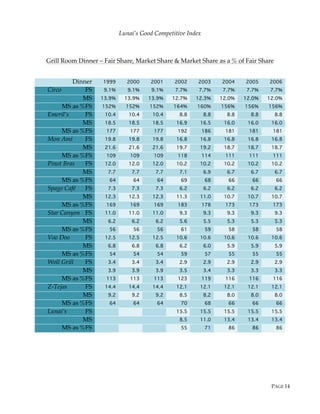
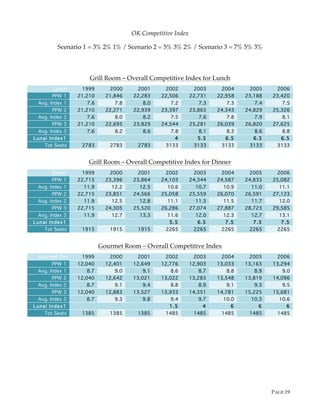
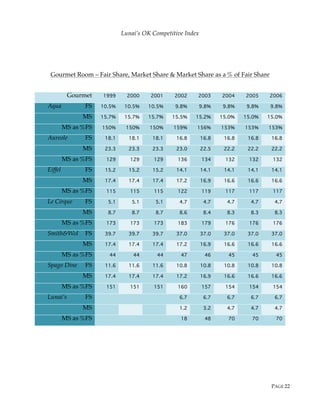
SlideShare a Scribd company logo
PAGE 1
THE BUILD-UP APPROACH FOR FORECASTING REVENUE
Infinity Hospitality & Entertainment International will be using a build-up approach for
forecasting revenue based upon an analysis of the direct competition’s restaurant activity.
The build-up approach uses a competitive index where the patrons per week at each meal
period is divided by the number of seats available. This competitive index indicates the
restaurant’s productivity and popularity by representing the number of patrons served per seat
in one week.
This index is then used in combination with the predicted market growth rate and the
estimated per person average to forecast food sales for each year.
The market growth rate has been configured for three different scenarios and the competitive
index has also been predicted based on three different scenarios. This creates a total of nine
different statements of income and expenses based upon the three different market growth
rates and the three different competitive indexes.
The three different market growth rate scenarios use the conservatism principal approach.
Scenario 1 has a growth rate of 3% the first year, 2% the second year and 1% the years
following. Scenario 2 has a growth rate of 5% the first year, 3% the second year and 2% the
years following. Scenario 3 has a growth rate of 7% the first year, 5% the second year and 3%
the years following. Scenario 3 is the most probable due to the market analysis and the
economic indicators discussed prior.
The three different competitive index scenarios use the conservatism principal approach as well.
The competitive index scenarios were created by based upon the amount of daily covers
possible, with the amount of seats available, in comparison to what the competition was
doing.
PAGE 2
For the purposes of this restaurant, each meal period and each room were given a
competitive index. Furthermore, the first year of operation was the lowest competitive index
while the second year increased in sales due to Lunai’s popularity while the third year
increases and becomes the stabilized year.
So, for the Grill Room Lunch, Lunai’s OK Competitive Index earns a 4 for the first year of
operation, 5.5 for the second year of operation and 6.5 for the third year and beyond. Lunai’s
Good Competitive Index earns a 4.5 for the first year of operation, 6 for the second year of
operation and 7 for the third year and beyond. Lunai’s Very Good Competitive Index earns
a 5 for the first year of operation, 6.5 for the second year of operation and 7.5 for the third
year and beyond.
For the Grill Room Dinner, Lunai’s OK Competitive Index earns a 5.5 for the first year of
operation, 6.5 for the second year of operation and 7.5 for the third year and beyond. Lunai’s
Good Competitive Index earns a 6 for the first year of operation, 8 for the second year of
operation and 10 for the third year and beyond. Lunai’s Very Good Competitive Index
earns a 7 for the first year of operation, 9 for the second year of operation and 11 for the third
year and beyond.
For the Gourmet Room, which is open only 5 days a week, Lunai’s OK Competitive Index
earns a 1.5 for the first year of operation, 4 for the second year of operation and 6 for the third
year and beyond. Lunai’s Good Competitive Index earns a 2 for the first year of operation, 5
for the second year of operation and 7 for the third year and beyond. Lunai’s Very Good
Competitive Index earns a 3 for the first year of operation, 7 for the second year of operation
and 9 for the third year and beyond.
PAGE 3
Again, each competitive index was created based upon the amount of daily covers possible,
with the amount of seats available, in comparison to what the competition was doing. The
following table more easily describes the three scenarios for both competitive index and
market growth rates.
The Scenarios
GRILL LUNCH GRILL DINNER GOURMET RM. MARKET GROWTH %
Year Index Cover Index Cover Index Cover #3 #2 #1
VERY GOOD COMPETITIVE INDEX
Yr. 1 5.0 250 7 350 3 60 7% 5% 3%
Yr. 2 6.5 325 9 450 7 140 5 3 2
Yr. 3+ 7.5 375 11 550 9 180 3 2 1
Seats 350 350 100
GOOD COMPETITIVE INDEX
Yr. 1 4.5 225 6 300 2 40 7% 5% 3%
Yr. 2 6 300 8 400 5 100 5 3 2
Yr. 3+ 7 350 10 500 7 140 3 2 1
Seats 350 350 100
OK COMPETITIVE INDEX
Yr. 1 4 200 5.5 275 1.5 30 7% 5% 3%
Yr. 2 5.5 275 6.5 325 4 80 5 3 2
Yr. 3+ 6.5 325 7.5 375 6 120 3 2 1
Seats 350 350 100
Before we calculate the patrons per week (PPW) for each direct competitor and the average
competitive index for each year depending upon the market growth rate scenario (3 being the
best and 1 being the worst), the competitive index for each direct competitor must be
calculated.
PAGE 4
Based upon the information collected in the Competition Analysis, the direct competition’s
competitive index values for each meal period are:
Grill Room Competition – Competitive Index
Direct Comp. Lch PPW Din PPW Seats LnchIndex DinIndex
Circo 1680 3150 175 9.6 18
Cozymels* 1400 - 320 4.4* -
Emeril’s 1400 4200 200 7 21
Gordon Biersch* 3500 - 310 11.3* -
McCormick &* 1680 - 230 7.3* -
Mon Ami Gabi 2100 4900 380 5.5 12.9
PF Changs* 3500 - 248 14.1* -
Pinot Brasserie 700 1750 230 3 7.6
Spago Café 3150 2800 140 22.5 20
Star Canyon 700 1400 210 3.3 6.7
Voo Doo Café - 1540 240 - 6.4
Wollensky Grill 350 875 65 5.4 13.5
Z-Tejas 1050 2100 275 3.8 7.6
Total 21,210 (12) 22,715 (9)
2783-L
1915-D 7.62 11.86
*lunch only
Gourmet Room Competition – Competitive Index
Direct Competition PPW Seats Competitive Index
Aqua 1890 145 13
Aureole 2800 250 11.2
Eiffel Tower 2100 210 10
Le Cirque 1050 70 15
Smith & Wollensky 2100 550 3.8
Spago Dining 2100 160 13.1
Total 12,040 1385 8.69
PAGE 5
Now that the competitive index is calculated, we can calculate the patrons per week (PPW)
for each direct competitor and the average competitive index for each year depending upon
the market growth rate.
Lunai’s Very Good Competitive Index
Scenario 1 = 3% 2% 1% / Scenario 2 = 5% 3% 2% / Scenario 3 = 7% 5% 3%
Grill Room – Overall Competitive Index for Lunch
Lunch 1999 2000 2001 2002 2003 2004 2005 2006
PPW 1 21,210 21,846 22,283 22,506 22,731 22,958 23,188 23,420
Avg. Index 1 7.6 7.8 8.0 7.2 7.3 7.3 7.4 7.5
PPW 2 21,210 22,271 22,939 23,397 23,865 24,343 24,829 25,326
Avg. Index 2 7.6 8.0 8.2 7.5 7.6 7.8 7.9 8.1
PPW 3 21,210 22,695 23,829 24,544 25,281 26,039 26,820 27,625
Avg. Index 3 7.6 8.2 8.6 7.8 8.1 8.3 8.6 8.8
Lunai Index3 5 6.5 7.5 7.5 7.5
Tot Seats 2783 2783 2783 3133 3133 3133 3133 3133
Grill Room – Overall Competitive Index for Dinner
Dinner 1999 2000 2001 2002 2003 2004 2005 2006
PPW 1 22,715 23,396 23,864 24,103 24,344 24,587 24,833 25,082
Avg. Index 1 11.9 12.2 12.5 10.6 10.7 10.9 11.0 11.1
PPW 2 22,715 23,851 24,566 25,058 25,559 26,070 26,591 27,123
Avg. Index 2 11.9 12.5 12.8 11.1 11.3 11.5 11.7 12.0
PPW 3 22,715 24,305 25,520 26,286 27,074 27,887 28,723 29,585
Avg. Index 3 11.9 12.7 13.3 11.6 12.0 12.3 12.7 13.1
Lunai Index3 7 9 11 11 11
Tot Seats 1915 1915 1915 2265 2265 2265 2265 2265
Gourmet Room – Overall Competitive Index
Gourmet Rm 1999 2000 2001 2002 2003 2004 2005 2006
PPW 1 12040 12401 12649 12776 12903 13033 13163 13294
Avg. Index 1 8.7 9.0 9.1 8.6 8.7 8.8 8.9 9.0
PPW 2 12040 12642 13021 13282 13547 13818 14095 14377
Avg. Index 2 8.7 9.1 9.4 8.9 9.1 9.3 9.5 9.7
PPW 3 12040 12883 13527 13933 14351 14781 15225 15681
Avg. Index 3 8.7 9.3 9.8 9.4 9.7 10.0 10.3 10.6
Lunai Index3 3 7 9 9 9
Tot Seats 1385 1385 1385 1485 1485 1485 1485 1485
Since fair share and market share percentages are not impacted by market growth rates,
only one table for each meal period is required:
PAGE 6
Lunai’s Very Good Competitive Index
Grill Room Lunch – Fair Share, Market Share & Market Share as a % of Fair Share
Lunch 1999 2000 2001 2002 2003 2004 2005 2006
Circo FS 6.3% 6.3% 6.3% 5.6% 5.6% 5.6% 5.6% 5.6%
MS 7.9% 7.9% 7.9% 7.3% 7.2% 7.0% 7.0% 7.0%
MS as %FS 126% 126% 126% 131% 128% 126% 126% 126%
Cozymels FS 11.5 11.5 11.5 10.2 10.2 10.2 10.2 10.2
MS 6.6 6.6 6.6 6.1 6.0 5.9 5.9 5.9
MS as %FS 57 57 57 60 58 58 58 58
Emeril’s FS 7.2 7.2 7.2 6.4 6.4 6.4 6.4 6.4
MS 6.6 6.6 6.6 6.1 6.0 5.9 5.9 5.9
MS as %FS 92 92 92 96 93 92 92 92
Gordon FS 11.1 11.1 11.1 9.9 9.9 9.9 9.9 9.9
MS 16.5 16.5 16.5 9.9 9.9 9.9 9.9 9.9
MS as %FS 148 148 148 154 151 148 148 148
McCormick FS 8.3 8.3 8.3 7.3 7.3 7.3 7.3 7.3
MS 7.9 7.9 7.9 7.3 7.2 7.0 7.0 7.0
MS as %FS 96 96 96 100 97 96 96 96
Mon Ami FS 13.7 13.7 13.7 12.1 12.1 12.1 12.1 12.1
MS 9.9 9.9 9.9 9.1 8.9 8.8 8.8 8.8
MS as %FS 73 73 73 75 74 73 73 73
PF Changs FS 8.9 8.9 8.9 7.9 7.9 7.9 7.9 7.9
MS 16.5 16.5 16.5 15.2 14.9 14.7 14.7 14.7
MS as %FS 185 185 185 193 188 186 186 186
Pinot Bras FS 8.3 8.3 8.3 7.3 7.3 7.3 7.3 7.3
MS 3.3 3.3 3.3 3.0 3.0 2.9 2.9 2.9
MS as %FS 40 40 40 42 41 40 40 40
Spago Café FS 5.0 5.0 5.0 4.5 4.5 4.5 4.5 4.5
MS 14.9 14.9 14.9 13.7 13.4 13.2 13.2 13.2
MS as %FS 295 295 295 307 300 296 296 296
Star Canyon FS 7.5 7.5 7.5 6.7 6.7 6.7 6.7 6.7
MS 3.3 3.3 3.3 3.0 3.0 2.9 2.9 2.9
MS as %FS 44 44 44 45 44 44 44 44
Woll Grill FS 2.3 2.3 2.3 2.1 2.1 2.1 2.1 2.1
MS 1.7 1.7 1.7 1.5 1.5 1.5 1.5 1.5
MS as %FS 71 71 71 73 72 71 71 71
Z-Tejas FS 9.9 9.9 9.9 8.8 8.8 8.8 8.8 8.8
MS 5.0 5.0 5.0 4.6 4.5 4.4 4.4 4.4
MS as %FS 50 50 50 52 51 50 50 50
Lunai’s FS 11.2 11.2 11.2 11.2 11.2
MS 7.6 9.7 11.0 11.0 11.0
MS as %FS 68 87 99 99 99
PAGE 7
Lunai’s Very Good Competitive Index
Grill Room Dinner – Fair Share, Market Share & Market Share as a % of Fair Share
Dinner 1999 2000 2001 2002 2003 2004 2005 2006
Circo FS 9.1% 9.1% 9.1% 7.7% 7.7% 7.7% 7.7% 7.7%
MS 13.9% 13.9% 13.9% 12.5% 12.2% 11.9% 11.9% 11.9%
MS as %FS 152% 152% 152% 162% 158% 153% 153% 153%
Emeril’s FS 10.4 10.4 10.4 8.8 8.8 8.8 8.8 8.8
MS 18.5 18.5 18.5 16.7 16.2 15.8 15.8 15.8
MS as %FS 177 177 177 189 184 179 179 179
Mon Ami FS 19.8 19.8 19.8 16.8 16.8 16.8 16.8 16.8
MS 21.6 21.6 21.6 19.5 18.9 18.4 18.4 18.4
MS as %FS 109 109 109 116 113 110 110 110
Pinot Bras FS 12.0 12.0 12.0 10.2 10.2 10.2 10.2 10.2
MS 7.7 7.7 7.7 7.0 6.8 6.6 6.6 6.6
MS as %FS 64 64 64 68 67 65 65 65
Spago Café FS 7.3 7.3 7.3 6.2 6.2 6.2 6.2 6.2
MS 12.3 12.3 12.3 11.1 10.8 10.5 10.5 10.5
MS as %FS 169 169 169 180 175 171 171 171
Star Canyon FS 11.0 11.0 11.0 9.3 9.3 9.3 9.3 9.3
MS 6.2 6.2 6.2 5.6 5.4 5.3 5.3 5.3
MS as %FS 56 56 56 60 58 57 57 57
Voo Doo FS 12.5 12.5 12.5 10.6 10.6 10.6 10.6 10.6
MS 6.8 6.8 6.8 6.1 6.0 5.8 5.8 5.8
MS as %FS 54 54 54 58 56 55 55 55
Woll Grill FS 3.4 3.4 3.4 2.9 2.9 2.9 2.9 2.9
MS 3.9 3.9 3.9 3.5 3.4 3.3 3.3 3.3
MS as %FS 113 113 113 121 118 115 115 115
Z-Tejas FS 14.4 14.4 14.4 12.1 12.1 12.1 12.1 12.1
MS 9.2 9.2 9.2 8.3 8.1 7.9 7.9 7.9
MS as %FS 64 64 64 69 67 65 65 65
Lunai’s FS 15.5 15.5 15.5 15.5 15.5
MS 9.7 12.2 14.5 14.5 14.5
MS as %FS 63 79 94 94 94
PAGE 8
Lunai’s Very Good Competitive Index
Gourmet Room – Fair Share, Market Share & Market Share as a % of Fair Share
Gourmet 1999 2000 2001 2002 2003 2004 2005 2006
Aqua FS 10.5% 10.5% 10.5% 9.8% 9.8% 9.8% 9.8% 9.8%
MS 15.7% 15.7% 15.7% 15.3% 14.8% 14.6% 14.6% 14.6%
MS as %FS 150% 150% 150% 157% 152% 150% 150% 150%
Aureole FS 18.1 18.1 18.1 16.8 16.8 16.8 16.8 16.8
MS 23.3 23.3 23.3 22.7 22.0 21.6 21.6 21.6
MS as %FS 129 129 129 135 131 129 129 129
Eiffel FS 15.2 15.2 15.2 14.1 14.1 14.1 14.1 14.1
MS 17.4 17.4 17.4 17.0 16.5 16.2 16.2 16.2
MS as %FS 115 115 115 120 117 115 115 115
Le Cirque FS 5.1 5.1 5.1 4.7 4.7 4.7 4.7 4.7
MS 8.7 8.7 8.7 8.5 8.2 8.1 8.1 8.1
MS as %FS 173 173 173 181 175 172 172 172
Smith&Wol FS 39.7 39.7 39.7 37.0 37.0 37.0 37.0 37.0
MS 17.4 17.4 17.4 17.0 16.5 16.2 16.2 16.2
MS as %FS 44 44 44 46 45 44 44 44
Spago Dine FS 11.6 11.6 11.6 10.8 10.8 10.8 10.8 10.8
MS 17.4 17.4 17.4 17.0 16.5 16.2 16.2 16.2
MS as %FS 151 151 151 158 153 151 151 151
Lunai’s FS 6.7 6.7 6.7 6.7 6.7
MS 2.4 5.5 7.0 7.0 7.0
MS as %FS 36 82 103 103 103
PAGE 9
PROJECTED PATRONS PER WEEK (SCENARIO ONE – 3% 2% 1%)
Lunai’s Very Good Competitive Index
Grill Room – Projected Patrons Per Week for Lunch
Lunch 1999 2000 2001 2002 2003 2004 2005 2006
PPW 21,210 21,846 22,283 22,506 22,731 22,958 23,188 23,420
Mkt
Share
7.6% 9.7% 11.0% 11.0% 11.0%
Capture 1715 2202 2528 2554 2579
Revenue $1,338,013 $2,003,794 $2,629,600 $2,655,896 $2,682,455
PPA $15.00 $17.50 $20.00 $20.00 $20.00
Grill Room – Projected Patrons Per Week for Dinner
Dinner 1999 2000 2001 2002 2003 2004 2005 2006
PPW 22,715 23,396 23,864 24,103 24,344 24,587 24,833 25,082
Mkt Share 9.7% 12.2% 14.5% 14.5% 14.5%
Capture 2347 2965 3563 3599 3635
Revenue $3,660,709 $5,395,881 $7,411,882 $7,486,001 $7,560,861
PPA $30.00 $35.00 $40.00 $40.00 $40.00
Gourmet Room – Projected Patrons Per Week
Gourmet 1999 2000 2001 2002 2003 2004 2005 2006
PPW 12040 12401 12649 12776 12903 13033 13163 13294
Mkt Share 2.4% 5.5% 7.0% 7.0% 7.0%
Capture 311 709 906 915 925
Revenue $969,049 $2,396,359 $3,299,420 $3,332,414 $3,365,738
PPA $60.00 $65.00 $70.00 $70.00 $70.00
Estimated Gross Revenue
2002 2003 2004 2005 2006
Tot. Revenue $5,967,772 $9,796,034 $13,340,902 $13,474,311 $13,609,054
PAGE 10
PROJECTED PATRONS PER WEEK (SCENARIO TWO – 5% 3% 2%)
Lunai’s Very Good Competitive Index
Grill Room – Projected Patrons Per Week for Lunch
Lunch 1999 2000 2001 2002 2003 2004 2005 2006
PPW 21,210 22,271 22,939 23,397 23,865 24,343 24,829 25,326
MktShare 7.6% 9.7% 11.0% 11.0% 11.0%
Capture 1783 2312 2681 2735 2789
Revenue $1,391,003 $2,103,777 $2,788,144 $2,843,907 $2,900,785
PPA $15.00 $17.50 $20.00 $20.00 $20.00
Grill Room – Projected Patrons Per Week for Dinner
Dinner 1999 2000 2001 2002 2003 2004 2005 2006
PPW 22,715 23,851 24,566 25,058 25,559 26,070 26,591 27,123
Mkt Share 9.7% 12.2% 14.5% 14.5% 14.5%
Capture 2440 3113 3778 3854 3931
Revenue $3,805,688 $5,665,119 $7,858,760 $8,015,935 $8,176,254
PPA $30.00 $35.00 $40.00 $40.00 $40.00
Gourmet Room – Projected Patrons Per Week
Gourmet 1999 2000 2001 2002 2003 2004 2005 2006
PPW 12040 12642 13021 13282 13547 13818 14095 14377
Mkt Share 2.4% 5.5% 7.0% 7.0% 7.0%
Capture 323 744 961 980 1000
Revenue $1,007,428 $2,515,931 $3,498,349 $3,568,316 $3,639,682
PPA $60.00 $65.00 $70.00 $70.00 $70.00
Estimated Gross Revenue
2002 2003 2004 2005 2006
Tot. Revenue $6,204,119 $10,284,827 $14,145,253 $14,428,158 $14,716,721
PAGE 11
PROJECTED PATRONS PER WEEK (SCENARIO THREE – 7% 5% 3%)
Lunai’s Very Good Competitive Index
Grill Room – Projected Patrons Per Week for Lunch
Lunch 1999 2000 2001 2002 2003 2004 2005 2006
PPW 21,210 22,695 23,829 24,544 25,281 26,039 26,820 27,625
MktShare 7.6% 9.7% 11.0% 11.0% 11.0%
Capture 1871 2449 2868 2954 3042
Revenue $1,459,190 $2,228,540 $2,982,448 $3,071,922 $3,164,079
PPA $15.00 $17.50 $20.00 $20.00 $20.00
Grill Room – Projected Patrons Per Week for Dinner
Dinner 1999 2000 2001 2002 2003 2004 2005 2006
PPW 22,715 24,305 25,520 26,286 27,074 27,887 28,723 29,585
Mkt Share 9.7% 12.2% 14.5% 14.5% 14.5%
Capture 2559 3297 4042 4163 4288
Revenue $3,992,241 $6,001,084 $8,406,433 $8,658,626 $8,918,384
PPA $30.00 $35.00 $40.00 $40.00 $40.00
Gourmet Room – Projected Patrons Per Week
Gourmet 1999 2000 2001 2002 2003 2004 2005 2006
PPW 12040 12883 13527 13933 14351 14781 15225 15681
Mkt Share 2.4% 5.5% 7.0% 7.0% 7.0%
Capture 339 789 1028 1059 1091
Revenue $1,056,811 $2,665,136 $3,742,147 $3,854,412 $3,970,044
PPA $60.00 $65.00 $70.00 $70.00 $70.00
Estimated Gross Revenue
2002 2003 2004 2005 2006
Tot. Revenue $6,508,242 $10,894,760 $15,131,028 $15,584,959 $16,052,508
PAGE 12
Lunai’s Good Competitive Index
Scenario 1 = 3% 2% 1% / Scenario 2 = 5% 3% 2% / Scenario 3 = 7% 5% 3%
Grill Room – Overall Competitive Index for Lunch
Lunch 1999 2000 2001 2002 2003 2004 2005 2006
PPW 1 21,210 21,846 22,283 22,506 22,731 22,958 23,188 23,420
Avg. Index 1 7.6 7.8 8.0 7.2 7.3 7.3 7.4 7.5
PPW 2 21,210 22,271 22,939 23,397 23,865 24,343 24,829 25,326
Avg. Index 2 7.6 8.0 8.2 7.5 7.6 7.8 7.9 8.1
PPW 3 21,210 22,695 23,829 24,544 25,281 26,039 26,820 27,625
Avg. Index 3 7.6 8.2 8.6 7.8 8.1 8.3 8.6 8.8
Lunai Index2 4.5 6 7 7 7
Tot Seats 2783 2783 2783 3133 3133 3133 3133 3133
Grill Room – Overall Competitive Index for Dinner
Dinner 1999 2000 2001 2002 2003 2004 2005 2006
PPW 1 22,715 23,396 23,864 24,103 24,344 24,587 24,833 25,082
Avg. Index 1 11.9 12.2 12.5 10.6 10.7 10.9 11.0 11.1
PPW 2 22,715 23,851 24,566 25,058 25,559 26,070 26,591 27,123
Avg. Index 2 11.9 12.5 12.8 11.1 11.3 11.5 11.7 12.0
PPW 3 22,715 24,305 25,520 26,286 27,074 27,887 28,723 29,585
Avg. Index 3 11.9 12.7 13.3 11.6 12.0 12.3 12.7 13.1
Lunai Index2 6 8 10 10 10
Tot Seats 1915 1915 1915 2265 2265 2265 2265 2265
Gourmet Room – Overall Competitive Index
Gourmet Rm 1999 2000 2001 2002 2003 2004 2005 2006
PPW 1 12,040 12,401 12,649 12,776 12,903 13,033 13,163 13,294
Avg. Index 1 8.7 9.0 9.1 8.6 8.7 8.8 8.9 9.0
PPW 2 12,040 12,642 13,021 13,022 13,283 13,548 13,819 14,096
Avg. Index 2 8.7 9.1 9.4 8.8 8.9 9.1 9.3 9.5
PPW 3 12,040 12,883 13,527 13,933 14,351 14,781 15,225 15,681
Avg. Index 3 8.7 9.3 9.8 9.4 9.7 10.0 10.3 10.6
Lunai Index2 2 5 7 7 7
Tot Seats 1385 1385 1385 1485 1485 1485 1485 1485
PAGE 13
Lunai’s Good Competitive Index
Grill Room Lunch – Fair Share, Market Share & Market Share as a % of Fair Share
Lunch 1999 2000 2001 2002 2003 2004 2005 2006
Circo FS 6.3% 6.3% 6.3% 5.6% 5.6% 5.6% 5.6% 5.6%
MS 7.9% 7.9% 7.9% 7.4% 7.2% 7.1% 7.1% 7.1%
MS as %FS 126% 126% 126% 132% 129% 127% 127% 127%
Cozymels FS 11.5 11.5 11.5 10.2 10.2 10.2 10.2 10.2
MS 6.6 6.6 6.6 6.1 6.0 5.9 5.9 5.9
MS as %FS 57 57 57 60 59 58 58 58
Emeril’s FS 7.2 7.2 7.2 6.4 6.4 6.4 6.4 6.4
MS 6.6 6.6 6.6 6.1 6.0 5.9 5.9 5.9
MS as %FS 92 92 92 96 94 93 93 93
Gordon FS 11.1 11.1 11.1 9.9 9.9 9.9 9.9 9.9
MS 16.5 16.5 16.5 9.9 9.9 9.9 9.9 9.9
MS as %FS 148 148 148 155 152 150 150 150
McCormick FS 8.3 8.3 8.3 7.3 7.3 7.3 7.3 7.3
MS 7.9 7.9 7.9 7.4 7.2 7.1 7.1 7.1
MS as %FS 96 96 96 100 98 97 97 97
Mon Ami FS 13.7 13.7 13.7 12.1 12.1 12.1 12.1 12.1
MS 9.9 9.9 9.9 9.2 9.0 8.9 8.9 8.9
MS as %FS 73 73 73 76 74 73 73 73
PF Changs FS 8.9 8.9 8.9 7.9 7.9 7.9 7.9 7.9
MS 16.5 16.5 16.5 15.4 15.0 14.8 14.8 14.8
MS as %FS 185 185 185 194 190 187 187 187
Pinot Bras FS 8.3 8.3 8.3 7.3 7.3 7.3 7.3 7.3
MS 3.3 3.3 3.3 3.1 3.0 3.0 3.0 3.0
MS as %FS 40 40 40 42 41 40 40 40
Spago Café FS 5.0 5.0 5.0 4.5 4.5 4.5 4.5 4.5
MS 14.9 14.9 14.9 13.8 13.5 13.3 13.3 13.3
MS as %FS 295 295 295 309 302 298 298 298
Star Canyon FS 7.5 7.5 7.5 6.7 6.7 6.7 6.7 6.7
MS 3.3 3.3 3.3 3.1 3.0 3.0 3.0 3.0
MS as %FS 44 44 44 46 45 44 44 44
Woll Grill FS 2.3 2.3 2.3 2.1 2.1 2.1 2.1 2.1
MS 1.7 1.7 1.7 1.5 1.5 1.5 1.5 1.5
MS as %FS 71 71 71 74 72 71 71 71
Z-Tejas FS 9.9 9.9 9.9 8.8 8.8 8.8 8.8 8.8
MS 5.0 5.0 5.0 4.6 4.5 4.4 4.4 4.4
MS as %FS 50 50 50 53 51 51 51 51
Lunai’s FS 11.2 11.2 11.2 11.2 11.2
MS 6.9 9.0 10.4 10.4 10.4
MS as %FS 62 81 93 93 93
PAGE 14
Lunai’s Good Competitive Index
Grill Room Dinner – Fair Share, Market Share & Market Share as a % of Fair Share
Dinner 1999 2000 2001 2002 2003 2004 2005 2006
Circo FS 9.1% 9.1% 9.1% 7.7% 7.7% 7.7% 7.7% 7.7%
MS 13.9% 13.9% 13.9% 12.7% 12.3% 12.0% 12.0% 12.0%
MS as %FS 152% 152% 152% 164% 160% 156% 156% 156%
Emeril’s FS 10.4 10.4 10.4 8.8 8.8 8.8 8.8 8.8
MS 18.5 18.5 18.5 16.9 16.5 16.0 16.0 16.0
MS as %FS 177 177 177 192 186 181 181 181
Mon Ami FS 19.8 19.8 19.8 16.8 16.8 16.8 16.8 16.8
MS 21.6 21.6 21.6 19.7 19.2 18.7 18.7 18.7
MS as %FS 109 109 109 118 114 111 111 111
Pinot Bras FS 12.0 12.0 12.0 10.2 10.2 10.2 10.2 10.2
MS 7.7 7.7 7.7 7.1 6.9 6.7 6.7 6.7
MS as %FS 64 64 64 69 68 66 66 66
Spago Café FS 7.3 7.3 7.3 6.2 6.2 6.2 6.2 6.2
MS 12.3 12.3 12.3 11.3 11.0 10.7 10.7 10.7
MS as %FS 169 169 169 183 178 173 173 173
Star Canyon FS 11.0 11.0 11.0 9.3 9.3 9.3 9.3 9.3
MS 6.2 6.2 6.2 5.6 5.5 5.3 5.3 5.3
MS as %FS 56 56 56 61 59 58 58 58
Voo Doo FS 12.5 12.5 12.5 10.6 10.6 10.6 10.6 10.6
MS 6.8 6.8 6.8 6.2 6.0 5.9 5.9 5.9
MS as %FS 54 54 54 59 57 55 55 55
Woll Grill FS 3.4 3.4 3.4 2.9 2.9 2.9 2.9 2.9
MS 3.9 3.9 3.9 3.5 3.4 3.3 3.3 3.3
MS as %FS 113 113 113 123 119 116 116 116
Z-Tejas FS 14.4 14.4 14.4 12.1 12.1 12.1 12.1 12.1
MS 9.2 9.2 9.2 8.5 8.2 8.0 8.0 8.0
MS as %FS 64 64 64 70 68 66 66 66
Lunai’s FS 15.5 15.5 15.5 15.5 15.5
MS 8.5 11.0 13.4 13.4 13.4
MS as %FS 55 71 86 86 86
PAGE 15
Lunai’s Good Competitive Index
Gourmet Room – Fair Share, Market Share & Market Share as a % of Fair Share
Gourmet 1999 2000 2001 2002 2003 2004 2005 2006
Aqua FS 10.5% 10.5% 10.5% 9.8% 9.8% 9.8% 9.8% 9.8%
MS 15.7% 15.7% 15.7% 15.4% 15.1% 14.8% 14.8% 14.8%
MS as %FS 150% 150% 150% 158% 154% 152% 152% 152%
Aureole FS 18.1 18.1 18.1 16.8 16.8 16.8 16.8 16.8
MS 23.3 23.3 23.3 22.9 22.3 22.0 22.0 22.0
MS as %FS 129 129 129 136 133 131 131 131
Eiffel FS 15.2 15.2 15.2 14.1 14.1 14.1 14.1 14.1
MS 17.4 17.4 17.4 17.2 16.7 16.5 16.5 16.5
MS as %FS 115 115 115 121 118 117 117 117
Le Cirque FS 5.1 5.1 5.1 4.7 4.7 4.7 4.7 4.7
MS 8.7 8.7 8.7 8.6 8.4 8.2 8.2 8.2
MS as %FS 173 173 173 182 178 175 175 175
Smith&Wol FS 39.7 39.7 39.7 37.0 37.0 37.0 37.0 37.0
MS 17.4 17.4 17.4 17.2 16.7 16.5 16.5 16.5
MS as %FS 44 44 44 46 45 45 45 45
Spago Dine FS 11.6 11.6 11.6 10.8 10.8 10.8 10.8 10.8
MS 17.4 17.4 17.4 17.2 16.7 16.5 16.5 16.5
MS as %FS 151 151 151 159 155 153 153 153
Lunai’s FS 6.7 6.7 6.7 6.7 6.7
MS 1.6 4.0 5.5 5.5 5.5
MS as %FS 24 59 82 82 82
PAGE 16
PROJECTED PATRONS PER WEEK (SCENARIO ONE – 3% 2% 1%)
Lunai’s Good Competitive Index
Grill Room – Projected Patrons Per Week for Lunch
Lunch 1999 2000 2001 2002 2003 2004 2005 2006
PPW 21,210 21,846 22,283 22,506 22,731 22,958 23,188 23,420
Mkt
Share
6.9% 9.0% 10.4% 10.4% 10.4%
Capture 1556 2048 2377 2401 2425
Revenue $1,213,460 $1,863,542 $2,472,446 $2,497,171 $2,522,142
PPA $15.00 $17.50 $20.00 $20.00 $20.00
Grill Room – Projected Patrons Per Week for Dinner
Dinner 1999 2000 2001 2002 2003 2004 2005 2006
PPW 22,715 23,396 23,864 24,103 24,344 24,587 24,833 25,082
Mkt Share 8.5% 11.0% 13.4% 13.4% 13.4%
Capture 2040 2672 3283 3316 3349
Revenue $3,182,007 $4,862,132 $6,828,036 $6,896,316 $6,965,279
PPA $30.00 $35.00 $40.00 $40.00 $40.00
Gourmet Room – Projected Patrons Per Week
Gourmet 1999 2000 2001 2002 2003 2004 2005 2006
PPW 12040 12401 12649 12776 12903 13033 13163 13294
Mkt Share 1.6% 4.0% 5.5% 5.5% 5.5%
Capture 209 514 716 723 730
Revenue $651,311 $1,738,985 $2,606,502 $2,632,567 $2,658,892
PPA $60.00 $65.00 $70.00 $70.00 $70.00
Estimated Gross Revenue
2002 2003 2004 2005 2006
Tot. Revenue $5,046,778 $8,464,659 $11,906,984 $12,026,053 $12,146,314
PAGE 17
PROJECTED PATRONS PER WEEK (SCENARIO TWO – 5% 3% 2%)
Lunai’s Good Competitive Index
Grill Room – Projected Patrons Per Week for Lunch
Lunch 1999 2000 2001 2002 2003 2004 2005 2006
PPW 21,210 22,271 22,939 23,397 23,865 24,343 24,829 25,326
Mkt
Share
6.9% 9.0% 10.4% 10.4% 10.4%
Capture 1617 2150 2521 2571 2623
Revenue $1,261,518 $1,956,527 $2,621,515 $2,673,946 $2,727,424
PPA $15.00 $17.50 $20.00 $20.00 $20.00
Grill Room – Projected Patrons Per Week for Dinner
Dinner 1999 2000 2001 2002 2003 2004 2005 2006
PPW 22,715 23,851 24,566 25,058 25,559 26,070 26,591 27,123
Mkt Share 8.5% 11.0% 13.4% 13.4% 13.4%
Capture 2121 2805 3481 3550 3621
Revenue $3,308,027 $5,104,738 $7,239,712 $7,384,506 $7,532,196
PPA $30.00 $35.00 $40.00 $40.00 $40.00
Gourmet Room – Projected Patrons Per Week
Gourmet 1999 2000 2001 2002 2003 2004 2005 2006
PPW 12040 12642 13021 13282 13547 13818 14095 14377
Mkt Share 1.6% 4.0% 5.5% 5.5% 5.5%
Capture 217 540 759 774 790
Revenue $677,106 $1,825,755 $2,763,653 $2,818,926 $2,875,305
PPA $60.00 $65.00 $70.00 $70.00 $70.00
Estimated Gross Revenue
2002 2003 2004 2005 2006
Tot. Revenue $5,246,651 $8,887,021 $12,624,880 $12,877,378 $13,134,926
PAGE 18
PROJECTED PATRONS PER WEEK (SCENARIO THREE – 7% 5% 3%)
Lunai’s Good Competitive Index
Grill Room – Projected Patrons Per Week for Lunch
Lunch 1999 2000 2001 2002 2003 2004 2005 2006
PPW 21,210 22,695 23,829 24,544 25,281 26,039 26,820 27,625
MktShare 6.9% 9.0% 10.4% 10.4% 10.4%
Capture 1697 2278 2696 2777 2861
Revenue $1,323,357 $2,072,558 $2,804,207 $2,888,333 $2,974,983
PPA $15.00 $17.50 $20.00 $20.00 $20.00
Grill Room – Projected Patrons Per Week for Dinner
Dinner 1999 2000 2001 2002 2003 2004 2005 2006
PPW 22,715 24,305 25,520 26,286 27,074 27,887 28,723 29,585
Mkt Share 8.5% 11.0% 13.4% 13.4% 13.4%
Capture 2224 2971 3723 3835 3950
Revenue $3,470,185 $5,407,470 $7,744,244 $7,976,571 $8,215,868
PPA $30.00 $35.00 $40.00 $40.00 $40.00
Gourmet Room – Projected Patrons Per Week
Gourmet 1999 2000 2001 2002 2003 2004 2005 2006
PPW 12040 12883 13527 13933 14351 14781 15225 15681
Mkt Share 1.6% 4.0% 5.5% 5.5% 5.5%
Capture 228 572 812 837 862
Revenue $710,297 $1,934,030 $2,956,251 $3,044,938 $3,136,286
PPA $60.00 $65.00 $70.00 $70.00 $70.00
Estimated Gross Revenue
2002 2003 2004 2005 2006
Tot. Revenue $5,503,839 $9,414,057 $13,504,701 $13,909,842 $14,327,138
PAGE 19
OK Competitive Index
Scenario 1 = 3% 2% 1% / Scenario 2 = 5% 3% 2% / Scenario 3 = 7% 5% 3%
Grill Room – Overall Competitive Index for Lunch
Lunch 1999 2000 2001 2002 2003 2004 2005 2006
PPW 1 21,210 21,846 22,283 22,506 22,731 22,958 23,188 23,420
Avg. Index 1 7.6 7.8 8.0 7.2 7.3 7.3 7.4 7.5
PPW 2 21,210 22,271 22,939 23,397 23,865 24,343 24,829 25,326
Avg. Index 2 7.6 8.0 8.2 7.5 7.6 7.8 7.9 8.1
PPW 3 21,210 22,695 23,829 24,544 25,281 26,039 26,820 27,625
Avg. Index 3 7.6 8.2 8.6 7.8 8.1 8.3 8.6 8.8
Lunai Index1 4 5.5 6.5 6.5 6.5
Tot Seats 2783 2783 2783 3133 3133 3133 3133 3133
Grill Room – Overall Competitive Index for Dinner
Dinner 1999 2000 2001 2002 2003 2004 2005 2006
PPW 1 22,715 23,396 23,864 24,103 24,344 24,587 24,833 25,082
Avg. Index 1 11.9 12.2 12.5 10.6 10.7 10.9 11.0 11.1
PPW 2 22,715 23,851 24,566 25,058 25,559 26,070 26,591 27,123
Avg. Index 2 11.9 12.5 12.8 11.1 11.3 11.5 11.7 12.0
PPW 3 22,715 24,305 25,520 26,286 27,074 27,887 28,723 29,585
Avg. Index 3 11.9 12.7 13.3 11.6 12.0 12.3 12.7 13.1
Lunai Index1 5.5 6.5 7.5 7.5 7.5
Tot Seats 1915 1915 1915 2265 2265 2265 2265 2265
Gourmet Room – Overall Competitive Index
Gourmet Rm 1999 2000 2001 2002 2003 2004 2005 2006
PPW 1 12,040 12,401 12,649 12,776 12,903 13,033 13,163 13,294
Avg. Index 1 8.7 9.0 9.1 8.6 8.7 8.8 8.9 9.0
PPW 2 12,040 12,642 13,021 13,022 13,283 13,548 13,819 14,096
Avg. Index 2 8.7 9.1 9.4 8.8 8.9 9.1 9.3 9.5
PPW 3 12,040 12,883 13,527 13,933 14,351 14,781 15,225 15,681
Avg. Index 3 8.7 9.3 9.8 9.4 9.7 10.0 10.3 10.6
Lunai Index1 1.5 4 6 6 6
Tot Seats 1385 1385 1385 1485 1485 1485 1485 1485
PAGE 20
Lunai’s OK Competitive Index
Grill Room Lunch – Fair Share, Market Share & Market Share as a % of Fair Share
Lunch 1999 2000 2001 2002 2003 2004 2005 2006
Circo FS 6.3% 6.3% 6.3% 5.6% 5.6% 5.6% 5.6% 5.6%
MS 7.9% 7.9% 7.9% 7.4% 7.3% 7.2% 7.2% 7.2%
MS as %FS 126% 126% 126% 133% 130% 128% 128% 128%
Cozymels FS 11.5 11.5 11.5 10.2 10.2 10.2 10.2 10.2
MS 6.6 6.6 6.6 6.2 6.1 6.0 6.0 6.0
MS as %FS 57 57 57 61 59 58 58 58
Emeril’s FS 7.2 7.2 7.2 6.4 6.4 6.4 6.4 6.4
MS 6.6 6.6 6.6 6.2 6.1 6.0 6.0 6.0
MS as %FS 92 92 92 97 95 93 93 93
Gordon FS 11.1 11.1 11.1 9.9 9.9 9.9 9.9 9.9
MS 16.5 16.5 16.5 9.9 9.9 9.9 9.9 9.9
MS as %FS 148 148 148 156 153 151 151 151
McCormick FS 8.3 8.3 8.3 7.3 7.3 7.3 7.3 7.3
MS 7.9 7.9 7.9 7.4 7.3 7.2 7.2 7.2
MS as %FS 96 96 96 101 99 97 97 97
Mon Ami FS 13.7 13.7 13.7 12.1 12.1 12.1 12.1 12.1
MS 9.9 9.9 9.9 9.3 9.1 8.9 8.9 8.9
MS as %FS 73 73 73 77 75 74 74 74
PF Changs FS 8.9 8.9 8.9 7.9 7.9 7.9 7.9 7.9
MS 16.5 16.5 16.5 15.5 15.1 14.9 14.9 14.9
MS as %FS 185 185 185 196 191 188 188 188
Pinot Bras FS 8.3 8.3 8.3 7.3 7.3 7.3 7.3 7.3
MS 3.3 3.3 3.3 3.1 3.0 3.0 3.0 3.0
MS as %FS 40 40 40 42 41 41 41 41
Spago Café FS 5.0 5.0 5.0 4.5 4.5 4.5 4.5 4.5
MS 14.9 14.9 14.9 13.9 13.6 13.4 13.4 13.4
MS as %FS 295 295 295 312 305 300 300 300
Star Canyon FS 7.5 7.5 7.5 6.7 6.7 6.7 6.7 6.7
MS 3.3 3.3 3.3 3.1 3.0 3.0 3.0 3.0
MS as %FS 44 44 44 46 45 44 44 44
Woll Grill FS 2.3 2.3 2.3 2.1 2.1 2.1 2.1 2.1
MS 1.7 1.7 1.7 1.5 1.5 1.5 1.5 1.5
MS as %FS 71 71 71 75 73 72 72 72
Z-Tejas FS 9.9 9.9 9.9 8.8 8.8 8.8 8.8 8.8
MS 5.0 5.0 5.0 4.6 4.5 4.5 4.5 4.5
MS as %FS 50 50 50 53 52 51 51 51
Lunai’s FS 11.2 11.2 11.2 11.2 11.2
MS 6.2 8.3 9.7 9.7 9.7
MS as %FS 55 74 87 87 87
PAGE 21
Lunai’s OK Competitive Index
Grill Room Dinner – Fair Share, Market Share & Market Share as a % of Fair Share
Dinner 1999 2000 2001 2002 2003 2004 2005 2006
Circo FS 9.1% 9.1% 9.1% 7.7% 7.7% 7.7% 7.7% 7.7%
MS 13.9% 13.9% 13.9% 12.8% 12.6% 12.4% 12.4% 12.4%
MS as %FS 152% 152% 152% 165% 163% 161% 161% 161%
Emeril’s FS 10.4 10.4 10.4 8.8 8.8 8.8 8.8 8.8
MS 18.5 18.5 18.5 17.0 16.8 16.6 16.6 16.6
MS as %FS 177 177 177 193 190 188 188 188
Mon Ami FS 19.8 19.8 19.8 16.8 16.8 16.8 16.8 16.8
MS 21.6 21.6 21.6 19.9 19.6 19.3 19.3 19.3
MS as %FS 109 109 109 119 117 115 115 115
Pinot Bras FS 12.0 12.0 12.0 10.2 10.2 10.2 10.2 10.2
MS 7.7 7.7 7.7 7.1 7.0 6.9 6.9 6.9
MS as %FS 64 64 64 70 69 68 68 68
Spago Café FS 7.3 7.3 7.3 6.2 6.2 6.2 6.2 6.2
MS 12.3 12.3 12.3 11.4 11.2 11.0 11.0 11.0
MS as %FS 169 169 169 184 181 179 179 179
Star Canyon FS 11.0 11.0 11.0 9.3 9.3 9.3 9.3 9.3
MS 6.2 6.2 6.2 5.7 5.6 5.5 5.5 5.5
MS as %FS 56 56 56 61 60 60 60 60
Voo Doo FS 12.5 12.5 12.5 10.6 10.6 10.6 10.6 10.6
MS 6.8 6.8 6.8 6.3 6.2 6.1 6.1 6.1
MS as %FS 54 54 54 59 58 57 57 57
Woll Grill FS 3.4 3.4 3.4 2.9 2.9 2.9 2.9 2.9
MS 3.9 3.9 3.9 3.6 3.5 3.5 3.5 3.5
MS as %FS 113 113 113 124 122 120 120 120
Z-Tejas FS 14.4 14.4 14.4 12.1 12.1 12.1 12.1 12.1
MS 9.2 9.2 9.2 8.5 8.4 8.3 8.3 8.3
MS as %FS 64 64 64 70 69 68 68 68
Lunai’s FS 15.5 15.5 15.5 15.5 15.5
MS 7.8 9.1 10.4 10.4 10.4
MS as %FS 51 59 67 67 67
PAGE 22
Lunai’s OK Competitive Index
Gourmet Room – Fair Share, Market Share & Market Share as a % of Fair Share
Gourmet 1999 2000 2001 2002 2003 2004 2005 2006
Aqua FS 10.5% 10.5% 10.5% 9.8% 9.8% 9.8% 9.8% 9.8%
MS 15.7% 15.7% 15.7% 15.5% 15.2% 15.0% 15.0% 15.0%
MS as %FS 150% 150% 150% 159% 156% 153% 153% 153%
Aureole FS 18.1 18.1 18.1 16.8 16.8 16.8 16.8 16.8
MS 23.3 23.3 23.3 23.0 22.5 22.2 22.2 22.2
MS as %FS 129 129 129 136 134 132 132 132
Eiffel FS 15.2 15.2 15.2 14.1 14.1 14.1 14.1 14.1
MS 17.4 17.4 17.4 17.2 16.9 16.6 16.6 16.6
MS as %FS 115 115 115 122 119 117 117 117
Le Cirque FS 5.1 5.1 5.1 4.7 4.7 4.7 4.7 4.7
MS 8.7 8.7 8.7 8.6 8.4 8.3 8.3 8.3
MS as %FS 173 173 173 183 179 176 176 176
Smith&Wol FS 39.7 39.7 39.7 37.0 37.0 37.0 37.0 37.0
MS 17.4 17.4 17.4 17.2 16.9 16.6 16.6 16.6
MS as %FS 44 44 44 47 46 45 45 45
Spago Dine FS 11.6 11.6 11.6 10.8 10.8 10.8 10.8 10.8
MS 17.4 17.4 17.4 17.2 16.9 16.6 16.6 16.6
MS as %FS 151 151 151 160 157 154 154 154
Lunai’s FS 6.7 6.7 6.7 6.7 6.7
MS 1.2 3.2 4.7 4.7 4.7
MS as %FS 18 48 70 70 70
PAGE 23
PROJECTED PATRONS PER WEEK (SCENARIO ONE – 3% 2% 1%)
Lunai’s OK Competitive Index
Grill Room – Projected Patrons Per Week for Lunch
Lunch 1999 2000 2001 2002 2003 2004 2005 2006
PPW 21,210 21,846 22,283 22,506 22,731 22,958 23,188 23,420
MktShare 6.2% 8.3% 9.7% 9.7% 9.7%
Capture 1394 1891 2224 2246 2269
Revenue $1,086,980 $1,721,169 $2,312,951 $2,336,080 $2,359,441
PPA $15.00 $17.50 $20.00 $20.00 $20.00
Grill Room – Projected Patrons Per Week for Dinner
Dinner 1999 2000 2001 2002 2003 2004 2005 2006
PPW 22,715 23,396 23,864 24,103 24,344 24,587 24,833 25,082
Mkt Share 7.8% 9.1% 10.4% 10.4% 10.4%
Capture 1883 2216 2547 2573 2598
Revenue $2,937,556 $4,033,475 $5,297,858 $5,350,836 $5,404,345
PPA $30.00 $35.00 $40.00 $40.00 $40.00
Gourmet Room – Projected Patrons Per Week
Gourmet 1999 2000 2001 2002 2003 2004 2005 2006
PPW 12040 12401 12649 12776 12903 13033 13163 13294
Mkt Share 1.2% 3.2% 4.7% 4.7% 4.7%
Capture 157 415 619 625 631
Revenue $490,487 $1,402,371 $2,251,819 $2,274,338 $2,297,081
PPA $60.00 $65.00 $70.00 $70.00 $70.00
Estimated Gross Revenue
2002 2003 2004 2005 2006
Tot. Revenue $4,515,023 $7,157,015 $9,862,628 $9,961,254 $10,060,867
PAGE 24
PROJECTED PATRONS PER WEEK (SCENARIO TWO – 5% 3% 2%)
Lunai’s OK Competitive Index
Grill Room – Projected Patrons Per Week for Lunch
Lunch 1999 2000 2001 2002 2003 2004 2005 2006
PPW 21,210 22,271 22,939 23,397 23,865 24,343 24,829 25,326
Mkt
Share
6.2% 8.3% 9.7% 9.7% 9.7%
Capture 1449 1986 2358 2405 2453
Revenue $1,130,029 $1,807,050 $2,452,403 $2,501,451 $2,551,480
PPA $15.00 $17.50 $20.00 $20.00 $20.00
Grill Room – Projected Patrons Per Week for Dinner
Dinner 1999 2000 2001 2002 2003 2004 2005 2006
PPW 22,715 23,851 24,566 25,058 25,559 26,070 26,591 27,123
Mkt Share 7.8% 9.1% 10.4% 10.4% 10.4%
Capture 1958 2327 2701 2755 2810
Revenue $3,053,895 $4,234,734 $5,617,277 $5,729,622 $5,844,215
PPA $30.00 $35.00 $40.00 $40.00 $40.00
Gourmet Room – Projected Patrons Per Week
Gourmet 1999 2000 2001 2002 2003 2004 2005 2006
PPW 12040 12642 13021 13282 13547 13818 14095 14377
Mkt Share 1.2% 3.2% 4.7% 4.7% 4.7%
Capture 163 436 656 669 682
Revenue $509,912 $1,472,345 $2,387,586 $2,435,338 $2,484,045
PPA $60.00 $65.00 $70.00 $70.00 $70.00
Estimated Gross Revenue
2002 2003 2004 2005 2006
Tot. Revenue $4,693,835 $7,514,129 $10,457,266 $10,666,412 $10,879,740
PAGE 25
PROJECTED PATRONS PER WEEK (SCENARIO THREE 7% 5% 3%)
Lunai’s OK Competitive Index
Grill Room – Projected Patrons Per Week for Lunch
Lunch 1999 2000 2001 2002 2003 2004 2005 2006
PPW 21,210 22,695 23,829 24,544 25,281 26,039 26,820 27,625
MktShare 6.2% 8.3% 9.7% 9.7% 9.7%
Capture 1520 2104 2522 2598 2676
Revenue $1,185,422 $1,914,215 $2,623,310 $2,702,009 $2,783,069
PPA $15.00 $17.50 $20.00 $20.00 $20.00
Grill Room – Projected Patrons Per Week for Dinner
Dinner 1999 2000 2001 2002 2003 2004 2005 2006
PPW 22,715 24,305 25,520 26,286 27,074 27,887 28,723 29,585
Mkt Share 7.8% 9.1% 10.4% 10.4% 10.4%
Capture 2054 2465 2889 2975 3065
Revenue $3,203,595 $4,485,871 $6,008,742 $6,189,004 $6,374,674
PPA $30.00 $35.00 $40.00 $40.00 $40.00
Gourmet Room – Projected Patrons Per Week
Gourmet 1999 2000 2001 2002 2003 2004 2005 2006
PPW 12040 12883 13527 13933 14351 14781 15225 15681
Mkt Share 1.2% 3.2% 4.7% 4.7% 4.7%
Capture 171 461 702 723 744
Revenue $534,908 $1,559,661 $2,553,976 $2,630,595 $2,709,513
PPA $60.00 $65.00 $70.00 $70.00 $70.00
Estimated Gross Revenue
2002 2003 2004 2005 2006
Tot. Revenue $4,923,925 $7,959,748 $11,186,027 $11,521,608 $11,867,256
PAGE 26
STATEMENT OF INCOME & EXPENSES
The following nine statements of income and expenses are based upon the three
different competitive index scenarios and the three different market growth rate scenarios.
These scenarios are then applied to the projected check average for each meal period giving
the Lunai’s Grill Room and the Lunai’s Gourmet Room a total projected revenue for five
years of operation. The projected revenue is then applied to the statement of income and
expenses with national averages being used to calculate most of the expenses.
A Description of Expense Items
Food Sales. Food sales include sales of all food items. This account is projected by
multiplying the estimated number of patrons per week (PPW) by the anticipated average
check times 52 weeks.
Beverage Sales. Beverage sales vary among restaurants, depending on the type of operation.
They will generally be a relatively constant percentage of food sales.
Food Cost. Food cost is reported as a percentage of food sales. This number is used to judge
restaurant efficiency.
Beverage Cost. Beverage cost includes all liquors, wines, beers, and waters served in both the
bar and restaurant areas. Like the food cost percentage, beverage cost can be affected by
pricing, portion sizes, and the type of restaurant operation.
Other Income. These are the items associated with merchandise sales, cover charges, rental of
shops, display areas, and cash discounts.
PAGE 27
Payroll. Under the Uniform System of Accounts for Restaurants, the entire restaurant payroll
is in one category. Regular salaries and wages, extra wages, overtime pay, vacation pay,
commisions, and bonus payments are included.
Employee Benefits. Social Security Tax (FICA), state and federal unemployment taxes,
workmen’s compensation insurance premiums, health and life insurance premiums, pension
plan payments, complimentary employee meals or discounts, employee training, and staff
parties.
Direct Operating Expenses. These are the costs of services rendered to the customer.
Uniforms, Laundry, linen, linen rental, china, glassware, silverware, kitchen utensils,
cleaning supplies, paper supplies, guest supplies, menus, dry cleaning, contract cleaning,
flowers, decorations, auto & truck expenses, and licenses and permits.
Music & Entertainment. The expenses for musicians, entertainers, taped music, meals served
to musicians and entertainers.
Advertising & Promotion. Costs incurred for promoting, creating and maintaining sales in the
restaurant. Newspaper, magazines, flyers, brochures, postcards, direct mail, postage and
telephone, and agency fees.
Utilities. Utility costs are generally fixed, but can be conserved through technology.
Administrative & General. These costs are associated with the daily operation of the business,
but not directly related to providing food service or comfort. Most of these expenses are
fixed. Credit card fees, city and sales tax are moderately variable however.
PAGE 28
Repairs & Maintenance. The expenses in this category tend to be fixed but an increased
number of patrons will affect the wear of items slightly and repairs will be needed in certain
areas.
Lease. This is the amount negotiated for a long-term rental of the property. This can be a
fixed expense or a fixed and variable expense depending upon the contract negotiated.
Property Taxes & Insurance. Real and personal property taxes are based on the assessed value
established by the municipality and the tax rate. The cost of insuring the building and its
contents against damage.
Loan Payment. This is a payment on the amount borrowed for remodeling and the amount
required to buy the building. Again, this amount is dependent upon the source and the
negotiated contract.
These are the items included in the statement of income and expenses. Now let’s take a look at
the national operating averages for the restaurants with check averages of $15 or more and discuss the
differences in Lunai’s percentages verses the national averages.
PAGE 29
NATIONAL OPERATING AVERAGES
From the 1999 Restaurant Industry Operations Report
by
The National Restaurant Association and Deloitte & Touche LLP
The national averages are for restaurants with check averages of $15 or more. As
shown through the highlighted years of 2002 to 2004, there are some major differences in
Lunai’s operating percentages and the national average.
2002 2003 2004 Lower
Quartile Median
Upper
Quartile
SALES
Food………………………….………. 70% 65% 65% 70% 77.2% 83.5%
Beverage…………………………….. 30 35 35 17 23.5 30.2
Total Sales……………………… 100 100 100 100 100 100
COST OF SALES
Food………………………….………. 40 35 35 31.2 35.3 40.0
Beverage…………………………….. 35 30 30 25.4 30.5 36.3
Total cost of sales……………… 39 34 34 31.2 34.2 38.4
GROSS PROFIT……………………..………... 61 66 66 61.6 65.8 68.8
OTHER INCOME………………………………. 5 5 5 (0.7) 0.0 0.3
Total Income………………………… 65 71 71 60.9 65.8 69.2
CONTROLLABLE EXPENSES
Payroll…………………………………….. 25 20 17 22.4 27.9 33.6
Employee Benefits……………….………. 5 7 9 1.4 4.4 6.2
Direct Operating Expenses……………… 5 5 5 4.1 5.5 8.3
Music & Entertainment………….……… 5 3 3 0.0 0.2 1.3
Advertising & Promotion……….……… 5 4 3 1.3 3.0 4.4
Utilities……………………………………. 4 3 3 1.8 2.5 3.4
Administrative & General………………. 3 2 2 1.9 4.1 6.8
Repairs & Maintenance…………………. 3 3 3 1.0 1.6 2.3
Total controllable expenses……….. 55 47 45 52.5 59.8 67.4
INCOME BEFORE OCCUPANCY COSTS .…..…
OCCUPATION COSTS 100K 100K 100K 2.3 4.9 7.0
INCOME BEFORE INTEREST & DEPRECIATION 10% 24% 26% (1.6%) 3.8% 10.2%
PAGE 30
ITEMS OF NOTE
Beverage Sales
During the first year of operations, Lunai’s will be in the upper quartile of beverage
sales due to their large amount (over 100 seats) of bar space in the upstairs Parlour and the
downstairs Dirty Olive. These two bars will be aggressive in their advertising and
promotions. This, combined with the location, more than substantiates the upper quartile
status for beverage sales. In fact, 30-35% is a conservative estimate; most restaurants don’t
operate on Las Vegas Boulevard and have two large bars within.
Food & Beverage Costs
During the first year of operation Lunai’s will be operating in the upper quartile of
food and beverage costs. This is due to the ‘settling in’ process and will most likely only take
3-6 months, not an entire year. After the first year Lunai’s will then operate the median cost
level for food & beverage costs.
Other Income
Due to the Love Rules clothing line, the merchandise retail store, and the branding of
the building, Lunai’s will receive a generous portion of ‘other income’.
Payroll
Lunai’s begins its payroll percentage less than the median and then drops below the
lower quartile because once a restaurant is staffed to its maximum, the payroll margin does
not increase. Therefore the payroll percentage decreases as sales increase. Payroll, as shown
on the statements of income, starts at more than $2,000,000 and rises to over $3,000,000 by the
third year of operations due to the raises required for long-term employment and a few extra
employees to handle the extra amount of sales.
PAGE 31
The other reason for this low payroll percentage is that the majority of the employees
are not established and require less money than more established restaurant employees.
This, in addition to the low management salaries, creates a positive for the overall restaurant.
The tradeoff is the bonus program which comes from the bottom line.
Benefits
While Lunai’s Payroll is low, the benefits steadily increase over the years due to the
predicted loyalty of the employees. Since it will take one full year for most employees to be
able to receive any benefits, Lunai’s doesn’t surpass the upper quartile until the second year
while attaining a huge 9% during the third year. This is part of the Lunai’s philosophy and
will be part of what makes Lunai’s the greatest restaurant in Las Vegas.
Music & Entertainment
Most restaurants are not of equal size to the proposed Lunai’s entertainment and
restaurant complex. Nor are they located on Las Vegas Boulevard. The street entertainment
on Friday nights, all day & night Saturday, and all day Sunday will require some financial
outlay as well as the Wednesday through Sunday entertainment in the Parlour and on the
stage in the Grill Room. All of this plus a few sporadic headliners will give Lunai’s some
great publicity and keep the customers coming in.
Advertising & Promotion
The Advertising & Promotion strategies that were discussed in the Marketing & Sales
Strategies section of this business plan will require a constant amount of capital to maintain.
Lunai’s starts off strong with its percentage, but remains constant in the amount of dollars
spent. This is shown in the consistent drop in percentage over the three years.
PAGE 32
Utilities
Theoretically it costs the same to run a restaurant no matter how much business is
being done. Utilities cost will then remain a constant dollar amount and consistently drop in
percentage.
Administrative & General
Lunai’s is a self-contained organization paying out no management fees. As things
become more streamlined, Lunai’s will pay a smaller percentage and be in the lower quartile.
Repairs & Maintenance
Lunai’s will be perfectionist in their approach to repairing and maintaining the
restaurant. Carpets will be replaced after 6-9 months of wear, and all things will be kept up
so the appearance never degenerates from its original beauty. A portion of this money will
be held in reserve for remodeling purposes.
Occupation Costs
The amount projected is from the current operators of the Harley Davidson Café.
PAGE 33
VERY GOOD & ‘SCENARIO 3’ – STATEMENT OF INCOME & EXPENSES
02 2002 03 2003 04 2004
SALES
Food………………………….………. 70% $6,508,242 65% $10,894,760 65% $15,131,028
Beverage…………………………….. 30 1,952,473 35 3,813,166 35 5,295,860
Total Sales……………………… 100 8,460,715 100 14,707,926 100 20,426,888
COST OF SALES
Food………………………….………. 40 2,603,296 35 3,813,165 35 5,295,859
Beverage…………………………….. 35 683,365 30 1,143,949 30 1,588,757
Total cost of sales……………… 39 3,286,662 34 4,957,116 34 6,884,618
GROSS PROFIT……………...………………... 61 5,174,053 66 9,750,810 66 13,542,270
OTHER INCOME………………………………. 5 423,036 5 735,396 5 1,021,344
Total Income………………………… 65 5,597,088 71 10,486,206 71 14,563,614
CONTROLLABLE EXPENSES
Payroll…………………………………….. 25 2,115,179 20 2,941,585 17 3,472,571
Employee Benefits……………….………. 5 423,036 7 1,029,555 9 1,838,420
Direct Operating Expenses……………… 5 423,036 5 735,396 5 1,021,344
Music & Entertainment………….……… 5 423,036 3 441,238 3 612,807
Advertising & Promotion……….……… 5 423,036 4 588,317 3 612,807
Utilities……………………………………. 4 338,429 3 441,238 3 612,807
Administrative & General………………. 3 253,821 2 294,159 2 408,538
Repairs & Maintenance…………………. 3 253,821 3 441,238 3 612,807
Total controllable expenses……….. 55 4,653,393 47 6,912,725 45 9,192,099
INCOME BEFORE OCCUPANCY COSTS .…...… $943,695 $3,573,481 $5,371,515
OCCUPATION COSTS
Property Taxes & Insurance…….……… 100,000 100,000 100,000
INCOME BEFORE INTEREST & DEPRECIATION 10% $843,695 24% $3,473,481 26% $5,271,515
PAGE 34
VERY GOOD & ‘SCENARIO 2’ – STATEMENT OF INCOME & EXPENSES
02 2002 03 2003 04 2004
SALES
Food………………………….………. 70% $6,204,119 65% $10,284,827 65% $14,145,253
Beverage…………………………….. 30 1,861,236 35 3,599,690 35 4,950,839
Total Sales……………………… 100 8,065,355 100 13,884,517 100 19,096,092
COST OF SALES
Food………………………….………. 40 2,481,648 35 3,599,690 35 4,950,839
Beverage…………………………….. 35 651,432 30 1,079,907 30 1,485,252
Total cost of sales……………… 39 3,133,080 34 4,679,596 34 6,436,090
GROSS PROFIT……………………...………... 61 4,932,275 66 9,204,920 66 12,660,001
OTHER INCOME………………………………. 5 403,268 5 694,226 5 954,805
Total Income………………………… 65 5,335,542 71 9,899,146 71 13,614,806
CONTROLLABLE EXPENSES
Payroll…………………………………….. 25 2,016,339 20 2,776,903 17 3,246,336
Employee Benefits……………….………. 5 403,268 7 971,916 9 1,718,648
Direct Operating Expenses……………… 5 403,268 5 694,226 5 954,805
Music & Entertainment………….……… 5 403,268 3 416,536 3 572,883
Advertising & Promotion……….……… 5 403,268 4 555,381 3 572,883
Utilities……………………………………. 4 322,614 3 416,536 3 572,883
Administrative & General………………. 3 241,961 2 277,690 2 381,922
Repairs & Maintenance…………………. 3 241,961 3 416,536 3 572,883
Total controllable expenses……….. 55 4,435,945 47 6,525,723 45 8,593,241
INCOME BEFORE OCCUPANCY COSTS ……… $899,597 $3,373,423 $5,021,565
OCCUPATION COSTS
Property Taxes & Insurance…….……… 100,000 100,000 100,000
INCOME BEFORE INTEREST & DEPRECIATION 10% $799,597 24% $3,273,423 26% $4,921,565
PAGE 35
VERY GOOD & ‘SCENARIO 1’ – STATEMENT OF INCOME & EXPENSES
02 2002 03 2003 04 2004
SALES
Food………………………….………. 70% $5,967,772 65% $9,796,034 65% $13,340,902
Beverage…………………………….. 30 1,790,331 35 3,428,612 35 4,669,316
Total Sales……………………… 100 7,758,103 100 13,224,646 100 18,010,218
COST OF SALES
Food………………………….………. 40 2,387,109 35 3,428,612 35 4,669,316
Beverage…………………………….. 35 626,616 30 1,028,584 30 1,400,795
Total cost of sales……………… 39 3,013,725 34 4,457,195 34 6,070,110
GROSS PROFIT…………………………...…... 61 4,744,378 66 8,767,450 66 11,940,107
OTHER INCOME………………………………. 5 387,905 5 661,232 5 900,511
Total Income………………………… 65 5,132,284 71 9,428,683 71 12,840,618
CONTROLLABLE EXPENSES
Payroll…………………………………….. 25 1,939,526 20 2,644,929 17 3,061,737
Employee Benefits……………….………. 5 387,905 7 925,725 9 1,620,920
Direct Operating Expenses……………… 5 387,905 5 661,232 5 900,511
Music & Entertainment………….……… 5 387,905 3 396,739 3 540,307
Advertising & Promotion……….……… 5 387,905 4 528,986 3 540,307
Utilities……………………………………. 4 310,324 3 396,739 3 540,307
Administrative & General………………. 3 232,743 2 264,493 2 360,204
Repairs & Maintenance…………………. 3 232,743 3 396,739 3 540,307
Total controllable expenses……….. 55 4,266,957 47 6,215,584 45 8,104,598
INCOME BEFORE OCCUPANCY COSTS ……… $865,327 $3,213,099 $4,736,020
OCCUPATION COSTS
Property Taxes & Insurance…….……… 100,000 100,000 100,000
INCOME BEFORE INTEREST & DEPRECIATION 10% $765,327 24% $3,113,099 26% $4,636,020
PAGE 36
GOOD & ‘SCENARIO 3’ – STATEMENT OF INCOME & EXPENSES
02 2002 03 2003 04 2004
SALES
Food………………………….………. 70% $5,503,839 65% 9,414,057 65% $13,504,701
Beverage…………………………….. 30 1,651,152 35 3,294,920 35 4,726,645
Total Sales……………………… 100 7,154,991 100 12,708,978 100 18,231,347
COST OF SALES
Food………………………….………. 40 2,201,536 35 3,294,920 35 4,726,645
Beverage…………………………….. 35 577,903 30 988,476 30 1,417,994
Total cost of sales……………… 39 2,779,439 34 4,283,396 34 6,144,639
GROSS PROFIT…………………...…………... 61 4,375,552 66 8,425,581 66 12,086,708
OTHER INCOME………………………………. 5 357,750 5 635,449 5 911,567
Total Income………………………… 65 4,733,302 71 9,061,030 71 12,998,275
CONTROLLABLE EXPENSES
Payroll…………………………………….. 25 1,788,748 20 2,541,796 17 3,099,329
Employee Benefits……………….………. 5 357,750 7 889,628 9 1,640,821
Direct Operating Expenses……………… 5 357,750 5 635,449 5 911,567
Music & Entertainment………….……… 5 357,750 3 381,269 3 546,940
Advertising & Promotion……….……… 5 357,750 4 508,359 3 546,940
Utilities……………………………………. 4 286,200 3 381,269 3 546,940
Administrative & General………………. 3 214,650 2 254,180 2 364,627
Repairs & Maintenance…………………. 3 214,650 3 381,269 3 546,940
Total controllable expenses……….. 55 3,935,245 47 5,973,219 45 8,204,106
INCOME BEFORE OCCUPANCY COSTS .…..… 798,057 3,087,811 4,794,169
OCCUPATION COSTS
Property Taxes & Insurance…….……… 100,000 100,000 100,000
INCOME BEFORE INTEREST & DEPRECIATION 10% $698,057 24% $2,987,811 26% $4,694,169
PAGE 37
GOOD & ‘SCENARIO 2’ – STATEMENT OF INCOME & EXPENSES
02 2002 03 2003 04 2004
SALES
Food………………………….………. 70% $5,246,651 65% $8,887,021 65% $12,624,880
Beverage…………………………….. 30 1,573,995 35 3,110,457 35 4,418,708
Total Sales……………………… 100 6,820,646 100 11,997,478 100 17,043,589
COST OF SALES
Food………………………….………. 40 2,098,660 35 3,110,457 35 4,418,708
Beverage…………………………….. 35 550,898 30 933,137 30 1,325,612
Total cost of sales……………… 39 2,649,559 34 4,043,594 34 5,744,321
GROSS PROFIT…………………..…………... 61 4,171,087 66 7,953,883 66 11,299,268
OTHER INCOME………………………………. 5 341,032 5 599,874 5 852,179
Total Income………………………… 65 4,512,120 71 8,553,757 71 12,151,447
CONTROLLABLE EXPENSES
Payroll…………………………………….. 25 1,705,161 20 2,399,496 17 2,897,410
Employee Benefits……………….………. 5 341,032 7 839,823 9 1,533,923
Direct Operating Expenses……………… 5 341,032 5 599,874 5 852,179
Music & Entertainment………….……… 5 341,032 3 359,924 3 511,308
Advertising & Promotion……….……… 5 341,032 4 479,899 3 511,308
Utilities……………………………………. 4 272,826 3 359,924 3 511,308
Administrative & General………………. 3 204,619 2 239,950 2 340,872
Repairs & Maintenance…………………. 3 204,619 3 359,924 3 511,308
Total controllable expenses……….. 55 3,751,355 47 5,638,815 45 7,669,615
INCOME BEFORE OCCUPANCY COSTS .…..… $760,764 $2,914,943 $4,481,833
OCCUPATION COSTS
Property Taxes & Insurance…….……… 100,000 100,000 100,000
INCOME BEFORE INTEREST & DEPRECIATION 10% $660,764 23% $2,814,943 26% $4,381,833
PAGE 38
GOOD & ‘SCENARIO 1’ – STATEMENT OF INCOME & EXPENSES
02 2002 03 2003 04 2004
SALES
Food………………………….………. 70% $5,046,778 65% $8,464,659 65% $11,906,984
Beverage…………………………….. 30 1,514,033 35 2,962,631 35 4,167,444
Total Sales……………………… 100 6,560,812 100 11,427,289 100 16,074,428
COST OF SALES
Food………………………….………. 40 2,018,711 35 2,962,631 35 4,167,444
Beverage…………………………….. 35 529,912 30 888,789 30 1,250,233
Total cost of sales……………… 39 2,548,623 34 3,851,420 34 5,417,678
GROSS PROFIT………………..……………... 61 4,012,189 66 7,575,870 66 10,656,750
OTHER INCOME………………………………. 5 328,041 5 571,364 5 803,721
Total Income………………………… 65 4,340,229 71 8,147,234 71 11,460,472
CONTROLLABLE EXPENSES
Payroll…………………………………….. 25 1,640,203 20 2,285,458 17 2,732,653
Employee Benefits……………….………. 5 328,041 7 799,910 9 1,446,698
Direct Operating Expenses……………… 5 328,041 5 571,364 5 803,721
Music & Entertainment………….……… 5 328,041 3 342,819 3 482,233
Advertising & Promotion……….……… 5 328,041 4 457,092 3 482,233
Utilities……………………………………. 4 262,432 3 342,819 3 482,233
Administrative & General………………. 3 196,824 2 228,546 2 321,489
Repairs & Maintenance…………………. 3 196,824 3 342,819 3 482,233
Total controllable expenses……….. 55 3,608,446 47 5,370,826 45 7,233,492
INCOME BEFORE OCCUPANCY COSTS .…..… $731,783 $2,776,408 $4,226,979
OCCUPATION COSTS
Property Taxes & Insurance…….……… 100,000 100,000 100,000
INCOME BEFORE INTEREST & DEPRECIATION 10% $631,783 23% $2,676,408 26% $4,126,979
PAGE 39
OK & ‘SCENARIO 3’ – STATEMENT OF INCOME & EXPENSES
02 2002 03 2003 04 2004
SALES
Food………………………….………. 70% $4,923,925 65% $7,959,748 65% $11,186,027
Beverage…………………………….. 30 1,477,178 35 2,785,912 35 3,915,110
Total Sales……………………… 100 6,401,103 100 10,745,660 100 15,101,137
COST OF SALES
Food………………………….………. 40 1,969,570 35 2,785,912 35 3,915,110
Beverage…………………………….. 35 517,012 30 835,774 30 1,174,533
Total cost of sales……………… 39 2,486,582 34 3,621,685 34 5,089,642
GROSS PROFIT……………..………………... 61 3,914,521 66 7,123,975 66 10,011,494
OTHER INCOME………………………………. 5 320,055 5 537,283 5 755,057
Total Income………………………… 65 4,234,576 71 7,661,258 71 10,766,551
CONTROLLABLE EXPENSES
Payroll…………………………………….. 25 1,600,276 20 2,149,132 17 2,567,193
Employee Benefits……………….………. 5 320,055 7 752,196 9 1,359,102
Direct Operating Expenses……………… 5 320,055 5 537,283 5 755,057
Music & Entertainment………….……… 5 320,055 3 322,370 3 453,034
Advertising & Promotion……….……… 5 320,055 4 429,826 3 453,034
Utilities……………………………………. 4 256,044 3 322,370 3 453,034
Administrative & General………………. 3 192,033 2 214,913 2 302,023
Repairs & Maintenance…………………. 3 192,033 3 322,370 3 453,034
Total controllable expenses……….. 55 3,520,607 47 5,050,460 45 6,795,512
INCOME BEFORE OCCUPANCY COSTS ……… $713,969 $2,610,797 $3,971,040
OCCUPATION COSTS
Property Taxes & Insurance…….……… 100,000 100,000 100,000
INCOME BEFORE INTEREST & DEPRECIATION 10% $613,969 23% $2,510,797 26% $3,871,040
PAGE 40
OK & ‘SCENARIO 2’ – STATEMENT OF INCOME & EXPENSES
02 2002 03 2003 04 2004
SALES
Food………………………….………. 70% $4,693,835 65% $7,514,129 65% $10,457,266
Beverage…………………………….. 30 1,408,151 35 2,629,945 35 3,660,043
Total Sales……………………… 100 6,101,986 100 10,144,075 100 14,117,309
COST OF SALES
Food………………………….………. 40 1,877,534 35 2,629,945 35 3,660,043
Beverage…………………………….. 35 492,853 30 788,984 30 1,098,013
Total cost of sales……………… 39 2,370,387 34 3,418,929 34 4,758,056
GROSS PROFIT……………..………………... 61 3,731,599 66 6,725,146 66 9,359,253
OTHER INCOME………………………………. 5 305,099 5 507,204 5 705,865
Total Income………………………… 65 4,036,699 71 7,232,349 71 10,065,119
CONTROLLABLE EXPENSES
Payroll…………………………………….. 25 1,525,497 20 2,028,815 17 2,399,943
Employee Benefits……………….………. 5 305,099 7 710,085 9 1,270,558
Direct Operating Expenses……………… 5 305,099 5 507,204 5 705,865
Music & Entertainment………….……… 5 305,099 3 304,322 3 423,519
Advertising & Promotion……….……… 5 305,099 4 405,763 3 423,519
Utilities……………………………………. 4 244,079 3 304,322 3 423,519
Administrative & General………………. 3 183,060 2 202,881 2 282,346
Repairs & Maintenance…………………. 3 183,060 3 304,322 3 423,519
Total controllable expenses……….. 55 3,356,092 47 4,767,715 45 6,352,789
INCOME BEFORE OCCUPANCY COSTS .…..… $680,606 $2,464,634 $3,712,330
OCCUPATION COSTS
Property Taxes & Insurance…….……… 100,000 100,000 100,000
INCOME BEFORE INTEREST & DEPRECIATION 10% $580,606 23% $2,364,634 26% $3,612,330
PAGE 41
OK & ‘SCENARIO 1’ – STATEMENT OF INCOME & EXPENSES
02 2002 03 2003 04 2004
SALES
Food………………………….………. 70% $4,515,023 65% $7,157,015 65% $9,862,628
Beverage…………………………….. 30 1,354,507 35 2,504,955 35 3,451,920
Total Sales……………………… 100 5,869,530 100 9,661,971 100 13,314,548
COST OF SALES
Food………………………….………. 40 1,806,009 5 2,504,955 35 3,451,920
Beverage…………………………….. 35 474,077 30 751,487 30 1,035,576
Total cost of sales……………… 39 2,280,086 34 3,256,442 34 4,487,496
GROSS PROFIT……………………………...... 61 3,589,443 66 6,405,529 66 8,827,052
OTHER INCOME………………………………. 5 293,476 5 483,099 5 665,727
Total Income………………………… 65 3,882,920 71 6,888,627 71 9,492,779
CONTROLLABLE EXPENSES
Payroll…………………………………….. 25 1,467,382 20 1,932,394 17 2,263,473
Employee Benefits……………….………. 5 293,476 7 676,338 9 1,198,309
Direct Operating Expenses……………… 5 293,476 5 483,099 5 665,727
Music & Entertainment………….……… 5 293,476 3 289,859 3 399,436
Advertising & Promotion……….……… 5 293,476 4 386,479 3 399,436
Utilities……………………………………. 4 234,781 3 289,859 3 399,436
Administrative & General………………. 3 176,086 2 193,239 2 266,291
Repairs & Maintenance…………………. 3 176,086 3 289,859 3 399,436
Total controllable expenses……….. 55 3,228,241 47 4,541,126 45 5,991,546
INCOME BEFORE OCCUPANCY COSTS ……… $654,678 $2,347,501 $3,501,233
OCCUPATION COSTS
Property Taxes & Insurance…….……… 100,000 100,000 100,000
INCOME BEFORE INTEREST & DEPRECIATION 9% $554,678 23% $2,247,501 26% $3,401,233
PAGE 42
VALUATION
These number are based on the value of the land and the value of the building and four-level
parking garage. The building cost almost $10,000,000 to build in 1996 and the land, although
currently being leased by Harley Davidson Café for $60,000 a month, is valued at $10 million.
• Lunai’s intends on buying the land for $9.5 million.
• Lunai’s intends on buying the building and parking garage for $8 million.
• Lunai’s intends on spending $4.5 million on remodeling and expansion.
• Lunai’s requires $3 million in capital for the first year of operation.
The estimated numbers above total $25 million and make the loan to equity ratio a
70/30 split. This is proven by the required capital to buy the building totaling $17.5 million
(17.5/25=70%) and the required capital to remodel and operate the restaurant totaling $7.5
million (7.5/25=30%).
Avg. Hotel Mtg. Rate Avg. Corporate A Bond Rate
1999 1q 7.86 6.98
1998 4q 7.47 6.87
1998 3q 7.12 6.87
1998 2q 7.44 6.98
1998 1q 7.26 7.00
1997 4q 7.65 7.46
1997 3q 8.44 7.42
1997 2q 8.85 7.84
1997 1q 8.25 7.71
1997 4q 9.49 7.54
1996 3q 8.96 7.90
1996 2q 8.82 7.93
1996 1q 7.79 7.37
1995 4q 8.44 7.28
1995 3q 8.61 7.67
1995 2q 9.25 7.87
(Source: American Council of Life Insurance; Moody’s Bond Record)
PAGE 43
According to Moody’s Bond Record, the Corporate A Bond Rate for October, 1999 was 7.99%.
According to Hospitality Valuation Services, the average interest rate of a hotel mortgage and
the concurrent yield on a Corporate A Bond have a close mathematical relationship. This is
shown through the regression analysis of the historical rates equalling a multiple-r of 83.01%.
The purpose of doing a regression analysis on the average rates is to create an equation that
predicts what the hotel mortgage rate will be by mathematically forecasting the historical
data.
Once the equation is configured, the current Corporate A Bond Rate is plugged into the x
variable. The equation is nothing but the equation for the slope of a line:
Y = a + bx
So, in essence, this equation predicts what point on the line is most probable based upon the
historical data used. The equation from the historical average rates above is:
Y = -3.578367 + 1.591995 (x)
By plugging in the current Corporate A Bond Rate of 7.99, the prediction is made for the most
probable point on the line.
Y = -3.578367 + 1.591995 (7.99) Y = 9.141672
Therefore, the prediction of the most probable future hotel mortgage rate is 9.14%.
Once the most probable future hotel mortgage rate is predicted, the equity dividend rate
must be forecasted. Since restaurants are a risky business, a 15 to 18% return on equity is
most common. Infinity Hospitality & Entertainment International has decided to offer a 15%
equity dividend rate because of the risk involved and the opportunity for partnership in the
Lunai’s operation. This, in addition to the amortization of 25 years and the aforementioned
loan to value ratio give us all of the necessary figures to estimate an overall value of the
restaurant.
PAGE 44
Mortgage Finance Terms
Interest Rate 9.14%
Amortization 25 years
Loan to Value Ratio 70%
Equity Dividend Rate 15%
Capitalization Rate 10.9%
Using the net income from the nine different statements of income and the mortgage
finance terms,Infinity Hospitality & Entertainment International has estimated the nine
different valuations. The valuation approached used has been labeled the banded width income
capitalization approach using one stabilized year. For the purposes of the Lunai’s
valuation,Infinity Hospitality & Entertainment International has identified year three of
operation (year 2004) as their stabilized year. Taking the weighted mortgage rate and the
weighted equity rate, a capitalization rate is then calculated. This capitalization rate is finally
multiplied by the third year net income to give Lunai’s an estimated value.
Lunai’s Estimated Values
using the Banded Width Income Capitalization Approach for One Stabilized Year (year 2004)
Very Good & Scenario 3 $48,366,203
Very Good & Scenario 2 $45,155,407
Very Good & Scenario 1 $42,535,533
Good & Scenario 3 $43,069,048
Good & Scenario 2 $40,203,358
Good & Scenario 1 $37,865,075
OK & Scenario 3 $35,516,828
OK & Scenario 2 $33,143,160
OK & Scenario 1 $31,206,346
PAGE 45
CONCLUSION
Although food and beverage costs are critical in running a restaurant and management is the
ultimate variable, the major concerns in opening and operating a successful restaurant are
employee wages and enough money to operate the restaurant through the first year. These
two points, the other points given, are the make or break variables in successfully running
the Lunai’s restaurant on Harmon and Las Vegas Boulevard in Las Vegas, Nevada.
The estimated $25 million needed to open this restaurant and the estimated loan to equity
ration of 70/30 gives Lunai’s a capitalization rate of 10.9%. Taking the capitalization rate and
multiplying it by the stabilized year of operation, for each of the nine scenarios, shows that
Lunai’s estimated valuation for the ‘worst case scenario’ is $31.2 million. The estimated ‘best
case scenario’ values Lunai’s at $44.4 million. In addition, it is more than possible to exceed
the prediction because of the conservative approach taken byInfinity Hospitality &
Entertainment International. This is shown in the Lunai’s Competitive Index scores being
lower and never higher than the average competitive index of the competition.
This study has shown Lunai’s to be a feasible enterprise, assuming the leadership is excellent
and the concepts described herein to be viable in nature, because all scenarios are valued
greater than the $25 million investment required to create the restaurant named Lunai’s.
The next and final issue is how to attain the capital…
PAGE 46
CAPITAL SOURCES & FINANCING
For the limited track record of the leadership and the level of risk Lunai’s poses, there are
only a few options in attaining venture capital:
OPTION 1A (on the $17.5 million)
A friend of the leadership buys the land and the building for $17.5 million and holds the note
on the mortgage sold toInfinity Hospitality & Entertainment International. Assuming the
mortgage is given at a rate of 9.14% over a 25 year period, the annual payment would be $1.8
million and interest only payments for the first two years would be required for Lunai’s to be
able to stay current on their debt service.
OPTION 1B (on the $17.5 million)
A friend of the leadership buys the land and the building for $17.5 million and leases them
toInfinity Hospitality & Entertainment International with interest only payments for the first
two years.
OPTION 1C (on the $17.5 million)
A friend of the leadership buys the land and the building for $17.5 million and leases them
toInfinity Hospitality & Entertainment International with interest only payments for the first
two years and a percentage of gross income.
OPTION 1D (on the $17.5 million)
A venture capital firm is approached and negotiations begin. The money is similar to selling
one’s soul. High interest rates and they usually participate in the day to day operations of
the business.
PAGE 47
OPTION 2A (on the $7.5 million)
The other $7.5 million would be attained through an equity loan at 15% over a 20 year period.
The annual payment would be $1.2 million, but would have to be interest only payments for
the first two years.
OPTION 2B (on the $7.5 million)
The other $7.5 million would be attained through a combination of an equity loan and a
limited partnership agreement. Any partner that has ‘limited partner’ status is required to be
passive in the daily operations of the business. The annual payment on the equity loan
would be dependent upon the negotiations and would have to be interest only payments for
the first two years.
OPTION 2C (on the $7.5 million)
A combination of limited and general partners, or simply a couple of general partners. The
limited partners only risk their equity investment while the general partners are personally
liable for the debts and obligations of the partnership.
OPTION 2D (on the $7.5 million)
Incorporate Lunai’s and issue 49% of the stock to raise the $7.5 million needed for
remodeling, expansion, and operating capital.
Infinity Hospitality & Entertainment International believes that Options 1c & 2c are the most
probable combinations for acquiring the necessary capital to make Lunai’s a success beyond compare.

More Related Content

Similar to Restaurant Revenue Forecasting

Mid cap & small cap performance
Mid cap & small cap performanceMid cap & small cap performance
Mid cap & small cap performance
BFSICM
 
Accelerate performance
Accelerate performanceAccelerate performance
Accelerate performance
melanie_bissonnette
 
JP Morgan 2015q1 Guide to the Markets
JP Morgan 2015q1 Guide to the MarketsJP Morgan 2015q1 Guide to the Markets
JP Morgan 2015q1 Guide to the Markets
Allen Parker, CFP ®
 
Market Watch TORONTO 2015 SEPTEMBER
Market Watch TORONTO 2015 SEPTEMBERMarket Watch TORONTO 2015 SEPTEMBER
Market Watch TORONTO 2015 SEPTEMBER
Chaba Tamasi
 
Duff & Phelps Restaurant Monthly Update - October 2016
Duff & Phelps Restaurant Monthly Update - October 2016Duff & Phelps Restaurant Monthly Update - October 2016
Duff & Phelps Restaurant Monthly Update - October 2016
Duff & Phelps
 
Indian Spectrum Auctions : Design Issues & Way Forward
Indian Spectrum Auctions : Design Issues & Way ForwardIndian Spectrum Auctions : Design Issues & Way Forward
Indian Spectrum Auctions : Design Issues & Way Forward
Parag Kar
 
MRM APRIL 2023.pptx
MRM APRIL 2023.pptxMRM APRIL 2023.pptx
MRM APRIL 2023.pptx
RaviSingh207882
 
SAT Practice Tests
SAT Practice TestsSAT Practice Tests
SAT Practice Tests
Muhammad Arslan
 
**JUNK** Upload
**JUNK** Upload**JUNK** Upload
**JUNK** Upload
pratap.koppal93
 
Informe mensual diciembre 2020
Informe mensual diciembre 2020Informe mensual diciembre 2020
Informe mensual diciembre 2020
JorgeElias50
 
Mercer Capital's Value Focus: Convenience Store Industry | Q1 2017 | Segment:...
Mercer Capital's Value Focus: Convenience Store Industry | Q1 2017 | Segment:...Mercer Capital's Value Focus: Convenience Store Industry | Q1 2017 | Segment:...
Mercer Capital's Value Focus: Convenience Store Industry | Q1 2017 | Segment:...
Mercer Capital
 
Awards Day April 2009
Awards Day April 2009Awards Day April 2009
Awards Day April 2009Angus Leisure
 
Mercer Capital's Value Focus: Convenience Store Industry | Q2 2016 | Segment:...
Mercer Capital's Value Focus: Convenience Store Industry | Q2 2016 | Segment:...Mercer Capital's Value Focus: Convenience Store Industry | Q2 2016 | Segment:...
Mercer Capital's Value Focus: Convenience Store Industry | Q2 2016 | Segment:...
Mercer Capital
 
Financial Statement Analysis Powerpoint Presentation Slides
Financial Statement Analysis Powerpoint Presentation SlidesFinancial Statement Analysis Powerpoint Presentation Slides
Financial Statement Analysis Powerpoint Presentation Slides
SlideTeam
 
Market watch jan 2019 frank yu oakville
Market watch jan 2019 frank yu oakvilleMarket watch jan 2019 frank yu oakville
Market watch jan 2019 frank yu oakville
Frank Yu
 
TREB Market Watch for May 2016
TREB Market Watch for May 2016TREB Market Watch for May 2016
TREB Market Watch for May 2016
Michelle Makos
 
Market Watch May 2016
Market Watch May 2016Market Watch May 2016
Market Watch May 2016
Chaba Tamasi
 
October Market Watch is Here !
October Market Watch is Here !October Market Watch is Here !
October Market Watch is Here !
Michelle Makos
 
Toronto Market Watch AUGUST 2016
Toronto Market Watch AUGUST 2016Toronto Market Watch AUGUST 2016
Toronto Market Watch AUGUST 2016
Chaba Tamasi
 

Similar to Restaurant Revenue Forecasting (20)

Mid cap & small cap performance
Mid cap & small cap performanceMid cap & small cap performance
Mid cap & small cap performance
 
Accelerate performance
Accelerate performanceAccelerate performance
Accelerate performance
 
JP Morgan 2015q1 Guide to the Markets
JP Morgan 2015q1 Guide to the MarketsJP Morgan 2015q1 Guide to the Markets
JP Morgan 2015q1 Guide to the Markets
 
Market Watch TORONTO 2015 SEPTEMBER
Market Watch TORONTO 2015 SEPTEMBERMarket Watch TORONTO 2015 SEPTEMBER
Market Watch TORONTO 2015 SEPTEMBER
 
Duff & Phelps Restaurant Monthly Update - October 2016
Duff & Phelps Restaurant Monthly Update - October 2016Duff & Phelps Restaurant Monthly Update - October 2016
Duff & Phelps Restaurant Monthly Update - October 2016
 
Indian Spectrum Auctions : Design Issues & Way Forward
Indian Spectrum Auctions : Design Issues & Way ForwardIndian Spectrum Auctions : Design Issues & Way Forward
Indian Spectrum Auctions : Design Issues & Way Forward
 
MRM APRIL 2023.pptx
MRM APRIL 2023.pptxMRM APRIL 2023.pptx
MRM APRIL 2023.pptx
 
SAT Practice Tests
SAT Practice TestsSAT Practice Tests
SAT Practice Tests
 
**JUNK** Upload
**JUNK** Upload**JUNK** Upload
**JUNK** Upload
 
Informe mensual diciembre 2020
Informe mensual diciembre 2020Informe mensual diciembre 2020
Informe mensual diciembre 2020
 
Mercer Capital's Value Focus: Convenience Store Industry | Q1 2017 | Segment:...
Mercer Capital's Value Focus: Convenience Store Industry | Q1 2017 | Segment:...Mercer Capital's Value Focus: Convenience Store Industry | Q1 2017 | Segment:...
Mercer Capital's Value Focus: Convenience Store Industry | Q1 2017 | Segment:...
 
delaura 03 restaurant-projections 1
delaura 03 restaurant-projections 1delaura 03 restaurant-projections 1
delaura 03 restaurant-projections 1
 
Awards Day April 2009
Awards Day April 2009Awards Day April 2009
Awards Day April 2009
 
Mercer Capital's Value Focus: Convenience Store Industry | Q2 2016 | Segment:...
Mercer Capital's Value Focus: Convenience Store Industry | Q2 2016 | Segment:...Mercer Capital's Value Focus: Convenience Store Industry | Q2 2016 | Segment:...
Mercer Capital's Value Focus: Convenience Store Industry | Q2 2016 | Segment:...
 
Financial Statement Analysis Powerpoint Presentation Slides
Financial Statement Analysis Powerpoint Presentation SlidesFinancial Statement Analysis Powerpoint Presentation Slides
Financial Statement Analysis Powerpoint Presentation Slides
 
Market watch jan 2019 frank yu oakville
Market watch jan 2019 frank yu oakvilleMarket watch jan 2019 frank yu oakville
Market watch jan 2019 frank yu oakville
 
TREB Market Watch for May 2016
TREB Market Watch for May 2016TREB Market Watch for May 2016
TREB Market Watch for May 2016
 
Market Watch May 2016
Market Watch May 2016Market Watch May 2016
Market Watch May 2016
 
October Market Watch is Here !
October Market Watch is Here !October Market Watch is Here !
October Market Watch is Here !
 
Toronto Market Watch AUGUST 2016
Toronto Market Watch AUGUST 2016Toronto Market Watch AUGUST 2016
Toronto Market Watch AUGUST 2016
 

More from Infinity Hospitality & Entertainment International

Green Buffalo Estates - Investor Brochure
Green Buffalo Estates - Investor BrochureGreen Buffalo Estates - Investor Brochure
Green Buffalo Estates - Investor Brochure
Infinity Hospitality & Entertainment International
 
LUVRules Social Purpose Grant
LUVRules Social Purpose GrantLUVRules Social Purpose Grant
Clark County Lunch Service Analysis
Clark County Lunch Service AnalysisClark County Lunch Service Analysis
Clark County Lunch Service Analysis
Infinity Hospitality & Entertainment International
 
Employee Selection Systems
Employee Selection SystemsEmployee Selection Systems
Clark County Liquor Licensing
Clark County Liquor LicensingClark County Liquor Licensing
Sexual Harassment in Restaurants
Sexual Harassment in RestaurantsSexual Harassment in Restaurants
Sexual Harassment in Restaurants
Infinity Hospitality & Entertainment International
 
Restaurant Site Selection Trends
Restaurant Site Selection TrendsRestaurant Site Selection Trends
Restaurant Site Selection Trends
Infinity Hospitality & Entertainment International
 
Supplier Relations Analysis
Supplier Relations AnalysisSupplier Relations Analysis
Foodservice Branding
Foodservice BrandingFoodservice Branding
Corporate Culture
Corporate CultureCorporate Culture
Regression Analysis Forecasting
Regression Analysis ForecastingRegression Analysis Forecasting
Customer Service Expectations
Customer Service ExpectationsCustomer Service Expectations
Outback Strategic Study & Financial Analysis: 1995
Outback Strategic Study & Financial Analysis: 1995Outback Strategic Study & Financial Analysis: 1995
Outback Strategic Study & Financial Analysis: 1995
Infinity Hospitality & Entertainment International
 
Zion Retreat Center
Zion Retreat CenterZion Retreat Center
LUVRules Inc. Culture Code
LUVRules Inc. Culture CodeLUVRules Inc. Culture Code
Lunai's Restaurant
Lunai's RestaurantLunai's Restaurant
LUVRules.com
LUVRules.comLUVRules.com
Master Plan Homes
Master Plan HomesMaster Plan Homes
Las Vegas Casino Resort
Las Vegas Casino ResortLas Vegas Casino Resort

More from Infinity Hospitality & Entertainment International (20)

Green Buffalo Estates - Investor Brochure
Green Buffalo Estates - Investor BrochureGreen Buffalo Estates - Investor Brochure
Green Buffalo Estates - Investor Brochure
 
LUVRules Social Purpose Grant
LUVRules Social Purpose GrantLUVRules Social Purpose Grant
LUVRules Social Purpose Grant
 
Front of House Service Manual
Front of House Service ManualFront of House Service Manual
Front of House Service Manual
 
Clark County Lunch Service Analysis
Clark County Lunch Service AnalysisClark County Lunch Service Analysis
Clark County Lunch Service Analysis
 
Employee Selection Systems
Employee Selection SystemsEmployee Selection Systems
Employee Selection Systems
 
Clark County Liquor Licensing
Clark County Liquor LicensingClark County Liquor Licensing
Clark County Liquor Licensing
 
Sexual Harassment in Restaurants
Sexual Harassment in RestaurantsSexual Harassment in Restaurants
Sexual Harassment in Restaurants
 
Restaurant Site Selection Trends
Restaurant Site Selection TrendsRestaurant Site Selection Trends
Restaurant Site Selection Trends
 
Supplier Relations Analysis
Supplier Relations AnalysisSupplier Relations Analysis
Supplier Relations Analysis
 
Foodservice Branding
Foodservice BrandingFoodservice Branding
Foodservice Branding
 
Corporate Culture
Corporate CultureCorporate Culture
Corporate Culture
 
Regression Analysis Forecasting
Regression Analysis ForecastingRegression Analysis Forecasting
Regression Analysis Forecasting
 
Customer Service Expectations
Customer Service ExpectationsCustomer Service Expectations
Customer Service Expectations
 
Outback Strategic Study & Financial Analysis: 1995
Outback Strategic Study & Financial Analysis: 1995Outback Strategic Study & Financial Analysis: 1995
Outback Strategic Study & Financial Analysis: 1995
 
Zion Retreat Center
Zion Retreat CenterZion Retreat Center
Zion Retreat Center
 
LUVRules Inc. Culture Code
LUVRules Inc. Culture CodeLUVRules Inc. Culture Code
LUVRules Inc. Culture Code
 
Lunai's Restaurant
Lunai's RestaurantLunai's Restaurant
Lunai's Restaurant
 
LUVRules.com
LUVRules.comLUVRules.com
LUVRules.com
 
Master Plan Homes
Master Plan HomesMaster Plan Homes
Master Plan Homes
 
Las Vegas Casino Resort
Las Vegas Casino ResortLas Vegas Casino Resort
Las Vegas Casino Resort
 

Recently uploaded

Best Crypto Marketing Ideas to Lead Your Project to Success
Best Crypto Marketing Ideas to Lead Your Project to SuccessBest Crypto Marketing Ideas to Lead Your Project to Success
Best Crypto Marketing Ideas to Lead Your Project to Success
Intelisync
 
Zeeshan Hayat - A Guide to Efficient Business Management.pdf
Zeeshan Hayat - A Guide to Efficient Business Management.pdfZeeshan Hayat - A Guide to Efficient Business Management.pdf
Zeeshan Hayat - A Guide to Efficient Business Management.pdf
Zeeshan Hayat
 
Michael Economou - Don't build a marketplace.pdf
Michael Economou - Don't build a marketplace.pdfMichael Economou - Don't build a marketplace.pdf
Michael Economou - Don't build a marketplace.pdf
Michael Oikonomou
 
Get To Know About Salma Karina Hayat.pdf
Get To Know About Salma Karina Hayat.pdfGet To Know About Salma Karina Hayat.pdf
Get To Know About Salma Karina Hayat.pdf
Salma Karina Hayat
 
Showcase Portfolio- Marian Andrea Tana.pdf
Showcase Portfolio- Marian Andrea Tana.pdfShowcase Portfolio- Marian Andrea Tana.pdf
Showcase Portfolio- Marian Andrea Tana.pdf
MarianAndreaSTana
 
How To Leak-Proof Your Magazine Business
How To Leak-Proof Your Magazine BusinessHow To Leak-Proof Your Magazine Business
How To Leak-Proof Your Magazine Business
Charlie McDermott
 
在线办理(uofc毕业证书)芝加哥大学毕业证学历学位证书原版一模一样
在线办理(uofc毕业证书)芝加哥大学毕业证学历学位证书原版一模一样在线办理(uofc毕业证书)芝加哥大学毕业证学历学位证书原版一模一样
在线办理(uofc毕业证书)芝加哥大学毕业证学历学位证书原版一模一样
pv4uhplv
 
Create a spend money transaction during bank reconciliation.pdf
Create a spend money transaction during bank reconciliation.pdfCreate a spend money transaction during bank reconciliation.pdf
Create a spend money transaction during bank reconciliation.pdf
andreakaterasco
 
Legal Mandates of technopreneurship.pptx
Legal Mandates of technopreneurship.pptxLegal Mandates of technopreneurship.pptx
Legal Mandates of technopreneurship.pptx
JadielByronAntonio
 

Recently uploaded (9)

Best Crypto Marketing Ideas to Lead Your Project to Success
Best Crypto Marketing Ideas to Lead Your Project to SuccessBest Crypto Marketing Ideas to Lead Your Project to Success
Best Crypto Marketing Ideas to Lead Your Project to Success
 
Zeeshan Hayat - A Guide to Efficient Business Management.pdf
Zeeshan Hayat - A Guide to Efficient Business Management.pdfZeeshan Hayat - A Guide to Efficient Business Management.pdf
Zeeshan Hayat - A Guide to Efficient Business Management.pdf
 
Michael Economou - Don't build a marketplace.pdf
Michael Economou - Don't build a marketplace.pdfMichael Economou - Don't build a marketplace.pdf
Michael Economou - Don't build a marketplace.pdf
 
Get To Know About Salma Karina Hayat.pdf
Get To Know About Salma Karina Hayat.pdfGet To Know About Salma Karina Hayat.pdf
Get To Know About Salma Karina Hayat.pdf
 
Showcase Portfolio- Marian Andrea Tana.pdf
Showcase Portfolio- Marian Andrea Tana.pdfShowcase Portfolio- Marian Andrea Tana.pdf
Showcase Portfolio- Marian Andrea Tana.pdf
 
How To Leak-Proof Your Magazine Business
How To Leak-Proof Your Magazine BusinessHow To Leak-Proof Your Magazine Business
How To Leak-Proof Your Magazine Business
 
在线办理(uofc毕业证书)芝加哥大学毕业证学历学位证书原版一模一样
在线办理(uofc毕业证书)芝加哥大学毕业证学历学位证书原版一模一样在线办理(uofc毕业证书)芝加哥大学毕业证学历学位证书原版一模一样
在线办理(uofc毕业证书)芝加哥大学毕业证学历学位证书原版一模一样
 
Create a spend money transaction during bank reconciliation.pdf
Create a spend money transaction during bank reconciliation.pdfCreate a spend money transaction during bank reconciliation.pdf
Create a spend money transaction during bank reconciliation.pdf
 
Legal Mandates of technopreneurship.pptx
Legal Mandates of technopreneurship.pptxLegal Mandates of technopreneurship.pptx
Legal Mandates of technopreneurship.pptx
 

Restaurant Revenue Forecasting

  • 1. PAGE 1 THE BUILD-UP APPROACH FOR FORECASTING REVENUE Infinity Hospitality & Entertainment International will be using a build-up approach for forecasting revenue based upon an analysis of the direct competition’s restaurant activity. The build-up approach uses a competitive index where the patrons per week at each meal period is divided by the number of seats available. This competitive index indicates the restaurant’s productivity and popularity by representing the number of patrons served per seat in one week. This index is then used in combination with the predicted market growth rate and the estimated per person average to forecast food sales for each year. The market growth rate has been configured for three different scenarios and the competitive index has also been predicted based on three different scenarios. This creates a total of nine different statements of income and expenses based upon the three different market growth rates and the three different competitive indexes. The three different market growth rate scenarios use the conservatism principal approach. Scenario 1 has a growth rate of 3% the first year, 2% the second year and 1% the years following. Scenario 2 has a growth rate of 5% the first year, 3% the second year and 2% the years following. Scenario 3 has a growth rate of 7% the first year, 5% the second year and 3% the years following. Scenario 3 is the most probable due to the market analysis and the economic indicators discussed prior. The three different competitive index scenarios use the conservatism principal approach as well. The competitive index scenarios were created by based upon the amount of daily covers possible, with the amount of seats available, in comparison to what the competition was doing.
  • 2. PAGE 2 For the purposes of this restaurant, each meal period and each room were given a competitive index. Furthermore, the first year of operation was the lowest competitive index while the second year increased in sales due to Lunai’s popularity while the third year increases and becomes the stabilized year. So, for the Grill Room Lunch, Lunai’s OK Competitive Index earns a 4 for the first year of operation, 5.5 for the second year of operation and 6.5 for the third year and beyond. Lunai’s Good Competitive Index earns a 4.5 for the first year of operation, 6 for the second year of operation and 7 for the third year and beyond. Lunai’s Very Good Competitive Index earns a 5 for the first year of operation, 6.5 for the second year of operation and 7.5 for the third year and beyond. For the Grill Room Dinner, Lunai’s OK Competitive Index earns a 5.5 for the first year of operation, 6.5 for the second year of operation and 7.5 for the third year and beyond. Lunai’s Good Competitive Index earns a 6 for the first year of operation, 8 for the second year of operation and 10 for the third year and beyond. Lunai’s Very Good Competitive Index earns a 7 for the first year of operation, 9 for the second year of operation and 11 for the third year and beyond. For the Gourmet Room, which is open only 5 days a week, Lunai’s OK Competitive Index earns a 1.5 for the first year of operation, 4 for the second year of operation and 6 for the third year and beyond. Lunai’s Good Competitive Index earns a 2 for the first year of operation, 5 for the second year of operation and 7 for the third year and beyond. Lunai’s Very Good Competitive Index earns a 3 for the first year of operation, 7 for the second year of operation and 9 for the third year and beyond.
  • 3. PAGE 3 Again, each competitive index was created based upon the amount of daily covers possible, with the amount of seats available, in comparison to what the competition was doing. The following table more easily describes the three scenarios for both competitive index and market growth rates. The Scenarios GRILL LUNCH GRILL DINNER GOURMET RM. MARKET GROWTH % Year Index Cover Index Cover Index Cover #3 #2 #1 VERY GOOD COMPETITIVE INDEX Yr. 1 5.0 250 7 350 3 60 7% 5% 3% Yr. 2 6.5 325 9 450 7 140 5 3 2 Yr. 3+ 7.5 375 11 550 9 180 3 2 1 Seats 350 350 100 GOOD COMPETITIVE INDEX Yr. 1 4.5 225 6 300 2 40 7% 5% 3% Yr. 2 6 300 8 400 5 100 5 3 2 Yr. 3+ 7 350 10 500 7 140 3 2 1 Seats 350 350 100 OK COMPETITIVE INDEX Yr. 1 4 200 5.5 275 1.5 30 7% 5% 3% Yr. 2 5.5 275 6.5 325 4 80 5 3 2 Yr. 3+ 6.5 325 7.5 375 6 120 3 2 1 Seats 350 350 100 Before we calculate the patrons per week (PPW) for each direct competitor and the average competitive index for each year depending upon the market growth rate scenario (3 being the best and 1 being the worst), the competitive index for each direct competitor must be calculated.
  • 4. PAGE 4 Based upon the information collected in the Competition Analysis, the direct competition’s competitive index values for each meal period are: Grill Room Competition – Competitive Index Direct Comp. Lch PPW Din PPW Seats LnchIndex DinIndex Circo 1680 3150 175 9.6 18 Cozymels* 1400 - 320 4.4* - Emeril’s 1400 4200 200 7 21 Gordon Biersch* 3500 - 310 11.3* - McCormick &* 1680 - 230 7.3* - Mon Ami Gabi 2100 4900 380 5.5 12.9 PF Changs* 3500 - 248 14.1* - Pinot Brasserie 700 1750 230 3 7.6 Spago Café 3150 2800 140 22.5 20 Star Canyon 700 1400 210 3.3 6.7 Voo Doo Café - 1540 240 - 6.4 Wollensky Grill 350 875 65 5.4 13.5 Z-Tejas 1050 2100 275 3.8 7.6 Total 21,210 (12) 22,715 (9) 2783-L 1915-D 7.62 11.86 *lunch only Gourmet Room Competition – Competitive Index Direct Competition PPW Seats Competitive Index Aqua 1890 145 13 Aureole 2800 250 11.2 Eiffel Tower 2100 210 10 Le Cirque 1050 70 15 Smith & Wollensky 2100 550 3.8 Spago Dining 2100 160 13.1 Total 12,040 1385 8.69
  • 5. PAGE 5 Now that the competitive index is calculated, we can calculate the patrons per week (PPW) for each direct competitor and the average competitive index for each year depending upon the market growth rate. Lunai’s Very Good Competitive Index Scenario 1 = 3% 2% 1% / Scenario 2 = 5% 3% 2% / Scenario 3 = 7% 5% 3% Grill Room – Overall Competitive Index for Lunch Lunch 1999 2000 2001 2002 2003 2004 2005 2006 PPW 1 21,210 21,846 22,283 22,506 22,731 22,958 23,188 23,420 Avg. Index 1 7.6 7.8 8.0 7.2 7.3 7.3 7.4 7.5 PPW 2 21,210 22,271 22,939 23,397 23,865 24,343 24,829 25,326 Avg. Index 2 7.6 8.0 8.2 7.5 7.6 7.8 7.9 8.1 PPW 3 21,210 22,695 23,829 24,544 25,281 26,039 26,820 27,625 Avg. Index 3 7.6 8.2 8.6 7.8 8.1 8.3 8.6 8.8 Lunai Index3 5 6.5 7.5 7.5 7.5 Tot Seats 2783 2783 2783 3133 3133 3133 3133 3133 Grill Room – Overall Competitive Index for Dinner Dinner 1999 2000 2001 2002 2003 2004 2005 2006 PPW 1 22,715 23,396 23,864 24,103 24,344 24,587 24,833 25,082 Avg. Index 1 11.9 12.2 12.5 10.6 10.7 10.9 11.0 11.1 PPW 2 22,715 23,851 24,566 25,058 25,559 26,070 26,591 27,123 Avg. Index 2 11.9 12.5 12.8 11.1 11.3 11.5 11.7 12.0 PPW 3 22,715 24,305 25,520 26,286 27,074 27,887 28,723 29,585 Avg. Index 3 11.9 12.7 13.3 11.6 12.0 12.3 12.7 13.1 Lunai Index3 7 9 11 11 11 Tot Seats 1915 1915 1915 2265 2265 2265 2265 2265 Gourmet Room – Overall Competitive Index Gourmet Rm 1999 2000 2001 2002 2003 2004 2005 2006 PPW 1 12040 12401 12649 12776 12903 13033 13163 13294 Avg. Index 1 8.7 9.0 9.1 8.6 8.7 8.8 8.9 9.0 PPW 2 12040 12642 13021 13282 13547 13818 14095 14377 Avg. Index 2 8.7 9.1 9.4 8.9 9.1 9.3 9.5 9.7 PPW 3 12040 12883 13527 13933 14351 14781 15225 15681 Avg. Index 3 8.7 9.3 9.8 9.4 9.7 10.0 10.3 10.6 Lunai Index3 3 7 9 9 9 Tot Seats 1385 1385 1385 1485 1485 1485 1485 1485 Since fair share and market share percentages are not impacted by market growth rates, only one table for each meal period is required:
  • 6. PAGE 6 Lunai’s Very Good Competitive Index Grill Room Lunch – Fair Share, Market Share & Market Share as a % of Fair Share Lunch 1999 2000 2001 2002 2003 2004 2005 2006 Circo FS 6.3% 6.3% 6.3% 5.6% 5.6% 5.6% 5.6% 5.6% MS 7.9% 7.9% 7.9% 7.3% 7.2% 7.0% 7.0% 7.0% MS as %FS 126% 126% 126% 131% 128% 126% 126% 126% Cozymels FS 11.5 11.5 11.5 10.2 10.2 10.2 10.2 10.2 MS 6.6 6.6 6.6 6.1 6.0 5.9 5.9 5.9 MS as %FS 57 57 57 60 58 58 58 58 Emeril’s FS 7.2 7.2 7.2 6.4 6.4 6.4 6.4 6.4 MS 6.6 6.6 6.6 6.1 6.0 5.9 5.9 5.9 MS as %FS 92 92 92 96 93 92 92 92 Gordon FS 11.1 11.1 11.1 9.9 9.9 9.9 9.9 9.9 MS 16.5 16.5 16.5 9.9 9.9 9.9 9.9 9.9 MS as %FS 148 148 148 154 151 148 148 148 McCormick FS 8.3 8.3 8.3 7.3 7.3 7.3 7.3 7.3 MS 7.9 7.9 7.9 7.3 7.2 7.0 7.0 7.0 MS as %FS 96 96 96 100 97 96 96 96 Mon Ami FS 13.7 13.7 13.7 12.1 12.1 12.1 12.1 12.1 MS 9.9 9.9 9.9 9.1 8.9 8.8 8.8 8.8 MS as %FS 73 73 73 75 74 73 73 73 PF Changs FS 8.9 8.9 8.9 7.9 7.9 7.9 7.9 7.9 MS 16.5 16.5 16.5 15.2 14.9 14.7 14.7 14.7 MS as %FS 185 185 185 193 188 186 186 186 Pinot Bras FS 8.3 8.3 8.3 7.3 7.3 7.3 7.3 7.3 MS 3.3 3.3 3.3 3.0 3.0 2.9 2.9 2.9 MS as %FS 40 40 40 42 41 40 40 40 Spago Café FS 5.0 5.0 5.0 4.5 4.5 4.5 4.5 4.5 MS 14.9 14.9 14.9 13.7 13.4 13.2 13.2 13.2 MS as %FS 295 295 295 307 300 296 296 296 Star Canyon FS 7.5 7.5 7.5 6.7 6.7 6.7 6.7 6.7 MS 3.3 3.3 3.3 3.0 3.0 2.9 2.9 2.9 MS as %FS 44 44 44 45 44 44 44 44 Woll Grill FS 2.3 2.3 2.3 2.1 2.1 2.1 2.1 2.1 MS 1.7 1.7 1.7 1.5 1.5 1.5 1.5 1.5 MS as %FS 71 71 71 73 72 71 71 71 Z-Tejas FS 9.9 9.9 9.9 8.8 8.8 8.8 8.8 8.8 MS 5.0 5.0 5.0 4.6 4.5 4.4 4.4 4.4 MS as %FS 50 50 50 52 51 50 50 50 Lunai’s FS 11.2 11.2 11.2 11.2 11.2 MS 7.6 9.7 11.0 11.0 11.0 MS as %FS 68 87 99 99 99
  • 7. PAGE 7 Lunai’s Very Good Competitive Index Grill Room Dinner – Fair Share, Market Share & Market Share as a % of Fair Share Dinner 1999 2000 2001 2002 2003 2004 2005 2006 Circo FS 9.1% 9.1% 9.1% 7.7% 7.7% 7.7% 7.7% 7.7% MS 13.9% 13.9% 13.9% 12.5% 12.2% 11.9% 11.9% 11.9% MS as %FS 152% 152% 152% 162% 158% 153% 153% 153% Emeril’s FS 10.4 10.4 10.4 8.8 8.8 8.8 8.8 8.8 MS 18.5 18.5 18.5 16.7 16.2 15.8 15.8 15.8 MS as %FS 177 177 177 189 184 179 179 179 Mon Ami FS 19.8 19.8 19.8 16.8 16.8 16.8 16.8 16.8 MS 21.6 21.6 21.6 19.5 18.9 18.4 18.4 18.4 MS as %FS 109 109 109 116 113 110 110 110 Pinot Bras FS 12.0 12.0 12.0 10.2 10.2 10.2 10.2 10.2 MS 7.7 7.7 7.7 7.0 6.8 6.6 6.6 6.6 MS as %FS 64 64 64 68 67 65 65 65 Spago Café FS 7.3 7.3 7.3 6.2 6.2 6.2 6.2 6.2 MS 12.3 12.3 12.3 11.1 10.8 10.5 10.5 10.5 MS as %FS 169 169 169 180 175 171 171 171 Star Canyon FS 11.0 11.0 11.0 9.3 9.3 9.3 9.3 9.3 MS 6.2 6.2 6.2 5.6 5.4 5.3 5.3 5.3 MS as %FS 56 56 56 60 58 57 57 57 Voo Doo FS 12.5 12.5 12.5 10.6 10.6 10.6 10.6 10.6 MS 6.8 6.8 6.8 6.1 6.0 5.8 5.8 5.8 MS as %FS 54 54 54 58 56 55 55 55 Woll Grill FS 3.4 3.4 3.4 2.9 2.9 2.9 2.9 2.9 MS 3.9 3.9 3.9 3.5 3.4 3.3 3.3 3.3 MS as %FS 113 113 113 121 118 115 115 115 Z-Tejas FS 14.4 14.4 14.4 12.1 12.1 12.1 12.1 12.1 MS 9.2 9.2 9.2 8.3 8.1 7.9 7.9 7.9 MS as %FS 64 64 64 69 67 65 65 65 Lunai’s FS 15.5 15.5 15.5 15.5 15.5 MS 9.7 12.2 14.5 14.5 14.5 MS as %FS 63 79 94 94 94
  • 8. PAGE 8 Lunai’s Very Good Competitive Index Gourmet Room – Fair Share, Market Share & Market Share as a % of Fair Share Gourmet 1999 2000 2001 2002 2003 2004 2005 2006 Aqua FS 10.5% 10.5% 10.5% 9.8% 9.8% 9.8% 9.8% 9.8% MS 15.7% 15.7% 15.7% 15.3% 14.8% 14.6% 14.6% 14.6% MS as %FS 150% 150% 150% 157% 152% 150% 150% 150% Aureole FS 18.1 18.1 18.1 16.8 16.8 16.8 16.8 16.8 MS 23.3 23.3 23.3 22.7 22.0 21.6 21.6 21.6 MS as %FS 129 129 129 135 131 129 129 129 Eiffel FS 15.2 15.2 15.2 14.1 14.1 14.1 14.1 14.1 MS 17.4 17.4 17.4 17.0 16.5 16.2 16.2 16.2 MS as %FS 115 115 115 120 117 115 115 115 Le Cirque FS 5.1 5.1 5.1 4.7 4.7 4.7 4.7 4.7 MS 8.7 8.7 8.7 8.5 8.2 8.1 8.1 8.1 MS as %FS 173 173 173 181 175 172 172 172 Smith&Wol FS 39.7 39.7 39.7 37.0 37.0 37.0 37.0 37.0 MS 17.4 17.4 17.4 17.0 16.5 16.2 16.2 16.2 MS as %FS 44 44 44 46 45 44 44 44 Spago Dine FS 11.6 11.6 11.6 10.8 10.8 10.8 10.8 10.8 MS 17.4 17.4 17.4 17.0 16.5 16.2 16.2 16.2 MS as %FS 151 151 151 158 153 151 151 151 Lunai’s FS 6.7 6.7 6.7 6.7 6.7 MS 2.4 5.5 7.0 7.0 7.0 MS as %FS 36 82 103 103 103
  • 9. PAGE 9 PROJECTED PATRONS PER WEEK (SCENARIO ONE – 3% 2% 1%) Lunai’s Very Good Competitive Index Grill Room – Projected Patrons Per Week for Lunch Lunch 1999 2000 2001 2002 2003 2004 2005 2006 PPW 21,210 21,846 22,283 22,506 22,731 22,958 23,188 23,420 Mkt Share 7.6% 9.7% 11.0% 11.0% 11.0% Capture 1715 2202 2528 2554 2579 Revenue $1,338,013 $2,003,794 $2,629,600 $2,655,896 $2,682,455 PPA $15.00 $17.50 $20.00 $20.00 $20.00 Grill Room – Projected Patrons Per Week for Dinner Dinner 1999 2000 2001 2002 2003 2004 2005 2006 PPW 22,715 23,396 23,864 24,103 24,344 24,587 24,833 25,082 Mkt Share 9.7% 12.2% 14.5% 14.5% 14.5% Capture 2347 2965 3563 3599 3635 Revenue $3,660,709 $5,395,881 $7,411,882 $7,486,001 $7,560,861 PPA $30.00 $35.00 $40.00 $40.00 $40.00 Gourmet Room – Projected Patrons Per Week Gourmet 1999 2000 2001 2002 2003 2004 2005 2006 PPW 12040 12401 12649 12776 12903 13033 13163 13294 Mkt Share 2.4% 5.5% 7.0% 7.0% 7.0% Capture 311 709 906 915 925 Revenue $969,049 $2,396,359 $3,299,420 $3,332,414 $3,365,738 PPA $60.00 $65.00 $70.00 $70.00 $70.00 Estimated Gross Revenue 2002 2003 2004 2005 2006 Tot. Revenue $5,967,772 $9,796,034 $13,340,902 $13,474,311 $13,609,054
  • 10. PAGE 10 PROJECTED PATRONS PER WEEK (SCENARIO TWO – 5% 3% 2%) Lunai’s Very Good Competitive Index Grill Room – Projected Patrons Per Week for Lunch Lunch 1999 2000 2001 2002 2003 2004 2005 2006 PPW 21,210 22,271 22,939 23,397 23,865 24,343 24,829 25,326 MktShare 7.6% 9.7% 11.0% 11.0% 11.0% Capture 1783 2312 2681 2735 2789 Revenue $1,391,003 $2,103,777 $2,788,144 $2,843,907 $2,900,785 PPA $15.00 $17.50 $20.00 $20.00 $20.00 Grill Room – Projected Patrons Per Week for Dinner Dinner 1999 2000 2001 2002 2003 2004 2005 2006 PPW 22,715 23,851 24,566 25,058 25,559 26,070 26,591 27,123 Mkt Share 9.7% 12.2% 14.5% 14.5% 14.5% Capture 2440 3113 3778 3854 3931 Revenue $3,805,688 $5,665,119 $7,858,760 $8,015,935 $8,176,254 PPA $30.00 $35.00 $40.00 $40.00 $40.00 Gourmet Room – Projected Patrons Per Week Gourmet 1999 2000 2001 2002 2003 2004 2005 2006 PPW 12040 12642 13021 13282 13547 13818 14095 14377 Mkt Share 2.4% 5.5% 7.0% 7.0% 7.0% Capture 323 744 961 980 1000 Revenue $1,007,428 $2,515,931 $3,498,349 $3,568,316 $3,639,682 PPA $60.00 $65.00 $70.00 $70.00 $70.00 Estimated Gross Revenue 2002 2003 2004 2005 2006 Tot. Revenue $6,204,119 $10,284,827 $14,145,253 $14,428,158 $14,716,721
  • 11. PAGE 11 PROJECTED PATRONS PER WEEK (SCENARIO THREE – 7% 5% 3%) Lunai’s Very Good Competitive Index Grill Room – Projected Patrons Per Week for Lunch Lunch 1999 2000 2001 2002 2003 2004 2005 2006 PPW 21,210 22,695 23,829 24,544 25,281 26,039 26,820 27,625 MktShare 7.6% 9.7% 11.0% 11.0% 11.0% Capture 1871 2449 2868 2954 3042 Revenue $1,459,190 $2,228,540 $2,982,448 $3,071,922 $3,164,079 PPA $15.00 $17.50 $20.00 $20.00 $20.00 Grill Room – Projected Patrons Per Week for Dinner Dinner 1999 2000 2001 2002 2003 2004 2005 2006 PPW 22,715 24,305 25,520 26,286 27,074 27,887 28,723 29,585 Mkt Share 9.7% 12.2% 14.5% 14.5% 14.5% Capture 2559 3297 4042 4163 4288 Revenue $3,992,241 $6,001,084 $8,406,433 $8,658,626 $8,918,384 PPA $30.00 $35.00 $40.00 $40.00 $40.00 Gourmet Room – Projected Patrons Per Week Gourmet 1999 2000 2001 2002 2003 2004 2005 2006 PPW 12040 12883 13527 13933 14351 14781 15225 15681 Mkt Share 2.4% 5.5% 7.0% 7.0% 7.0% Capture 339 789 1028 1059 1091 Revenue $1,056,811 $2,665,136 $3,742,147 $3,854,412 $3,970,044 PPA $60.00 $65.00 $70.00 $70.00 $70.00 Estimated Gross Revenue 2002 2003 2004 2005 2006 Tot. Revenue $6,508,242 $10,894,760 $15,131,028 $15,584,959 $16,052,508
  • 12. PAGE 12 Lunai’s Good Competitive Index Scenario 1 = 3% 2% 1% / Scenario 2 = 5% 3% 2% / Scenario 3 = 7% 5% 3% Grill Room – Overall Competitive Index for Lunch Lunch 1999 2000 2001 2002 2003 2004 2005 2006 PPW 1 21,210 21,846 22,283 22,506 22,731 22,958 23,188 23,420 Avg. Index 1 7.6 7.8 8.0 7.2 7.3 7.3 7.4 7.5 PPW 2 21,210 22,271 22,939 23,397 23,865 24,343 24,829 25,326 Avg. Index 2 7.6 8.0 8.2 7.5 7.6 7.8 7.9 8.1 PPW 3 21,210 22,695 23,829 24,544 25,281 26,039 26,820 27,625 Avg. Index 3 7.6 8.2 8.6 7.8 8.1 8.3 8.6 8.8 Lunai Index2 4.5 6 7 7 7 Tot Seats 2783 2783 2783 3133 3133 3133 3133 3133 Grill Room – Overall Competitive Index for Dinner Dinner 1999 2000 2001 2002 2003 2004 2005 2006 PPW 1 22,715 23,396 23,864 24,103 24,344 24,587 24,833 25,082 Avg. Index 1 11.9 12.2 12.5 10.6 10.7 10.9 11.0 11.1 PPW 2 22,715 23,851 24,566 25,058 25,559 26,070 26,591 27,123 Avg. Index 2 11.9 12.5 12.8 11.1 11.3 11.5 11.7 12.0 PPW 3 22,715 24,305 25,520 26,286 27,074 27,887 28,723 29,585 Avg. Index 3 11.9 12.7 13.3 11.6 12.0 12.3 12.7 13.1 Lunai Index2 6 8 10 10 10 Tot Seats 1915 1915 1915 2265 2265 2265 2265 2265 Gourmet Room – Overall Competitive Index Gourmet Rm 1999 2000 2001 2002 2003 2004 2005 2006 PPW 1 12,040 12,401 12,649 12,776 12,903 13,033 13,163 13,294 Avg. Index 1 8.7 9.0 9.1 8.6 8.7 8.8 8.9 9.0 PPW 2 12,040 12,642 13,021 13,022 13,283 13,548 13,819 14,096 Avg. Index 2 8.7 9.1 9.4 8.8 8.9 9.1 9.3 9.5 PPW 3 12,040 12,883 13,527 13,933 14,351 14,781 15,225 15,681 Avg. Index 3 8.7 9.3 9.8 9.4 9.7 10.0 10.3 10.6 Lunai Index2 2 5 7 7 7 Tot Seats 1385 1385 1385 1485 1485 1485 1485 1485
  • 13. PAGE 13 Lunai’s Good Competitive Index Grill Room Lunch – Fair Share, Market Share & Market Share as a % of Fair Share Lunch 1999 2000 2001 2002 2003 2004 2005 2006 Circo FS 6.3% 6.3% 6.3% 5.6% 5.6% 5.6% 5.6% 5.6% MS 7.9% 7.9% 7.9% 7.4% 7.2% 7.1% 7.1% 7.1% MS as %FS 126% 126% 126% 132% 129% 127% 127% 127% Cozymels FS 11.5 11.5 11.5 10.2 10.2 10.2 10.2 10.2 MS 6.6 6.6 6.6 6.1 6.0 5.9 5.9 5.9 MS as %FS 57 57 57 60 59 58 58 58 Emeril’s FS 7.2 7.2 7.2 6.4 6.4 6.4 6.4 6.4 MS 6.6 6.6 6.6 6.1 6.0 5.9 5.9 5.9 MS as %FS 92 92 92 96 94 93 93 93 Gordon FS 11.1 11.1 11.1 9.9 9.9 9.9 9.9 9.9 MS 16.5 16.5 16.5 9.9 9.9 9.9 9.9 9.9 MS as %FS 148 148 148 155 152 150 150 150 McCormick FS 8.3 8.3 8.3 7.3 7.3 7.3 7.3 7.3 MS 7.9 7.9 7.9 7.4 7.2 7.1 7.1 7.1 MS as %FS 96 96 96 100 98 97 97 97 Mon Ami FS 13.7 13.7 13.7 12.1 12.1 12.1 12.1 12.1 MS 9.9 9.9 9.9 9.2 9.0 8.9 8.9 8.9 MS as %FS 73 73 73 76 74 73 73 73 PF Changs FS 8.9 8.9 8.9 7.9 7.9 7.9 7.9 7.9 MS 16.5 16.5 16.5 15.4 15.0 14.8 14.8 14.8 MS as %FS 185 185 185 194 190 187 187 187 Pinot Bras FS 8.3 8.3 8.3 7.3 7.3 7.3 7.3 7.3 MS 3.3 3.3 3.3 3.1 3.0 3.0 3.0 3.0 MS as %FS 40 40 40 42 41 40 40 40 Spago Café FS 5.0 5.0 5.0 4.5 4.5 4.5 4.5 4.5 MS 14.9 14.9 14.9 13.8 13.5 13.3 13.3 13.3 MS as %FS 295 295 295 309 302 298 298 298 Star Canyon FS 7.5 7.5 7.5 6.7 6.7 6.7 6.7 6.7 MS 3.3 3.3 3.3 3.1 3.0 3.0 3.0 3.0 MS as %FS 44 44 44 46 45 44 44 44 Woll Grill FS 2.3 2.3 2.3 2.1 2.1 2.1 2.1 2.1 MS 1.7 1.7 1.7 1.5 1.5 1.5 1.5 1.5 MS as %FS 71 71 71 74 72 71 71 71 Z-Tejas FS 9.9 9.9 9.9 8.8 8.8 8.8 8.8 8.8 MS 5.0 5.0 5.0 4.6 4.5 4.4 4.4 4.4 MS as %FS 50 50 50 53 51 51 51 51 Lunai’s FS 11.2 11.2 11.2 11.2 11.2 MS 6.9 9.0 10.4 10.4 10.4 MS as %FS 62 81 93 93 93
  • 14. PAGE 14 Lunai’s Good Competitive Index Grill Room Dinner – Fair Share, Market Share & Market Share as a % of Fair Share Dinner 1999 2000 2001 2002 2003 2004 2005 2006 Circo FS 9.1% 9.1% 9.1% 7.7% 7.7% 7.7% 7.7% 7.7% MS 13.9% 13.9% 13.9% 12.7% 12.3% 12.0% 12.0% 12.0% MS as %FS 152% 152% 152% 164% 160% 156% 156% 156% Emeril’s FS 10.4 10.4 10.4 8.8 8.8 8.8 8.8 8.8 MS 18.5 18.5 18.5 16.9 16.5 16.0 16.0 16.0 MS as %FS 177 177 177 192 186 181 181 181 Mon Ami FS 19.8 19.8 19.8 16.8 16.8 16.8 16.8 16.8 MS 21.6 21.6 21.6 19.7 19.2 18.7 18.7 18.7 MS as %FS 109 109 109 118 114 111 111 111 Pinot Bras FS 12.0 12.0 12.0 10.2 10.2 10.2 10.2 10.2 MS 7.7 7.7 7.7 7.1 6.9 6.7 6.7 6.7 MS as %FS 64 64 64 69 68 66 66 66 Spago Café FS 7.3 7.3 7.3 6.2 6.2 6.2 6.2 6.2 MS 12.3 12.3 12.3 11.3 11.0 10.7 10.7 10.7 MS as %FS 169 169 169 183 178 173 173 173 Star Canyon FS 11.0 11.0 11.0 9.3 9.3 9.3 9.3 9.3 MS 6.2 6.2 6.2 5.6 5.5 5.3 5.3 5.3 MS as %FS 56 56 56 61 59 58 58 58 Voo Doo FS 12.5 12.5 12.5 10.6 10.6 10.6 10.6 10.6 MS 6.8 6.8 6.8 6.2 6.0 5.9 5.9 5.9 MS as %FS 54 54 54 59 57 55 55 55 Woll Grill FS 3.4 3.4 3.4 2.9 2.9 2.9 2.9 2.9 MS 3.9 3.9 3.9 3.5 3.4 3.3 3.3 3.3 MS as %FS 113 113 113 123 119 116 116 116 Z-Tejas FS 14.4 14.4 14.4 12.1 12.1 12.1 12.1 12.1 MS 9.2 9.2 9.2 8.5 8.2 8.0 8.0 8.0 MS as %FS 64 64 64 70 68 66 66 66 Lunai’s FS 15.5 15.5 15.5 15.5 15.5 MS 8.5 11.0 13.4 13.4 13.4 MS as %FS 55 71 86 86 86
  • 15. PAGE 15 Lunai’s Good Competitive Index Gourmet Room – Fair Share, Market Share & Market Share as a % of Fair Share Gourmet 1999 2000 2001 2002 2003 2004 2005 2006 Aqua FS 10.5% 10.5% 10.5% 9.8% 9.8% 9.8% 9.8% 9.8% MS 15.7% 15.7% 15.7% 15.4% 15.1% 14.8% 14.8% 14.8% MS as %FS 150% 150% 150% 158% 154% 152% 152% 152% Aureole FS 18.1 18.1 18.1 16.8 16.8 16.8 16.8 16.8 MS 23.3 23.3 23.3 22.9 22.3 22.0 22.0 22.0 MS as %FS 129 129 129 136 133 131 131 131 Eiffel FS 15.2 15.2 15.2 14.1 14.1 14.1 14.1 14.1 MS 17.4 17.4 17.4 17.2 16.7 16.5 16.5 16.5 MS as %FS 115 115 115 121 118 117 117 117 Le Cirque FS 5.1 5.1 5.1 4.7 4.7 4.7 4.7 4.7 MS 8.7 8.7 8.7 8.6 8.4 8.2 8.2 8.2 MS as %FS 173 173 173 182 178 175 175 175 Smith&Wol FS 39.7 39.7 39.7 37.0 37.0 37.0 37.0 37.0 MS 17.4 17.4 17.4 17.2 16.7 16.5 16.5 16.5 MS as %FS 44 44 44 46 45 45 45 45 Spago Dine FS 11.6 11.6 11.6 10.8 10.8 10.8 10.8 10.8 MS 17.4 17.4 17.4 17.2 16.7 16.5 16.5 16.5 MS as %FS 151 151 151 159 155 153 153 153 Lunai’s FS 6.7 6.7 6.7 6.7 6.7 MS 1.6 4.0 5.5 5.5 5.5 MS as %FS 24 59 82 82 82
  • 16. PAGE 16 PROJECTED PATRONS PER WEEK (SCENARIO ONE – 3% 2% 1%) Lunai’s Good Competitive Index Grill Room – Projected Patrons Per Week for Lunch Lunch 1999 2000 2001 2002 2003 2004 2005 2006 PPW 21,210 21,846 22,283 22,506 22,731 22,958 23,188 23,420 Mkt Share 6.9% 9.0% 10.4% 10.4% 10.4% Capture 1556 2048 2377 2401 2425 Revenue $1,213,460 $1,863,542 $2,472,446 $2,497,171 $2,522,142 PPA $15.00 $17.50 $20.00 $20.00 $20.00 Grill Room – Projected Patrons Per Week for Dinner Dinner 1999 2000 2001 2002 2003 2004 2005 2006 PPW 22,715 23,396 23,864 24,103 24,344 24,587 24,833 25,082 Mkt Share 8.5% 11.0% 13.4% 13.4% 13.4% Capture 2040 2672 3283 3316 3349 Revenue $3,182,007 $4,862,132 $6,828,036 $6,896,316 $6,965,279 PPA $30.00 $35.00 $40.00 $40.00 $40.00 Gourmet Room – Projected Patrons Per Week Gourmet 1999 2000 2001 2002 2003 2004 2005 2006 PPW 12040 12401 12649 12776 12903 13033 13163 13294 Mkt Share 1.6% 4.0% 5.5% 5.5% 5.5% Capture 209 514 716 723 730 Revenue $651,311 $1,738,985 $2,606,502 $2,632,567 $2,658,892 PPA $60.00 $65.00 $70.00 $70.00 $70.00 Estimated Gross Revenue 2002 2003 2004 2005 2006 Tot. Revenue $5,046,778 $8,464,659 $11,906,984 $12,026,053 $12,146,314
  • 17. PAGE 17 PROJECTED PATRONS PER WEEK (SCENARIO TWO – 5% 3% 2%) Lunai’s Good Competitive Index Grill Room – Projected Patrons Per Week for Lunch Lunch 1999 2000 2001 2002 2003 2004 2005 2006 PPW 21,210 22,271 22,939 23,397 23,865 24,343 24,829 25,326 Mkt Share 6.9% 9.0% 10.4% 10.4% 10.4% Capture 1617 2150 2521 2571 2623 Revenue $1,261,518 $1,956,527 $2,621,515 $2,673,946 $2,727,424 PPA $15.00 $17.50 $20.00 $20.00 $20.00 Grill Room – Projected Patrons Per Week for Dinner Dinner 1999 2000 2001 2002 2003 2004 2005 2006 PPW 22,715 23,851 24,566 25,058 25,559 26,070 26,591 27,123 Mkt Share 8.5% 11.0% 13.4% 13.4% 13.4% Capture 2121 2805 3481 3550 3621 Revenue $3,308,027 $5,104,738 $7,239,712 $7,384,506 $7,532,196 PPA $30.00 $35.00 $40.00 $40.00 $40.00 Gourmet Room – Projected Patrons Per Week Gourmet 1999 2000 2001 2002 2003 2004 2005 2006 PPW 12040 12642 13021 13282 13547 13818 14095 14377 Mkt Share 1.6% 4.0% 5.5% 5.5% 5.5% Capture 217 540 759 774 790 Revenue $677,106 $1,825,755 $2,763,653 $2,818,926 $2,875,305 PPA $60.00 $65.00 $70.00 $70.00 $70.00 Estimated Gross Revenue 2002 2003 2004 2005 2006 Tot. Revenue $5,246,651 $8,887,021 $12,624,880 $12,877,378 $13,134,926
  • 18. PAGE 18 PROJECTED PATRONS PER WEEK (SCENARIO THREE – 7% 5% 3%) Lunai’s Good Competitive Index Grill Room – Projected Patrons Per Week for Lunch Lunch 1999 2000 2001 2002 2003 2004 2005 2006 PPW 21,210 22,695 23,829 24,544 25,281 26,039 26,820 27,625 MktShare 6.9% 9.0% 10.4% 10.4% 10.4% Capture 1697 2278 2696 2777 2861 Revenue $1,323,357 $2,072,558 $2,804,207 $2,888,333 $2,974,983 PPA $15.00 $17.50 $20.00 $20.00 $20.00 Grill Room – Projected Patrons Per Week for Dinner Dinner 1999 2000 2001 2002 2003 2004 2005 2006 PPW 22,715 24,305 25,520 26,286 27,074 27,887 28,723 29,585 Mkt Share 8.5% 11.0% 13.4% 13.4% 13.4% Capture 2224 2971 3723 3835 3950 Revenue $3,470,185 $5,407,470 $7,744,244 $7,976,571 $8,215,868 PPA $30.00 $35.00 $40.00 $40.00 $40.00 Gourmet Room – Projected Patrons Per Week Gourmet 1999 2000 2001 2002 2003 2004 2005 2006 PPW 12040 12883 13527 13933 14351 14781 15225 15681 Mkt Share 1.6% 4.0% 5.5% 5.5% 5.5% Capture 228 572 812 837 862 Revenue $710,297 $1,934,030 $2,956,251 $3,044,938 $3,136,286 PPA $60.00 $65.00 $70.00 $70.00 $70.00 Estimated Gross Revenue 2002 2003 2004 2005 2006 Tot. Revenue $5,503,839 $9,414,057 $13,504,701 $13,909,842 $14,327,138
  • 19. PAGE 19 OK Competitive Index Scenario 1 = 3% 2% 1% / Scenario 2 = 5% 3% 2% / Scenario 3 = 7% 5% 3% Grill Room – Overall Competitive Index for Lunch Lunch 1999 2000 2001 2002 2003 2004 2005 2006 PPW 1 21,210 21,846 22,283 22,506 22,731 22,958 23,188 23,420 Avg. Index 1 7.6 7.8 8.0 7.2 7.3 7.3 7.4 7.5 PPW 2 21,210 22,271 22,939 23,397 23,865 24,343 24,829 25,326 Avg. Index 2 7.6 8.0 8.2 7.5 7.6 7.8 7.9 8.1 PPW 3 21,210 22,695 23,829 24,544 25,281 26,039 26,820 27,625 Avg. Index 3 7.6 8.2 8.6 7.8 8.1 8.3 8.6 8.8 Lunai Index1 4 5.5 6.5 6.5 6.5 Tot Seats 2783 2783 2783 3133 3133 3133 3133 3133 Grill Room – Overall Competitive Index for Dinner Dinner 1999 2000 2001 2002 2003 2004 2005 2006 PPW 1 22,715 23,396 23,864 24,103 24,344 24,587 24,833 25,082 Avg. Index 1 11.9 12.2 12.5 10.6 10.7 10.9 11.0 11.1 PPW 2 22,715 23,851 24,566 25,058 25,559 26,070 26,591 27,123 Avg. Index 2 11.9 12.5 12.8 11.1 11.3 11.5 11.7 12.0 PPW 3 22,715 24,305 25,520 26,286 27,074 27,887 28,723 29,585 Avg. Index 3 11.9 12.7 13.3 11.6 12.0 12.3 12.7 13.1 Lunai Index1 5.5 6.5 7.5 7.5 7.5 Tot Seats 1915 1915 1915 2265 2265 2265 2265 2265 Gourmet Room – Overall Competitive Index Gourmet Rm 1999 2000 2001 2002 2003 2004 2005 2006 PPW 1 12,040 12,401 12,649 12,776 12,903 13,033 13,163 13,294 Avg. Index 1 8.7 9.0 9.1 8.6 8.7 8.8 8.9 9.0 PPW 2 12,040 12,642 13,021 13,022 13,283 13,548 13,819 14,096 Avg. Index 2 8.7 9.1 9.4 8.8 8.9 9.1 9.3 9.5 PPW 3 12,040 12,883 13,527 13,933 14,351 14,781 15,225 15,681 Avg. Index 3 8.7 9.3 9.8 9.4 9.7 10.0 10.3 10.6 Lunai Index1 1.5 4 6 6 6 Tot Seats 1385 1385 1385 1485 1485 1485 1485 1485
  • 20. PAGE 20 Lunai’s OK Competitive Index Grill Room Lunch – Fair Share, Market Share & Market Share as a % of Fair Share Lunch 1999 2000 2001 2002 2003 2004 2005 2006 Circo FS 6.3% 6.3% 6.3% 5.6% 5.6% 5.6% 5.6% 5.6% MS 7.9% 7.9% 7.9% 7.4% 7.3% 7.2% 7.2% 7.2% MS as %FS 126% 126% 126% 133% 130% 128% 128% 128% Cozymels FS 11.5 11.5 11.5 10.2 10.2 10.2 10.2 10.2 MS 6.6 6.6 6.6 6.2 6.1 6.0 6.0 6.0 MS as %FS 57 57 57 61 59 58 58 58 Emeril’s FS 7.2 7.2 7.2 6.4 6.4 6.4 6.4 6.4 MS 6.6 6.6 6.6 6.2 6.1 6.0 6.0 6.0 MS as %FS 92 92 92 97 95 93 93 93 Gordon FS 11.1 11.1 11.1 9.9 9.9 9.9 9.9 9.9 MS 16.5 16.5 16.5 9.9 9.9 9.9 9.9 9.9 MS as %FS 148 148 148 156 153 151 151 151 McCormick FS 8.3 8.3 8.3 7.3 7.3 7.3 7.3 7.3 MS 7.9 7.9 7.9 7.4 7.3 7.2 7.2 7.2 MS as %FS 96 96 96 101 99 97 97 97 Mon Ami FS 13.7 13.7 13.7 12.1 12.1 12.1 12.1 12.1 MS 9.9 9.9 9.9 9.3 9.1 8.9 8.9 8.9 MS as %FS 73 73 73 77 75 74 74 74 PF Changs FS 8.9 8.9 8.9 7.9 7.9 7.9 7.9 7.9 MS 16.5 16.5 16.5 15.5 15.1 14.9 14.9 14.9 MS as %FS 185 185 185 196 191 188 188 188 Pinot Bras FS 8.3 8.3 8.3 7.3 7.3 7.3 7.3 7.3 MS 3.3 3.3 3.3 3.1 3.0 3.0 3.0 3.0 MS as %FS 40 40 40 42 41 41 41 41 Spago Café FS 5.0 5.0 5.0 4.5 4.5 4.5 4.5 4.5 MS 14.9 14.9 14.9 13.9 13.6 13.4 13.4 13.4 MS as %FS 295 295 295 312 305 300 300 300 Star Canyon FS 7.5 7.5 7.5 6.7 6.7 6.7 6.7 6.7 MS 3.3 3.3 3.3 3.1 3.0 3.0 3.0 3.0 MS as %FS 44 44 44 46 45 44 44 44 Woll Grill FS 2.3 2.3 2.3 2.1 2.1 2.1 2.1 2.1 MS 1.7 1.7 1.7 1.5 1.5 1.5 1.5 1.5 MS as %FS 71 71 71 75 73 72 72 72 Z-Tejas FS 9.9 9.9 9.9 8.8 8.8 8.8 8.8 8.8 MS 5.0 5.0 5.0 4.6 4.5 4.5 4.5 4.5 MS as %FS 50 50 50 53 52 51 51 51 Lunai’s FS 11.2 11.2 11.2 11.2 11.2 MS 6.2 8.3 9.7 9.7 9.7 MS as %FS 55 74 87 87 87
  • 21. PAGE 21 Lunai’s OK Competitive Index Grill Room Dinner – Fair Share, Market Share & Market Share as a % of Fair Share Dinner 1999 2000 2001 2002 2003 2004 2005 2006 Circo FS 9.1% 9.1% 9.1% 7.7% 7.7% 7.7% 7.7% 7.7% MS 13.9% 13.9% 13.9% 12.8% 12.6% 12.4% 12.4% 12.4% MS as %FS 152% 152% 152% 165% 163% 161% 161% 161% Emeril’s FS 10.4 10.4 10.4 8.8 8.8 8.8 8.8 8.8 MS 18.5 18.5 18.5 17.0 16.8 16.6 16.6 16.6 MS as %FS 177 177 177 193 190 188 188 188 Mon Ami FS 19.8 19.8 19.8 16.8 16.8 16.8 16.8 16.8 MS 21.6 21.6 21.6 19.9 19.6 19.3 19.3 19.3 MS as %FS 109 109 109 119 117 115 115 115 Pinot Bras FS 12.0 12.0 12.0 10.2 10.2 10.2 10.2 10.2 MS 7.7 7.7 7.7 7.1 7.0 6.9 6.9 6.9 MS as %FS 64 64 64 70 69 68 68 68 Spago Café FS 7.3 7.3 7.3 6.2 6.2 6.2 6.2 6.2 MS 12.3 12.3 12.3 11.4 11.2 11.0 11.0 11.0 MS as %FS 169 169 169 184 181 179 179 179 Star Canyon FS 11.0 11.0 11.0 9.3 9.3 9.3 9.3 9.3 MS 6.2 6.2 6.2 5.7 5.6 5.5 5.5 5.5 MS as %FS 56 56 56 61 60 60 60 60 Voo Doo FS 12.5 12.5 12.5 10.6 10.6 10.6 10.6 10.6 MS 6.8 6.8 6.8 6.3 6.2 6.1 6.1 6.1 MS as %FS 54 54 54 59 58 57 57 57 Woll Grill FS 3.4 3.4 3.4 2.9 2.9 2.9 2.9 2.9 MS 3.9 3.9 3.9 3.6 3.5 3.5 3.5 3.5 MS as %FS 113 113 113 124 122 120 120 120 Z-Tejas FS 14.4 14.4 14.4 12.1 12.1 12.1 12.1 12.1 MS 9.2 9.2 9.2 8.5 8.4 8.3 8.3 8.3 MS as %FS 64 64 64 70 69 68 68 68 Lunai’s FS 15.5 15.5 15.5 15.5 15.5 MS 7.8 9.1 10.4 10.4 10.4 MS as %FS 51 59 67 67 67
  • 22. PAGE 22 Lunai’s OK Competitive Index Gourmet Room – Fair Share, Market Share & Market Share as a % of Fair Share Gourmet 1999 2000 2001 2002 2003 2004 2005 2006 Aqua FS 10.5% 10.5% 10.5% 9.8% 9.8% 9.8% 9.8% 9.8% MS 15.7% 15.7% 15.7% 15.5% 15.2% 15.0% 15.0% 15.0% MS as %FS 150% 150% 150% 159% 156% 153% 153% 153% Aureole FS 18.1 18.1 18.1 16.8 16.8 16.8 16.8 16.8 MS 23.3 23.3 23.3 23.0 22.5 22.2 22.2 22.2 MS as %FS 129 129 129 136 134 132 132 132 Eiffel FS 15.2 15.2 15.2 14.1 14.1 14.1 14.1 14.1 MS 17.4 17.4 17.4 17.2 16.9 16.6 16.6 16.6 MS as %FS 115 115 115 122 119 117 117 117 Le Cirque FS 5.1 5.1 5.1 4.7 4.7 4.7 4.7 4.7 MS 8.7 8.7 8.7 8.6 8.4 8.3 8.3 8.3 MS as %FS 173 173 173 183 179 176 176 176 Smith&Wol FS 39.7 39.7 39.7 37.0 37.0 37.0 37.0 37.0 MS 17.4 17.4 17.4 17.2 16.9 16.6 16.6 16.6 MS as %FS 44 44 44 47 46 45 45 45 Spago Dine FS 11.6 11.6 11.6 10.8 10.8 10.8 10.8 10.8 MS 17.4 17.4 17.4 17.2 16.9 16.6 16.6 16.6 MS as %FS 151 151 151 160 157 154 154 154 Lunai’s FS 6.7 6.7 6.7 6.7 6.7 MS 1.2 3.2 4.7 4.7 4.7 MS as %FS 18 48 70 70 70
  • 23. PAGE 23 PROJECTED PATRONS PER WEEK (SCENARIO ONE – 3% 2% 1%) Lunai’s OK Competitive Index Grill Room – Projected Patrons Per Week for Lunch Lunch 1999 2000 2001 2002 2003 2004 2005 2006 PPW 21,210 21,846 22,283 22,506 22,731 22,958 23,188 23,420 MktShare 6.2% 8.3% 9.7% 9.7% 9.7% Capture 1394 1891 2224 2246 2269 Revenue $1,086,980 $1,721,169 $2,312,951 $2,336,080 $2,359,441 PPA $15.00 $17.50 $20.00 $20.00 $20.00 Grill Room – Projected Patrons Per Week for Dinner Dinner 1999 2000 2001 2002 2003 2004 2005 2006 PPW 22,715 23,396 23,864 24,103 24,344 24,587 24,833 25,082 Mkt Share 7.8% 9.1% 10.4% 10.4% 10.4% Capture 1883 2216 2547 2573 2598 Revenue $2,937,556 $4,033,475 $5,297,858 $5,350,836 $5,404,345 PPA $30.00 $35.00 $40.00 $40.00 $40.00 Gourmet Room – Projected Patrons Per Week Gourmet 1999 2000 2001 2002 2003 2004 2005 2006 PPW 12040 12401 12649 12776 12903 13033 13163 13294 Mkt Share 1.2% 3.2% 4.7% 4.7% 4.7% Capture 157 415 619 625 631 Revenue $490,487 $1,402,371 $2,251,819 $2,274,338 $2,297,081 PPA $60.00 $65.00 $70.00 $70.00 $70.00 Estimated Gross Revenue 2002 2003 2004 2005 2006 Tot. Revenue $4,515,023 $7,157,015 $9,862,628 $9,961,254 $10,060,867
  • 24. PAGE 24 PROJECTED PATRONS PER WEEK (SCENARIO TWO – 5% 3% 2%) Lunai’s OK Competitive Index Grill Room – Projected Patrons Per Week for Lunch Lunch 1999 2000 2001 2002 2003 2004 2005 2006 PPW 21,210 22,271 22,939 23,397 23,865 24,343 24,829 25,326 Mkt Share 6.2% 8.3% 9.7% 9.7% 9.7% Capture 1449 1986 2358 2405 2453 Revenue $1,130,029 $1,807,050 $2,452,403 $2,501,451 $2,551,480 PPA $15.00 $17.50 $20.00 $20.00 $20.00 Grill Room – Projected Patrons Per Week for Dinner Dinner 1999 2000 2001 2002 2003 2004 2005 2006 PPW 22,715 23,851 24,566 25,058 25,559 26,070 26,591 27,123 Mkt Share 7.8% 9.1% 10.4% 10.4% 10.4% Capture 1958 2327 2701 2755 2810 Revenue $3,053,895 $4,234,734 $5,617,277 $5,729,622 $5,844,215 PPA $30.00 $35.00 $40.00 $40.00 $40.00 Gourmet Room – Projected Patrons Per Week Gourmet 1999 2000 2001 2002 2003 2004 2005 2006 PPW 12040 12642 13021 13282 13547 13818 14095 14377 Mkt Share 1.2% 3.2% 4.7% 4.7% 4.7% Capture 163 436 656 669 682 Revenue $509,912 $1,472,345 $2,387,586 $2,435,338 $2,484,045 PPA $60.00 $65.00 $70.00 $70.00 $70.00 Estimated Gross Revenue 2002 2003 2004 2005 2006 Tot. Revenue $4,693,835 $7,514,129 $10,457,266 $10,666,412 $10,879,740
  • 25. PAGE 25 PROJECTED PATRONS PER WEEK (SCENARIO THREE 7% 5% 3%) Lunai’s OK Competitive Index Grill Room – Projected Patrons Per Week for Lunch Lunch 1999 2000 2001 2002 2003 2004 2005 2006 PPW 21,210 22,695 23,829 24,544 25,281 26,039 26,820 27,625 MktShare 6.2% 8.3% 9.7% 9.7% 9.7% Capture 1520 2104 2522 2598 2676 Revenue $1,185,422 $1,914,215 $2,623,310 $2,702,009 $2,783,069 PPA $15.00 $17.50 $20.00 $20.00 $20.00 Grill Room – Projected Patrons Per Week for Dinner Dinner 1999 2000 2001 2002 2003 2004 2005 2006 PPW 22,715 24,305 25,520 26,286 27,074 27,887 28,723 29,585 Mkt Share 7.8% 9.1% 10.4% 10.4% 10.4% Capture 2054 2465 2889 2975 3065 Revenue $3,203,595 $4,485,871 $6,008,742 $6,189,004 $6,374,674 PPA $30.00 $35.00 $40.00 $40.00 $40.00 Gourmet Room – Projected Patrons Per Week Gourmet 1999 2000 2001 2002 2003 2004 2005 2006 PPW 12040 12883 13527 13933 14351 14781 15225 15681 Mkt Share 1.2% 3.2% 4.7% 4.7% 4.7% Capture 171 461 702 723 744 Revenue $534,908 $1,559,661 $2,553,976 $2,630,595 $2,709,513 PPA $60.00 $65.00 $70.00 $70.00 $70.00 Estimated Gross Revenue 2002 2003 2004 2005 2006 Tot. Revenue $4,923,925 $7,959,748 $11,186,027 $11,521,608 $11,867,256
  • 26. PAGE 26 STATEMENT OF INCOME & EXPENSES The following nine statements of income and expenses are based upon the three different competitive index scenarios and the three different market growth rate scenarios. These scenarios are then applied to the projected check average for each meal period giving the Lunai’s Grill Room and the Lunai’s Gourmet Room a total projected revenue for five years of operation. The projected revenue is then applied to the statement of income and expenses with national averages being used to calculate most of the expenses. A Description of Expense Items Food Sales. Food sales include sales of all food items. This account is projected by multiplying the estimated number of patrons per week (PPW) by the anticipated average check times 52 weeks. Beverage Sales. Beverage sales vary among restaurants, depending on the type of operation. They will generally be a relatively constant percentage of food sales. Food Cost. Food cost is reported as a percentage of food sales. This number is used to judge restaurant efficiency. Beverage Cost. Beverage cost includes all liquors, wines, beers, and waters served in both the bar and restaurant areas. Like the food cost percentage, beverage cost can be affected by pricing, portion sizes, and the type of restaurant operation. Other Income. These are the items associated with merchandise sales, cover charges, rental of shops, display areas, and cash discounts.
  • 27. PAGE 27 Payroll. Under the Uniform System of Accounts for Restaurants, the entire restaurant payroll is in one category. Regular salaries and wages, extra wages, overtime pay, vacation pay, commisions, and bonus payments are included. Employee Benefits. Social Security Tax (FICA), state and federal unemployment taxes, workmen’s compensation insurance premiums, health and life insurance premiums, pension plan payments, complimentary employee meals or discounts, employee training, and staff parties. Direct Operating Expenses. These are the costs of services rendered to the customer. Uniforms, Laundry, linen, linen rental, china, glassware, silverware, kitchen utensils, cleaning supplies, paper supplies, guest supplies, menus, dry cleaning, contract cleaning, flowers, decorations, auto & truck expenses, and licenses and permits. Music & Entertainment. The expenses for musicians, entertainers, taped music, meals served to musicians and entertainers. Advertising & Promotion. Costs incurred for promoting, creating and maintaining sales in the restaurant. Newspaper, magazines, flyers, brochures, postcards, direct mail, postage and telephone, and agency fees. Utilities. Utility costs are generally fixed, but can be conserved through technology. Administrative & General. These costs are associated with the daily operation of the business, but not directly related to providing food service or comfort. Most of these expenses are fixed. Credit card fees, city and sales tax are moderately variable however.
  • 28. PAGE 28 Repairs & Maintenance. The expenses in this category tend to be fixed but an increased number of patrons will affect the wear of items slightly and repairs will be needed in certain areas. Lease. This is the amount negotiated for a long-term rental of the property. This can be a fixed expense or a fixed and variable expense depending upon the contract negotiated. Property Taxes & Insurance. Real and personal property taxes are based on the assessed value established by the municipality and the tax rate. The cost of insuring the building and its contents against damage. Loan Payment. This is a payment on the amount borrowed for remodeling and the amount required to buy the building. Again, this amount is dependent upon the source and the negotiated contract. These are the items included in the statement of income and expenses. Now let’s take a look at the national operating averages for the restaurants with check averages of $15 or more and discuss the differences in Lunai’s percentages verses the national averages.
  • 29. PAGE 29 NATIONAL OPERATING AVERAGES From the 1999 Restaurant Industry Operations Report by The National Restaurant Association and Deloitte & Touche LLP The national averages are for restaurants with check averages of $15 or more. As shown through the highlighted years of 2002 to 2004, there are some major differences in Lunai’s operating percentages and the national average. 2002 2003 2004 Lower Quartile Median Upper Quartile SALES Food………………………….………. 70% 65% 65% 70% 77.2% 83.5% Beverage…………………………….. 30 35 35 17 23.5 30.2 Total Sales……………………… 100 100 100 100 100 100 COST OF SALES Food………………………….………. 40 35 35 31.2 35.3 40.0 Beverage…………………………….. 35 30 30 25.4 30.5 36.3 Total cost of sales……………… 39 34 34 31.2 34.2 38.4 GROSS PROFIT……………………..………... 61 66 66 61.6 65.8 68.8 OTHER INCOME………………………………. 5 5 5 (0.7) 0.0 0.3 Total Income………………………… 65 71 71 60.9 65.8 69.2 CONTROLLABLE EXPENSES Payroll…………………………………….. 25 20 17 22.4 27.9 33.6 Employee Benefits……………….………. 5 7 9 1.4 4.4 6.2 Direct Operating Expenses……………… 5 5 5 4.1 5.5 8.3 Music & Entertainment………….……… 5 3 3 0.0 0.2 1.3 Advertising & Promotion……….……… 5 4 3 1.3 3.0 4.4 Utilities……………………………………. 4 3 3 1.8 2.5 3.4 Administrative & General………………. 3 2 2 1.9 4.1 6.8 Repairs & Maintenance…………………. 3 3 3 1.0 1.6 2.3 Total controllable expenses……….. 55 47 45 52.5 59.8 67.4 INCOME BEFORE OCCUPANCY COSTS .…..… OCCUPATION COSTS 100K 100K 100K 2.3 4.9 7.0 INCOME BEFORE INTEREST & DEPRECIATION 10% 24% 26% (1.6%) 3.8% 10.2%
  • 30. PAGE 30 ITEMS OF NOTE Beverage Sales During the first year of operations, Lunai’s will be in the upper quartile of beverage sales due to their large amount (over 100 seats) of bar space in the upstairs Parlour and the downstairs Dirty Olive. These two bars will be aggressive in their advertising and promotions. This, combined with the location, more than substantiates the upper quartile status for beverage sales. In fact, 30-35% is a conservative estimate; most restaurants don’t operate on Las Vegas Boulevard and have two large bars within. Food & Beverage Costs During the first year of operation Lunai’s will be operating in the upper quartile of food and beverage costs. This is due to the ‘settling in’ process and will most likely only take 3-6 months, not an entire year. After the first year Lunai’s will then operate the median cost level for food & beverage costs. Other Income Due to the Love Rules clothing line, the merchandise retail store, and the branding of the building, Lunai’s will receive a generous portion of ‘other income’. Payroll Lunai’s begins its payroll percentage less than the median and then drops below the lower quartile because once a restaurant is staffed to its maximum, the payroll margin does not increase. Therefore the payroll percentage decreases as sales increase. Payroll, as shown on the statements of income, starts at more than $2,000,000 and rises to over $3,000,000 by the third year of operations due to the raises required for long-term employment and a few extra employees to handle the extra amount of sales.
  • 31. PAGE 31 The other reason for this low payroll percentage is that the majority of the employees are not established and require less money than more established restaurant employees. This, in addition to the low management salaries, creates a positive for the overall restaurant. The tradeoff is the bonus program which comes from the bottom line. Benefits While Lunai’s Payroll is low, the benefits steadily increase over the years due to the predicted loyalty of the employees. Since it will take one full year for most employees to be able to receive any benefits, Lunai’s doesn’t surpass the upper quartile until the second year while attaining a huge 9% during the third year. This is part of the Lunai’s philosophy and will be part of what makes Lunai’s the greatest restaurant in Las Vegas. Music & Entertainment Most restaurants are not of equal size to the proposed Lunai’s entertainment and restaurant complex. Nor are they located on Las Vegas Boulevard. The street entertainment on Friday nights, all day & night Saturday, and all day Sunday will require some financial outlay as well as the Wednesday through Sunday entertainment in the Parlour and on the stage in the Grill Room. All of this plus a few sporadic headliners will give Lunai’s some great publicity and keep the customers coming in. Advertising & Promotion The Advertising & Promotion strategies that were discussed in the Marketing & Sales Strategies section of this business plan will require a constant amount of capital to maintain. Lunai’s starts off strong with its percentage, but remains constant in the amount of dollars spent. This is shown in the consistent drop in percentage over the three years.
  • 32. PAGE 32 Utilities Theoretically it costs the same to run a restaurant no matter how much business is being done. Utilities cost will then remain a constant dollar amount and consistently drop in percentage. Administrative & General Lunai’s is a self-contained organization paying out no management fees. As things become more streamlined, Lunai’s will pay a smaller percentage and be in the lower quartile. Repairs & Maintenance Lunai’s will be perfectionist in their approach to repairing and maintaining the restaurant. Carpets will be replaced after 6-9 months of wear, and all things will be kept up so the appearance never degenerates from its original beauty. A portion of this money will be held in reserve for remodeling purposes. Occupation Costs The amount projected is from the current operators of the Harley Davidson Café.
  • 33. PAGE 33 VERY GOOD & ‘SCENARIO 3’ – STATEMENT OF INCOME & EXPENSES 02 2002 03 2003 04 2004 SALES Food………………………….………. 70% $6,508,242 65% $10,894,760 65% $15,131,028 Beverage…………………………….. 30 1,952,473 35 3,813,166 35 5,295,860 Total Sales……………………… 100 8,460,715 100 14,707,926 100 20,426,888 COST OF SALES Food………………………….………. 40 2,603,296 35 3,813,165 35 5,295,859 Beverage…………………………….. 35 683,365 30 1,143,949 30 1,588,757 Total cost of sales……………… 39 3,286,662 34 4,957,116 34 6,884,618 GROSS PROFIT……………...………………... 61 5,174,053 66 9,750,810 66 13,542,270 OTHER INCOME………………………………. 5 423,036 5 735,396 5 1,021,344 Total Income………………………… 65 5,597,088 71 10,486,206 71 14,563,614 CONTROLLABLE EXPENSES Payroll…………………………………….. 25 2,115,179 20 2,941,585 17 3,472,571 Employee Benefits……………….………. 5 423,036 7 1,029,555 9 1,838,420 Direct Operating Expenses……………… 5 423,036 5 735,396 5 1,021,344 Music & Entertainment………….……… 5 423,036 3 441,238 3 612,807 Advertising & Promotion……….……… 5 423,036 4 588,317 3 612,807 Utilities……………………………………. 4 338,429 3 441,238 3 612,807 Administrative & General………………. 3 253,821 2 294,159 2 408,538 Repairs & Maintenance…………………. 3 253,821 3 441,238 3 612,807 Total controllable expenses……….. 55 4,653,393 47 6,912,725 45 9,192,099 INCOME BEFORE OCCUPANCY COSTS .…...… $943,695 $3,573,481 $5,371,515 OCCUPATION COSTS Property Taxes & Insurance…….……… 100,000 100,000 100,000 INCOME BEFORE INTEREST & DEPRECIATION 10% $843,695 24% $3,473,481 26% $5,271,515
  • 34. PAGE 34 VERY GOOD & ‘SCENARIO 2’ – STATEMENT OF INCOME & EXPENSES 02 2002 03 2003 04 2004 SALES Food………………………….………. 70% $6,204,119 65% $10,284,827 65% $14,145,253 Beverage…………………………….. 30 1,861,236 35 3,599,690 35 4,950,839 Total Sales……………………… 100 8,065,355 100 13,884,517 100 19,096,092 COST OF SALES Food………………………….………. 40 2,481,648 35 3,599,690 35 4,950,839 Beverage…………………………….. 35 651,432 30 1,079,907 30 1,485,252 Total cost of sales……………… 39 3,133,080 34 4,679,596 34 6,436,090 GROSS PROFIT……………………...………... 61 4,932,275 66 9,204,920 66 12,660,001 OTHER INCOME………………………………. 5 403,268 5 694,226 5 954,805 Total Income………………………… 65 5,335,542 71 9,899,146 71 13,614,806 CONTROLLABLE EXPENSES Payroll…………………………………….. 25 2,016,339 20 2,776,903 17 3,246,336 Employee Benefits……………….………. 5 403,268 7 971,916 9 1,718,648 Direct Operating Expenses……………… 5 403,268 5 694,226 5 954,805 Music & Entertainment………….……… 5 403,268 3 416,536 3 572,883 Advertising & Promotion……….……… 5 403,268 4 555,381 3 572,883 Utilities……………………………………. 4 322,614 3 416,536 3 572,883 Administrative & General………………. 3 241,961 2 277,690 2 381,922 Repairs & Maintenance…………………. 3 241,961 3 416,536 3 572,883 Total controllable expenses……….. 55 4,435,945 47 6,525,723 45 8,593,241 INCOME BEFORE OCCUPANCY COSTS ……… $899,597 $3,373,423 $5,021,565 OCCUPATION COSTS Property Taxes & Insurance…….……… 100,000 100,000 100,000 INCOME BEFORE INTEREST & DEPRECIATION 10% $799,597 24% $3,273,423 26% $4,921,565
  • 35. PAGE 35 VERY GOOD & ‘SCENARIO 1’ – STATEMENT OF INCOME & EXPENSES 02 2002 03 2003 04 2004 SALES Food………………………….………. 70% $5,967,772 65% $9,796,034 65% $13,340,902 Beverage…………………………….. 30 1,790,331 35 3,428,612 35 4,669,316 Total Sales……………………… 100 7,758,103 100 13,224,646 100 18,010,218 COST OF SALES Food………………………….………. 40 2,387,109 35 3,428,612 35 4,669,316 Beverage…………………………….. 35 626,616 30 1,028,584 30 1,400,795 Total cost of sales……………… 39 3,013,725 34 4,457,195 34 6,070,110 GROSS PROFIT…………………………...…... 61 4,744,378 66 8,767,450 66 11,940,107 OTHER INCOME………………………………. 5 387,905 5 661,232 5 900,511 Total Income………………………… 65 5,132,284 71 9,428,683 71 12,840,618 CONTROLLABLE EXPENSES Payroll…………………………………….. 25 1,939,526 20 2,644,929 17 3,061,737 Employee Benefits……………….………. 5 387,905 7 925,725 9 1,620,920 Direct Operating Expenses……………… 5 387,905 5 661,232 5 900,511 Music & Entertainment………….……… 5 387,905 3 396,739 3 540,307 Advertising & Promotion……….……… 5 387,905 4 528,986 3 540,307 Utilities……………………………………. 4 310,324 3 396,739 3 540,307 Administrative & General………………. 3 232,743 2 264,493 2 360,204 Repairs & Maintenance…………………. 3 232,743 3 396,739 3 540,307 Total controllable expenses……….. 55 4,266,957 47 6,215,584 45 8,104,598 INCOME BEFORE OCCUPANCY COSTS ……… $865,327 $3,213,099 $4,736,020 OCCUPATION COSTS Property Taxes & Insurance…….……… 100,000 100,000 100,000 INCOME BEFORE INTEREST & DEPRECIATION 10% $765,327 24% $3,113,099 26% $4,636,020
  • 36. PAGE 36 GOOD & ‘SCENARIO 3’ – STATEMENT OF INCOME & EXPENSES 02 2002 03 2003 04 2004 SALES Food………………………….………. 70% $5,503,839 65% 9,414,057 65% $13,504,701 Beverage…………………………….. 30 1,651,152 35 3,294,920 35 4,726,645 Total Sales……………………… 100 7,154,991 100 12,708,978 100 18,231,347 COST OF SALES Food………………………….………. 40 2,201,536 35 3,294,920 35 4,726,645 Beverage…………………………….. 35 577,903 30 988,476 30 1,417,994 Total cost of sales……………… 39 2,779,439 34 4,283,396 34 6,144,639 GROSS PROFIT…………………...…………... 61 4,375,552 66 8,425,581 66 12,086,708 OTHER INCOME………………………………. 5 357,750 5 635,449 5 911,567 Total Income………………………… 65 4,733,302 71 9,061,030 71 12,998,275 CONTROLLABLE EXPENSES Payroll…………………………………….. 25 1,788,748 20 2,541,796 17 3,099,329 Employee Benefits……………….………. 5 357,750 7 889,628 9 1,640,821 Direct Operating Expenses……………… 5 357,750 5 635,449 5 911,567 Music & Entertainment………….……… 5 357,750 3 381,269 3 546,940 Advertising & Promotion……….……… 5 357,750 4 508,359 3 546,940 Utilities……………………………………. 4 286,200 3 381,269 3 546,940 Administrative & General………………. 3 214,650 2 254,180 2 364,627 Repairs & Maintenance…………………. 3 214,650 3 381,269 3 546,940 Total controllable expenses……….. 55 3,935,245 47 5,973,219 45 8,204,106 INCOME BEFORE OCCUPANCY COSTS .…..… 798,057 3,087,811 4,794,169 OCCUPATION COSTS Property Taxes & Insurance…….……… 100,000 100,000 100,000 INCOME BEFORE INTEREST & DEPRECIATION 10% $698,057 24% $2,987,811 26% $4,694,169
  • 37. PAGE 37 GOOD & ‘SCENARIO 2’ – STATEMENT OF INCOME & EXPENSES 02 2002 03 2003 04 2004 SALES Food………………………….………. 70% $5,246,651 65% $8,887,021 65% $12,624,880 Beverage…………………………….. 30 1,573,995 35 3,110,457 35 4,418,708 Total Sales……………………… 100 6,820,646 100 11,997,478 100 17,043,589 COST OF SALES Food………………………….………. 40 2,098,660 35 3,110,457 35 4,418,708 Beverage…………………………….. 35 550,898 30 933,137 30 1,325,612 Total cost of sales……………… 39 2,649,559 34 4,043,594 34 5,744,321 GROSS PROFIT…………………..…………... 61 4,171,087 66 7,953,883 66 11,299,268 OTHER INCOME………………………………. 5 341,032 5 599,874 5 852,179 Total Income………………………… 65 4,512,120 71 8,553,757 71 12,151,447 CONTROLLABLE EXPENSES Payroll…………………………………….. 25 1,705,161 20 2,399,496 17 2,897,410 Employee Benefits……………….………. 5 341,032 7 839,823 9 1,533,923 Direct Operating Expenses……………… 5 341,032 5 599,874 5 852,179 Music & Entertainment………….……… 5 341,032 3 359,924 3 511,308 Advertising & Promotion……….……… 5 341,032 4 479,899 3 511,308 Utilities……………………………………. 4 272,826 3 359,924 3 511,308 Administrative & General………………. 3 204,619 2 239,950 2 340,872 Repairs & Maintenance…………………. 3 204,619 3 359,924 3 511,308 Total controllable expenses……….. 55 3,751,355 47 5,638,815 45 7,669,615 INCOME BEFORE OCCUPANCY COSTS .…..… $760,764 $2,914,943 $4,481,833 OCCUPATION COSTS Property Taxes & Insurance…….……… 100,000 100,000 100,000 INCOME BEFORE INTEREST & DEPRECIATION 10% $660,764 23% $2,814,943 26% $4,381,833
  • 38. PAGE 38 GOOD & ‘SCENARIO 1’ – STATEMENT OF INCOME & EXPENSES 02 2002 03 2003 04 2004 SALES Food………………………….………. 70% $5,046,778 65% $8,464,659 65% $11,906,984 Beverage…………………………….. 30 1,514,033 35 2,962,631 35 4,167,444 Total Sales……………………… 100 6,560,812 100 11,427,289 100 16,074,428 COST OF SALES Food………………………….………. 40 2,018,711 35 2,962,631 35 4,167,444 Beverage…………………………….. 35 529,912 30 888,789 30 1,250,233 Total cost of sales……………… 39 2,548,623 34 3,851,420 34 5,417,678 GROSS PROFIT………………..……………... 61 4,012,189 66 7,575,870 66 10,656,750 OTHER INCOME………………………………. 5 328,041 5 571,364 5 803,721 Total Income………………………… 65 4,340,229 71 8,147,234 71 11,460,472 CONTROLLABLE EXPENSES Payroll…………………………………….. 25 1,640,203 20 2,285,458 17 2,732,653 Employee Benefits……………….………. 5 328,041 7 799,910 9 1,446,698 Direct Operating Expenses……………… 5 328,041 5 571,364 5 803,721 Music & Entertainment………….……… 5 328,041 3 342,819 3 482,233 Advertising & Promotion……….……… 5 328,041 4 457,092 3 482,233 Utilities……………………………………. 4 262,432 3 342,819 3 482,233 Administrative & General………………. 3 196,824 2 228,546 2 321,489 Repairs & Maintenance…………………. 3 196,824 3 342,819 3 482,233 Total controllable expenses……….. 55 3,608,446 47 5,370,826 45 7,233,492 INCOME BEFORE OCCUPANCY COSTS .…..… $731,783 $2,776,408 $4,226,979 OCCUPATION COSTS Property Taxes & Insurance…….……… 100,000 100,000 100,000 INCOME BEFORE INTEREST & DEPRECIATION 10% $631,783 23% $2,676,408 26% $4,126,979
  • 39. PAGE 39 OK & ‘SCENARIO 3’ – STATEMENT OF INCOME & EXPENSES 02 2002 03 2003 04 2004 SALES Food………………………….………. 70% $4,923,925 65% $7,959,748 65% $11,186,027 Beverage…………………………….. 30 1,477,178 35 2,785,912 35 3,915,110 Total Sales……………………… 100 6,401,103 100 10,745,660 100 15,101,137 COST OF SALES Food………………………….………. 40 1,969,570 35 2,785,912 35 3,915,110 Beverage…………………………….. 35 517,012 30 835,774 30 1,174,533 Total cost of sales……………… 39 2,486,582 34 3,621,685 34 5,089,642 GROSS PROFIT……………..………………... 61 3,914,521 66 7,123,975 66 10,011,494 OTHER INCOME………………………………. 5 320,055 5 537,283 5 755,057 Total Income………………………… 65 4,234,576 71 7,661,258 71 10,766,551 CONTROLLABLE EXPENSES Payroll…………………………………….. 25 1,600,276 20 2,149,132 17 2,567,193 Employee Benefits……………….………. 5 320,055 7 752,196 9 1,359,102 Direct Operating Expenses……………… 5 320,055 5 537,283 5 755,057 Music & Entertainment………….……… 5 320,055 3 322,370 3 453,034 Advertising & Promotion……….……… 5 320,055 4 429,826 3 453,034 Utilities……………………………………. 4 256,044 3 322,370 3 453,034 Administrative & General………………. 3 192,033 2 214,913 2 302,023 Repairs & Maintenance…………………. 3 192,033 3 322,370 3 453,034 Total controllable expenses……….. 55 3,520,607 47 5,050,460 45 6,795,512 INCOME BEFORE OCCUPANCY COSTS ……… $713,969 $2,610,797 $3,971,040 OCCUPATION COSTS Property Taxes & Insurance…….……… 100,000 100,000 100,000 INCOME BEFORE INTEREST & DEPRECIATION 10% $613,969 23% $2,510,797 26% $3,871,040
  • 40. PAGE 40 OK & ‘SCENARIO 2’ – STATEMENT OF INCOME & EXPENSES 02 2002 03 2003 04 2004 SALES Food………………………….………. 70% $4,693,835 65% $7,514,129 65% $10,457,266 Beverage…………………………….. 30 1,408,151 35 2,629,945 35 3,660,043 Total Sales……………………… 100 6,101,986 100 10,144,075 100 14,117,309 COST OF SALES Food………………………….………. 40 1,877,534 35 2,629,945 35 3,660,043 Beverage…………………………….. 35 492,853 30 788,984 30 1,098,013 Total cost of sales……………… 39 2,370,387 34 3,418,929 34 4,758,056 GROSS PROFIT……………..………………... 61 3,731,599 66 6,725,146 66 9,359,253 OTHER INCOME………………………………. 5 305,099 5 507,204 5 705,865 Total Income………………………… 65 4,036,699 71 7,232,349 71 10,065,119 CONTROLLABLE EXPENSES Payroll…………………………………….. 25 1,525,497 20 2,028,815 17 2,399,943 Employee Benefits……………….………. 5 305,099 7 710,085 9 1,270,558 Direct Operating Expenses……………… 5 305,099 5 507,204 5 705,865 Music & Entertainment………….……… 5 305,099 3 304,322 3 423,519 Advertising & Promotion……….……… 5 305,099 4 405,763 3 423,519 Utilities……………………………………. 4 244,079 3 304,322 3 423,519 Administrative & General………………. 3 183,060 2 202,881 2 282,346 Repairs & Maintenance…………………. 3 183,060 3 304,322 3 423,519 Total controllable expenses……….. 55 3,356,092 47 4,767,715 45 6,352,789 INCOME BEFORE OCCUPANCY COSTS .…..… $680,606 $2,464,634 $3,712,330 OCCUPATION COSTS Property Taxes & Insurance…….……… 100,000 100,000 100,000 INCOME BEFORE INTEREST & DEPRECIATION 10% $580,606 23% $2,364,634 26% $3,612,330
  • 41. PAGE 41 OK & ‘SCENARIO 1’ – STATEMENT OF INCOME & EXPENSES 02 2002 03 2003 04 2004 SALES Food………………………….………. 70% $4,515,023 65% $7,157,015 65% $9,862,628 Beverage…………………………….. 30 1,354,507 35 2,504,955 35 3,451,920 Total Sales……………………… 100 5,869,530 100 9,661,971 100 13,314,548 COST OF SALES Food………………………….………. 40 1,806,009 5 2,504,955 35 3,451,920 Beverage…………………………….. 35 474,077 30 751,487 30 1,035,576 Total cost of sales……………… 39 2,280,086 34 3,256,442 34 4,487,496 GROSS PROFIT……………………………...... 61 3,589,443 66 6,405,529 66 8,827,052 OTHER INCOME………………………………. 5 293,476 5 483,099 5 665,727 Total Income………………………… 65 3,882,920 71 6,888,627 71 9,492,779 CONTROLLABLE EXPENSES Payroll…………………………………….. 25 1,467,382 20 1,932,394 17 2,263,473 Employee Benefits……………….………. 5 293,476 7 676,338 9 1,198,309 Direct Operating Expenses……………… 5 293,476 5 483,099 5 665,727 Music & Entertainment………….……… 5 293,476 3 289,859 3 399,436 Advertising & Promotion……….……… 5 293,476 4 386,479 3 399,436 Utilities……………………………………. 4 234,781 3 289,859 3 399,436 Administrative & General………………. 3 176,086 2 193,239 2 266,291 Repairs & Maintenance…………………. 3 176,086 3 289,859 3 399,436 Total controllable expenses……….. 55 3,228,241 47 4,541,126 45 5,991,546 INCOME BEFORE OCCUPANCY COSTS ……… $654,678 $2,347,501 $3,501,233 OCCUPATION COSTS Property Taxes & Insurance…….……… 100,000 100,000 100,000 INCOME BEFORE INTEREST & DEPRECIATION 9% $554,678 23% $2,247,501 26% $3,401,233
  • 42. PAGE 42 VALUATION These number are based on the value of the land and the value of the building and four-level parking garage. The building cost almost $10,000,000 to build in 1996 and the land, although currently being leased by Harley Davidson Café for $60,000 a month, is valued at $10 million. • Lunai’s intends on buying the land for $9.5 million. • Lunai’s intends on buying the building and parking garage for $8 million. • Lunai’s intends on spending $4.5 million on remodeling and expansion. • Lunai’s requires $3 million in capital for the first year of operation. The estimated numbers above total $25 million and make the loan to equity ratio a 70/30 split. This is proven by the required capital to buy the building totaling $17.5 million (17.5/25=70%) and the required capital to remodel and operate the restaurant totaling $7.5 million (7.5/25=30%). Avg. Hotel Mtg. Rate Avg. Corporate A Bond Rate 1999 1q 7.86 6.98 1998 4q 7.47 6.87 1998 3q 7.12 6.87 1998 2q 7.44 6.98 1998 1q 7.26 7.00 1997 4q 7.65 7.46 1997 3q 8.44 7.42 1997 2q 8.85 7.84 1997 1q 8.25 7.71 1997 4q 9.49 7.54 1996 3q 8.96 7.90 1996 2q 8.82 7.93 1996 1q 7.79 7.37 1995 4q 8.44 7.28 1995 3q 8.61 7.67 1995 2q 9.25 7.87 (Source: American Council of Life Insurance; Moody’s Bond Record)
  • 43. PAGE 43 According to Moody’s Bond Record, the Corporate A Bond Rate for October, 1999 was 7.99%. According to Hospitality Valuation Services, the average interest rate of a hotel mortgage and the concurrent yield on a Corporate A Bond have a close mathematical relationship. This is shown through the regression analysis of the historical rates equalling a multiple-r of 83.01%. The purpose of doing a regression analysis on the average rates is to create an equation that predicts what the hotel mortgage rate will be by mathematically forecasting the historical data. Once the equation is configured, the current Corporate A Bond Rate is plugged into the x variable. The equation is nothing but the equation for the slope of a line: Y = a + bx So, in essence, this equation predicts what point on the line is most probable based upon the historical data used. The equation from the historical average rates above is: Y = -3.578367 + 1.591995 (x) By plugging in the current Corporate A Bond Rate of 7.99, the prediction is made for the most probable point on the line. Y = -3.578367 + 1.591995 (7.99) Y = 9.141672 Therefore, the prediction of the most probable future hotel mortgage rate is 9.14%. Once the most probable future hotel mortgage rate is predicted, the equity dividend rate must be forecasted. Since restaurants are a risky business, a 15 to 18% return on equity is most common. Infinity Hospitality & Entertainment International has decided to offer a 15% equity dividend rate because of the risk involved and the opportunity for partnership in the Lunai’s operation. This, in addition to the amortization of 25 years and the aforementioned loan to value ratio give us all of the necessary figures to estimate an overall value of the restaurant.
  • 44. PAGE 44 Mortgage Finance Terms Interest Rate 9.14% Amortization 25 years Loan to Value Ratio 70% Equity Dividend Rate 15% Capitalization Rate 10.9% Using the net income from the nine different statements of income and the mortgage finance terms,Infinity Hospitality & Entertainment International has estimated the nine different valuations. The valuation approached used has been labeled the banded width income capitalization approach using one stabilized year. For the purposes of the Lunai’s valuation,Infinity Hospitality & Entertainment International has identified year three of operation (year 2004) as their stabilized year. Taking the weighted mortgage rate and the weighted equity rate, a capitalization rate is then calculated. This capitalization rate is finally multiplied by the third year net income to give Lunai’s an estimated value. Lunai’s Estimated Values using the Banded Width Income Capitalization Approach for One Stabilized Year (year 2004) Very Good & Scenario 3 $48,366,203 Very Good & Scenario 2 $45,155,407 Very Good & Scenario 1 $42,535,533 Good & Scenario 3 $43,069,048 Good & Scenario 2 $40,203,358 Good & Scenario 1 $37,865,075 OK & Scenario 3 $35,516,828 OK & Scenario 2 $33,143,160 OK & Scenario 1 $31,206,346
  • 45. PAGE 45 CONCLUSION Although food and beverage costs are critical in running a restaurant and management is the ultimate variable, the major concerns in opening and operating a successful restaurant are employee wages and enough money to operate the restaurant through the first year. These two points, the other points given, are the make or break variables in successfully running the Lunai’s restaurant on Harmon and Las Vegas Boulevard in Las Vegas, Nevada. The estimated $25 million needed to open this restaurant and the estimated loan to equity ration of 70/30 gives Lunai’s a capitalization rate of 10.9%. Taking the capitalization rate and multiplying it by the stabilized year of operation, for each of the nine scenarios, shows that Lunai’s estimated valuation for the ‘worst case scenario’ is $31.2 million. The estimated ‘best case scenario’ values Lunai’s at $44.4 million. In addition, it is more than possible to exceed the prediction because of the conservative approach taken byInfinity Hospitality & Entertainment International. This is shown in the Lunai’s Competitive Index scores being lower and never higher than the average competitive index of the competition. This study has shown Lunai’s to be a feasible enterprise, assuming the leadership is excellent and the concepts described herein to be viable in nature, because all scenarios are valued greater than the $25 million investment required to create the restaurant named Lunai’s. The next and final issue is how to attain the capital…
  • 46. PAGE 46 CAPITAL SOURCES & FINANCING For the limited track record of the leadership and the level of risk Lunai’s poses, there are only a few options in attaining venture capital: OPTION 1A (on the $17.5 million) A friend of the leadership buys the land and the building for $17.5 million and holds the note on the mortgage sold toInfinity Hospitality & Entertainment International. Assuming the mortgage is given at a rate of 9.14% over a 25 year period, the annual payment would be $1.8 million and interest only payments for the first two years would be required for Lunai’s to be able to stay current on their debt service. OPTION 1B (on the $17.5 million) A friend of the leadership buys the land and the building for $17.5 million and leases them toInfinity Hospitality & Entertainment International with interest only payments for the first two years. OPTION 1C (on the $17.5 million) A friend of the leadership buys the land and the building for $17.5 million and leases them toInfinity Hospitality & Entertainment International with interest only payments for the first two years and a percentage of gross income. OPTION 1D (on the $17.5 million) A venture capital firm is approached and negotiations begin. The money is similar to selling one’s soul. High interest rates and they usually participate in the day to day operations of the business.
  • 47. PAGE 47 OPTION 2A (on the $7.5 million) The other $7.5 million would be attained through an equity loan at 15% over a 20 year period. The annual payment would be $1.2 million, but would have to be interest only payments for the first two years. OPTION 2B (on the $7.5 million) The other $7.5 million would be attained through a combination of an equity loan and a limited partnership agreement. Any partner that has ‘limited partner’ status is required to be passive in the daily operations of the business. The annual payment on the equity loan would be dependent upon the negotiations and would have to be interest only payments for the first two years. OPTION 2C (on the $7.5 million) A combination of limited and general partners, or simply a couple of general partners. The limited partners only risk their equity investment while the general partners are personally liable for the debts and obligations of the partnership. OPTION 2D (on the $7.5 million) Incorporate Lunai’s and issue 49% of the stock to raise the $7.5 million needed for remodeling, expansion, and operating capital. Infinity Hospitality & Entertainment International believes that Options 1c & 2c are the most probable combinations for acquiring the necessary capital to make Lunai’s a success beyond compare.