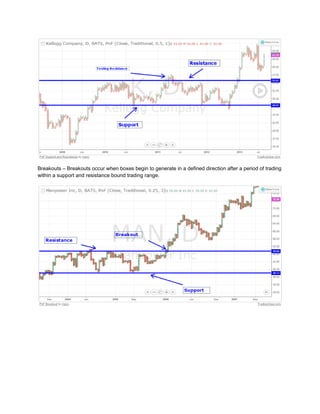
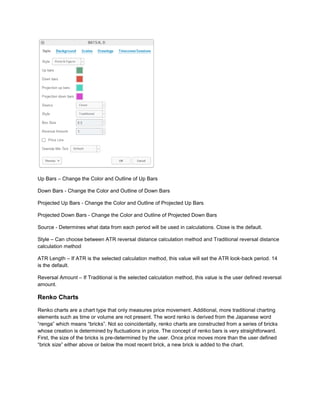
The document provides information about different chart types available in Trading View, including Kagi charts, Line Break charts, Point and Figure charts, and Renko charts. These chart types only consider price movements and not time, filtering out minor price fluctuations. They are composed of lines, bars or boxes that change direction based on user-defined price thresholds. Examples of uses include identifying trends, support/resistance levels, and breakouts. Customization options allow changing the appearance of up/down bars and setting price thresholds.