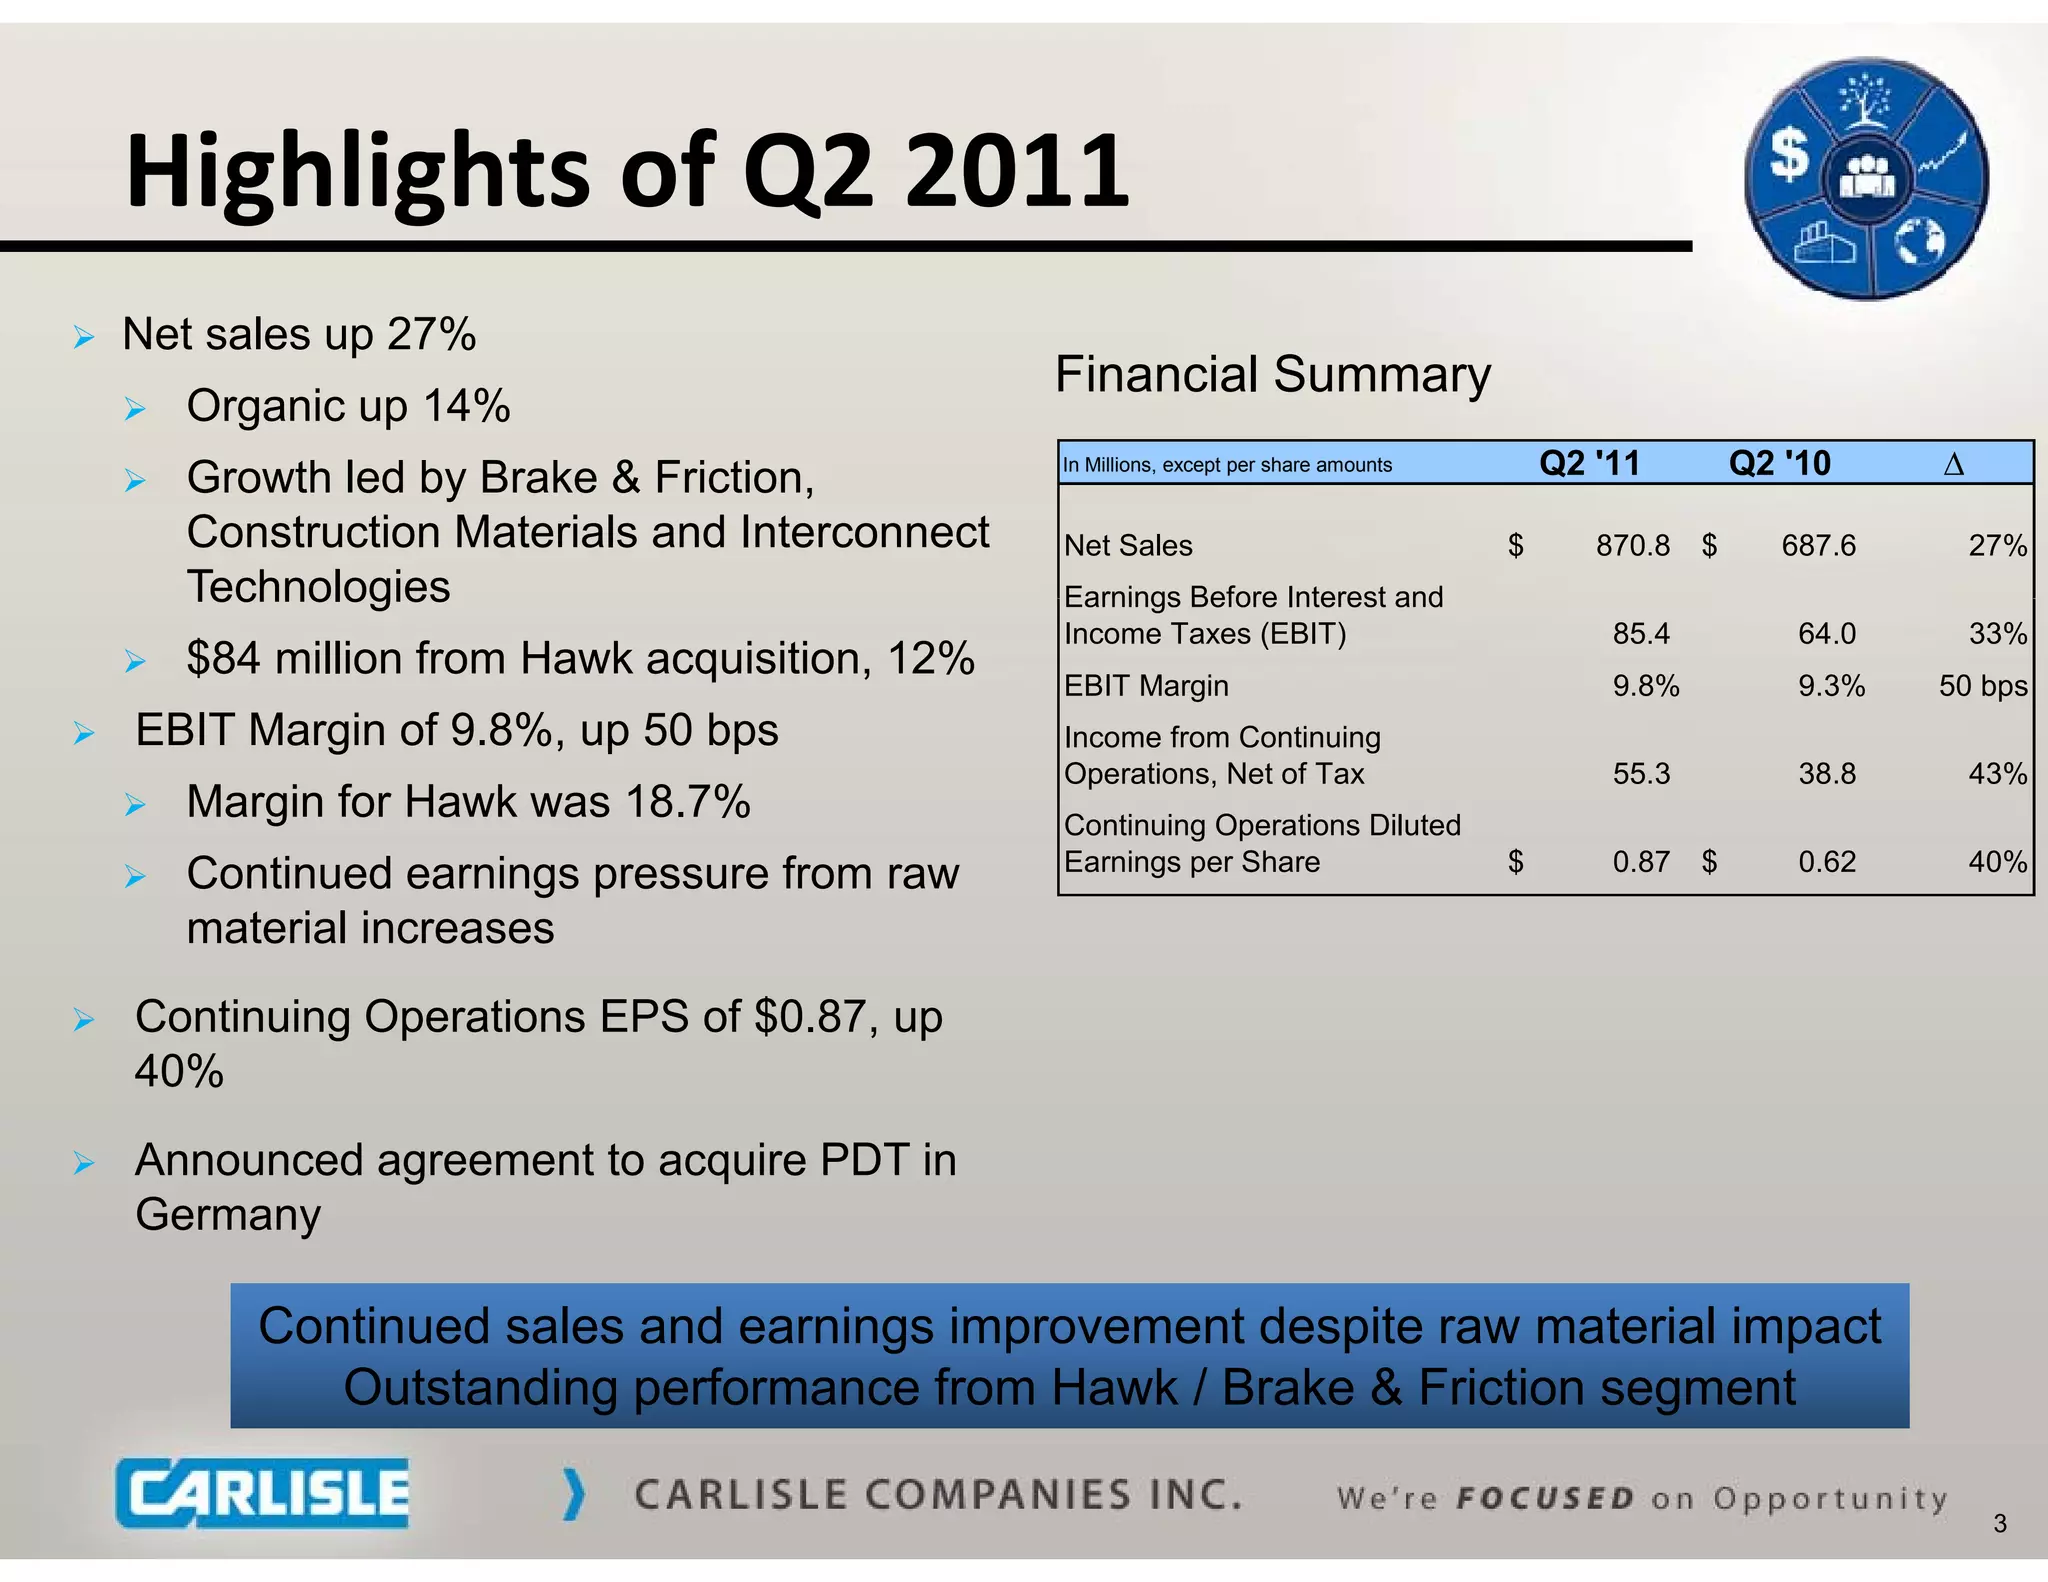
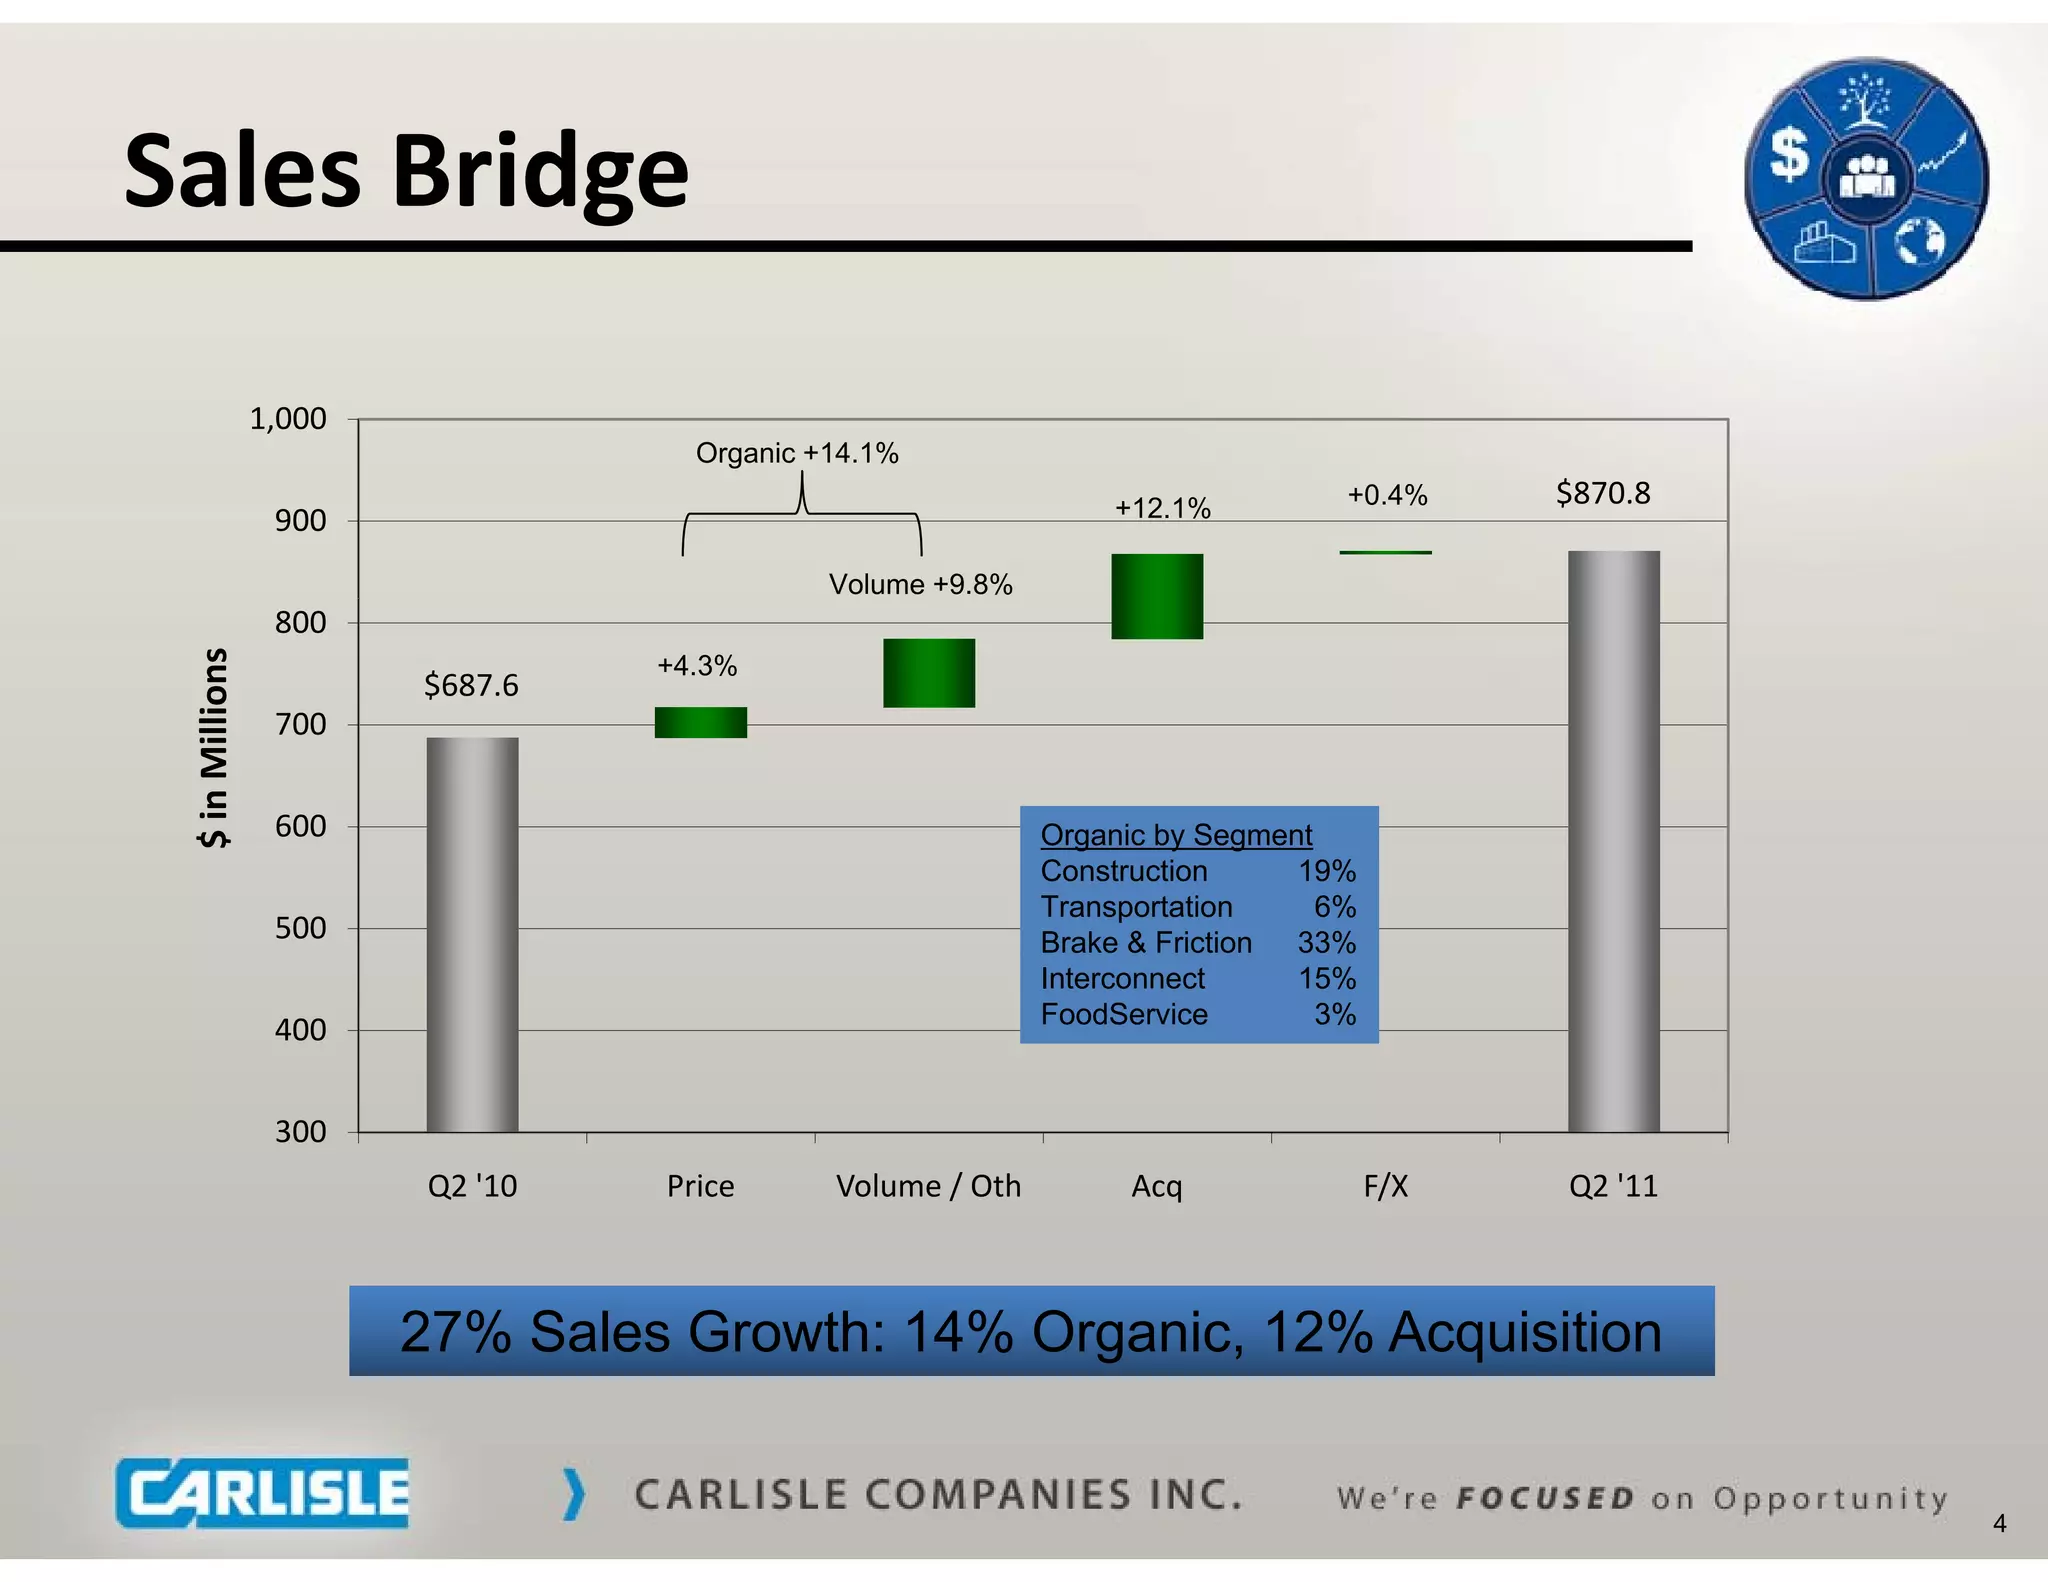
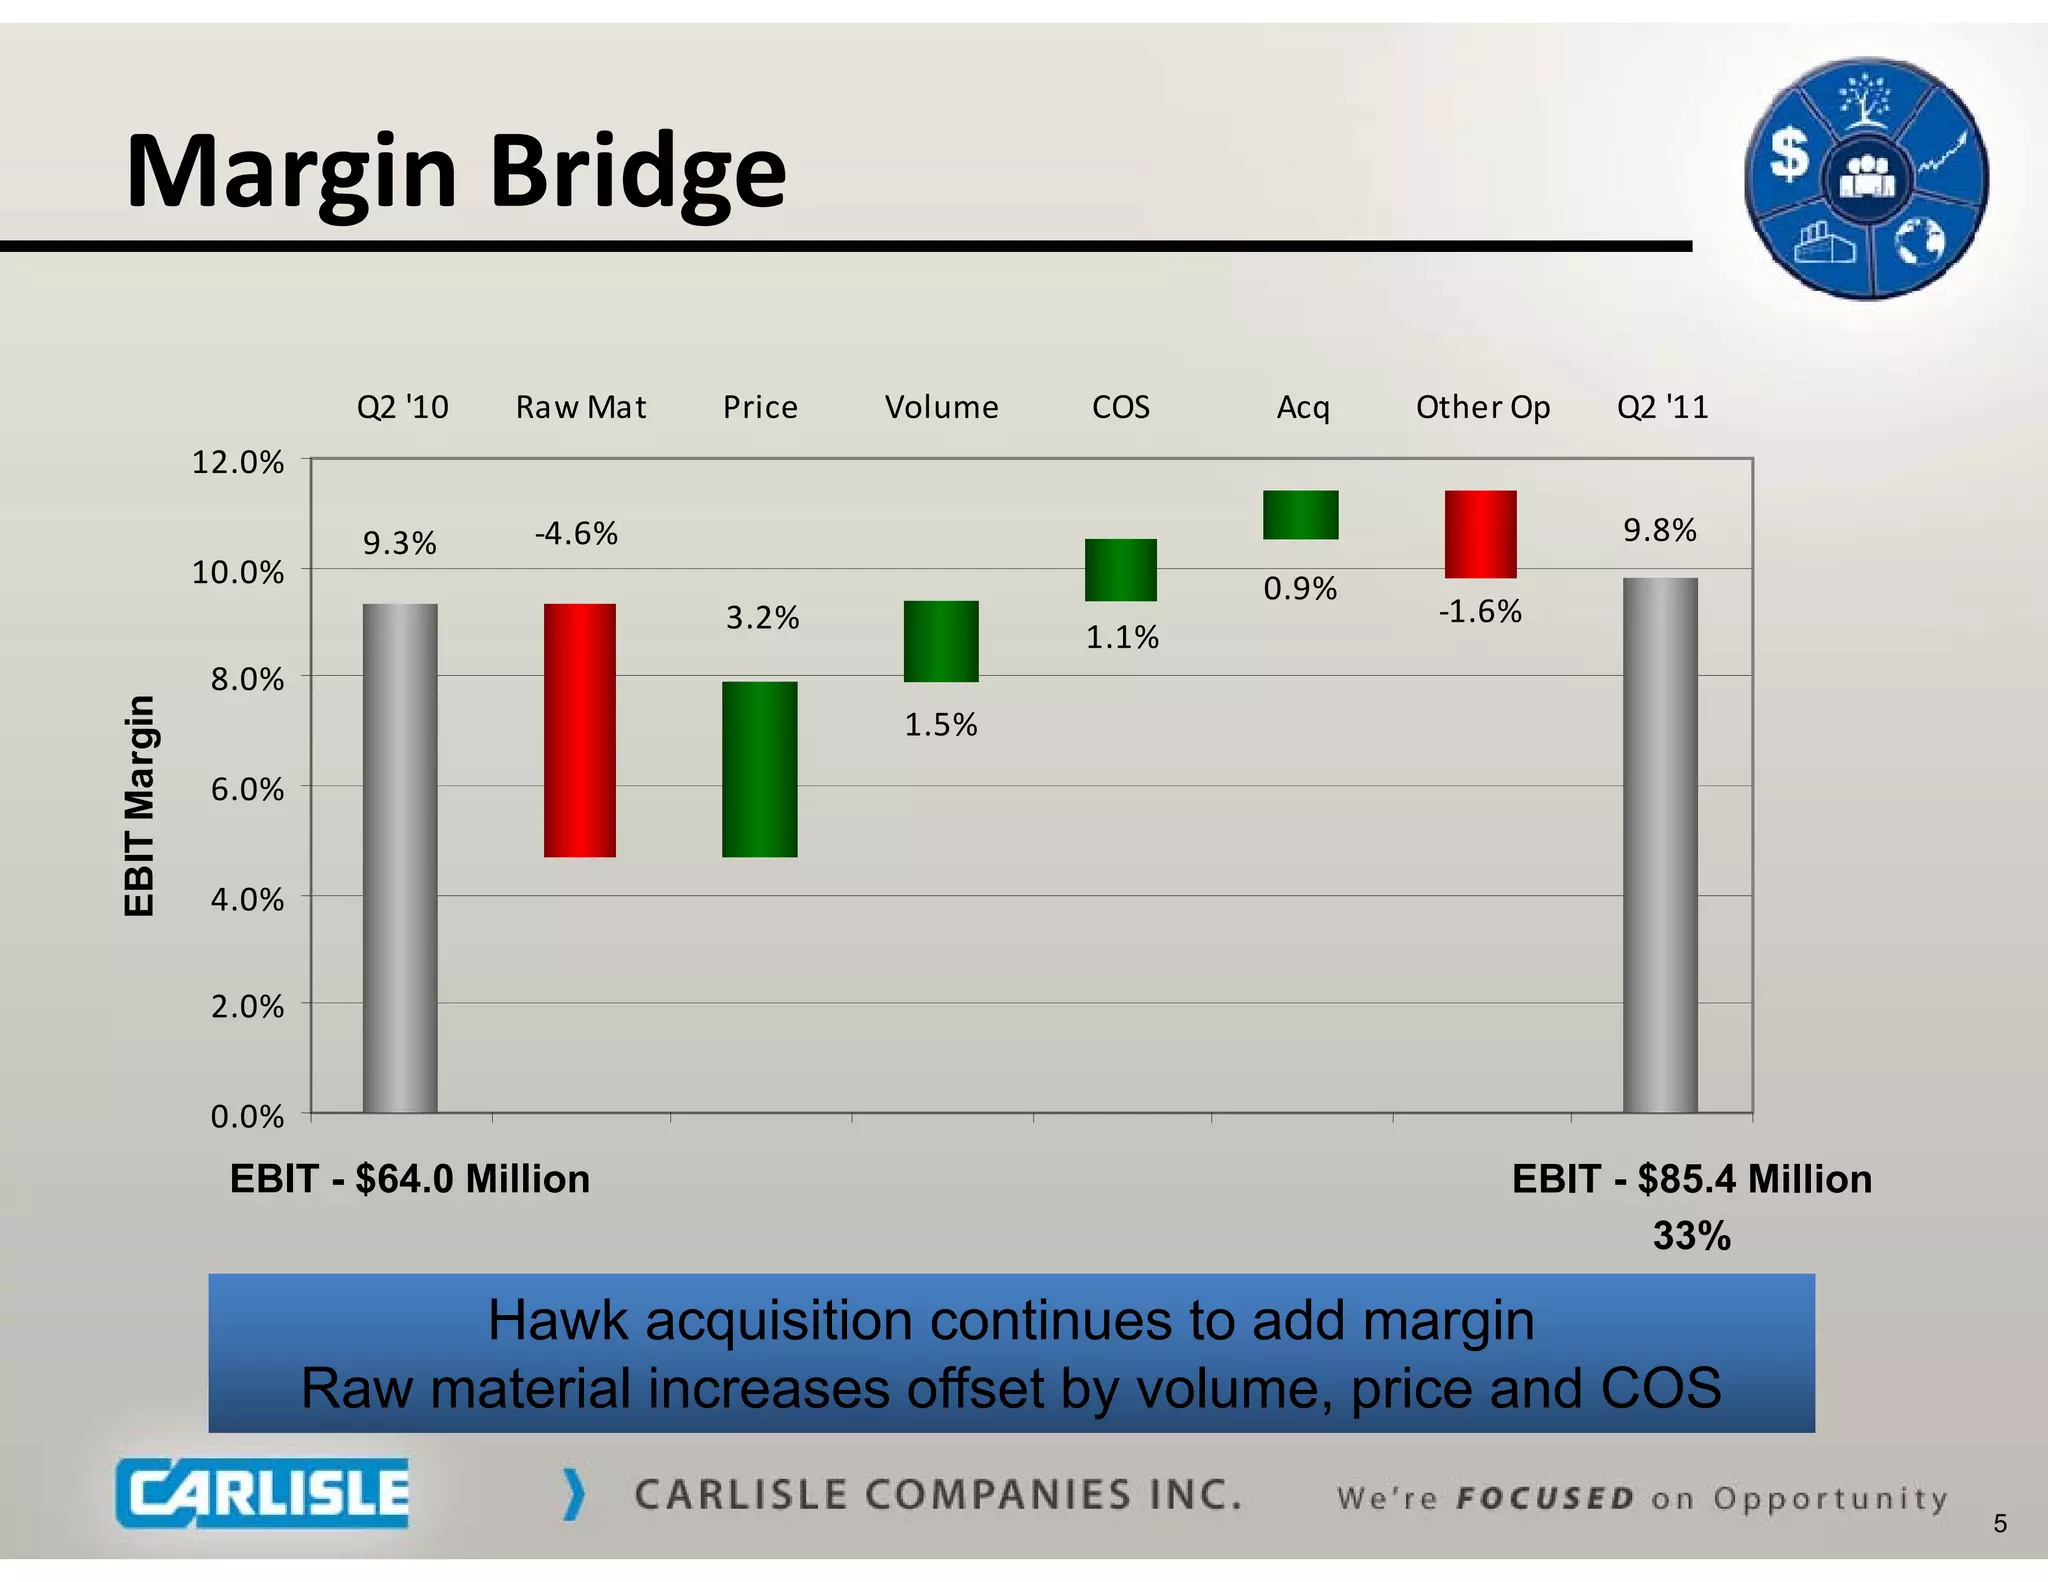
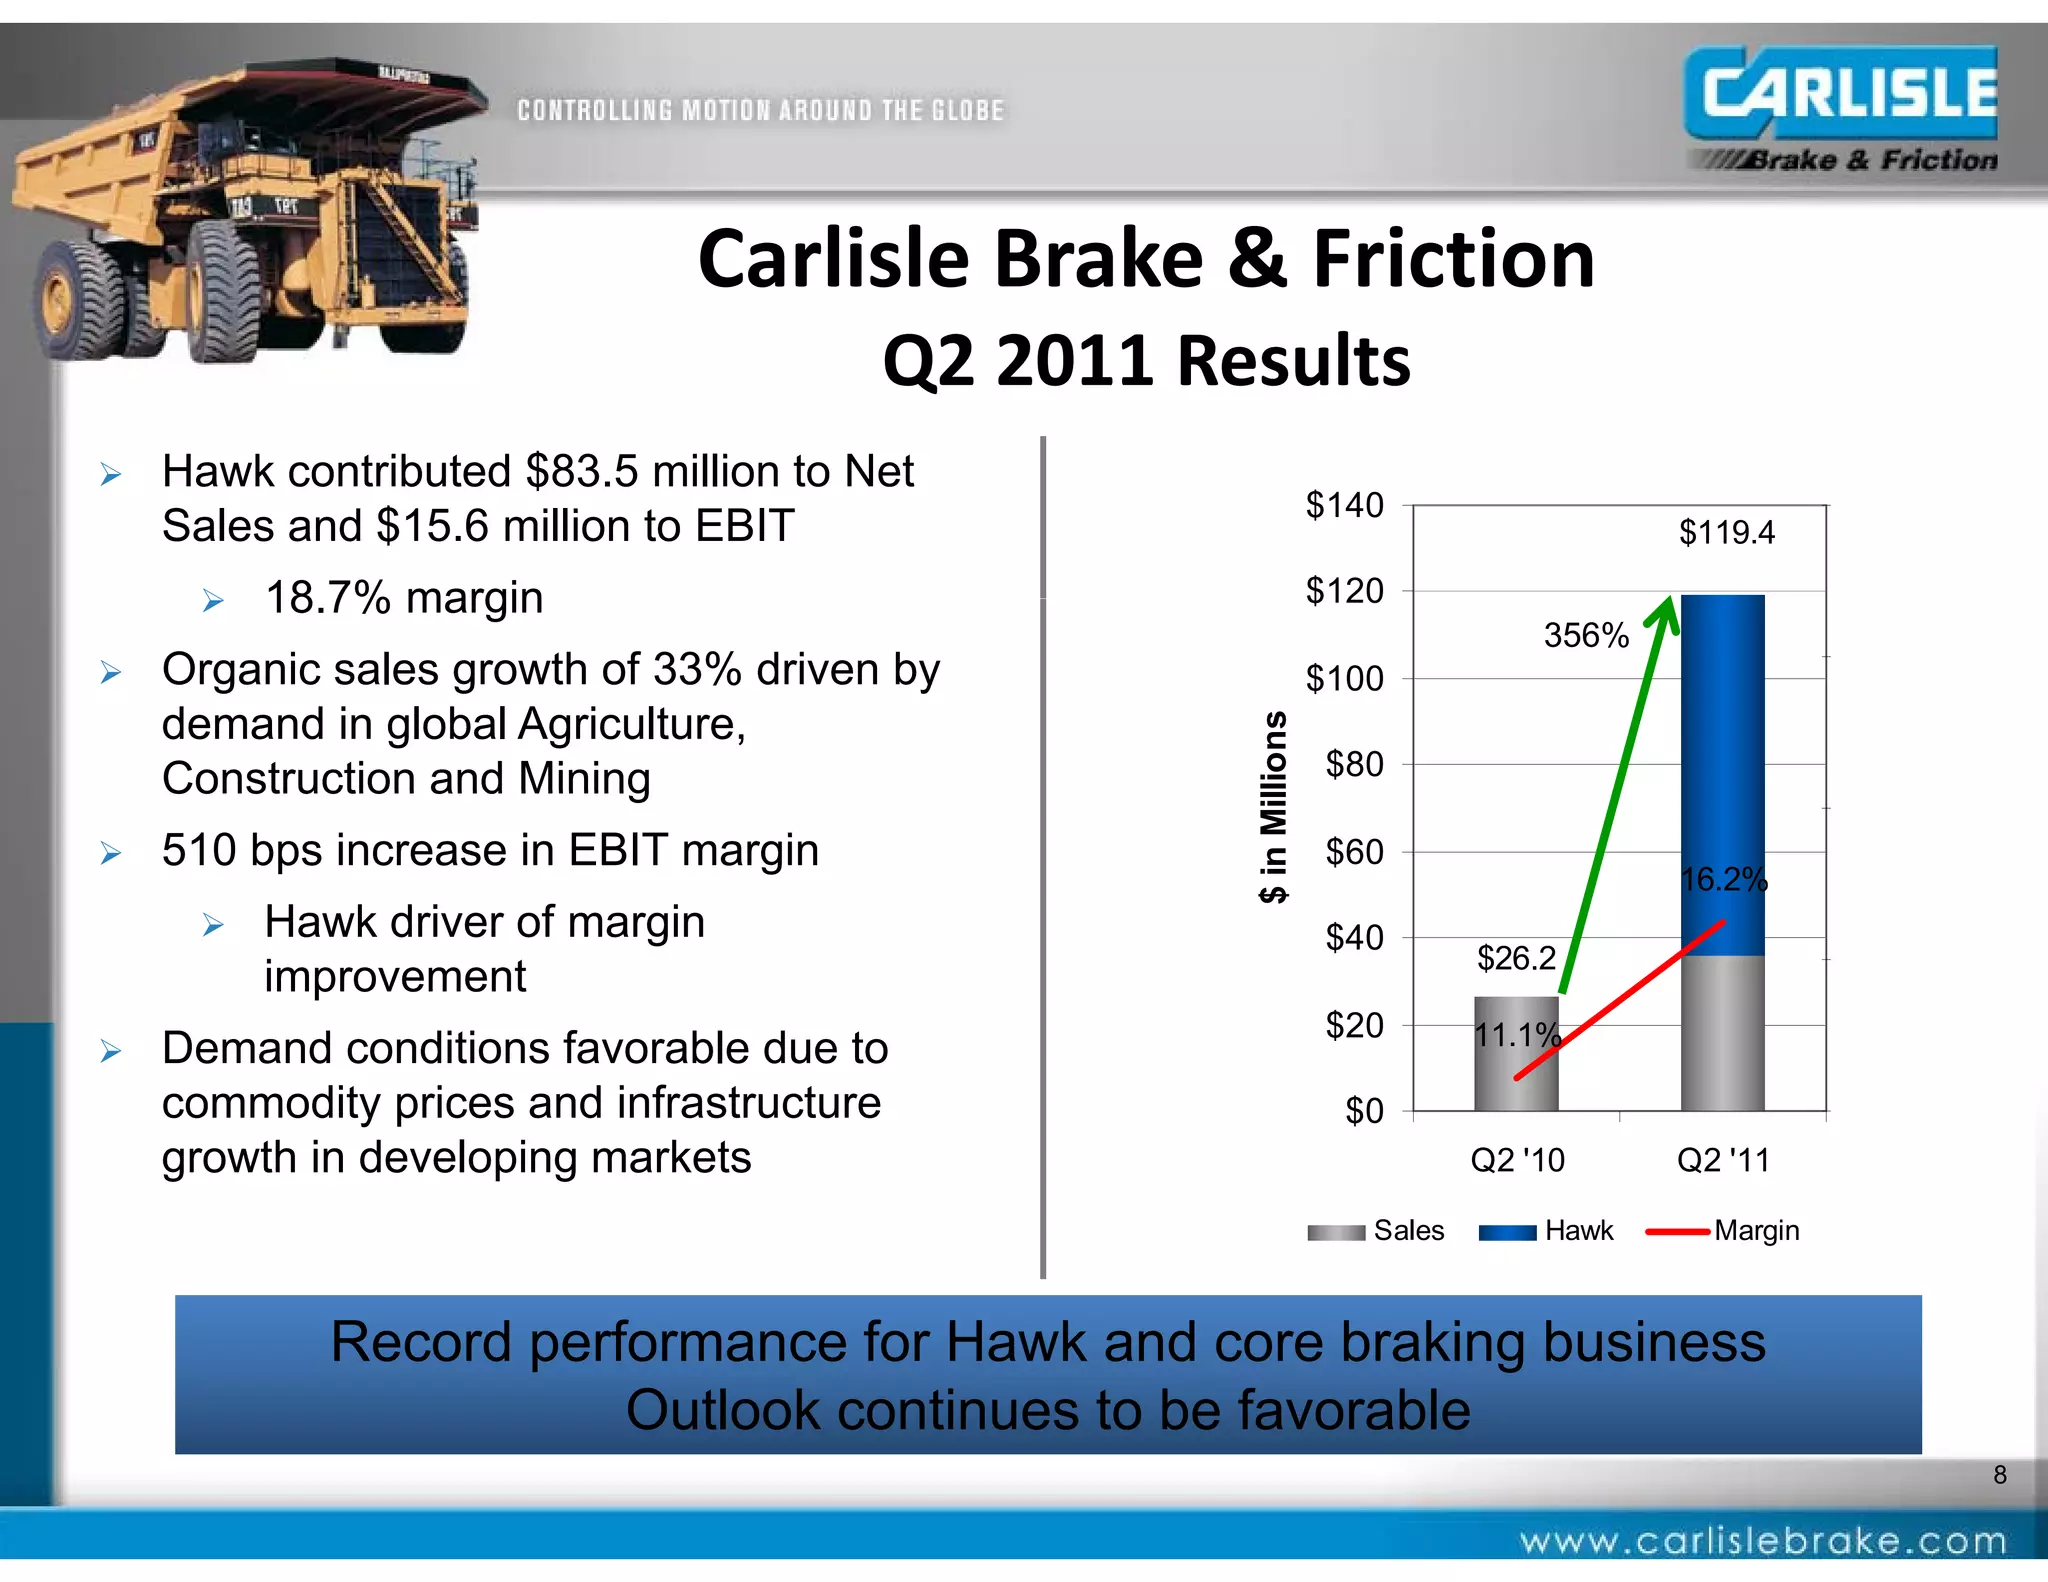
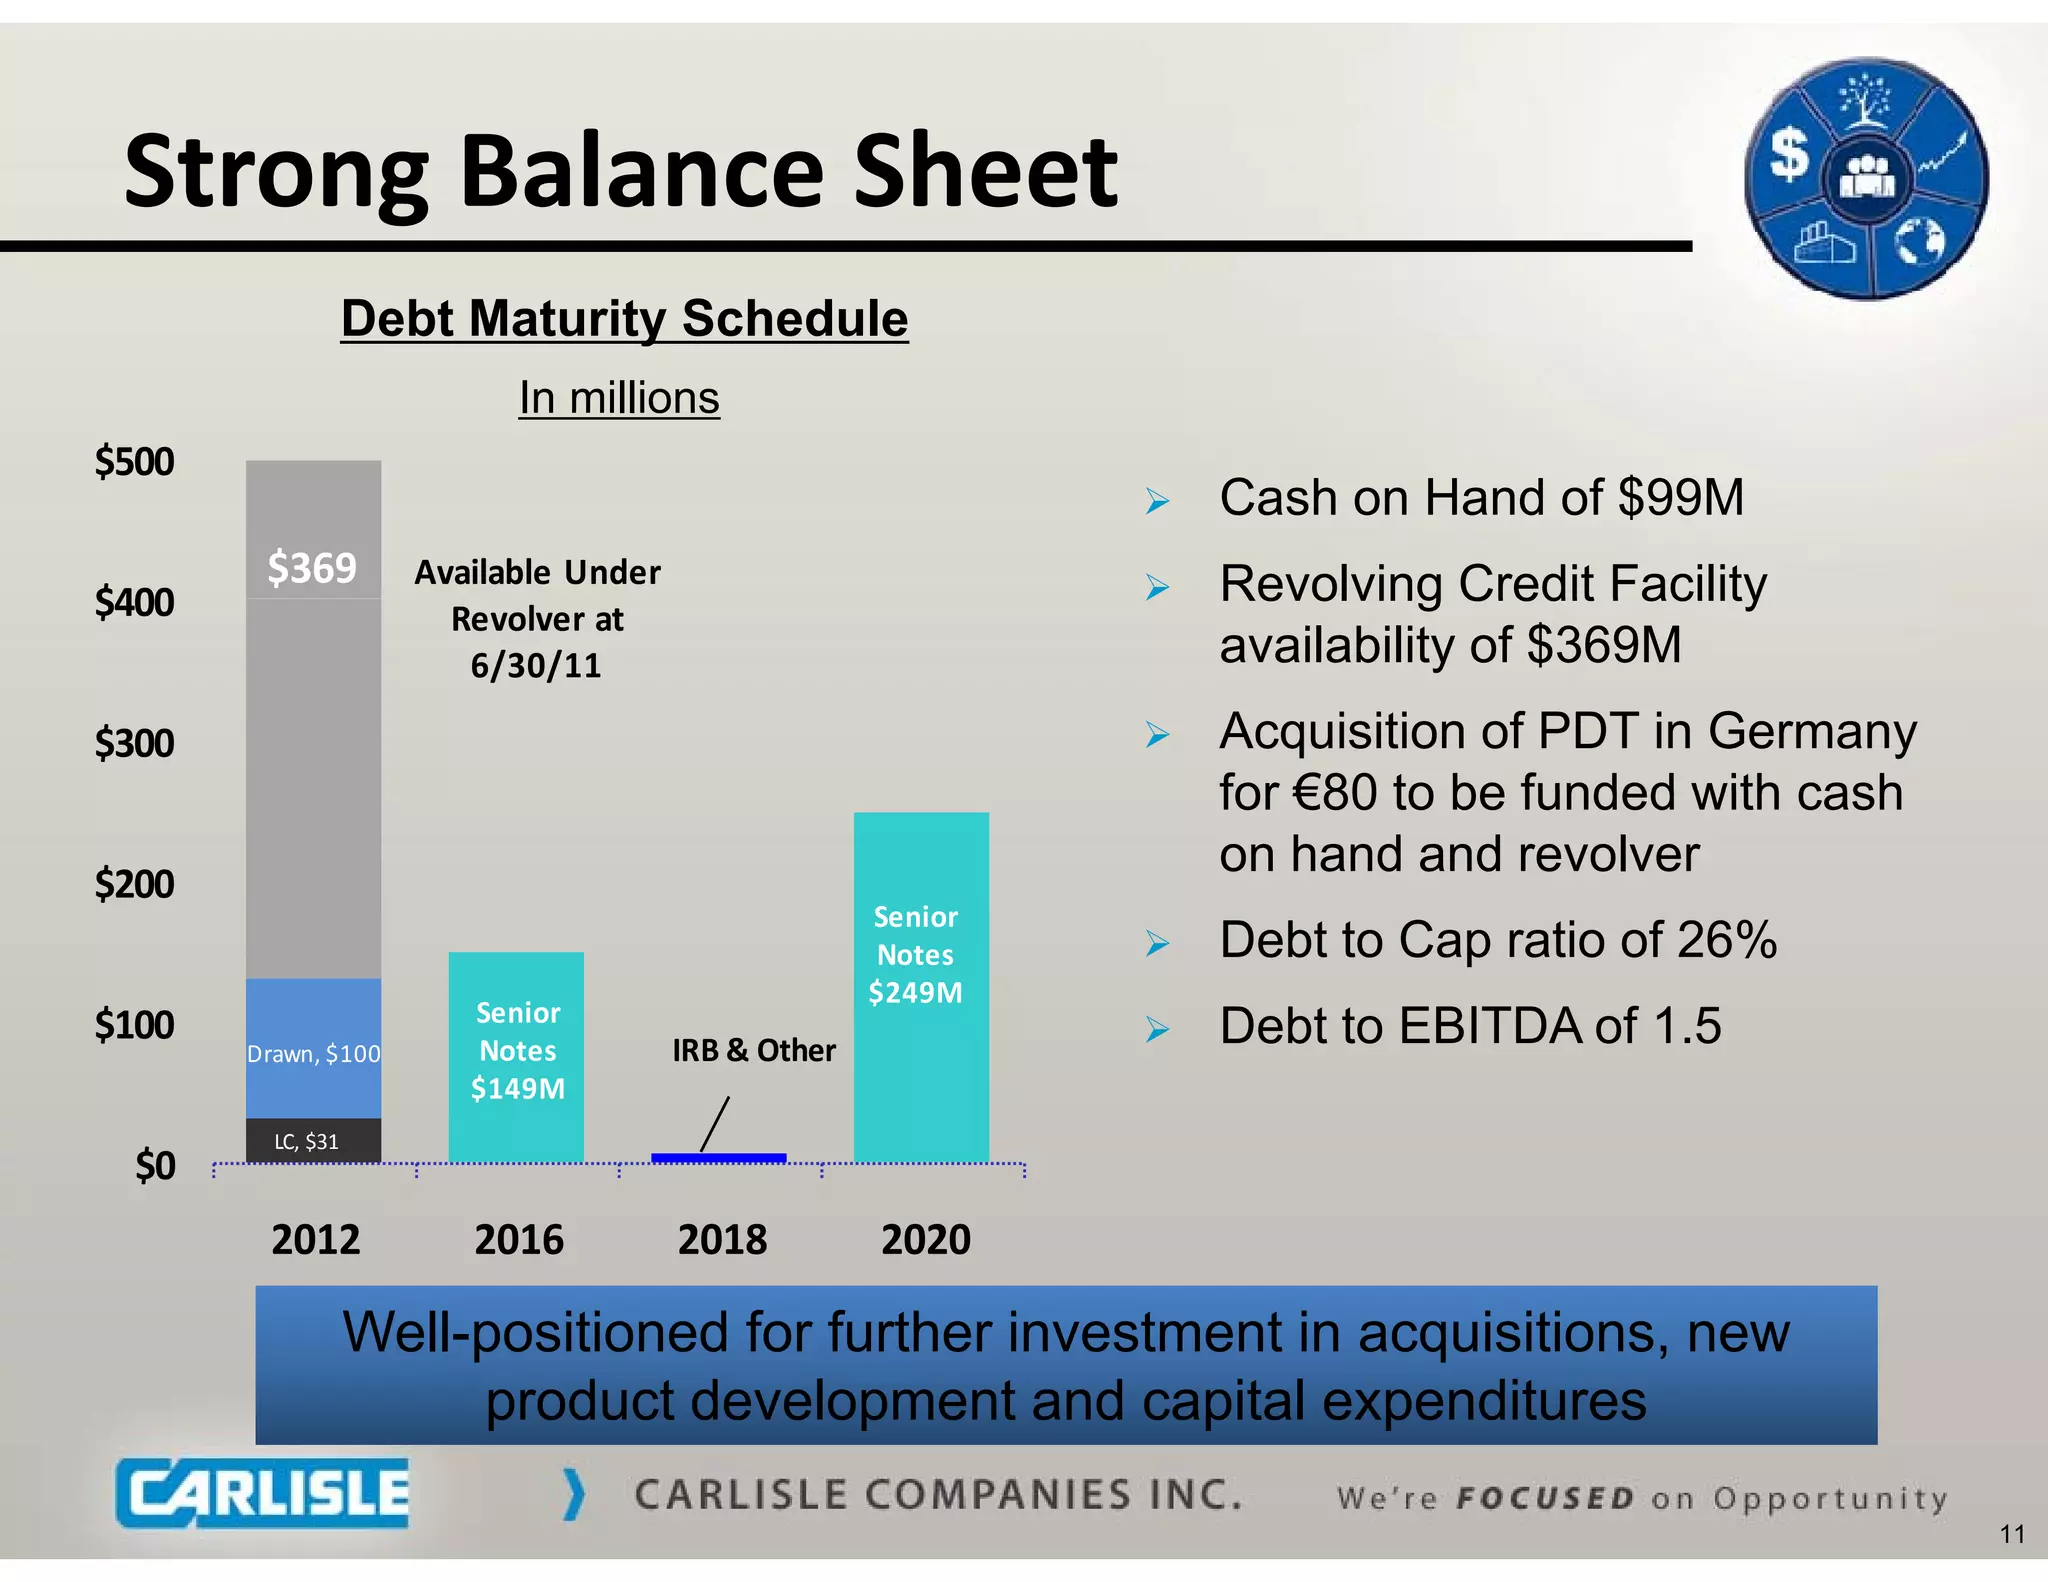
SlideShare a Scribd company logo
Carlisle Companies Earnings Call
            p            g
  2nd Quarter June 30, 2011
Forward Looking Statements
              g
 During the course of this presentation we may make projections or other
                           presentation,
 forward-looking statements within the meaning of the Private Securities
 Litigation Reform Act of 1995.

 We wish to caution you that such statements reflect only our current
 expectations, and that actual events or results may differ materially due
 to changes in global economic business competitive market and
                         economic, business, competitive,
 regulatory factors.

 More detailed information about these factors is contained in the
 documents that the Company files from time to time with the Securities
 and Exchange Commission. We undertake no obligation to update such
 projections or such forward-looking statements in the future.
                     forward looking


                                                                             2
Highlights of Q2 2011
      g g         Q
   Net sales up 27%
                                                  Financial Summary
       Organic up 14%
                                                  In Millions, except per share amounts       Q2 '11         Q2 '10     ∆
       Growth led by Brake & Friction,
        Construction Materials and Interconnect   Net Sales                               $      870.8   $      687.6       27%
        Technologies                              Earnings Before Interest and
                                                  Income Taxes (EBIT)                             85.4           64.0       33%
       $84 million from Hawk acquisition, 12%    EBIT Margin                                     9.8%           9.3%   50 bps
   EBIT Margin of 9.8%, up 50 bps                Income from Continuing
                                                  Operations, Net of Tax                          55.3           38.8       43%
       Margin for H k
        M i f Hawk was 18 7%
                       18.7%                      Continuing Operations Diluted
                                                  Earnings per Share                      $       0.87   $       0.62       40%
       Continued earnings pressure from raw
        material increases
   Continuing Operations EPS of $0.87, up
    40%
   Announced agreement to acquire PDT in
    Germany

           Continued sales and earnings improvement despite raw material impact
              Outstanding performance from Hawk / Brake & Friction segment

                                                                                                                             3
Sales Bridge
          g
                 1,000
                                     Organic +14.1%
                                                                 +12.1%          +0.4%     $870.8
                  900
                                              Volume +9.8%
                  800
 $ in Millions


                                   +4.3%
                         $687.6
                  700

                  600                                        Organic by Segment
                                                             Construction     19%
                                                             Transportation     6%
                  500                                        Brake & Friction 33%
                                                             Interconnect     15%
                                                             FoodService        3%
                  400

                  300
                          Q2 '10
                             '     Price
                                     i        Volume / Oth
                                                l    / h           Acq               F/X
                                                                                      /    Q2 '11
                                                                                              '


                         27% Sales Growth: 14% Organic, 12% Acquisition


                                                                                                    4
Margin Bridge
    g       g
                        Q2  10
                        Q2 '10   Raw Mat
                                 Raw Mat   Price   Volume   COS    Acq    Other Op
                                                                          Other Op   Q2  11
                                                                                     Q2 '11
              12.0%

                        9.3%      ‐4.6%                                              9.8%
              10.0%                                                0.9%
                                           3.2%                            ‐1.6%
                                                            1.1%
               8.0%
EBIT Margin


                                                    1.5%
               6.0%
               6 0%


               4.0%

               2.0%


               0.0%
                EBIT - $64 0 Million
                       $64.0                                                   EBIT - $85 4 Million
                                                                                      $85.4
                                                                                       33%

                           Hawk acquisition continues to add margin
                      Raw material increases offset by volume, price and COS
                                              ff

                                                                                                      5
Carlisle Construction Materials
                          C li l C t ti M t i l
                                   Q2 2011 Results
   19% sales growth                                             $450                           50.0%
                                                                                       $412.0
                                                                                 19%            45.0%
         Reroofing demand still high                            $400
                                                                        $345.8                  40.0%
         Selling price added 2 5%
                              2.5%                               $350
                                                                                                35.0%
   EBIT increased 6% from $51.3M in 2010                        $300


                                                 $ in Millions
                                                                                                30.0%
    to $54.2M in 2011                                            $250
                                                                                                25.0%


                                                      M
   Negative $19 million impact from raw                         $200
                                                                                                20.0%
    materials over prior year                                    $150   14.8%
                                                                                       13.2%    15.0%
         35% increase in EPDM Rubber                            $100                           10.0%
                                                                                                10 0%
         24% increase in Carbon Black                           $50                            5.0%
         10% increase in TPO Resin                               $0                            0.0%
                                                                        Q2 '10         Q2 '11
   Impact of raw material partially offset by
    I     t f        t i l    ti ll ff t b
    organic growth and COS                                                 Sales       Margin

                                 Strong reroofing market
                                        g         g
                Some selling price realization; Increases announced for Q3
                                                                                                        6
Carlisle Transportation Products
                                       Q2 2011 Results
   Sales growth of 6%
                                                                   $250                          3.5%
        Selling price increase of $18M, 9%
        Higher demand in Agriculture and                                          6% $204.3
                                                                          $192.0                 3.5%
                                                                   $200
         Power Sports
        Offset by lower demand in OPE and                                                       3.4%


                                                         illions
                                                                   $150
         Construction
                                                                                                 3.4%
                                                                                                 3 4%


                                                   $ in Mi
   EBIT margin unchanged
                                                                   $100   3.3%         3.3%
        Production inefficiencies at Jackson                                                    3.3%
         offset savings from restructuring
         expense and plant consolidation                            $50
                                                                                                 3.3%
                                                                                                 3 3%
   Raw material cost increases recovered by
    selling price                                                    $0                          3.2%
                                                                          Q2 '10       Q2 '11
        Natural Rubber up 44%
                                                                             Sales      Margin
        Synthetic Rubber up 52%

              Continued raw material increases mitigated by selling price
                      New plant inefficiencies impacting results
                                                                                                        7
Carlisle Brake & Friction
                                       Q2 2011 Results
   Hawk contributed $83.5 million to Net
                                                                 $140
    Sales and $15.6 million to EBIT                                                    $119.4

        18.7%
         18 7% margin                                            $120
                                                                                356%
   Organic sales growth of 33% driven by                        $100
    demand in global Agriculture,


                                                 $ in Millions
    Construction and Mining                                       $80

   510 bps increase in EBIT margin                               $60
                                                                                       16.2%
        Hawk driver of margin                                    $40
                                                                            $26.2
         improvement
                                                                  $20       11.1%
   Demand conditions favorable due to
    commodity prices and infrastructure                            $0
    g
    growth in developing markets
                    p g                                                     Q2 '10     Q2 '11

                                                                    Sales       Hawk     Margin


            Record performance for Hawk and core braking business
                   p                                     g
                       Outlook continues to be favorable
                                                                                                  8
Carlisle Interconnect Technologies
                                 Q2 2011 Results
   Sales growth 15%                                             $80                           30.0%
                                                                                      $71.7
        20% growth in Aerospace from legacy                                    15%
                                                                 $70
         Boeing p g
               g programs and in-flight
                                    g                                  $62.4                   25.0%
         entertainment                                           $60
                                                                                               20.0%
        8% growth in Military sales


                                                 $ in Millions
                                                                 $50                  16.3%
        Boeing 787 p g
              g     program ramping up
                               p g p                             $40                           15.0%
                                                                                               15 0%

   95% increase in EBIT and 670 bps margin                      $30   9.6%
                                                                                               10.0%
    improvement                                                  $20
                                                                                               5.0%
                                                                                               5 0%
        COS added 250 bps to margin                             $10

        Plant consolidation and restructuring                   $0                            0.0%
         savings added 130 bps
              g               p                                        Q2 '10         Q2 '11

                                                                          Sales       Margin


                 Outstanding sales performance and EBIT leverage
                                                                                                       9
Carlisle FoodService Products
                     C li l F dS i P d t
                            Q2 2011 Results
   Sales growth 4% (organic growth 3%)
                                                               $70                          30.0%
                                                                     $61.2    4%   $63.4
        Selling price added 3%
                                                               $60                          25.0%
        Foodservice sales up 11%
                                                               $50
         overall despite flat industry trend                                                20.0%


                                               $ in Millions
                                                               $40
        Healthcare sales down 9%                                                           15.0%


                                                    M
                                                               $30
   EBIT margin decline from 10.3% to                                10.3%
                                                                                   8.4%     10.0%
    8.4%                                                       $20

        Selling price increases were                          $10                          5.0%
                                                                                            5 0%
         more than offset by higher raw
         material and freight costs                            $0                           0.0%
                                                                     Q2 '10        Q2 '11

                                                                         Sales     Margin


                     Growth in foodservice market
      Higher raw material and freight costs mitigated by selling price
                                                                                                    10
Strong Balance Sheet
      g
                   Debt Maturity Schedule
                           In millions
$500
                                                                   Cash on Hand of $99M
        $369         Available Under                               Revolving Credit Facility
$400                   Revolver at 
                        6/30/11                                     availability of $369M
$300                                                               Acquisition of PDT in Germany
                                                                    for €80 to be funded with cash
                                                                    on hand and revolver
$200
                                                      Senior 
                                                      Notes        Debt to Cap ratio of 26%
                                                      $249M
$100                    Senior 
       Drawn, $100      Notes           IRB & Other
                                                                   Debt to EBITDA of 1.5
                        $149M
         LC, $31
  $0
        2012            2016            2018          2020

                   Well-positioned for further investment in acquisitions, new
                        product development and capital expenditures

                                                                                                     11
Cash Flow by Quarter
           yQ
                     $50

                     $40

                     $30
     $ in Millions


                     $20

                     $10
                      $0

                     -$10
                      $10

                     -$20

                     -$30
                                  Q2 '10           Q3 '10               Q4 '10             Q1 '11            Q2 '11
                                             Operating Cash Flow        Capital Expenditures      Free Cash Flow


                                                    Q2 '10
                                                        10         Q3 '10
                                                                       10     Q4 '10
                                                                                  10       Q1 '11
                                                                                               11     Q2 '11
                                                                                                          11
                            Operating Cash Flow      $37.4          $41.9      $45.0         ($0.3)    $14.0
                            Capital Expenditures      (23.2)         (15.2)     (17.8)       (16.9)     (16.9)
                            Free Cash Flow             14.2           26.7       27.2        (17.2)      (2.9)


Cash flow impacted by sales growth; 81% global growth in Q2 with Hawk

                                                                                                                      12
Working Capital as a % of Net Sales
                                        32.0%


                                        30.0%


                                        28.0%


                                        26.0%


                                        24.0%


                                        22.0%


                                        20.0%
                                                         Q1 '09          Q2 '09          Q3 '09         Q4 '09          Q1 '10          Q2 '10         Q3 '10          Q4 '10          Q1 '11          Q2 '11
             WC as a % of Net Sales                       30.4%          26.4%           25.1%           24.9%          23.5%           21.4%           21.6%          22.0%           23.4%           21.7%

Working Capital reflects average of quarter ending Receivables plus Inventory less Accounts Payable. % of Net Sales calculated using average Working Capital over annualized year-to-date Net Sales.


                                    Managing working capital on hi h sales volume
                                    M    i      ki      it l    higher l     l

                                                                                                                                                                                                                13
Q
Q & A


        14
Carlisle 2011 Outlook
   Sales growth from Hawk & PDT acquisitions and segment
    organic growth totaling mid-twenty percent range
   Continued margin improvement, primarily from Brake & Friction
    and Interconnect Technologies
   Cash conversion expected to be greater than 100% for the year
    (
    (Ratio of Free Cash Flow before Dividends to Net Income)
                                                           )


   Corporate Expense - $41M
   Depreciation & Amortization - $93M
   Interest Expense - $21M
   Tax Rate – 33%
   Capital Expenditures - $75M


                                                                    15

More Related Content

What's hot

emerson electricl Electrical Products Group Conference
emerson electricl 	Electrical Products Group Conferenceemerson electricl 	Electrical Products Group Conference
emerson electricl Electrical Products Group Conferencefinance12
 
Earnings Release 1 Q09
Earnings Release 1 Q09Earnings Release 1 Q09
Earnings Release 1 Q09Profarma
 
Gail ru4 qfy2010-18-05-10
Gail ru4 qfy2010-18-05-10Gail ru4 qfy2010-18-05-10
Gail ru4 qfy2010-18-05-10Angel Broking
 
air products & chemicals 2008 June3 JPMorgan
air products & chemicals 2008 June3 JPMorganair products & chemicals 2008 June3 JPMorgan
air products & chemicals 2008 June3 JPMorganfinance26
 
air products & chemicals 5 December 2007 Citi Basic Materials
air products & chemicals 5 December 2007 Citi Basic Materialsair products & chemicals 5 December 2007 Citi Basic Materials
air products & chemicals 5 December 2007 Citi Basic Materialsfinance26
 
2 Q05 Results Presentation
2 Q05 Results Presentation2 Q05 Results Presentation
2 Q05 Results PresentationLocaliza
 
Aegean marine petroleum q4 2012 results presentation
Aegean marine petroleum q4 2012 results presentationAegean marine petroleum q4 2012 results presentation
Aegean marine petroleum q4 2012 results presentationTradeWindsnews
 
air products & chemicals 2007 Sep18 BofA
air products & chemicals 2007 Sep18 BofAair products & chemicals 2007 Sep18 BofA
air products & chemicals 2007 Sep18 BofAfinance26
 
unum group Updated_Merrill_Lynch
unum group   Updated_Merrill_Lynchunum group   Updated_Merrill_Lynch
unum group Updated_Merrill_Lynchfinance26
 
Earnings Release 4 Q07
Earnings Release 4 Q07Earnings Release 4 Q07
Earnings Release 4 Q07Profarma
 
Cummins_06/11/28
Cummins_06/11/28Cummins_06/11/28
Cummins_06/11/28finance21
 
Concor ru2 qfy2011-201010
Concor ru2 qfy2011-201010Concor ru2 qfy2011-201010
Concor ru2 qfy2011-201010Angel Broking
 
1Q 2008 EARNINGS SLIDES
1Q 2008 EARNINGS SLIDES1Q 2008 EARNINGS SLIDES
1Q 2008 EARNINGS SLIDESfinance22
 
Team3 national oilwell_varco_final
Team3 national oilwell_varco_finalTeam3 national oilwell_varco_final
Team3 national oilwell_varco_finalAbdullah Mashuk
 

What's hot (15)

emerson electricl Electrical Products Group Conference
emerson electricl 	Electrical Products Group Conferenceemerson electricl 	Electrical Products Group Conference
emerson electricl Electrical Products Group Conference
 
Earnings Release 1 Q09
Earnings Release 1 Q09Earnings Release 1 Q09
Earnings Release 1 Q09
 
Gail ru4 qfy2010-18-05-10
Gail ru4 qfy2010-18-05-10Gail ru4 qfy2010-18-05-10
Gail ru4 qfy2010-18-05-10
 
air products & chemicals 2008 June3 JPMorgan
air products & chemicals 2008 June3 JPMorganair products & chemicals 2008 June3 JPMorgan
air products & chemicals 2008 June3 JPMorgan
 
air products & chemicals 5 December 2007 Citi Basic Materials
air products & chemicals 5 December 2007 Citi Basic Materialsair products & chemicals 5 December 2007 Citi Basic Materials
air products & chemicals 5 December 2007 Citi Basic Materials
 
2 Q05 Results Presentation
2 Q05 Results Presentation2 Q05 Results Presentation
2 Q05 Results Presentation
 
Aegean marine petroleum q4 2012 results presentation
Aegean marine petroleum q4 2012 results presentationAegean marine petroleum q4 2012 results presentation
Aegean marine petroleum q4 2012 results presentation
 
air products & chemicals 2007 Sep18 BofA
air products & chemicals 2007 Sep18 BofAair products & chemicals 2007 Sep18 BofA
air products & chemicals 2007 Sep18 BofA
 
SHW_3Q_2008
SHW_3Q_2008SHW_3Q_2008
SHW_3Q_2008
 
unum group Updated_Merrill_Lynch
unum group   Updated_Merrill_Lynchunum group   Updated_Merrill_Lynch
unum group Updated_Merrill_Lynch
 
Earnings Release 4 Q07
Earnings Release 4 Q07Earnings Release 4 Q07
Earnings Release 4 Q07
 
Cummins_06/11/28
Cummins_06/11/28Cummins_06/11/28
Cummins_06/11/28
 
Concor ru2 qfy2011-201010
Concor ru2 qfy2011-201010Concor ru2 qfy2011-201010
Concor ru2 qfy2011-201010
 
1Q 2008 EARNINGS SLIDES
1Q 2008 EARNINGS SLIDES1Q 2008 EARNINGS SLIDES
1Q 2008 EARNINGS SLIDES
 
Team3 national oilwell_varco_final
Team3 national oilwell_varco_finalTeam3 national oilwell_varco_final
Team3 national oilwell_varco_final
 

Similar to 2nd Quarter 2011 Earnings Call Presentation

dover 4Q08_Slides
dover 4Q08_Slidesdover 4Q08_Slides
dover 4Q08_Slidesfinance30
 
dover F63A79EE-D2DB-4AA9-BFC8-A2D414AE2159_4Q08_Slides
dover F63A79EE-D2DB-4AA9-BFC8-A2D414AE2159_4Q08_Slidesdover F63A79EE-D2DB-4AA9-BFC8-A2D414AE2159_4Q08_Slides
dover F63A79EE-D2DB-4AA9-BFC8-A2D414AE2159_4Q08_Slidesfinance30
 
dover F63A79EE-D2DB-4AA9-BFC8-A2D414AE2159_4Q08_Slides
dover F63A79EE-D2DB-4AA9-BFC8-A2D414AE2159_4Q08_Slidesdover F63A79EE-D2DB-4AA9-BFC8-A2D414AE2159_4Q08_Slides
dover F63A79EE-D2DB-4AA9-BFC8-A2D414AE2159_4Q08_Slidesfinance30
 
Morgan Stanley Basic Materials Conference
	Morgan Stanley Basic Materials Conference	Morgan Stanley Basic Materials Conference
Morgan Stanley Basic Materials Conferencefinance10
 
Appendix
AppendixAppendix
Appendix
AToshach
 
Honeywell Q4 2008 Earnings Conference Call Presentation
Honeywell Q4 2008 Earnings Conference Call PresentationHoneywell Q4 2008 Earnings Conference Call Presentation
Honeywell Q4 2008 Earnings Conference Call Presentationfinance8
 
Honeywell Download Documentation Q4 2008 Earnings Conference Call Presentation
Honeywell Download Documentation	Q4 2008 Earnings Conference Call PresentationHoneywell Download Documentation	Q4 2008 Earnings Conference Call Presentation
Honeywell Download Documentation Q4 2008 Earnings Conference Call Presentationfinance8
 
Honeywell Q4 2008 Earnings Conference Call Presentation
Honeywell Q4 2008 Earnings Conference Call PresentationHoneywell Q4 2008 Earnings Conference Call Presentation
Honeywell Q4 2008 Earnings Conference Call Presentationfinance8
 
Walgreen Co.Third Quarter 2008 Earnings Conference
Walgreen Co.Third Quarter 2008 Earnings ConferenceWalgreen Co.Third Quarter 2008 Earnings Conference
Walgreen Co.Third Quarter 2008 Earnings Conferencefinance4
 
Verizon 4Q 2008 earnings report
Verizon 4Q 2008 earnings reportVerizon 4Q 2008 earnings report
Verizon 4Q 2008 earnings report
earningsreport
 
Verizon Reports Sustained Revenue Growth and Continued Strong Cash Flows fo...
 	Verizon Reports Sustained Revenue Growth and Continued Strong Cash Flows fo... 	Verizon Reports Sustained Revenue Growth and Continued Strong Cash Flows fo...
Verizon Reports Sustained Revenue Growth and Continued Strong Cash Flows fo...finance2
 
Telecom Italia 1Q 2011 Results (Patuano)
Telecom Italia 1Q 2011 Results (Patuano)Telecom Italia 1Q 2011 Results (Patuano)
Telecom Italia 1Q 2011 Results (Patuano)Gruppo TIM
 
Honeywell Barclays Capital Industrial Select Conference Presentation
Honeywell 	 Barclays Capital Industrial Select Conference PresentationHoneywell 	 Barclays Capital Industrial Select Conference Presentation
Honeywell Barclays Capital Industrial Select Conference Presentationfinance8
 
dover C5089A85-E2B8-4EF4-81EA-02E07D28EF44_Barclays_020909
dover  C5089A85-E2B8-4EF4-81EA-02E07D28EF44_Barclays_020909dover  C5089A85-E2B8-4EF4-81EA-02E07D28EF44_Barclays_020909
dover C5089A85-E2B8-4EF4-81EA-02E07D28EF44_Barclays_020909finance30
 
dover C5089A85-E2B8-4EF4-81EA-02E07D28EF44_Barclays_020909
dover C5089A85-E2B8-4EF4-81EA-02E07D28EF44_Barclays_020909dover C5089A85-E2B8-4EF4-81EA-02E07D28EF44_Barclays_020909
dover C5089A85-E2B8-4EF4-81EA-02E07D28EF44_Barclays_020909finance30
 
NPK Investment Report - 9.23.10
NPK Investment Report - 9.23.10NPK Investment Report - 9.23.10
NPK Investment Report - 9.23.10KevinSami
 
dover Q108_Slides
dover Q108_Slidesdover Q108_Slides
dover Q108_Slidesfinance30
 

Similar to 2nd Quarter 2011 Earnings Call Presentation (20)

dover 4Q08_Slides
dover 4Q08_Slidesdover 4Q08_Slides
dover 4Q08_Slides
 
dover F63A79EE-D2DB-4AA9-BFC8-A2D414AE2159_4Q08_Slides
dover F63A79EE-D2DB-4AA9-BFC8-A2D414AE2159_4Q08_Slidesdover F63A79EE-D2DB-4AA9-BFC8-A2D414AE2159_4Q08_Slides
dover F63A79EE-D2DB-4AA9-BFC8-A2D414AE2159_4Q08_Slides
 
dover F63A79EE-D2DB-4AA9-BFC8-A2D414AE2159_4Q08_Slides
dover F63A79EE-D2DB-4AA9-BFC8-A2D414AE2159_4Q08_Slidesdover F63A79EE-D2DB-4AA9-BFC8-A2D414AE2159_4Q08_Slides
dover F63A79EE-D2DB-4AA9-BFC8-A2D414AE2159_4Q08_Slides
 
Morgan Stanley Basic Materials Conference
	Morgan Stanley Basic Materials Conference	Morgan Stanley Basic Materials Conference
Morgan Stanley Basic Materials Conference
 
csx Q4_2006
csx  Q4_2006csx  Q4_2006
csx Q4_2006
 
csx Q4_2006
csx  Q4_2006csx  Q4_2006
csx Q4_2006
 
Appendix
AppendixAppendix
Appendix
 
Honeywell Q4 2008 Earnings Conference Call Presentation
Honeywell Q4 2008 Earnings Conference Call PresentationHoneywell Q4 2008 Earnings Conference Call Presentation
Honeywell Q4 2008 Earnings Conference Call Presentation
 
Honeywell Download Documentation Q4 2008 Earnings Conference Call Presentation
Honeywell Download Documentation	Q4 2008 Earnings Conference Call PresentationHoneywell Download Documentation	Q4 2008 Earnings Conference Call Presentation
Honeywell Download Documentation Q4 2008 Earnings Conference Call Presentation
 
Honeywell Q4 2008 Earnings Conference Call Presentation
Honeywell Q4 2008 Earnings Conference Call PresentationHoneywell Q4 2008 Earnings Conference Call Presentation
Honeywell Q4 2008 Earnings Conference Call Presentation
 
Walgreen Co.Third Quarter 2008 Earnings Conference
Walgreen Co.Third Quarter 2008 Earnings ConferenceWalgreen Co.Third Quarter 2008 Earnings Conference
Walgreen Co.Third Quarter 2008 Earnings Conference
 
Verizon 4Q 2008 earnings report
Verizon 4Q 2008 earnings reportVerizon 4Q 2008 earnings report
Verizon 4Q 2008 earnings report
 
Verizon Reports Sustained Revenue Growth and Continued Strong Cash Flows fo...
 	Verizon Reports Sustained Revenue Growth and Continued Strong Cash Flows fo... 	Verizon Reports Sustained Revenue Growth and Continued Strong Cash Flows fo...
Verizon Reports Sustained Revenue Growth and Continued Strong Cash Flows fo...
 
Telecom Italia 1Q 2011 Results (Patuano)
Telecom Italia 1Q 2011 Results (Patuano)Telecom Italia 1Q 2011 Results (Patuano)
Telecom Italia 1Q 2011 Results (Patuano)
 
Honeywell Barclays Capital Industrial Select Conference Presentation
Honeywell 	 Barclays Capital Industrial Select Conference PresentationHoneywell 	 Barclays Capital Industrial Select Conference Presentation
Honeywell Barclays Capital Industrial Select Conference Presentation
 
Apre 3 t04
Apre 3 t04Apre 3 t04
Apre 3 t04
 
dover C5089A85-E2B8-4EF4-81EA-02E07D28EF44_Barclays_020909
dover  C5089A85-E2B8-4EF4-81EA-02E07D28EF44_Barclays_020909dover  C5089A85-E2B8-4EF4-81EA-02E07D28EF44_Barclays_020909
dover C5089A85-E2B8-4EF4-81EA-02E07D28EF44_Barclays_020909
 
dover C5089A85-E2B8-4EF4-81EA-02E07D28EF44_Barclays_020909
dover C5089A85-E2B8-4EF4-81EA-02E07D28EF44_Barclays_020909dover C5089A85-E2B8-4EF4-81EA-02E07D28EF44_Barclays_020909
dover C5089A85-E2B8-4EF4-81EA-02E07D28EF44_Barclays_020909
 
NPK Investment Report - 9.23.10
NPK Investment Report - 9.23.10NPK Investment Report - 9.23.10
NPK Investment Report - 9.23.10
 
dover Q108_Slides
dover Q108_Slidesdover Q108_Slides
dover Q108_Slides
 

More from carlisle_com

2011 November Investor Presentation
2011   November Investor Presentation2011   November Investor Presentation
2011 November Investor Presentationcarlisle_com
 
2011 September Investor Presentation Update
2011   September Investor Presentation Update2011   September Investor Presentation Update
2011 September Investor Presentation Updatecarlisle_com
 
2011 September Investor Presentation Update
2011   September Investor Presentation Update2011   September Investor Presentation Update
2011 September Investor Presentation Update
carlisle_com
 
September 2011 investor presentation
September 2011 investor presentationSeptember 2011 investor presentation
September 2011 investor presentationcarlisle_com
 
2011 August Investor Presentation
2011 August Investor Presentation2011 August Investor Presentation
2011 August Investor Presentationcarlisle_com
 
Carlisle Investor Presentation June 2011
Carlisle Investor Presentation June 2011Carlisle Investor Presentation June 2011
Carlisle Investor Presentation June 2011carlisle_com
 

More from carlisle_com (6)

2011 November Investor Presentation
2011   November Investor Presentation2011   November Investor Presentation
2011 November Investor Presentation
 
2011 September Investor Presentation Update
2011   September Investor Presentation Update2011   September Investor Presentation Update
2011 September Investor Presentation Update
 
2011 September Investor Presentation Update
2011   September Investor Presentation Update2011   September Investor Presentation Update
2011 September Investor Presentation Update
 
September 2011 investor presentation
September 2011 investor presentationSeptember 2011 investor presentation
September 2011 investor presentation
 
2011 August Investor Presentation
2011 August Investor Presentation2011 August Investor Presentation
2011 August Investor Presentation
 
Carlisle Investor Presentation June 2011
Carlisle Investor Presentation June 2011Carlisle Investor Presentation June 2011
Carlisle Investor Presentation June 2011
 

Recently uploaded

Investor Day 2024 Presentation Sysco 2024
Investor Day 2024 Presentation Sysco 2024Investor Day 2024 Presentation Sysco 2024
Investor Day 2024 Presentation Sysco 2024
Sysco_Investors
 
Snam 2023-27 Industrial Plan - Financial Presentation
Snam 2023-27 Industrial Plan - Financial PresentationSnam 2023-27 Industrial Plan - Financial Presentation
Snam 2023-27 Industrial Plan - Financial Presentation
Valentina Ottini
 
Osisko Development - Investor Presentation - June 24
Osisko Development - Investor Presentation - June 24Osisko Development - Investor Presentation - June 24
Osisko Development - Investor Presentation - June 24
Philip Rabenok
 
2024-deutsche-bank-global-consumer-conference.pdf
2024-deutsche-bank-global-consumer-conference.pdf2024-deutsche-bank-global-consumer-conference.pdf
2024-deutsche-bank-global-consumer-conference.pdf
Sysco_Investors
 
Collective Mining | Corporate Presentation - May 2024
Collective Mining | Corporate Presentation - May 2024Collective Mining | Corporate Presentation - May 2024
Collective Mining | Corporate Presentation - May 2024
CollectiveMining1
 
cyberagent_For New Investors_EN_240424.pdf
cyberagent_For New Investors_EN_240424.pdfcyberagent_For New Investors_EN_240424.pdf
cyberagent_For New Investors_EN_240424.pdf
CyberAgent, Inc.
 
一比一原版(UW毕业证)华盛顿大学毕业证成绩单专业办理
一比一原版(UW毕业证)华盛顿大学毕业证成绩单专业办理一比一原版(UW毕业证)华盛顿大学毕业证成绩单专业办理
一比一原版(UW毕业证)华盛顿大学毕业证成绩单专业办理
ybout
 
Corporate Presentation Probe June 2024.pdf
Corporate Presentation Probe June 2024.pdfCorporate Presentation Probe June 2024.pdf
Corporate Presentation Probe June 2024.pdf
Probe Gold
 

Recently uploaded (8)

Investor Day 2024 Presentation Sysco 2024
Investor Day 2024 Presentation Sysco 2024Investor Day 2024 Presentation Sysco 2024
Investor Day 2024 Presentation Sysco 2024
 
Snam 2023-27 Industrial Plan - Financial Presentation
Snam 2023-27 Industrial Plan - Financial PresentationSnam 2023-27 Industrial Plan - Financial Presentation
Snam 2023-27 Industrial Plan - Financial Presentation
 
Osisko Development - Investor Presentation - June 24
Osisko Development - Investor Presentation - June 24Osisko Development - Investor Presentation - June 24
Osisko Development - Investor Presentation - June 24
 
2024-deutsche-bank-global-consumer-conference.pdf
2024-deutsche-bank-global-consumer-conference.pdf2024-deutsche-bank-global-consumer-conference.pdf
2024-deutsche-bank-global-consumer-conference.pdf
 
Collective Mining | Corporate Presentation - May 2024
Collective Mining | Corporate Presentation - May 2024Collective Mining | Corporate Presentation - May 2024
Collective Mining | Corporate Presentation - May 2024
 
cyberagent_For New Investors_EN_240424.pdf
cyberagent_For New Investors_EN_240424.pdfcyberagent_For New Investors_EN_240424.pdf
cyberagent_For New Investors_EN_240424.pdf
 
一比一原版(UW毕业证)华盛顿大学毕业证成绩单专业办理
一比一原版(UW毕业证)华盛顿大学毕业证成绩单专业办理一比一原版(UW毕业证)华盛顿大学毕业证成绩单专业办理
一比一原版(UW毕业证)华盛顿大学毕业证成绩单专业办理
 
Corporate Presentation Probe June 2024.pdf
Corporate Presentation Probe June 2024.pdfCorporate Presentation Probe June 2024.pdf
Corporate Presentation Probe June 2024.pdf
 

2nd Quarter 2011 Earnings Call Presentation

  • 1. Carlisle Companies Earnings Call p g 2nd Quarter June 30, 2011
  • 2. Forward Looking Statements g During the course of this presentation we may make projections or other presentation, forward-looking statements within the meaning of the Private Securities Litigation Reform Act of 1995. We wish to caution you that such statements reflect only our current expectations, and that actual events or results may differ materially due to changes in global economic business competitive market and economic, business, competitive, regulatory factors. More detailed information about these factors is contained in the documents that the Company files from time to time with the Securities and Exchange Commission. We undertake no obligation to update such projections or such forward-looking statements in the future. forward looking 2
  • 3. Highlights of Q2 2011 g g Q  Net sales up 27% Financial Summary  Organic up 14% In Millions, except per share amounts Q2 '11 Q2 '10 ∆  Growth led by Brake & Friction, Construction Materials and Interconnect Net Sales $ 870.8 $ 687.6 27% Technologies Earnings Before Interest and Income Taxes (EBIT) 85.4 64.0 33%  $84 million from Hawk acquisition, 12% EBIT Margin 9.8% 9.3% 50 bps  EBIT Margin of 9.8%, up 50 bps Income from Continuing Operations, Net of Tax 55.3 38.8 43%  Margin for H k M i f Hawk was 18 7% 18.7% Continuing Operations Diluted Earnings per Share $ 0.87 $ 0.62 40%  Continued earnings pressure from raw material increases  Continuing Operations EPS of $0.87, up 40%  Announced agreement to acquire PDT in Germany Continued sales and earnings improvement despite raw material impact Outstanding performance from Hawk / Brake & Friction segment 3
  • 4. Sales Bridge g 1,000 Organic +14.1% +12.1% +0.4% $870.8 900 Volume +9.8% 800 $ in Millions +4.3% $687.6 700 600 Organic by Segment Construction 19% Transportation 6% 500 Brake & Friction 33% Interconnect 15% FoodService 3% 400 300 Q2 '10 ' Price i Volume / Oth l / h Acq F/X / Q2 '11 ' 27% Sales Growth: 14% Organic, 12% Acquisition 4
  • 5. Margin Bridge g g Q2  10 Q2 '10 Raw Mat Raw Mat Price Volume COS Acq Other Op Other Op Q2  11 Q2 '11 12.0% 9.3% ‐4.6% 9.8% 10.0% 0.9% 3.2% ‐1.6% 1.1% 8.0% EBIT Margin 1.5% 6.0% 6 0% 4.0% 2.0% 0.0% EBIT - $64 0 Million $64.0 EBIT - $85 4 Million $85.4 33% Hawk acquisition continues to add margin Raw material increases offset by volume, price and COS ff 5
  • 6. Carlisle Construction Materials C li l C t ti M t i l Q2 2011 Results  19% sales growth $450 50.0% $412.0 19% 45.0%  Reroofing demand still high $400 $345.8 40.0%  Selling price added 2 5% 2.5% $350 35.0%  EBIT increased 6% from $51.3M in 2010 $300 $ in Millions 30.0% to $54.2M in 2011 $250 25.0% M  Negative $19 million impact from raw $200 20.0% materials over prior year $150 14.8% 13.2% 15.0%  35% increase in EPDM Rubber $100 10.0% 10 0%  24% increase in Carbon Black $50 5.0%  10% increase in TPO Resin $0 0.0% Q2 '10 Q2 '11  Impact of raw material partially offset by I t f t i l ti ll ff t b organic growth and COS Sales Margin Strong reroofing market g g Some selling price realization; Increases announced for Q3 6
  • 7. Carlisle Transportation Products Q2 2011 Results  Sales growth of 6% $250 3.5%  Selling price increase of $18M, 9%  Higher demand in Agriculture and 6% $204.3 $192.0 3.5% $200 Power Sports  Offset by lower demand in OPE and 3.4% illions $150 Construction 3.4% 3 4% $ in Mi  EBIT margin unchanged $100 3.3% 3.3%  Production inefficiencies at Jackson 3.3% offset savings from restructuring expense and plant consolidation $50 3.3% 3 3%  Raw material cost increases recovered by selling price $0 3.2% Q2 '10 Q2 '11  Natural Rubber up 44% Sales Margin  Synthetic Rubber up 52% Continued raw material increases mitigated by selling price New plant inefficiencies impacting results 7
  • 8. Carlisle Brake & Friction Q2 2011 Results  Hawk contributed $83.5 million to Net $140 Sales and $15.6 million to EBIT $119.4  18.7% 18 7% margin $120 356%  Organic sales growth of 33% driven by $100 demand in global Agriculture, $ in Millions Construction and Mining $80  510 bps increase in EBIT margin $60 16.2%  Hawk driver of margin $40 $26.2 improvement $20 11.1%  Demand conditions favorable due to commodity prices and infrastructure $0 g growth in developing markets p g Q2 '10 Q2 '11 Sales Hawk Margin Record performance for Hawk and core braking business p g Outlook continues to be favorable 8
  • 9. Carlisle Interconnect Technologies Q2 2011 Results  Sales growth 15% $80 30.0% $71.7  20% growth in Aerospace from legacy 15% $70 Boeing p g g programs and in-flight g $62.4 25.0% entertainment $60 20.0%  8% growth in Military sales $ in Millions $50 16.3%  Boeing 787 p g g program ramping up p g p $40 15.0% 15 0%  95% increase in EBIT and 670 bps margin $30 9.6% 10.0% improvement $20 5.0% 5 0%  COS added 250 bps to margin $10  Plant consolidation and restructuring $0 0.0% savings added 130 bps g p Q2 '10 Q2 '11 Sales Margin Outstanding sales performance and EBIT leverage 9
  • 10. Carlisle FoodService Products C li l F dS i P d t Q2 2011 Results  Sales growth 4% (organic growth 3%) $70 30.0% $61.2 4% $63.4  Selling price added 3% $60 25.0%  Foodservice sales up 11% $50 overall despite flat industry trend 20.0% $ in Millions $40  Healthcare sales down 9% 15.0% M $30  EBIT margin decline from 10.3% to 10.3% 8.4% 10.0% 8.4% $20  Selling price increases were $10 5.0% 5 0% more than offset by higher raw material and freight costs $0 0.0% Q2 '10 Q2 '11 Sales Margin Growth in foodservice market Higher raw material and freight costs mitigated by selling price 10
  • 11. Strong Balance Sheet g Debt Maturity Schedule In millions $500  Cash on Hand of $99M $369 Available Under   Revolving Credit Facility $400 Revolver at  6/30/11 availability of $369M $300  Acquisition of PDT in Germany for €80 to be funded with cash on hand and revolver $200 Senior  Notes   Debt to Cap ratio of 26% $249M $100 Senior  Drawn, $100 Notes  IRB & Other  Debt to EBITDA of 1.5 $149M LC, $31 $0 2012 2016 2018 2020 Well-positioned for further investment in acquisitions, new product development and capital expenditures 11
  • 12. Cash Flow by Quarter yQ $50 $40 $30 $ in Millions $20 $10 $0 -$10 $10 -$20 -$30 Q2 '10 Q3 '10 Q4 '10 Q1 '11 Q2 '11 Operating Cash Flow Capital Expenditures Free Cash Flow Q2 '10 10 Q3 '10 10 Q4 '10 10 Q1 '11 11 Q2 '11 11 Operating Cash Flow $37.4 $41.9 $45.0 ($0.3) $14.0 Capital Expenditures (23.2) (15.2) (17.8) (16.9) (16.9) Free Cash Flow 14.2 26.7 27.2 (17.2) (2.9) Cash flow impacted by sales growth; 81% global growth in Q2 with Hawk 12
  • 13. Working Capital as a % of Net Sales 32.0% 30.0% 28.0% 26.0% 24.0% 22.0% 20.0% Q1 '09 Q2 '09 Q3 '09 Q4 '09 Q1 '10 Q2 '10 Q3 '10 Q4 '10 Q1 '11 Q2 '11 WC as a % of Net Sales 30.4% 26.4% 25.1% 24.9% 23.5% 21.4% 21.6% 22.0% 23.4% 21.7% Working Capital reflects average of quarter ending Receivables plus Inventory less Accounts Payable. % of Net Sales calculated using average Working Capital over annualized year-to-date Net Sales. Managing working capital on hi h sales volume M i ki it l higher l l 13
  • 14. Q Q & A 14
  • 15. Carlisle 2011 Outlook  Sales growth from Hawk & PDT acquisitions and segment organic growth totaling mid-twenty percent range  Continued margin improvement, primarily from Brake & Friction and Interconnect Technologies  Cash conversion expected to be greater than 100% for the year ( (Ratio of Free Cash Flow before Dividends to Net Income) )  Corporate Expense - $41M  Depreciation & Amortization - $93M  Interest Expense - $21M  Tax Rate – 33%  Capital Expenditures - $75M 15