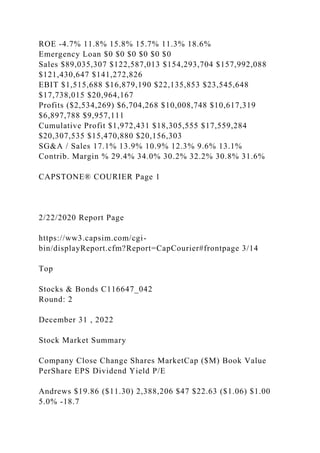
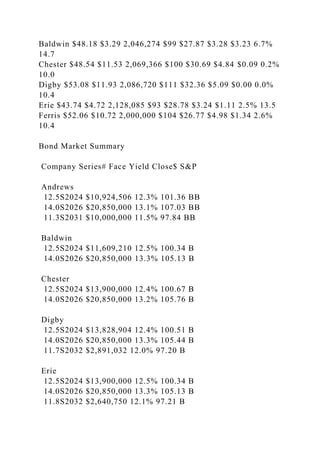
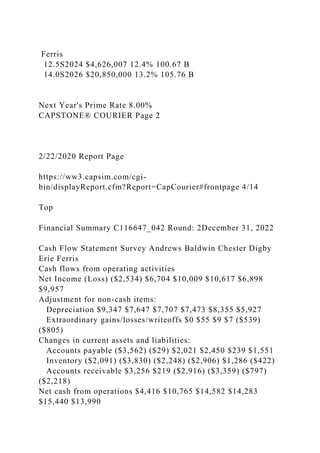
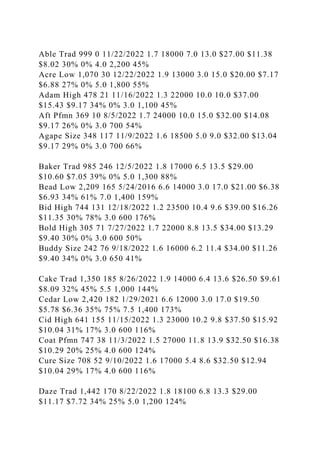
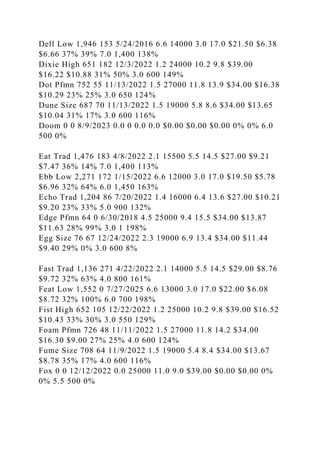
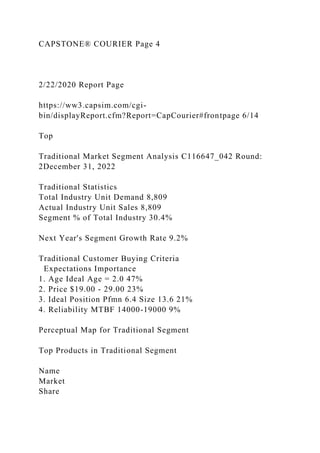
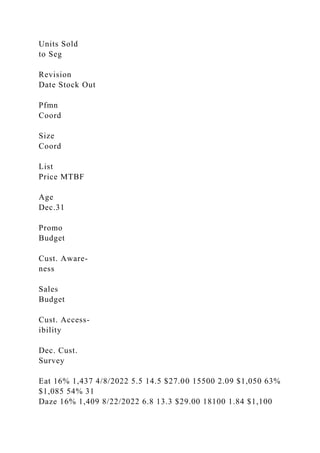
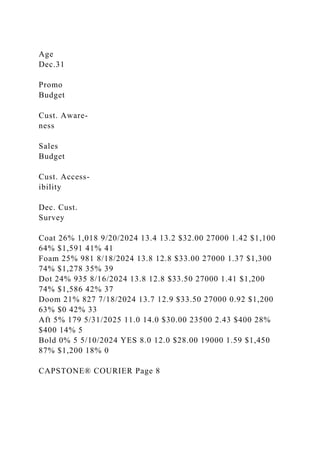
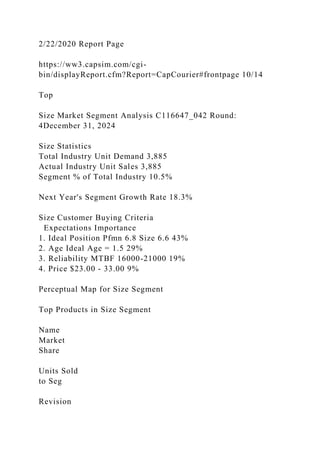
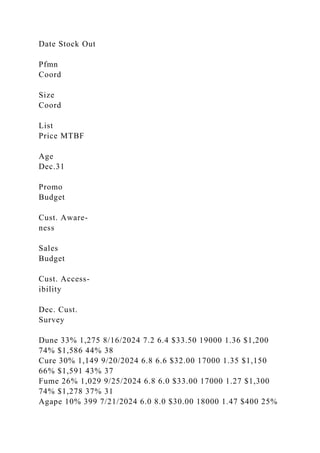
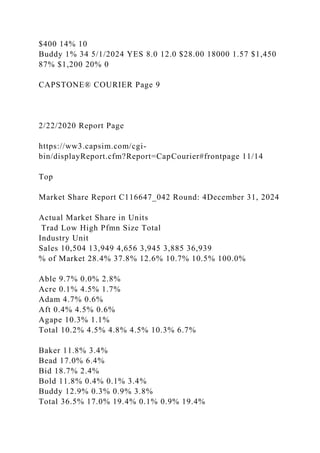
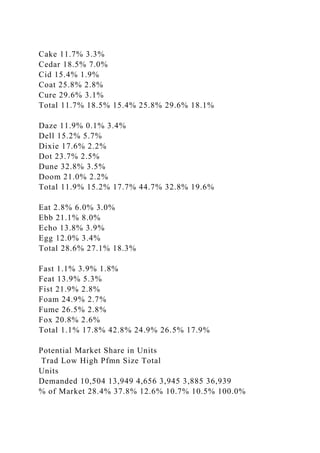
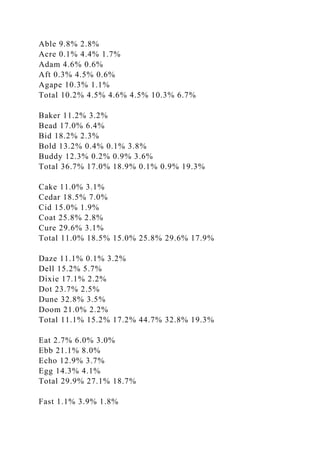
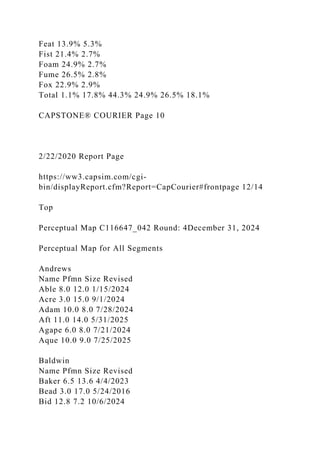
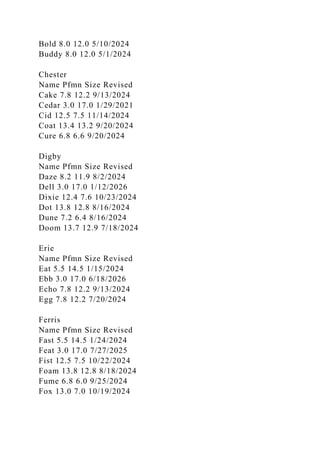
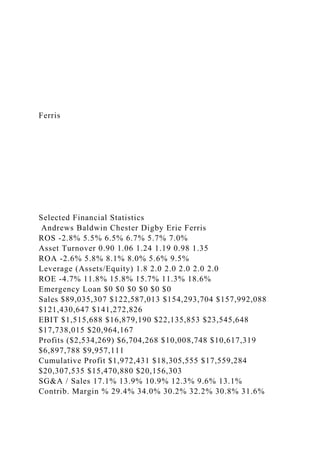
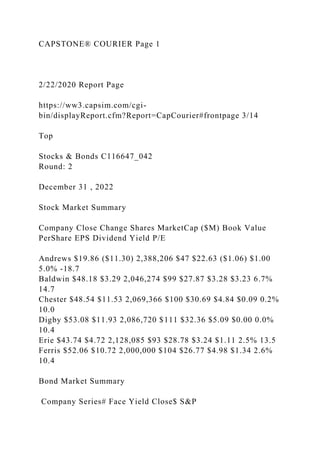
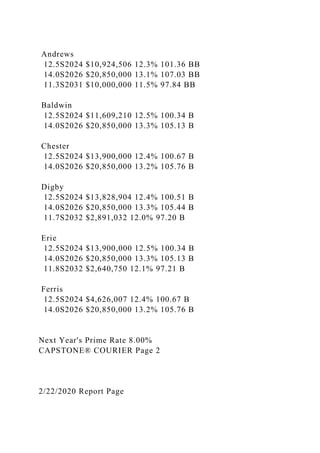
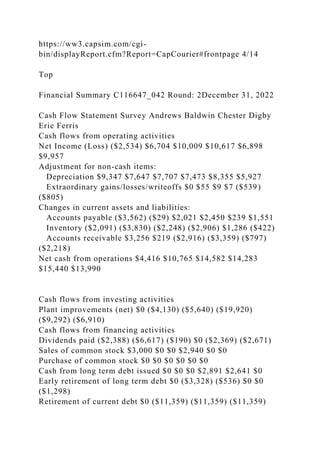
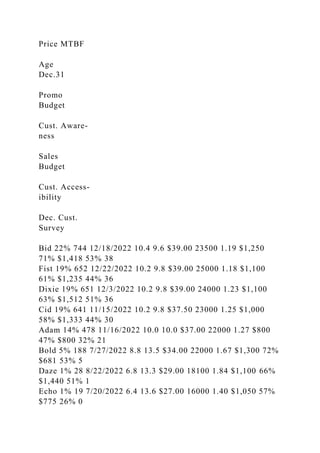
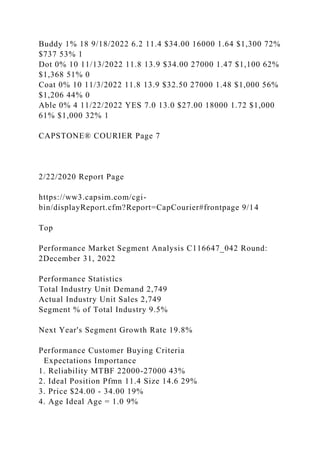
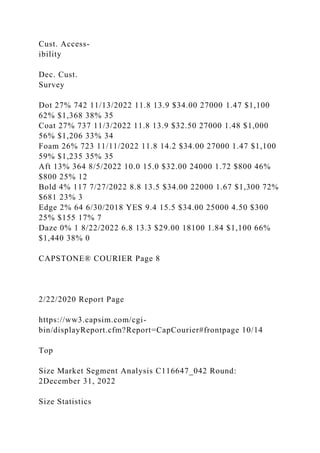
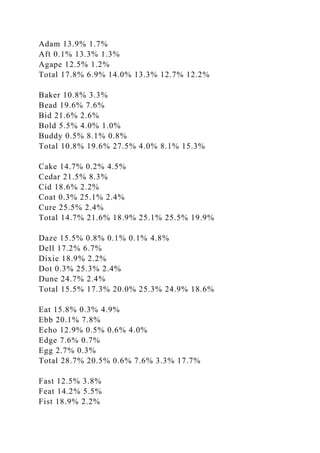
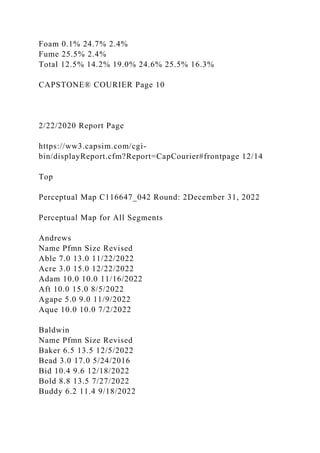
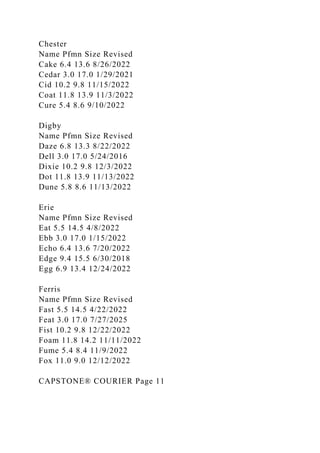
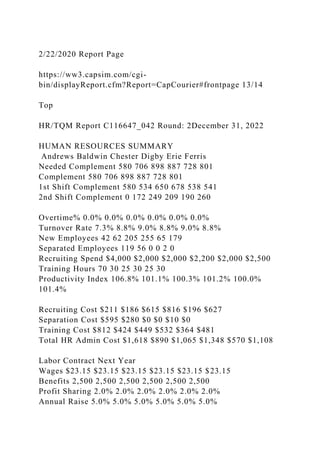
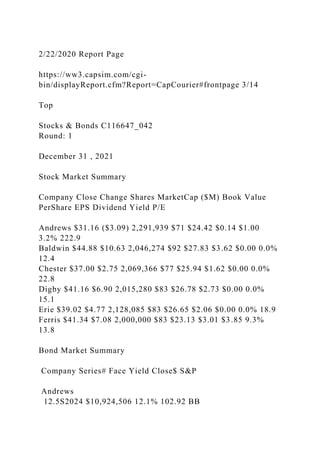
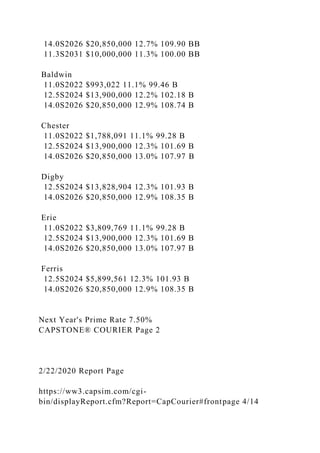
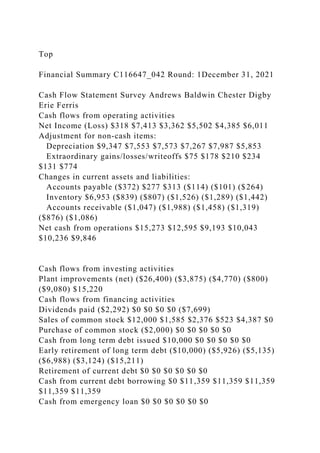
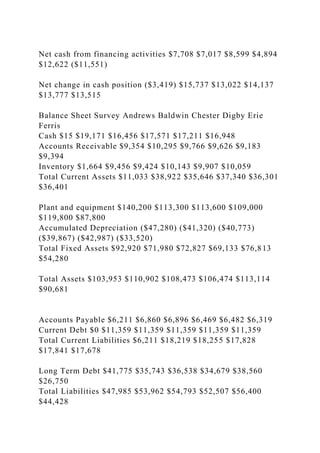
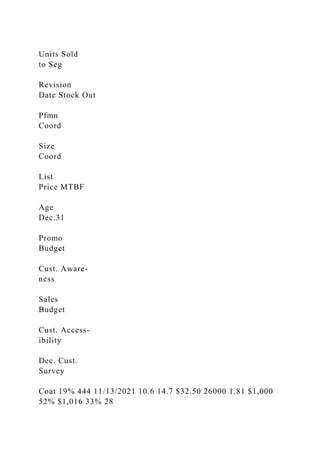
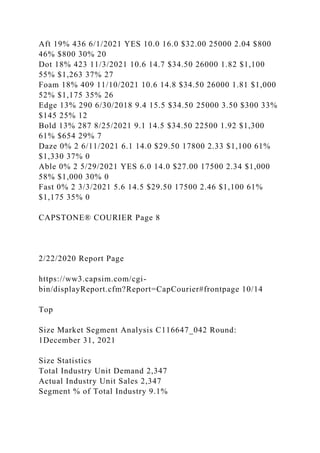
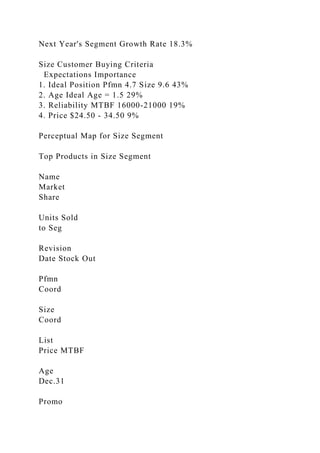
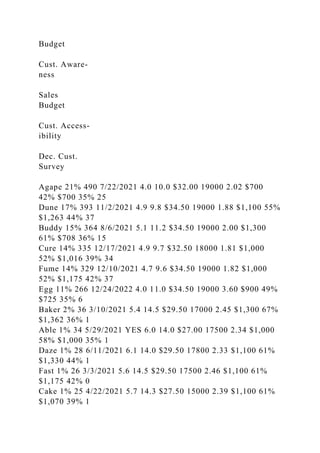
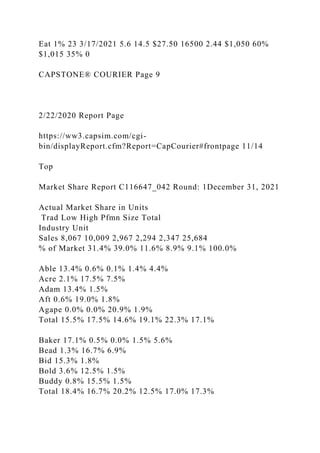
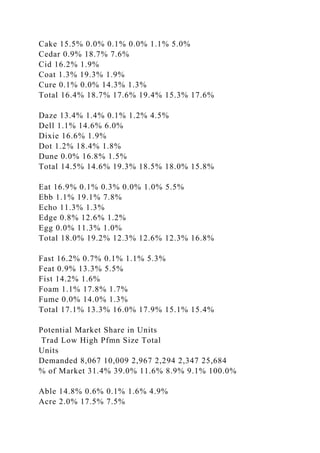
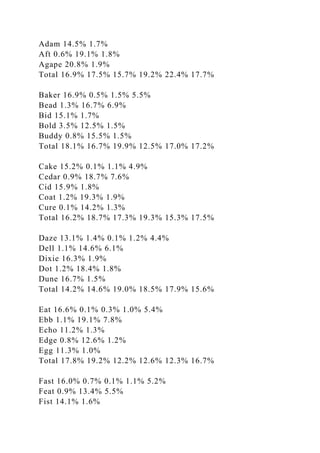
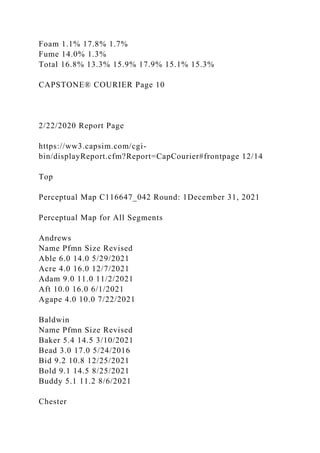
2/22/2020 Report Page
https://ww3.capsim.com/cgi-
bin/displayReport.cfm?Report=CapCourier#frontpage 1/14
Page 1 Front Page
Page 2 Stocks & Bonds
Page 3 Financial Summary
Page 4 Production Analysis
Page 5 Traditional Segment Analysis
Page 6 Low End Segment Analysis
Page 7 High End Segment Analysis
Page 8 Performance Segment Analysis
Page 9 Size Segment Analysis
Page 10 Market Share
Page 11 Perceptual Map
Page 12 HR/TQM Report
PRINT
2/22/2020 Report Page
https://ww3.capsim.com/cgi-
bin/displayReport.cfm?Report=CapCourier#frontpage 2/14
Top
Round: 2
Dec. 31, 2022
Chen m
C116647_042
Andrews
Manling Chen
Baldwin
Chester
Digby
Erie
Ferris
Selected Financial Statistics
Andrews Baldwin Chester Digby Erie Ferris
ROS -2.8% 5.5% 6.5% 6.7% 5.7% 7.0%
Asset Turnover 0.90 1.06 1.24 1.19 0.98 1.35
ROA -2.6% 5.8% 8.1% 8.0% 5.6% 9.5%
Leverage (Assets/Equity) 1.8 2.0 2.0 2.0 2.0 2.0
ROE -4.7% 11.8% 15.8% 15.7% 11.3% 18.6%
Emergency Loan $0 $0 $0 $0 $0 $0
Sales $89,035,307 $122,587,013 $154,293,704 $157,992,088
$121,430,647 $141,272,826
EBIT $1,515,688 $16,879,190 $22,135,853 $23,545,648
$17,738,015 $20,964,167
Profits ($2,534,269) $6,704,268 $10,008,748 $10,617,319
$6,897,788 $9,957,111
Cumulative Profit $1,972,431 $18,305,555 $17,559,284
$20,307,535 $15,470,880 $20,156,303
SG&A / Sales 17.1% 13.9% 10.9% 12.3% 9.6% 13.1%
Contrib. Margin % 29.4% 34.0% 30.2% 32.2% 30.8% 31.6%
CAPSTONE® COURIER Page 1
2/22/2020 Report Page
https://ww3.capsim.com/cgi-
bin/displayReport.cfm?Report=CapCourier#frontpage 3/14
Top
Stocks & Bonds C116647_042
Round: 2
December 31 , 2022
Stock Market Summary
Company Close Change Shares MarketCap ($M) Book Value
PerShare EPS Dividend Yield P/E
Andrews $19.86 ($11.30) 2,388,206 $47 $22.63 ($1.06) $1.00
5.0% -18.7
Baldwin $48.18 $3.29 2,046,274 $99 $27.87 $3.28 $3.23 6.7%
14.7
Chester $48.54 $11.53 2,069,366 $100 $30.69 $4.84 $0.09 0.2%
10.0
Digby $53.08 $11.93 2,086,720 $111 $32.36 $5.09 $0.00 0.0%
10.4
Erie $43.74 $4.72 2,128,085 $93 $28.78 $3.24 $1.11 2.5% 13.5
Ferris $52.06 $10.72 2,000,000 $104 $26.77 $4.98 $1.34 2.6%
10.4
Bond Market Summary
Company Series# Face Yield Close$ S&P
Andrews
12.5S2024 $10,924,506 12.3% 101.36 BB
14.0S2026 $20,850,000 13.1% 107.03 BB
11.3S2031 $10,000,000 11.5% 97.84 BB
Baldwin
12.5S2024 $11,609,210 12.5% 100.34 B
14.0S2026 $20,850,000 13.3% 105.13 B
Chester
12.5S2024 $13,900,000 12.4% 100.67 B
14.0S2026 $20,850,000 13.2% 105.76 B
Digby
12.5S2024 $13,828,904 12.4% 100.51 B
14.0S2026 $20,850,000 13.3% 105.44 B
11.7S2032 $2,891,032 12.0% 97.20 B
Erie
12.5S2024 $13,900,000 12.5% 100.34 B
14.0S2026 $20,850,000 13.3% 105.13 B
11.8S2032 $2,640,750 12.1% 97.21 B
Ferris
12.5S2024 $4,626,007 12.4% 100.67 B
14.0S2026 $20,850,000 13.2% 105.76 B
Next Year's Prime Rate 8.00%
CAPSTONE® COURIER Page 2
2/22/2020 Report Page
https://ww3.capsim.com/cgi-
bin/displayReport.cfm?Report=CapCourier#frontpage 4/14
Top
Financial Summary C116647_042 Round: 2December 31, 2022
Cash Flow Statement Survey Andrews Baldwin Chester Digby
Erie Ferris
Cash flows from operating activities
Net Income (Loss) ($2,534) $6,704 $10,009 $10,617 $6,898
$9,957
Adjustment for non-cash items:
Depreciation $9,347 $7,647 $7,707 $7,473 $8,355 $5,927
Extraordinary gains/losses/writeoffs $0 $55 $9 $7 ($539)
($805)
Changes in current assets and liabilities:
Accounts payable ($3,562) ($29) $2,021 $2,450 $239 $1,551
Inventory ($2,091) ($3,830) ($2,248) ($2,906) $1,286 ($422)
Accounts receivable $3,256 $219 ($2,916) ($3,359) ($797)
($2,218)
Net cash from operations $4,416 $10,765 $14,582 $14,283
$15,440 $13,990
Cash flows from investing activities
Plant improvements (net) $0 ($4,130) ($5,640) ($19,920)
($9,292) ($6,910)
Cash flows from financing activities
Dividends paid ($2,388) ($6,617) ($190) $0 ($2,369) ($2,671)
Sales of common stock $3,000 $0 $0 $2,940 $0 $0
Purchase of common stock $0 $0 $0 $0 $0 $0
Cash from long term debt issued $0 $0 $0 $2,891 $2,641 $0
Early retirement of long term debt $0 ($3,328) ($536) $0 $0
($1,298)
Retirement of current debt $0 ($11,359) ($11,359) ($11,359)
($11,359) ($11,359)
Cash from current debt borrowing $0 $19,454 $15,742 $18,370
$14,857 $17,822
Cash from emergency loan $0 $0 $0 $0 $0 $0
Net cash from financing activities $612 ($1,850) $3,658
$12,842 $3,771 $2,494
Net change in cash position $5,028 $4,785 $12,601 $7,205
$9,919 $9,574
Balance Sheet Survey Andrews Baldwin Chester Digby Erie
Ferris
Cash $5,043 $23,955 $29,056 $24,776 $27,130 $26,522
Accounts Receivable $6,098 $10,076 $12,682 $12,986 $9,981
$11,611
Inventory $3,755 $13,287 $11,672 $13,049 $8,621 $10,481
Total Current Assets $14,896 $47,318 $53,410 $50,810 $45,732
$48,614
Plant and equipment $140,200 $114,700 $115,600 $127,100
$125,318 $88,900
Accumulated Depreciation ($56,627) ($46,247) ($44,853)
($45,527) ($47,028) ($32,807)
Total Fixed Assets $83,573 $68,453 $70,747 $81,573 $78,290
$56,093
Total Assets $98,469 $115,771 $124,157 $132,384 $124,021
$104,708
Accounts Payable $2,649 $6,831 $8,917 $8,919 $6,721 $7,871
Current Debt $0 $19,454 $16,991 $18,370 $18,667 $17,822
Total Current Liabilities $2,649 $26,285 $25,908 $27,289
$25,388 $25,693
Long Term Debt $41,775 $32,459 $34,750 $37,570 $37,391
$25,476
Total Liabilities $44,424 $58,744 $60,658 $64,859 $62,778
$51,169
Common Stock $32,347 $19,945 $20,736 $21,823 $22,747
$18,360
Retained Earnings $21,699 $37,082 $42,763 $45,701 $38,496
$35,179
Total Equity $54,046 $57,027 $63,499 $67,525 $61,243 $53,539
Total Liabilities & Owners' Equity $98,469 $115,771 $124,157
$132,384 $124,021 $104,708
Income Statement Survey Andrews Baldwin Chester Digby Erie
Ferris
Sales $89,035 $122,587 $154,294 $157,992 $121,431 $141,273
Variable Costs (Labor, Material, Carry) $62,824 $80,872
$107,642 $107,179 $84,088 $96,596
Contribution Margin $26,211 $41,715 $46,652 $50,813 $37,343
$44,677
Depreciation $9,347 $7,647 $7,707 $7,473 $8,355 $5,927
SGA (R&D, Promo, Sales, Admin) $15,199 $17,085 $16,792
$19,496 $11,657 $18,572
Other (Fees, Writeoffs, TQM, Bonuses) $150 $104 $18 $298
($407) ($786)
EBIT $1,516 $16,879 $22,136 $23,546 $17,738 $20,964
Interest (Short term, Long term) $5,415 $6,354 $6,424 $6,878
$6,909 $5,333
Taxes ($1,365) $3,684 $5,499 $5,834 $3,790 $5,471
Profit Sharing $0 $137 $204 $217 $141 $203
Net Profit ($2,534) $6,704 $10,009 $10,617 $6,898 $9,957
CAPSTONE® COURIER Page 3
2/22/2020 Report Page
https://ww3.capsim.com/cgi-
bin/displayReport.cfm?Report=CapCourier#frontpage 5/14
Top
Production Analysis C116647_042 Round: 2December 31, 2022
Production Information
Name
Primary
Segment
Units
Sold
Unit
Inven
tory Revision Date
Age
Dec.31 MTBF
Pfmn
Coord
Size
Coord Price
Material
Cost
Labor
Cost
Contr.
Marg.
2nd Shift
&
Over-
time
Auto
mation
Next
Round
Capacity
Next
Round
Plant
Utiliz.
Able Trad 999 0 11/22/2022 1.7 18000 7.0 13.0 $27.00 $11.38
$8.02 30% 0% 4.0 2,200 45%
Acre Low 1,070 30 12/22/2022 1.9 13000 3.0 15.0 $20.00 $7.17
$6.88 27% 0% 5.0 1,800 55%
Adam High 478 21 11/16/2022 1.3 22000 10.0 10.0 $37.00
$15.43 $9.17 34% 0% 3.0 1,100 45%
Aft Pfmn 369 10 8/5/2022 1.7 24000 10.0 15.0 $32.00 $14.08
$9.17 26% 0% 3.0 700 54%
Agape Size 348 117 11/9/2022 1.6 18500 5.0 9.0 $32.00 $13.04
$9.17 29% 0% 3.0 700 66%
Baker Trad 985 246 12/5/2022 1.8 17000 6.5 13.5 $29.00
$10.60 $7.05 39% 0% 5.0 1,300 88%
Bead Low 2,209 165 5/24/2016 6.6 14000 3.0 17.0 $21.00 $6.38
$6.93 34% 61% 7.0 1,400 159%
Bid High 744 131 12/18/2022 1.2 23500 10.4 9.6 $39.00 $16.26
$11.35 30% 78% 3.0 600 176%
Bold High 305 71 7/27/2022 1.7 22000 8.8 13.5 $34.00 $13.29
$9.40 30% 0% 3.0 600 50%
Buddy Size 242 76 9/18/2022 1.6 16000 6.2 11.4 $34.00 $11.26
$9.40 34% 0% 3.0 650 41%
Cake Trad 1,350 185 8/26/2022 1.9 14000 6.4 13.6 $26.50 $9.61
$8.09 32% 45% 5.5 1,000 144%
Cedar Low 2,420 182 1/29/2021 6.6 12000 3.0 17.0 $19.50
$5.78 $6.36 35% 75% 7.5 1,400 173%
Cid High 641 155 11/15/2022 1.3 23000 10.2 9.8 $37.50 $15.92
$10.04 31% 17% 3.0 600 116%
Coat Pfmn 747 38 11/3/2022 1.5 27000 11.8 13.9 $32.50 $16.38
$10.29 20% 25% 4.0 600 124%
Cure Size 708 52 9/10/2022 1.6 17000 5.4 8.6 $32.50 $12.94
$10.04 29% 17% 4.0 600 116%
Daze Trad 1,442 170 8/22/2022 1.8 18100 6.8 13.3 $29.00
$11.17 $7.72 34% 25% 5.0 1,200 124%
Dell Low 1,946 153 5/24/2016 6.6 14000 3.0 17.0 $21.50 $6.38
$6.66 37% 39% 7.0 1,400 138%
Dixie High 651 182 12/3/2022 1.2 24000 10.2 9.8 $39.00
$16.22 $10.88 31% 50% 3.0 600 149%
Dot Pfmn 752 55 11/13/2022 1.5 27000 11.8 13.9 $34.00 $16.38
$10.29 23% 25% 3.0 650 124%
Dune Size 687 70 11/13/2022 1.5 19000 5.8 8.6 $34.00 $13.65
$10.04 31% 17% 3.0 600 116%
Doom 0 0 8/9/2023 0.0 0 0.0 0.0 $0.00 $0.00 $0.00 0% 0% 6.0
500 0%
Eat Trad 1,476 183 4/8/2022 2.1 15500 5.5 14.5 $27.00 $9.21
$7.47 36% 14% 7.0 1,400 113%
Ebb Low 2,271 172 1/15/2022 6.6 12000 3.0 17.0 $19.50 $5.78
$6.96 32% 64% 6.0 1,450 163%
Echo Trad 1,204 86 7/20/2022 1.4 16000 6.4 13.6 $27.00 $10.21
$9.20 23% 33% 5.0 900 132%
Edge Pfmn 64 0 6/30/2018 4.5 25000 9.4 15.5 $34.00 $13.87
$11.63 28% 99% 3.0 1 198%
Egg Size 76 67 12/24/2022 2.3 19000 6.9 13.4 $34.00 $11.44
$9.40 29% 0% 3.0 600 8%
Fast Trad 1,136 271 4/22/2022 2.1 14000 5.5 14.5 $29.00 $8.76
$9.72 32% 63% 4.0 800 161%
Feat Low 1,552 0 7/27/2025 6.6 13000 3.0 17.0 $22.00 $6.08
$8.72 32% 100% 6.0 700 198%
Fist High 652 105 12/22/2022 1.2 25000 10.2 9.8 $39.00 $16.52
$10.43 33% 30% 3.0 550 129%
Foam Pfmn 726 48 11/11/2022 1.5 27000 11.8 14.2 $34.00
$16.30 $9.00 27% 25% 4.0 600 124%
Fume Size 708 64 11/9/2022 1.5 19000 5.4 8.4 $34.00 $13.67
$8.78 35% 17% 4.0 600 116%
Fox 0 0 12/12/2022 0.0 25000 11.0 9.0 $39.00 $0.00 $0.00 0%
0% 5.5 500 0%
CAPSTONE® COURIER Page 4
2/22/2020 Report Page
https://ww3.capsim.com/cgi-
bin/displayReport.cfm?Report=CapCourier#frontpage 6/14
Top
Traditional Market Segment Analysis C116647_042 Round:
2December 31, 2022
Traditional Statistics
Total Industry Unit Demand 8,809
Actual Industry Unit Sales 8,809
Segment % of Total Industry 30.4%
Next Year's Segment Growth Rate 9.2%
Traditional Customer Buying Criteria
Expectations Importance
1. Age Ideal Age = 2.0 47%
2. Price $19.00 - 29.00 23%
3. Ideal Position Pfmn 6.4 Size 13.6 21%
4. Reliability MTBF 14000-19000 9%
Perceptual Map for Traditional Segment
Top Products in Traditional Segment
Name
Market
Share
Units Sold
to Seg
Revision
Date Stock Out
Pfmn
Coord
Size
Coord
List
Price MTBF
Age
Dec.31
Promo
Budget
Cust. Aware-
ness
Sales
Budget
Cust. Access-
ibility
Dec. Cust.
Survey
Eat 16% 1,437 4/8/2022 5.5 14.5 $27.00 15500 2.09 $1,050 63%
$1,085 54% 31
Daze 16% 1,409 8/22/2022 6.8 13.3 $29.00 18100 1.84 $1,100
66% $1,440 53% 36
Cake 15% 1,329 8/26/2022 6.4 13.6 $26.50 14000 1.87 $1,100
66% $1,270 47% 35
Echo 13% 1,170 7/20/2022 6.4 13.6 $27.00 16000 1.40 $1,050
57% $775 54% 29
Fast 13% 1,136 4/22/2022 5.5 14.5 $29.00 14000 2.08 $900
59% $1,235 48% 24
Baker 11% 985 12/5/2022 6.5 13.5 $29.00 17000 1.76 $1,300
76% $1,418 53% 37
Able 11% 984 11/22/2022 YES 7.0 13.0 $27.00 18000 1.72
$1,000 61% $1,000 50% 33
Acre 4% 349 12/22/2022 3.0 15.0 $20.00 13000 1.92 $800 48%
$800 50% 5
Aft 0% 6 8/5/2022 10.0 15.0 $32.00 24000 1.72 $800 46% $800
50% 1
Bead 0% 1 5/24/2016 3.0 17.0 $21.00 14000 6.60 $1,300 74%
$1,418 53% 0
Dell 0% 1 5/24/2016 3.0 17.0 $21.50 14000 6.60 $1,100 64%
$1,512 53% 0
CAPSTONE® COURIER Page 5
2/22/2020 Report Page
https://ww3.capsim.com/cgi-
bin/displayReport.cfm?Report=CapCourier#frontpage 7/14
Top
Low End Market Segment Analysis C116647_042 Round:
2December 31, 2022
Low End Statistics
Total Industry Unit Demand 11,180
Actual Industry Unit Sales 11,180
Segment % of Total Industry 38.6%
Next Year's Segment Growth Rate 11.7%
Low End Customer Buying Criteria
Expectations Importance
1. Price $14.00 - 24.00 53%
2. Age Ideal Age = 7.0 24%
3. Ideal Position Pfmn 2.7 Size 17.3 16%
4. Reliability MTBF 12000-17000 7%
Perceptual Map for Low End Segment
Top Products in Low End Segment
Name
Market
Share
Units Sold
to Seg
Revision
Date Stock Out
Pfmn
Coord
Size
Coord
List
Price MTBF
Age
Dec.31
Promo
Budget
Cust. Aware-
ness
Sales
Budget
Cust. Access-
ibility
Dec. Cust.
Survey
Cedar 22% 2,419 1/29/2021 3.0 17.0 $19.50 12000 6.60 $1,100
64% $1,333 40% 25
Ebb 20% 2,270 1/15/2022 3.0 17.0 $19.50 12000 6.60 $1,050
62% $1,085 36% 23
Bead 20% 2,208 5/24/2016 3.0 17.0 $21.00 14000 6.60 $1,300
74% $1,418 40% 23
Dell 17% 1,945 5/24/2016 3.0 17.0 $21.50 14000 6.60 $1,100
64% $1,512 42% 20
Feat 14% 1,551 7/27/2025 YES 3.0 17.0 $22.00 13000 6.60
$1,100 64% $1,235 36% 17
Acre 6% 722 12/22/2022 3.0 15.0 $20.00 13000 1.92 $800 48%
$800 27% 5
Eat 0% 39 4/8/2022 5.5 14.5 $27.00 15500 2.09 $1,050 63%
$1,085 36% 1
Cake 0% 19 8/26/2022 6.4 13.6 $26.50 14000 1.87 $1,100 66%
$1,270 40% 0
Able 0% 6 11/22/2022 YES 7.0 13.0 $27.00 18000 1.72 $1,000
61% $1,000 27% 0
CAPSTONE® COURIER Page 6
2/22/2020 Report Page
https://ww3.capsim.com/cgi-
bin/displayReport.cfm?Report=CapCourier#frontpage 8/14
Top
High End Market Segment Analysis C116647_042 Round:
2December 31, 2022
High End Statistics
Total Industry Unit Demand 3,448
Actual Industry Unit Sales 3,448
Segment % of Total Industry 11.9%
Next Year's Segment Growth Rate 16.2%
High End Customer Buying Criteria
Expectations Importance
1. Ideal Position Pfmn 10.7 Size 9.3 43%
2. Age Ideal Age = 0.0 29%
3. Reliability MTBF 20000-25000 19%
4. Price $29.00 - 39.00 9%
Perceptual Map for High End Segment
Top Products in High End Segment
Name
Market
Share
Units Sold
to Seg
Revision
Date Stock Out
Pfmn
Coord
Size
Coord
List
Price MTBF
Age
Dec.31
Promo
Budget
Cust. Aware-
ness
Sales
Budget
Cust. Access-
ibility
Dec. Cust.
Survey
Bid 22% 744 12/18/2022 10.4 9.6 $39.00 23500 1.19 $1,250
71% $1,418 53% 38
Fist 19% 652 12/22/2022 10.2 9.8 $39.00 25000 1.18 $1,100
61% $1,235 44% 36
Dixie 19% 651 12/3/2022 10.2 9.8 $39.00 24000 1.23 $1,100
63% $1,512 51% 36
Cid 19% 641 11/15/2022 10.2 9.8 $37.50 23000 1.25 $1,000
58% $1,333 44% 30
Adam 14% 478 11/16/2022 10.0 10.0 $37.00 22000 1.27 $800
47% $800 32% 21
Bold 5% 188 7/27/2022 8.8 13.5 $34.00 22000 1.67 $1,300 72%
$681 53% 5
Daze 1% 28 8/22/2022 6.8 13.3 $29.00 18100 1.84 $1,100 66%
$1,440 51% 1
Echo 1% 19 7/20/2022 6.4 13.6 $27.00 16000 1.40 $1,050 57%
$775 26% 0
Buddy 1% 18 9/18/2022 6.2 11.4 $34.00 16000 1.64 $1,300 72%
$737 53% 1
Dot 0% 10 11/13/2022 11.8 13.9 $34.00 27000 1.47 $1,100 62%
$1,368 51% 0
Coat 0% 10 11/3/2022 11.8 13.9 $32.50 27000 1.48 $1,000 56%
$1,206 44% 0
Able 0% 4 11/22/2022 YES 7.0 13.0 $27.00 18000 1.72 $1,000
61% $1,000 32% 1
CAPSTONE® COURIER Page 7
2/22/2020 Report Page
https://ww3.capsim.com/cgi-
bin/displayReport.cfm?Report=CapCourier#frontpage 9/14
Top
Performance Market Segment Analysis C116647_042 Round:
2December 31, 2022
Performance Statistics
Total Industry Unit Demand 2,749
Actual Industry Unit Sales 2,749
Segment % of Total Industry 9.5%
Next Year's Segment Growth Rate 19.8%
Performance Customer Buying Criteria
Expectations Importance
1. Reliability MTBF 22000-27000 43%
2. Ideal Position Pfmn 11.4 Size 14.6 29%
3. Price $24.00 - 34.00 19%
4. Age Ideal Age = 1.0 9%
Perceptual Map for Performance Segment
Top Products in Performance Segment
Name
Market
Share
Units Sold
to Seg
Revision
Date Stock Out
Pfmn
Coord
Size
Coord
List
Price MTBF
Age
Dec.31
Promo
Budget
Cust. Aware-
ness
Sales
Budget
Cust. Access-
ibility
Dec. Cust.
Survey
Dot 27% 742 11/13/2022 11.8 13.9 $34.00 27000 1.47 $1,100
62% $1,368 38% 35
Coat 27% 737 11/3/2022 11.8 13.9 $32.50 27000 1.48 $1,000
56% $1,206 33% 34
Foam 26% 723 11/11/2022 11.8 14.2 $34.00 27000 1.47 $1,100
59% $1,235 35% 35
Aft 13% 364 8/5/2022 10.0 15.0 $32.00 24000 1.72 $800 46%
$800 25% 12
Bold 4% 117 7/27/2022 8.8 13.5 $34.00 22000 1.67 $1,300 72%
$681 23% 3
Edge 2% 64 6/30/2018 YES 9.4 15.5 $34.00 25000 4.50 $300
25% $155 17% 7
Daze 0% 1 8/22/2022 6.8 13.3 $29.00 18100 1.84 $1,100 66%
$1,440 38% 0
CAPSTONE® COURIER Page 8
2/22/2020 Report Page
https://ww3.capsim.com/cgi-
bin/displayReport.cfm?Report=CapCourier#frontpage 10/14
Top
Size Market Segment Analysis C116647_042 Round:
2December 31, 2022
Size Statistics
Total Industry Unit Demand 2,776
Actual Industry Unit Sales 2,776
Segment % of Total Industry 9.6%
Next Year's Segment Growth Rate 18.3%
Size Customer Buying Criteria
Expectations Importance
1. Ideal Position Pfmn 5.4 Size 8.6 43%
2. Age Ideal Age = 1.5 29%
3. Reliability MTBF 16000-21000 19%
4. Price $24.00 - 34.00 9%
Perceptual Map for Size Segment
Top Products in Size Segment
Name
Market
Share
Units Sold
to Seg
Revision
Date Stock Out
Pfmn
Coord
Size
Coord
List
Price MTBF
Age
Dec.31
Promo
Budget
Cust. Aware-
ness
Sales
Budget
Cust. Access-
ibility
Dec. Cust.
Survey
Fume 26% 708 11/9/2022 5.4 8.4 $34.00 19000 1.48 $1,100
59% $1,235 39% 39
Cure 26% 708 9/10/2022 5.4 8.6 $32.50 17000 1.56 $1,000 56%
$1,206 37% 33
Dune 25% 687 11/13/2022 5.8 8.6 $34.00 19000 1.50 $1,100
62% $1,368 42% 39
Agape 13% 348 11/9/2022 5.0 9.0 $32.00 18500 1.58 $700 40%
$700 27% 26
Buddy 8% 225 9/18/2022 6.2 11.4 $34.00 16000 1.64 $1,300
72% $737 28% 7
Egg 3% 75 12/24/2022 6.9 13.4 $34.00 19000 2.30 $1,050 56%
$775 29% 0
Echo 1% 16 7/20/2022 6.4 13.6 $27.00 16000 1.40 $1,050 57%
$775 29% 0
Able 0% 4 11/22/2022 YES 7.0 13.0 $27.00 18000 1.72 $1,000
61% $1,000 27% 0
Daze 0% 4 8/22/2022 6.8 13.3 $29.00 18100 1.84 $1,100 66%
$1,440 42% 0
Cake 0% 1 8/26/2022 6.4 13.6 $26.50 14000 1.87 $1,100 66%
$1,270 37% 0
CAPSTONE® COURIER Page 9
2/22/2020 Report Page
https://ww3.capsim.com/cgi-
bin/displayReport.cfm?Report=CapCourier#frontpage 11/14
Top
Market Share Report C116647_042 Round: 2December 31, 2022
Actual Market Share in Units
Trad Low High Pfmn Size Total
Industry Unit
Sales 8,809 11,180 3,448 2,749 2,776 28,961
% of Market 30.4% 38.6% 11.9% 9.5% 9.6% 100.0%
Able 11.2% 0.1% 0.1% 0.0% 0.1% 3.5%
Acre 4.0% 6.5% 3.7%
Adam 13.9% 1.6%
Aft 0.1% 13.2% 1.3%
Agape 12.5% 1.2%
Total 15.2% 6.5% 14.0% 13.3% 12.7% 11.3%
Baker 11.2% 0.0% 3.4%
Bead 0.0% 19.8% 7.6%
Bid 21.6% 2.6%
Bold 5.5% 4.3% 1.1%
Buddy 0.5% 8.1% 0.8%
Total 11.2% 19.8% 27.5% 4.3% 8.1% 15.5%
Cake 15.1% 0.2% 0.1% 4.7%
Cedar 0.0% 21.6% 8.4%
Cid 18.6% 2.2%
Coat 0.3% 26.8% 2.6%
Cure 25.5% 2.4%
Total 15.1% 21.8% 18.9% 26.8% 25.6% 20.3%
Daze 16.0% 0.8% 0.1% 0.1% 5.0%
Dell 0.0% 17.4% 6.7%
Dixie 18.9% 2.3%
Dot 0.3% 27.0% 2.6%
Dune 24.7% 2.4%
Total 16.0% 17.4% 20.0% 27.0% 24.9% 18.9%
Eat 16.3% 0.3% 5.1%
Ebb 0.0% 20.3% 7.8%
Echo 13.3% 0.5% 0.6% 4.2%
Edge 2.3% 0.2%
Egg 0.0% 2.7% 0.3%
Total 29.6% 20.7% 0.6% 2.3% 3.3% 17.6%
Fast 12.9% 3.9%
Feat 0.0% 13.9% 5.4%
Fist 18.9% 2.3%
Foam 0.1% 26.3% 2.5%
Fume 25.5% 2.5%
Total 12.9% 13.9% 19.0% 26.3% 25.5% 16.5%
Potential Market Share in Units
Trad Low High Pfmn Size Total
Units
Demanded 8,809 11,180 3,448 2,749 2,776 28,961
% of Market 30.4% 38.6% 11.9% 9.5% 9.6% 100.0%
Able 13.5% 0.1% 0.2% 0.2% 4.2%
Acre 4.1% 6.8% 3.9%
Adam 13.9% 1.7%
Aft 0.1% 13.3% 1.3%
Agape 12.5% 1.2%
Total 17.8% 6.9% 14.0% 13.3% 12.7% 12.2%
Baker 10.8% 3.3%
Bead 19.6% 7.6%
Bid 21.6% 2.6%
Bold 5.5% 4.0% 1.0%
Buddy 0.5% 8.1% 0.8%
Total 10.8% 19.6% 27.5% 4.0% 8.1% 15.3%
Cake 14.7% 0.2% 4.5%
Cedar 21.5% 8.3%
Cid 18.6% 2.2%
Coat 0.3% 25.1% 2.4%
Cure 25.5% 2.4%
Total 14.7% 21.6% 18.9% 25.1% 25.5% 19.9%
Daze 15.5% 0.8% 0.1% 0.1% 4.8%
Dell 17.2% 6.7%
Dixie 18.9% 2.2%
Dot 0.3% 25.3% 2.4%
Dune 24.7% 2.4%
Total 15.5% 17.3% 20.0% 25.3% 24.9% 18.6%
Eat 15.8% 0.3% 4.9%
Ebb 20.1% 7.8%
Echo 12.9% 0.5% 0.6% 4.0%
Edge 7.6% 0.7%
Egg 2.7% 0.3%
Total 28.7% 20.5% 0.6% 7.6% 3.3% 17.7%
Fast 12.5% 3.8%
Feat 14.2% 5.5%
Fist 18.9% 2.2%
Foam 0.1% 24.7% 2.4%
Fume 25.5% 2.4%
Total 12.5% 14.2% 19.0% 24.6% 25.5% 16.3%
CAPSTONE® COURIER Page 10
2/22/2020 Report Page
https://ww3.capsim.com/cgi-
bin/displayReport.cfm?Report=CapCourier#frontpage 12/14
Top
Perceptual Map C116647_042 Round: 2December 31, 2022
Perceptual Map for All Segments
Andrews
Name Pfmn Size Revised
Able 7.0 13.0 11/22/2022
Acre 3.0 15.0 12/22/2022
Adam 10.0 10.0 11/16/2022
Aft 10.0 15.0 8/5/2022
Agape 5.0 9.0 11/9/2022
Aque 10.0 10.0 7/2/2022
Baldwin
Name Pfmn Size Revised
Baker 6.5 13.5 12/5/2022
Bead 3.0 17.0 5/24/2016
Bid 10.4 9.6 12/18/2022
Bold 8.8 13.5 7/27/2022
Buddy 6.2 11.4 9/18/2022
Chester
Name Pfmn Size Revised
Cake 6.4 13.6 8/26/2022
Cedar 3.0 17.0 1/29/2021
Cid 10.2 9.8 11/15/2022
Coat 11.8 13.9 11/3/2022
Cure 5.4 8.6 9/10/2022
Digby
Name Pfmn Size Revised
Daze 6.8 13.3 8/22/2022
Dell 3.0 17.0 5/24/2016
Dixie 10.2 9.8 12/3/2022
Dot 11.8 13.9 11/13/2022
Dune 5.8 8.6 11/13/2022
Erie
Name Pfmn Size Revised
Eat 5.5 14.5 4/8/2022
Ebb 3.0 17.0 1/15/2022
Echo 6.4 13.6 7/20/2022
Edge 9.4 15.5 6/30/2018
Egg 6.9 13.4 12/24/2022
Ferris
Name Pfmn Size Revised
Fast 5.5 14.5 4/22/2022
Feat 3.0 17.0 7/27/2025
Fist 10.2 9.8 12/22/2022
Foam 11.8 14.2 11/11/2022
Fume 5.4 8.4 11/9/2022
Fox 11.0 9.0 12/12/2022
CAPSTONE® COURIER Page 11
2/22/2020 Report Page
https://ww3.capsim.com/cgi-
bin/displayReport.cfm?Report=CapCourier#frontpage 13/14
Top
HR/TQM Report C116647_042 Round: 2December 31, 2022
HUMAN RESOURCES SUMMARY
Andrews Baldwin Chester Digby Erie Ferris
Needed Complement 580 706 898 887 728 801
Complement 580 706 898 887 728 801
1st Shift Complement 580 534 650 678 538 541
2nd Shift Complement 0 172 249 209 190 260
Overtime% 0.0% 0.0% 0.0% 0.0% 0.0% 0.0%
Turnover Rate 7.3% 8.8% 9.0% 8.8% 9.0% 8.8%
New Employees 42 62 205 255 65 179
Separated Employees 119 56 0 0 2 0
Recruiting Spend $4,000 $2,000 $2,000 $2,200 $2,000 $2,500
Training Hours 70 30 25 30 25 30
Productivity Index 106.8% 101.1% 100.3% 101.2% 100.0%
101.4%
Recruiting Cost $211 $186 $615 $816 $196 $627
Separation Cost $595 $280 $0 $0 $10 $0
Training Cost $812 $424 $449 $532 $364 $481
Total HR Admin Cost $1,618 $890 $1,065 $1,348 $570 $1,108
Labor Contract Next Year
Wages $23.15 $23.15 $23.15 $23.15 $23.15 $23.15
Benefits 2,500 2,500 2,500 2,500 2,500 2,500
Profit Sharing 2.0% 2.0% 2.0% 2.0% 2.0% 2.0%
Annual Raise 5.0% 5.0% 5.0% 5.0% 5.0% 5.0%
Starting Negotiation Position
Wages
Benefits
Profit Sharing
Annual Raise
Ceiling Negotiation Position
Wages
Benefits
Profit Sharing
Annual Raise
Adjusted Labor Demands
Wages
Benefits
Profit Sharing
Annual Raise
Strike Days
TQM SUMMARY
Andrews Baldwin Chester Digby Erie Ferris
Process Mgt Budgets Last Year
CPI Systems $0 $0 $0 $0 $0 $0
Vendor/JIT $0 $0 $0 $0 $0 $0
Quality Initiative Training $0 $0 $0 $0 $0 $0
Channel Support Systems $0 $0 $0 $0 $0 $0
Concurrent Engineering $0 $0 $0 $0 $0 $0
UNEP Green Programs $0 $0 $0 $0 $0 $0
TQM Budgets Last Year
Benchmarking $0 $0 $0 $0 $0 $0
Quality Function Deployment Effort $0 $0 $0 $0 $0 $0
CCE/6 Sigma Training $0 $0 $0 $0 $0 $0
GEMI TQEM Sustainability Initiatives $0 $0 $0 $0 $0 $0
Total Expenditures $0 $0 $0 $0 $0 $0
Cumulative Impacts
Material Cost Reduction 0.00% 0.00% 0.00% 0.00% 0.00%
0.00%
Labor Cost Reduction 0.00% 0.00% 0.00% 0.00% 0.00% 0.00%
Reduction R&D Cycle Time 0.00% 0.00% 0.00% 0.00% 0.00%
0.00%
Reduction Admin Costs 0.00% 0.00% 0.00% 0.00% 0.00%
0.00%
Demand Increase 0.00% 0.00% 0.00% 0.00% 0.00% 0.00%
CAPSTONE® COURIER Page 12
2/22/2020 Report Page
https://ww3.capsim.com/cgi-
bin/displayReport.cfm?Report=CapCourier#frontpage 14/14
2/22/2020 Report Page
https://ww3.capsim.com/cgi-
bin/displayReport.cfm?Report=CapCourier#frontpage 1/14
Page 1 Front Page
Page 2 Stocks & Bonds
Page 3 Financial Summary
Page 4 Production Analysis
Page 5 Traditional Segment Analysis
Page 6 Low End Segment Analysis
Page 7 High End Segment Analysis
Page 8 Performance Segment Analysis
Page 9 Size Segment Analysis
Page 10 Market Share
Page 11 Perceptual Map
Page 12 HR/TQM Report
PRINT
2/22/2020 Report Page
https://ww3.capsim.com/cgi-
bin/displayReport.cfm?Report=CapCourier#frontpage 2/14
Top
Round: 4
Dec. 31, 2024
Chen m
C116647_042
Andrews
Manling Chen
Baldwin
Chester
Digby
Erie
Ferris
Selected Financial Statistics
Andrews Baldwin Chester Digby Erie Ferris
ROS -16.0% 5.2% 7.5% 6.7% 5.0% 5.9%
Asset Turnover 0.64 1.09 1.01 1.13 0.86 1.20
ROA -10.1% 5.7% 7.6% 7.6% 4.3% 7.0%
Leverage (Assets/Equity) 2.9 2.1 2.1 2.1 2.1 2.0
ROE -29.4% 12.1% 15.7% 15.6% 9.0% 14.0%
Emergency Loan $15,505,273 $0 $0 $0 $0 $0
Sales $63,796,285 $190,006,170 $176,928,942 $213,364,729
$147,912,638 $196,521,262
EBIT ($6,973,832) $25,793,457 $31,027,057 $33,326,192
$21,959,720 $27,087,558
Profits ($10,190,507) $9,878,255 $13,251,989 $14,317,544
$7,329,463 $11,521,794
Cumulative Profit ($14,275,132) $36,133,559 $35,530,937
$40,501,439 $25,362,835 $37,973,297
SG&A / Sales 18.2% 8.9% 10.7% 10.8% 9.7% 10.4%
Contrib. Margin % 22.1% 31.4% 37.1% 34.0% 36.3% 31.2%
CAPSTONE® COURIER Page 1
2/22/2020 Report Page
https://ww3.capsim.com/cgi-
bin/displayReport.cfm?Report=CapCourier#frontpage 3/14
Top
Stocks & Bonds C116647_042
Round: 4
December 31 , 2024
Stock Market Summary
Company Close Change Shares MarketCap ($M) Book Value
PerShare EPS Dividend Yield P/E
Andrews $1.00 ($6.13) 2,287,518 $2 $15.15 ($4.45) $0.00 0.0%
-0.2
Baldwin $59.19 $5.99 2,243,914 $133 $36.32 $4.40 $0.00 0.0%
13.4
Chester $62.78 $13.06 2,134,506 $134 $39.67 $6.21 $0.00 0.0%
10.1
Digby $67.94 $14.14 2,164,189 $147 $42.38 $6.62 $0.00 0.0%
10.3
Erie $45.89 $4.70 2,387,461 $110 $34.22 $3.07 $0.00 0.0% 14.9
Ferris $58.97 $8.11 2,219,929 $131 $37.20 $5.19 $0.00 0.0%
11.4
Bond Market Summary
Company Series# Face Yield Close$ S&P
Andrews
14.0S2026 $20,850,000 14.2% 98.86 C
11.3S2031 $10,000,000 13.2% 85.73 C
13.1S2034 $2,000,000 14.3% 91.88 C
Baldwin
14.0S2026 $20,850,000 13.9% 100.66 CCC
12.3S2033 $1,245,546 13.2% 93.47 CCC
12.8S2034 $26,954,468 13.4% 95.76 CCC
Chester
14.0S2026 $20,850,000 13.9% 101.00 B
12.1S2033 $11,078,553 13.0% 93.43 B
13.0S2034 $15,883,727 13.3% 97.86 B
Digby
14.0S2026 $20,850,000 13.9% 101.00 B
11.7S2032 $2,891,032 12.7% 91.95 B
12.2S2033 $6,871,224 13.0% 93.93 B
13.0S2034 $18,502,490 13.3% 97.86 B
Erie
14.0S2026 $20,850,000 13.9% 100.83 CCC
11.8S2032 $2,640,750 12.8% 91.98 CCC
12.3S2033 $9,105,020 13.1% 93.95 CCC
13.0S2034 $22,180,769 13.4% 97.34 CCC
Ferris
14.0S2026 $20,850,000 13.8% 101.33 B
12.1S2033 $9,340,983 12.8% 94.40 B
13.0S2034 $12,986,272 13.1% 98.92 B
Next Year's Prime Rate 9.00%
CAPSTONE® COURIER Page 2
2/22/2020 Report Page
https://ww3.capsim.com/cgi-
bin/displayReport.cfm?Report=CapCourier#frontpage 4/14
Top
Financial Summary C116647_042 Round: 4December 31, 2024
Cash Flow Statement Survey Andrews Baldwin Chester Digby
Erie Ferris
Cash flows from operating activities
Net Income (Loss) ($10,191) $9,878 $13,252 $14,318 $7,329
$11,522
Adjustment for non-cash items:
Depreciation $9,347 $11,393 $10,993 $11,193 $11,973 $9,247
Extraordinary gains/losses/writeoffs $0 $0 $0 $0 $0 ($403)
Changes in current assets and liabilities:
Accounts payable ($65) $1,106 $124 $636 ($1,004) ($130)
Inventory ($15,661) $4,556 $3,508 $3,251 $4,675 $5,443
Accounts receivable $577 ($2,504) ($2,200) ($3,143) ($775)
($1,882)
Net cash from operations ($15,993) $24,430 $25,678 $26,255
$22,199 $23,796
Cash flows from investing activities
Plant improvements (net) $0 ($44,400) ($12,900) ($15,800)
($26,600) ($23,470)
Cash flows from financing activities
Dividends paid $0 $0 $0 $0 $0 $0
Sales of common stock $0 $10,513 $1,484 $4,168 $10,684
$9,559
Purchase of common stock $0 $0 $0 $0 $0 $0
Cash from long term debt issued $2,000 $26,954 $15,884
$18,502 $22,181 $12,986
Early retirement of long term debt $0 $0 $0 $0 $0 $0
Retirement of current debt ($5,512) ($19,336) ($20,475)
($24,609) ($14,810) ($22,471)
Cash from current debt borrowing $4,000 $21,405 $19,711
$23,661 $13,854 $23,499
Cash from emergency loan $15,505 $0 $0 $0 $0 $0
Net cash from financing activities $15,993 $39,537 $16,605
$21,722 $31,908 $23,573
Net change in cash position $0 $19,567 $29,383 $32,177
$27,507 $23,899
Balance Sheet Survey Andrews Baldwin Chester Digby Erie
Ferris
Cash $0 $40,768 $48,553 $50,769 $42,883 $43,549
Accounts Receivable $4,370 $15,617 $14,542 $17,537 $12,157
$16,152
Inventory $31,215 $10,433 $12,812 $17,946 $6,092 $12,585
Total Current Assets $35,585 $66,818 $75,907 $86,251 $61,132
$72,286
Plant and equipment $140,200 $170,900 $164,900 $167,900
$179,600 $138,700
Accumulated Depreciation ($75,320) ($63,913) ($65,980)
($64,700) ($69,193) ($46,560)
Total Fixed Assets $64,880 $106,987 $98,920 $103,200
$110,407 $92,140
Total Assets $100,465 $173,805 $174,827 $189,451 $171,539
$164,426
Accounts Payable $2,531 $10,232 $8,736 $11,133 $7,303
$10,545
Current Debt $30,430 $33,014 $33,611 $37,490 $27,754
$28,125
Total Current Liabilities $32,961 $43,246 $42,347 $48,623
$35,057 $38,670
Long Term Debt $32,850 $49,050 $47,812 $49,115 $54,777
$43,177
Total Liabilities $65,811 $92,296 $90,159 $97,737 $89,834
$81,847
Common Stock $31,150 $30,458 $23,933 $25,991 $33,431
$29,582
Retained Earnings $3,505 $51,051 $60,735 $65,723 $48,274
$52,996
Total Equity $34,654 $81,509 $84,668 $91,714 $81,705 $82,578
Total Liabilities & Owners' Equity $100,465 $173,805 $174,827
$189,451 $171,539 $164,426
Income Statement Survey Andrews Baldwin Chester Digby Erie
Ferris
Sales $63,796 $190,006 $176,929 $213,365 $147,913 $196,521
Variable Costs (Labor, Material, Carry) $49,669 $130,293
$111,332 $140,854 $94,261 $135,254
Contribution Margin $14,127 $59,713 $65,597 $72,511 $53,652
$61,267
Depreciation $9,347 $11,393 $10,993 $11,193 $11,973 $9,247
SGA (R&D, Promo, Sales, Admin) $11,605 $16,903 $18,958
$23,108 $14,325 $20,459
Other (Fees, Writeoffs, TQM, Bonuses) $150 $5,623 $4,618
$4,884 $5,393 $4,474
EBIT ($6,974) $25,793 $31,027 $33,326 $21,960 $27,088
Interest (Short term, Long term) $8,704 $10,286 $10,223
$10,850 $10,453 $9,000
Taxes ($5,487) $5,428 $7,281 $7,867 $4,027 $6,331
Profit Sharing $0 $202 $270 $292 $150 $235
Net Profit ($10,191) $9,878 $13,252 $14,318 $7,329 $11,522
CAPSTONE® COURIER Page 3
2/22/2020 Report Page
https://ww3.capsim.com/cgi-
bin/displayReport.cfm?Report=CapCourier#frontpage 5/14
Top
Production Analysis C116647_042 Round: 4December 31, 2024
Production Information
Name
Primary
Segment
Units
Sold
Unit
Inven
tory Revision Date
Age
Dec.31 MTBF
Pfmn
Coord
Size
Coord Price
Material
Cost
Labor
Cost
Contr.
Marg.
2nd Shift
&
Over-
time
Auto
mation
Next
Round
Capacity
Next
Round
Plant
Utiliz.
Able Trad 1,025 0 1/15/2024 2.4 16000 8.0 12.0 $25.00 $10.00
$8.11 26% 0% 4.0 2,200 45%
Acre Low 629 777 9/1/2024 1.5 12000 3.0 15.0 $19.00 $5.67
$6.95 20% 0% 5.0 1,800 55%
Adam High 220 432 7/28/2024 1.4 21000 10.0 8.0 $35.00
$14.02 $9.27 17% 0% 3.0 1,100 45%
Aft Pfmn 218 299 5/31/2025 2.4 23500 11.0 14.0 $30.00 $13.03
$9.27 12% 0% 3.0 700 54%
Agape Size 399 182 7/21/2024 1.5 18000 6.0 8.0 $30.00 $11.91
$9.27 25% 0% 3.0 700 66%
Aque 0 0 7/25/2025 2.0 20000 10.0 9.0 $26.00 $0.00 $0.00 0%
0% 0.0 0 0%
Baker Trad 1,242 144 4/4/2023 2.7 16000 6.5 13.6 $28.00 $8.71
$7.65 40% 5% 6.0 1,100 104%
Bead Low 2,372 431 5/24/2016 8.6 14000 3.0 17.0 $20.00 $5.27
$5.20 45% 66% 8.0 1,700 164%
Bid High 871 132 10/6/2024 1.2 23500 12.8 7.2 $38.00 $16.20
$9.99 31% 0% 4.0 850 99%
Bold Trad 1,265 0 5/10/2024 1.6 19000 8.0 12.0 $28.00 $10.89
$11.60 18% 100% 5.0 1,050 198%
Buddy Trad 1,402 0 5/1/2024 1.6 18000 8.0 12.0 $28.00 $10.59
$11.60 20% 100% 5.0 1,050 198%
Cake Trad 1,229 62 9/13/2024 1.4 14000 7.8 12.2 $26.00 $9.06
$6.21 40% 0% 6.0 1,000 99%
Cedar Low 2,583 438 1/29/2021 8.6 12000 3.0 17.0 $19.00
$4.59 $4.43 50% 66% 8.0 1,900 164%
Cid High 718 113 11/14/2024 1.1 23000 12.5 7.5 $37.00 $15.52
$9.93 31% 0% 3.0 750 92%
Coat Pfmn 1,018 98 9/20/2024 1.4 27000 13.4 13.2 $32.00
$15.26 $8.64 24% 18% 4.5 1,050 116%
Cure Size 1,149 122 9/20/2024 1.3 17000 6.8 6.6 $32.00 $12.31
$8.90 33% 28% 4.5 1,000 127%
Daze Trad 1,250 105 8/2/2024 1.5 18700 8.2 11.9 $28.50 $10.93
$6.99 36% 5% 5.5 1,000 104%
Dell Low 2,119 457 1/12/2026 8.6 14000 3.0 17.0 $21.00 $5.27
$5.12 48% 60% 7.5 1,600 158%
Dixie High 819 171 10/23/2024 1.2 25000 12.4 7.6 $38.50
$16.32 $10.22 31% 6% 3.0 800 105%
Dot Pfmn 935 80 8/16/2024 1.4 27000 13.8 12.8 $33.50 $15.85
$8.70 25% 0% 4.0 1,050 94%
Dune Size 1,275 134 8/16/2024 1.4 19000 7.2 6.4 $33.50 $13.34
$9.81 30% 37% 4.0 1,150 136%
Doom Pfmn 827 69 7/18/2024 0.9 27000 13.7 12.9 $33.50
$15.77 $7.43 30% 70% 6.0 650 168%
Eat Low 1,127 198 1/15/2024 4.1 13500 5.5 14.5 $20.50 $7.05
$4.36 40% 0% 8.0 1,400 74%
Ebb Low 2,941 314 6/18/2026 8.6 12000 3.0 17.0 $18.50 $4.59
$5.35 44% 91% 8.0 1,800 189%
Echo Trad 1,446 29 9/13/2024 1.3 15000 7.8 12.2 $26.00 $9.36
$6.92 37% 30% 6.5 1,000 129%
Egg Trad 1,262 0 7/20/2024 1.7 16000 7.8 12.2 $26.00 $9.65
$10.81 21% 100% 5.0 1,000 198%
Fast Low 659 74 1/24/2024 4.1 12000 5.5 14.5 $21.00 $6.73
$8.68 20% 0% 4.0 500 99%
Feat Low 1,940 139 7/27/2025 8.6 13000 3.0 17.0 $21.00 $4.97
$7.47 39% 75% 6.0 1,250 173%
Fist High 1,022 88 10/22/2024 1.2 25000 12.5 7.5 $38.00
$16.40 $11.16 28% 36% 3.0 700 134%
Foam Pfmn 981 109 8/18/2024 1.4 27000 13.8 12.8 $33.00
$15.85 $8.27 25% 6% 5.0 900 105%
Fume Size 1,029 157 9/25/2024 1.3 17000 6.8 6.0 $33.00
$12.86 $9.27 33% 17% 5.0 900 116%
Fox High 968 45 10/19/2024 0.9 25000 13.0 7.0 $38.00 $16.81
$8.44 34% 100% 5.5 1,100 198%
CAPSTONE® COURIER Page 4
2/22/2020 Report Page
https://ww3.capsim.com/cgi-
bin/displayReport.cfm?Report=CapCourier#frontpage 6/14
Top
Traditional Market Segment Analysis C116647_042 Round:
4December 31, 2024
Traditional Statistics
Total Industry Unit Demand 10,504
Actual Industry Unit Sales 10,504
Segment % of Total Industry 28.4%
Next Year's Segment Growth Rate 9.2%
Traditional Customer Buying Criteria
Expectations Importance
1. Age Ideal Age = 2.0 47%
2. Price $18.00 - 28.00 23%
3. Ideal Position Pfmn 7.8 Size 12.2 21%
4. Reliability MTBF 14000-19000 9%
Perceptual Map for Traditional Segment
Top Products in Traditional Segment
Name
Market
Share
Units Sold
to Seg
Revision
Date Stock Out
Pfmn
Coord
Size
Coord
List
Price MTBF
Age
Dec.31
Promo
Budget
Cust. Aware-
ness
Sales
Budget
Cust. Access-
ibility
Dec. Cust.
Survey
Echo 14% 1,445 9/13/2024 7.8 12.2 $26.00 15000 1.33 $1,350
76% $1,056 77% 34
Buddy 13% 1,357 5/1/2024 YES 8.0 12.0 $28.00 18000 1.57
$1,450 87% $1,200 80% 45
Egg 12% 1,262 7/20/2024 YES 7.8 12.2 $26.00 16000 1.70
$1,350 76% $1,056 77% 45
Daze 12% 1,245 8/2/2024 8.2 11.9 $28.50 18700 1.51 $1,225
77% $1,670 51% 32
Baker 12% 1,242 4/4/2023 6.5 13.6 $28.00 16000 2.75 $1,450
89% $1,200 80% 21
Bold 12% 1,240 5/10/2024 YES 8.0 12.0 $28.00 19000 1.59
$1,450 87% $1,200 80% 47
Cake 12% 1,229 9/13/2024 7.8 12.2 $26.00 14000 1.45 $1,150
71% $1,675 50% 30
Able 10% 1,023 1/15/2024 YES 8.0 12.0 $25.00 16000 2.40
$900 58% $900 34% 29
Eat 3% 295 1/15/2024 5.5 14.5 $20.50 13500 4.09 $1,350 79%
$1,056 77% 3
Fast 1% 118 1/24/2024 5.5 14.5 $21.00 12000 4.08 $900 57%
$710 27% 1
Aft 0% 39 5/31/2025 11.0 14.0 $30.00 23500 2.43 $400 28%
$400 34% 2
Acre 0% 8 9/1/2024 3.0 15.0 $19.00 12000 1.47 $900 50% $900
34% 0
CAPSTONE® COURIER Page 5
2/22/2020 Report Page
https://ww3.capsim.com/cgi-
bin/displayReport.cfm?Report=CapCourier#frontpage 7/14
Top
Low End Market Segment Analysis C116647_042 Round:
4December 31, 2024
Low End Statistics
Total Industry Unit Demand 13,949
Actual Industry Unit Sales 13,949
Segment % of Total Industry 37.8%
Next Year's Segment Growth Rate 11.7%
Low End Customer Buying Criteria
Expectations Importance
1. Price $13.00 - 23.00 53%
2. Age Ideal Age = 7.0 24%
3. Ideal Position Pfmn 3.7 Size 16.3 16%
4. Reliability MTBF 12000-17000 7%
Perceptual Map for Low End Segment
Top Products in Low End Segment
Name
Market
Share
Units Sold
to Seg
Revision
Date Stock Out
Pfmn
Coord
Size
Coord
List
Price MTBF
Age
Dec.31
Promo
Budget
Cust. Aware-
ness
Sales
Budget
Cust. Access-
ibility
Dec. Cust.
Survey
Ebb 21% 2,941 6/18/2026 3.0 17.0 $18.50 12000 8.60 $1,350
78% $1,056 56% 23
Cedar 19% 2,583 1/29/2021 3.0 17.0 $19.00 12000 8.60 $1,150
70% $1,758 50% 20
Bead 17% 2,372 5/24/2016 3.0 17.0 $20.00 14000 8.60 $1,450
89% $1,200 36% 18
Dell 15% 2,119 1/12/2026 3.0 17.0 $21.00 14000 8.60 $1,225
76% $1,753 50% 16
Feat 14% 1,940 7/27/2025 3.0 17.0 $21.00 13000 8.60 $1,100
70% $1,278 53% 15
Eat 6% 832 1/15/2024 5.5 14.5 $20.50 13500 4.09 $1,350 79%
$1,056 56% 9
Acre 4% 621 9/1/2024 3.0 15.0 $19.00 12000 1.47 $900 50%
$900 22% 6
Fast 4% 541 1/24/2024 5.5 14.5 $21.00 12000 4.08 $900 57%
$710 53% 6
CAPSTONE® COURIER Page 6
2/22/2020 Report Page
https://ww3.capsim.com/cgi-
bin/displayReport.cfm?Report=CapCourier#frontpage 8/14
Top
High End Market Segment Analysis C116647_042 Round:
4December 31, 2024
High End Statistics
Total Industry Unit Demand 4,656
Actual Industry Unit Sales 4,656
Segment % of Total Industry 12.6%
Next Year's Segment Growth Rate 16.2%
High End Customer Buying Criteria
Expectations Importance
1. Ideal Position Pfmn 12.5 Size 7.5 43%
2. Age Ideal Age = 0.0 29%
3. Reliability MTBF 20000-25000 19%
4. Price $28.00 - 38.00 9%
Perceptual Map for High End Segment
Top Products in High End Segment
Name
Market
Share
Units Sold
to Seg
Revision
Date Stock Out
Pfmn
Coord
Size
Coord
List
Price MTBF
Age
Dec.31
Promo
Budget
Cust. Aware-
ness
Sales
Budget
Cust. Access-
ibility
Dec. Cust.
Survey
Fist 22% 1,022 10/22/2024 12.5 7.5 $38.00 25000 1.15 $1,300
74% $1,278 67% 51
Fox 21% 968 10/19/2024 13.0 7.0 $38.00 25000 0.87 $1,300
58% $1,278 67% 41
Bid 19% 871 10/6/2024 12.8 7.2 $38.00 23500 1.17 $1,400 85%
$1,200 49% 41
Dixie 18% 819 10/23/2024 12.4 7.6 $38.50 25000 1.17 $1,250
77% $1,753 52% 43
Cid 15% 718 11/14/2024 12.5 7.5 $37.00 23000 1.13 $1,100
65% $1,758 50% 38
Adam 5% 220 7/28/2024 10.0 8.0 $35.00 21000 1.38 $500 36%
$500 22% 7
Bold 0% 20 5/10/2024 YES 8.0 12.0 $28.00 19000 1.59 $1,450
87% $1,200 49% 0
Buddy 0% 11 5/1/2024 YES 8.0 12.0 $28.00 18000 1.57 $1,450
87% $1,200 49% 0
Daze 0% 4 8/2/2024 8.2 11.9 $28.50 18700 1.51 $1,225 77%
$1,670 52% 0
Able 0% 1 1/15/2024 YES 8.0 12.0 $25.00 16000 2.40 $900
58% $900 22% 0
CAPSTONE® COURIER Page 7
2/22/2020 Report Page
https://ww3.capsim.com/cgi-
bin/displayReport.cfm?Report=CapCourier#frontpage 9/14
Top
Performance Market Segment Analysis C116647_042 Round:
4December 31, 2024
Performance Statistics
Total Industry Unit Demand 3,945
Actual Industry Unit Sales 3,945
Segment % of Total Industry 10.7%
Next Year's Segment Growth Rate 19.8%
Performance Customer Buying Criteria
Expectations Importance
1. Reliability MTBF 22000-27000 43%
2. Ideal Position Pfmn 13.4 Size 13.2 29%
3. Price $23.00 - 33.00 19%
4. Age Ideal Age = 1.0 9%
Perceptual Map for Performance Segment
Top Products in Performance Segment
Name
Market
Share
Units Sold
to Seg
Revision
Date Stock Out
Pfmn
Coord
Size
Coord
List
Price MTBF
Age
Dec.31
Promo
Budget
Cust. Aware-
ness
Sales
Budget
Cust. Access-
ibility
Dec. Cust.
Survey
Coat 26% 1,018 9/20/2024 13.4 13.2 $32.00 27000 1.42 $1,100
64% $1,591 41% 41
Foam 25% 981 8/18/2024 13.8 12.8 $33.00 27000 1.37 $1,300
74% $1,278 35% 39
Dot 24% 935 8/16/2024 13.8 12.8 $33.50 27000 1.41 $1,200
74% $1,586 42% 37
Doom 21% 827 7/18/2024 13.7 12.9 $33.50 27000 0.92 $1,200
63% $0 42% 33
Aft 5% 179 5/31/2025 11.0 14.0 $30.00 23500 2.43 $400 28%
$400 14% 5
Bold 0% 5 5/10/2024 YES 8.0 12.0 $28.00 19000 1.59 $1,450
87% $1,200 18% 0
CAPSTONE® COURIER Page 8
2/22/2020 Report Page
https://ww3.capsim.com/cgi-
bin/displayReport.cfm?Report=CapCourier#frontpage 10/14
Top
Size Market Segment Analysis C116647_042 Round:
4December 31, 2024
Size Statistics
Total Industry Unit Demand 3,885
Actual Industry Unit Sales 3,885
Segment % of Total Industry 10.5%
Next Year's Segment Growth Rate 18.3%
Size Customer Buying Criteria
Expectations Importance
1. Ideal Position Pfmn 6.8 Size 6.6 43%
2. Age Ideal Age = 1.5 29%
3. Reliability MTBF 16000-21000 19%
4. Price $23.00 - 33.00 9%
Perceptual Map for Size Segment
Top Products in Size Segment
Name
Market
Share
Units Sold
to Seg
Revision
Date Stock Out
Pfmn
Coord
Size
Coord
List
Price MTBF
Age
Dec.31
Promo
Budget
Cust. Aware-
ness
Sales
Budget
Cust. Access-
ibility
Dec. Cust.
Survey
Dune 33% 1,275 8/16/2024 7.2 6.4 $33.50 19000 1.36 $1,200
74% $1,586 44% 38
Cure 30% 1,149 9/20/2024 6.8 6.6 $32.00 17000 1.35 $1,150
66% $1,591 43% 37
Fume 26% 1,029 9/25/2024 6.8 6.0 $33.00 17000 1.27 $1,300
74% $1,278 37% 31
Agape 10% 399 7/21/2024 6.0 8.0 $30.00 18000 1.47 $400 25%
$400 14% 10
Buddy 1% 34 5/1/2024 YES 8.0 12.0 $28.00 18000 1.57 $1,450
87% $1,200 20% 0
CAPSTONE® COURIER Page 9
2/22/2020 Report Page
https://ww3.capsim.com/cgi-
bin/displayReport.cfm?Report=CapCourier#frontpage 11/14
Top
Market Share Report C116647_042 Round: 4December 31, 2024
Actual Market Share in Units
Trad Low High Pfmn Size Total
Industry Unit
Sales 10,504 13,949 4,656 3,945 3,885 36,939
% of Market 28.4% 37.8% 12.6% 10.7% 10.5% 100.0%
Able 9.7% 0.0% 2.8%
Acre 0.1% 4.5% 1.7%
Adam 4.7% 0.6%
Aft 0.4% 4.5% 0.6%
Agape 10.3% 1.1%
Total 10.2% 4.5% 4.8% 4.5% 10.3% 6.7%
Baker 11.8% 3.4%
Bead 17.0% 6.4%
Bid 18.7% 2.4%
Bold 11.8% 0.4% 0.1% 3.4%
Buddy 12.9% 0.3% 0.9% 3.8%
Total 36.5% 17.0% 19.4% 0.1% 0.9% 19.4%
Cake 11.7% 3.3%
Cedar 18.5% 7.0%
Cid 15.4% 1.9%
Coat 25.8% 2.8%
Cure 29.6% 3.1%
Total 11.7% 18.5% 15.4% 25.8% 29.6% 18.1%
Daze 11.9% 0.1% 3.4%
Dell 15.2% 5.7%
Dixie 17.6% 2.2%
Dot 23.7% 2.5%
Dune 32.8% 3.5%
Doom 21.0% 2.2%
Total 11.9% 15.2% 17.7% 44.7% 32.8% 19.6%
Eat 2.8% 6.0% 3.0%
Ebb 21.1% 8.0%
Echo 13.8% 3.9%
Egg 12.0% 3.4%
Total 28.6% 27.1% 18.3%
Fast 1.1% 3.9% 1.8%
Feat 13.9% 5.3%
Fist 21.9% 2.8%
Foam 24.9% 2.7%
Fume 26.5% 2.8%
Fox 20.8% 2.6%
Total 1.1% 17.8% 42.8% 24.9% 26.5% 17.9%
Potential Market Share in Units
Trad Low High Pfmn Size Total
Units
Demanded 10,504 13,949 4,656 3,945 3,885 36,939
% of Market 28.4% 37.8% 12.6% 10.7% 10.5% 100.0%
Able 9.8% 2.8%
Acre 0.1% 4.4% 1.7%
Adam 4.6% 0.6%
Aft 0.3% 4.5% 0.6%
Agape 10.3% 1.1%
Total 10.2% 4.5% 4.6% 4.5% 10.3% 6.7%
Baker 11.2% 3.2%
Bead 17.0% 6.4%
Bid 18.2% 2.3%
Bold 13.2% 0.4% 0.1% 3.8%
Buddy 12.3% 0.2% 0.9% 3.6%
Total 36.7% 17.0% 18.9% 0.1% 0.9% 19.3%
Cake 11.0% 3.1%
Cedar 18.5% 7.0%
Cid 15.0% 1.9%
Coat 25.8% 2.8%
Cure 29.6% 3.1%
Total 11.0% 18.5% 15.0% 25.8% 29.6% 17.9%
Daze 11.1% 0.1% 3.2%
Dell 15.2% 5.7%
Dixie 17.1% 2.2%
Dot 23.7% 2.5%
Dune 32.8% 3.5%
Doom 21.0% 2.2%
Total 11.1% 15.2% 17.2% 44.7% 32.8% 19.3%
Eat 2.7% 6.0% 3.0%
Ebb 21.1% 8.0%
Echo 12.9% 3.7%
Egg 14.3% 4.1%
Total 29.9% 27.1% 18.7%
Fast 1.1% 3.9% 1.8%
Feat 13.9% 5.3%
Fist 21.4% 2.7%
Foam 24.9% 2.7%
Fume 26.5% 2.8%
Fox 22.9% 2.9%
Total 1.1% 17.8% 44.3% 24.9% 26.5% 18.1%
CAPSTONE® COURIER Page 10
2/22/2020 Report Page
https://ww3.capsim.com/cgi-
bin/displayReport.cfm?Report=CapCourier#frontpage 12/14
Top
Perceptual Map C116647_042 Round: 4December 31, 2024
Perceptual Map for All Segments
Andrews
Name Pfmn Size Revised
Able 8.0 12.0 1/15/2024
Acre 3.0 15.0 9/1/2024
Adam 10.0 8.0 7/28/2024
Aft 11.0 14.0 5/31/2025
Agape 6.0 8.0 7/21/2024
Aque 10.0 9.0 7/25/2025
Baldwin
Name Pfmn Size Revised
Baker 6.5 13.6 4/4/2023
Bead 3.0 17.0 5/24/2016
Bid 12.8 7.2 10/6/2024
Bold 8.0 12.0 5/10/2024
Buddy 8.0 12.0 5/1/2024
Chester
Name Pfmn Size Revised
Cake 7.8 12.2 9/13/2024
Cedar 3.0 17.0 1/29/2021
Cid 12.5 7.5 11/14/2024
Coat 13.4 13.2 9/20/2024
Cure 6.8 6.6 9/20/2024
Digby
Name Pfmn Size Revised
Daze 8.2 11.9 8/2/2024
Dell 3.0 17.0 1/12/2026
Dixie 12.4 7.6 10/23/2024
Dot 13.8 12.8 8/16/2024
Dune 7.2 6.4 8/16/2024
Doom 13.7 12.9 7/18/2024
Erie
Name Pfmn Size Revised
Eat 5.5 14.5 1/15/2024
Ebb 3.0 17.0 6/18/2026
Echo 7.8 12.2 9/13/2024
Egg 7.8 12.2 7/20/2024
Ferris
Name Pfmn Size Revised
Fast 5.5 14.5 1/24/2024
Feat 3.0 17.0 7/27/2025
Fist 12.5 7.5 10/22/2024
Foam 13.8 12.8 8/18/2024
Fume 6.8 6.0 9/25/2024
Fox 13.0 7.0 10/19/2024
CAPSTONE® COURIER Page 11
2/22/2020 Report Page
https://ww3.capsim.com/cgi-
bin/displayReport.cfm?Report=CapCourier#frontpage 13/14
Top
HR/TQM Report C116647_042 Round: 4December 31, 2024
HUMAN RESOURCES SUMMARY
Andrews Baldwin Chester Digby Erie Ferris
Needed Complement 527 986 779 947 697 945
Complement 527 986 779 947 697 945
1st Shift Complement 527 671 638 758 439 696
2nd Shift Complement 0 316 142 189 258 249
Overtime% 0.0% 0.0% 0.0% 0.0% 0.0% 0.0%
Turnover Rate 8.2% 8.6% 8.8% 8.6% 8.8% 8.5%
New Employees 43 157 69 81 61 81
Separated Employees 20 0 14 17 169 4
Recruiting Spend $3,000 $2,000 $2,000 $2,200 $2,000 $2,500
Training Hours 40 30 25 30 25 30
Productivity Index 113.1% 104.9% 103.9% 105.8% 103.5%
106.1%
Recruiting Cost $174 $471 $206 $260 $184 $282
Separation Cost $100 $0 $69 $84 $847 $22
Training Cost $422 $592 $390 $568 $348 $567
Total HR Admin Cost $695 $1,063 $664 $911 $1,379 $872
Labor Contract Next Year
Wages $25.53 $25.53 $25.53 $25.53 $25.53 $25.53
Benefits 2,500 2,500 2,500 2,500 2,500 2,500
Profit Sharing 2.0% 2.0% 2.0% 2.0% 2.0% 2.0%
Annual Raise 5.0% 5.0% 5.0% 5.0% 5.0% 5.0%
Starting Negotiation Position
Wages
Benefits
Profit Sharing
Annual Raise
Ceiling Negotiation Position
Wages
Benefits
Profit Sharing
Annual Raise
Adjusted Labor Demands
Wages
Benefits
Profit Sharing
Annual Raise
Strike Days
TQM SUMMARY
Andrews Baldwin Chester Digby Erie Ferris
Process Mgt Budgets Last Year
CPI Systems $0 $0 $750 $0 $750 $0
Vendor/JIT $0 $0 $750 $0 $750 $0
Quality Initiative Training $0 $0 $750 $0 $750 $0
Channel Support Systems $0 $750 $0 $750 $0 $750
Concurrent Engineering $0 $750 $0 $750 $0 $750
UNEP Green Programs $50 $0 $750 $0 $750 $0
TQM Budgets Last Year
Benchmarking $0 $750 $0 $750 $0 $750
Quality Function Deployment Effort $0 $750 $0 $750 $0 $750
CCE/6 Sigma Training $0 $750 $0 $750 $0 $750
GEMI TQEM Sustainability Initiatives $0 $0 $750 $0 $750 $0
Total Expenditures $50 $3,750 $3,750 $3,750 $3,750 $3,750
Cumulative Impacts
Material Cost Reduction 0.00% 0.05% 1.85% 0.05% 1.85%
0.05%
Labor Cost Reduction 0.00% 0.21% 1.60% 0.21% 1.60% 0.21%
Reduction R&D Cycle Time 0.00% 17.75% 0.00% 17.75%
0.00% 17.75%
Reduction Admin Costs 0.00% 12.59% 2.44% 12.59% 2.44%
12.59%
Demand Increase 0.00% 1.73% 0.23% 1.73% 0.23% 1.73%
CAPSTONE® COURIER Page 12
2/22/2020 Report Page
https://ww3.capsim.com/cgi-
bin/displayReport.cfm?Report=CapCourier#frontpage 14/14
2/22/2020 Report Page
https://ww3.capsim.com/cgi-
bin/displayReport.cfm?Report=CapCourier#frontpage 1/14
Page 1 Front Page
Page 2 Stocks & Bonds
Page 3 Financial Summary
Page 4 Production Analysis
Page 5 Traditional Segment Analysis
Page 6 Low End Segment Analysis
Page 7 High End Segment Analysis
Page 8 Performance Segment Analysis
Page 9 Size Segment Analysis
Page 10 Market Share
Page 11 Perceptual Map
Page 12 HR/TQM Report
PRINT
2/22/2020 Report Page
https://ww3.capsim.com/cgi-
bin/displayReport.cfm?Report=CapCourier#frontpage 2/14
Top
Round: 2
Dec. 31, 2022
Chen m
C116647_042
Andrews
Manling Chen
Baldwin
Chester
Digby
Erie
Ferris
Selected Financial Statistics
Andrews Baldwin Chester Digby Erie Ferris
ROS -2.8% 5.5% 6.5% 6.7% 5.7% 7.0%
Asset Turnover 0.90 1.06 1.24 1.19 0.98 1.35
ROA -2.6% 5.8% 8.1% 8.0% 5.6% 9.5%
Leverage (Assets/Equity) 1.8 2.0 2.0 2.0 2.0 2.0
ROE -4.7% 11.8% 15.8% 15.7% 11.3% 18.6%
Emergency Loan $0 $0 $0 $0 $0 $0
Sales $89,035,307 $122,587,013 $154,293,704 $157,992,088
$121,430,647 $141,272,826
EBIT $1,515,688 $16,879,190 $22,135,853 $23,545,648
$17,738,015 $20,964,167
Profits ($2,534,269) $6,704,268 $10,008,748 $10,617,319
$6,897,788 $9,957,111
Cumulative Profit $1,972,431 $18,305,555 $17,559,284
$20,307,535 $15,470,880 $20,156,303
SG&A / Sales 17.1% 13.9% 10.9% 12.3% 9.6% 13.1%
Contrib. Margin % 29.4% 34.0% 30.2% 32.2% 30.8% 31.6%
CAPSTONE® COURIER Page 1
2/22/2020 Report Page
https://ww3.capsim.com/cgi-
bin/displayReport.cfm?Report=CapCourier#frontpage 3/14
Top
Stocks & Bonds C116647_042
Round: 2
December 31 , 2022
Stock Market Summary
Company Close Change Shares MarketCap ($M) Book Value
PerShare EPS Dividend Yield P/E
Andrews $19.86 ($11.30) 2,388,206 $47 $22.63 ($1.06) $1.00
5.0% -18.7
Baldwin $48.18 $3.29 2,046,274 $99 $27.87 $3.28 $3.23 6.7%
14.7
Chester $48.54 $11.53 2,069,366 $100 $30.69 $4.84 $0.09 0.2%
10.0
Digby $53.08 $11.93 2,086,720 $111 $32.36 $5.09 $0.00 0.0%
10.4
Erie $43.74 $4.72 2,128,085 $93 $28.78 $3.24 $1.11 2.5% 13.5
Ferris $52.06 $10.72 2,000,000 $104 $26.77 $4.98 $1.34 2.6%
10.4
Bond Market Summary
Company Series# Face Yield Close$ S&P
Andrews
12.5S2024 $10,924,506 12.3% 101.36 BB
14.0S2026 $20,850,000 13.1% 107.03 BB
11.3S2031 $10,000,000 11.5% 97.84 BB
Baldwin
12.5S2024 $11,609,210 12.5% 100.34 B
14.0S2026 $20,850,000 13.3% 105.13 B
Chester
12.5S2024 $13,900,000 12.4% 100.67 B
14.0S2026 $20,850,000 13.2% 105.76 B
Digby
12.5S2024 $13,828,904 12.4% 100.51 B
14.0S2026 $20,850,000 13.3% 105.44 B
11.7S2032 $2,891,032 12.0% 97.20 B
Erie
12.5S2024 $13,900,000 12.5% 100.34 B
14.0S2026 $20,850,000 13.3% 105.13 B
11.8S2032 $2,640,750 12.1% 97.21 B
Ferris
12.5S2024 $4,626,007 12.4% 100.67 B
14.0S2026 $20,850,000 13.2% 105.76 B
Next Year's Prime Rate 8.00%
CAPSTONE® COURIER Page 2
2/22/2020 Report Page
https://ww3.capsim.com/cgi-
bin/displayReport.cfm?Report=CapCourier#frontpage 4/14
Top
Financial Summary C116647_042 Round: 2December 31, 2022
Cash Flow Statement Survey Andrews Baldwin Chester Digby
Erie Ferris
Cash flows from operating activities
Net Income (Loss) ($2,534) $6,704 $10,009 $10,617 $6,898
$9,957
Adjustment for non-cash items:
Depreciation $9,347 $7,647 $7,707 $7,473 $8,355 $5,927
Extraordinary gains/losses/writeoffs $0 $55 $9 $7 ($539)
($805)
Changes in current assets and liabilities:
Accounts payable ($3,562) ($29) $2,021 $2,450 $239 $1,551
Inventory ($2,091) ($3,830) ($2,248) ($2,906) $1,286 ($422)
Accounts receivable $3,256 $219 ($2,916) ($3,359) ($797)
($2,218)
Net cash from operations $4,416 $10,765 $14,582 $14,283
$15,440 $13,990
Cash flows from investing activities
Plant improvements (net) $0 ($4,130) ($5,640) ($19,920)
($9,292) ($6,910)
Cash flows from financing activities
Dividends paid ($2,388) ($6,617) ($190) $0 ($2,369) ($2,671)
Sales of common stock $3,000 $0 $0 $2,940 $0 $0
Purchase of common stock $0 $0 $0 $0 $0 $0
Cash from long term debt issued $0 $0 $0 $2,891 $2,641 $0
Early retirement of long term debt $0 ($3,328) ($536) $0 $0
($1,298)
Retirement of current debt $0 ($11,359) ($11,359) ($11,359)
($11,359) ($11,359)
Cash from current debt borrowing $0 $19,454 $15,742 $18,370
$14,857 $17,822
Cash from emergency loan $0 $0 $0 $0 $0 $0
Net cash from financing activities $612 ($1,850) $3,658
$12,842 $3,771 $2,494
Net change in cash position $5,028 $4,785 $12,601 $7,205
$9,919 $9,574
Balance Sheet Survey Andrews Baldwin Chester Digby Erie
Ferris
Cash $5,043 $23,955 $29,056 $24,776 $27,130 $26,522
Accounts Receivable $6,098 $10,076 $12,682 $12,986 $9,981
$11,611
Inventory $3,755 $13,287 $11,672 $13,049 $8,621 $10,481
Total Current Assets $14,896 $47,318 $53,410 $50,810 $45,732
$48,614
Plant and equipment $140,200 $114,700 $115,600 $127,100
$125,318 $88,900
Accumulated Depreciation ($56,627) ($46,247) ($44,853)
($45,527) ($47,028) ($32,807)
Total Fixed Assets $83,573 $68,453 $70,747 $81,573 $78,290
$56,093
Total Assets $98,469 $115,771 $124,157 $132,384 $124,021
$104,708
Accounts Payable $2,649 $6,831 $8,917 $8,919 $6,721 $7,871
Current Debt $0 $19,454 $16,991 $18,370 $18,667 $17,822
Total Current Liabilities $2,649 $26,285 $25,908 $27,289
$25,388 $25,693
Long Term Debt $41,775 $32,459 $34,750 $37,570 $37,391
$25,476
Total Liabilities $44,424 $58,744 $60,658 $64,859 $62,778
$51,169
Common Stock $32,347 $19,945 $20,736 $21,823 $22,747
$18,360
Retained Earnings $21,699 $37,082 $42,763 $45,701 $38,496
$35,179
Total Equity $54,046 $57,027 $63,499 $67,525 $61,243 $53,539
Total Liabilities & Owners' Equity $98,469 $115,771 $124,157
$132,384 $124,021 $104,708
Income Statement Survey Andrews Baldwin Chester Digby Erie
Ferris
Sales $89,035 $122,587 $154,294 $157,992 $121,431 $141,273
Variable Costs (Labor, Material, Carry) $62,824 $80,872
$107,642 $107,179 $84,088 $96,596
Contribution Margin $26,211 $41,715 $46,652 $50,813 $37,343
$44,677
Depreciation $9,347 $7,647 $7,707 $7,473 $8,355 $5,927
SGA (R&D, Promo, Sales, Admin) $15,199 $17,085 $16,792
$19,496 $11,657 $18,572
Other (Fees, Writeoffs, TQM, Bonuses) $150 $104 $18 $298
($407) ($786)
EBIT $1,516 $16,879 $22,136 $23,546 $17,738 $20,964
Interest (Short term, Long term) $5,415 $6,354 $6,424 $6,878
$6,909 $5,333
Taxes ($1,365) $3,684 $5,499 $5,834 $3,790 $5,471
Profit Sharing $0 $137 $204 $217 $141 $203
Net Profit ($2,534) $6,704 $10,009 $10,617 $6,898 $9,957
CAPSTONE® COURIER Page 3
2/22/2020 Report Page
https://ww3.capsim.com/cgi-
bin/displayReport.cfm?Report=CapCourier#frontpage 5/14
Top
Production Analysis C116647_042 Round: 2December 31, 2022
Production Information
Name
Primary
Segment
Units
Sold
Unit
Inven
tory Revision Date
Age
Dec.31 MTBF
Pfmn
Coord
Size
Coord Price
Material
Cost
Labor
Cost
Contr.
Marg.
2nd Shift
&
Over-
time
Auto
mation
Next
Round
Capacity
Next
Round
Plant
Utiliz.
Able Trad 999 0 11/22/2022 1.7 18000 7.0 13.0 $27.00 $11.38
$8.02 30% 0% 4.0 2,200 45%
Acre Low 1,070 30 12/22/2022 1.9 13000 3.0 15.0 $20.00 $7.17
$6.88 27% 0% 5.0 1,800 55%
Adam High 478 21 11/16/2022 1.3 22000 10.0 10.0 $37.00
$15.43 $9.17 34% 0% 3.0 1,100 45%
Aft Pfmn 369 10 8/5/2022 1.7 24000 10.0 15.0 $32.00 $14.08
$9.17 26% 0% 3.0 700 54%
Agape Size 348 117 11/9/2022 1.6 18500 5.0 9.0 $32.00 $13.04
$9.17 29% 0% 3.0 700 66%
Baker Trad 985 246 12/5/2022 1.8 17000 6.5 13.5 $29.00
$10.60 $7.05 39% 0% 5.0 1,300 88%
Bead Low 2,209 165 5/24/2016 6.6 14000 3.0 17.0 $21.00 $6.38
$6.93 34% 61% 7.0 1,400 159%
Bid High 744 131 12/18/2022 1.2 23500 10.4 9.6 $39.00 $16.26
$11.35 30% 78% 3.0 600 176%
Bold High 305 71 7/27/2022 1.7 22000 8.8 13.5 $34.00 $13.29
$9.40 30% 0% 3.0 600 50%
Buddy Size 242 76 9/18/2022 1.6 16000 6.2 11.4 $34.00 $11.26
$9.40 34% 0% 3.0 650 41%
Cake Trad 1,350 185 8/26/2022 1.9 14000 6.4 13.6 $26.50 $9.61
$8.09 32% 45% 5.5 1,000 144%
Cedar Low 2,420 182 1/29/2021 6.6 12000 3.0 17.0 $19.50
$5.78 $6.36 35% 75% 7.5 1,400 173%
Cid High 641 155 11/15/2022 1.3 23000 10.2 9.8 $37.50 $15.92
$10.04 31% 17% 3.0 600 116%
Coat Pfmn 747 38 11/3/2022 1.5 27000 11.8 13.9 $32.50 $16.38
$10.29 20% 25% 4.0 600 124%
Cure Size 708 52 9/10/2022 1.6 17000 5.4 8.6 $32.50 $12.94
$10.04 29% 17% 4.0 600 116%
Daze Trad 1,442 170 8/22/2022 1.8 18100 6.8 13.3 $29.00
$11.17 $7.72 34% 25% 5.0 1,200 124%
Dell Low 1,946 153 5/24/2016 6.6 14000 3.0 17.0 $21.50 $6.38
$6.66 37% 39% 7.0 1,400 138%
Dixie High 651 182 12/3/2022 1.2 24000 10.2 9.8 $39.00
$16.22 $10.88 31% 50% 3.0 600 149%
Dot Pfmn 752 55 11/13/2022 1.5 27000 11.8 13.9 $34.00 $16.38
$10.29 23% 25% 3.0 650 124%
Dune Size 687 70 11/13/2022 1.5 19000 5.8 8.6 $34.00 $13.65
$10.04 31% 17% 3.0 600 116%
Doom 0 0 8/9/2023 0.0 0 0.0 0.0 $0.00 $0.00 $0.00 0% 0% 6.0
500 0%
Eat Trad 1,476 183 4/8/2022 2.1 15500 5.5 14.5 $27.00 $9.21
$7.47 36% 14% 7.0 1,400 113%
Ebb Low 2,271 172 1/15/2022 6.6 12000 3.0 17.0 $19.50 $5.78
$6.96 32% 64% 6.0 1,450 163%
Echo Trad 1,204 86 7/20/2022 1.4 16000 6.4 13.6 $27.00 $10.21
$9.20 23% 33% 5.0 900 132%
Edge Pfmn 64 0 6/30/2018 4.5 25000 9.4 15.5 $34.00 $13.87
$11.63 28% 99% 3.0 1 198%
Egg Size 76 67 12/24/2022 2.3 19000 6.9 13.4 $34.00 $11.44
$9.40 29% 0% 3.0 600 8%
Fast Trad 1,136 271 4/22/2022 2.1 14000 5.5 14.5 $29.00 $8.76
$9.72 32% 63% 4.0 800 161%
Feat Low 1,552 0 7/27/2025 6.6 13000 3.0 17.0 $22.00 $6.08
$8.72 32% 100% 6.0 700 198%
Fist High 652 105 12/22/2022 1.2 25000 10.2 9.8 $39.00 $16.52
$10.43 33% 30% 3.0 550 129%
Foam Pfmn 726 48 11/11/2022 1.5 27000 11.8 14.2 $34.00
$16.30 $9.00 27% 25% 4.0 600 124%
Fume Size 708 64 11/9/2022 1.5 19000 5.4 8.4 $34.00 $13.67
$8.78 35% 17% 4.0 600 116%
Fox 0 0 12/12/2022 0.0 25000 11.0 9.0 $39.00 $0.00 $0.00 0%
0% 5.5 500 0%
CAPSTONE® COURIER Page 4
2/22/2020 Report Page
https://ww3.capsim.com/cgi-
bin/displayReport.cfm?Report=CapCourier#frontpage 6/14
Top
Traditional Market Segment Analysis C116647_042 Round:
2December 31, 2022
Traditional Statistics
Total Industry Unit Demand 8,809
Actual Industry Unit Sales 8,809
Segment % of Total Industry 30.4%
Next Year's Segment Growth Rate 9.2%
Traditional Customer Buying Criteria
Expectations Importance
1. Age Ideal Age = 2.0 47%
2. Price $19.00 - 29.00 23%
3. Ideal Position Pfmn 6.4 Size 13.6 21%
4. Reliability MTBF 14000-19000 9%
Perceptual Map for Traditional Segment
Top Products in Traditional Segment
Name
Market
Share
Units Sold
to Seg
Revision
Date Stock Out
Pfmn
Coord
Size
Coord
List
Price MTBF
Age
Dec.31
Promo
Budget
Cust. Aware-
ness
Sales
Budget
Cust. Access-
ibility
Dec. Cust.
Survey
Eat 16% 1,437 4/8/2022 5.5 14.5 $27.00 15500 2.09 $1,050 63%
$1,085 54% 31
Daze 16% 1,409 8/22/2022 6.8 13.3 $29.00 18100 1.84 $1,100
66% $1,440 53% 36
Cake 15% 1,329 8/26/2022 6.4 13.6 $26.50 14000 1.87 $1,100
66% $1,270 47% 35
Echo 13% 1,170 7/20/2022 6.4 13.6 $27.00 16000 1.40 $1,050
57% $775 54% 29
Fast 13% 1,136 4/22/2022 5.5 14.5 $29.00 14000 2.08 $900
59% $1,235 48% 24
Baker 11% 985 12/5/2022 6.5 13.5 $29.00 17000 1.76 $1,300
76% $1,418 53% 37
Able 11% 984 11/22/2022 YES 7.0 13.0 $27.00 18000 1.72
$1,000 61% $1,000 50% 33
Acre 4% 349 12/22/2022 3.0 15.0 $20.00 13000 1.92 $800 48%
$800 50% 5
Aft 0% 6 8/5/2022 10.0 15.0 $32.00 24000 1.72 $800 46% $800
50% 1
Bead 0% 1 5/24/2016 3.0 17.0 $21.00 14000 6.60 $1,300 74%
$1,418 53% 0
Dell 0% 1 5/24/2016 3.0 17.0 $21.50 14000 6.60 $1,100 64%
$1,512 53% 0
CAPSTONE® COURIER Page 5
2/22/2020 Report Page
https://ww3.capsim.com/cgi-
bin/displayReport.cfm?Report=CapCourier#frontpage 7/14
Top
Low End Market Segment Analysis C116647_042 Round:
2December 31, 2022
Low End Statistics
Total Industry Unit Demand 11,180
Actual Industry Unit Sales 11,180
Segment % of Total Industry 38.6%
Next Year's Segment Growth Rate 11.7%
Low End Customer Buying Criteria
Expectations Importance
1. Price $14.00 - 24.00 53%
2. Age Ideal Age = 7.0 24%
3. Ideal Position Pfmn 2.7 Size 17.3 16%
4. Reliability MTBF 12000-17000 7%
Perceptual Map for Low End Segment
Top Products in Low End Segment
Name
Market
Share
Units Sold
to Seg
Revision
Date Stock Out
Pfmn
Coord
Size
Coord
List
Price MTBF
Age
Dec.31
Promo
Budget
Cust. Aware-
ness
Sales
Budget
Cust. Access-
ibility
Dec. Cust.
Survey
Cedar 22% 2,419 1/29/2021 3.0 17.0 $19.50 12000 6.60 $1,100
64% $1,333 40% 25
Ebb 20% 2,270 1/15/2022 3.0 17.0 $19.50 12000 6.60 $1,050
62% $1,085 36% 23
Bead 20% 2,208 5/24/2016 3.0 17.0 $21.00 14000 6.60 $1,300
74% $1,418 40% 23
Dell 17% 1,945 5/24/2016 3.0 17.0 $21.50 14000 6.60 $1,100
64% $1,512 42% 20
Feat 14% 1,551 7/27/2025 YES 3.0 17.0 $22.00 13000 6.60
$1,100 64% $1,235 36% 17
Acre 6% 722 12/22/2022 3.0 15.0 $20.00 13000 1.92 $800 48%
$800 27% 5
Eat 0% 39 4/8/2022 5.5 14.5 $27.00 15500 2.09 $1,050 63%
$1,085 36% 1
Cake 0% 19 8/26/2022 6.4 13.6 $26.50 14000 1.87 $1,100 66%
$1,270 40% 0
Able 0% 6 11/22/2022 YES 7.0 13.0 $27.00 18000 1.72 $1,000
61% $1,000 27% 0
CAPSTONE® COURIER Page 6
2/22/2020 Report Page
https://ww3.capsim.com/cgi-
bin/displayReport.cfm?Report=CapCourier#frontpage 8/14
Top
High End Market Segment Analysis C116647_042 Round:
2December 31, 2022
High End Statistics
Total Industry Unit Demand 3,448
Actual Industry Unit Sales 3,448
Segment % of Total Industry 11.9%
Next Year's Segment Growth Rate 16.2%
High End Customer Buying Criteria
Expectations Importance
1. Ideal Position Pfmn 10.7 Size 9.3 43%
2. Age Ideal Age = 0.0 29%
3. Reliability MTBF 20000-25000 19%
4. Price $29.00 - 39.00 9%
Perceptual Map for High End Segment
Top Products in High End Segment
Name
Market
Share
Units Sold
to Seg
Revision
Date Stock Out
Pfmn
Coord
Size
Coord
List
Price MTBF
Age
Dec.31
Promo
Budget
Cust. Aware-
ness
Sales
Budget
Cust. Access-
ibility
Dec. Cust.
Survey
Bid 22% 744 12/18/2022 10.4 9.6 $39.00 23500 1.19 $1,250
71% $1,418 53% 38
Fist 19% 652 12/22/2022 10.2 9.8 $39.00 25000 1.18 $1,100
61% $1,235 44% 36
Dixie 19% 651 12/3/2022 10.2 9.8 $39.00 24000 1.23 $1,100
63% $1,512 51% 36
Cid 19% 641 11/15/2022 10.2 9.8 $37.50 23000 1.25 $1,000
58% $1,333 44% 30
Adam 14% 478 11/16/2022 10.0 10.0 $37.00 22000 1.27 $800
47% $800 32% 21
Bold 5% 188 7/27/2022 8.8 13.5 $34.00 22000 1.67 $1,300 72%
$681 53% 5
Daze 1% 28 8/22/2022 6.8 13.3 $29.00 18100 1.84 $1,100 66%
$1,440 51% 1
Echo 1% 19 7/20/2022 6.4 13.6 $27.00 16000 1.40 $1,050 57%
$775 26% 0
Buddy 1% 18 9/18/2022 6.2 11.4 $34.00 16000 1.64 $1,300 72%
$737 53% 1
Dot 0% 10 11/13/2022 11.8 13.9 $34.00 27000 1.47 $1,100 62%
$1,368 51% 0
Coat 0% 10 11/3/2022 11.8 13.9 $32.50 27000 1.48 $1,000 56%
$1,206 44% 0
Able 0% 4 11/22/2022 YES 7.0 13.0 $27.00 18000 1.72 $1,000
61% $1,000 32% 1
CAPSTONE® COURIER Page 7
2/22/2020 Report Page
https://ww3.capsim.com/cgi-
bin/displayReport.cfm?Report=CapCourier#frontpage 9/14
Top
Performance Market Segment Analysis C116647_042 Round:
2December 31, 2022
Performance Statistics
Total Industry Unit Demand 2,749
Actual Industry Unit Sales 2,749
Segment % of Total Industry 9.5%
Next Year's Segment Growth Rate 19.8%
Performance Customer Buying Criteria
Expectations Importance
1. Reliability MTBF 22000-27000 43%
2. Ideal Position Pfmn 11.4 Size 14.6 29%
3. Price $24.00 - 34.00 19%
4. Age Ideal Age = 1.0 9%
Perceptual Map for Performance Segment
Top Products in Performance Segment
Name
Market
Share
Units Sold
to Seg
Revision
Date Stock Out
Pfmn
Coord
Size
Coord
List
Price MTBF
Age
Dec.31
Promo
Budget
Cust. Aware-
ness
Sales
Budget
Cust. Access-
ibility
Dec. Cust.
Survey
Dot 27% 742 11/13/2022 11.8 13.9 $34.00 27000 1.47 $1,100
62% $1,368 38% 35
Coat 27% 737 11/3/2022 11.8 13.9 $32.50 27000 1.48 $1,000
56% $1,206 33% 34
Foam 26% 723 11/11/2022 11.8 14.2 $34.00 27000 1.47 $1,100
59% $1,235 35% 35
Aft 13% 364 8/5/2022 10.0 15.0 $32.00 24000 1.72 $800 46%
$800 25% 12
Bold 4% 117 7/27/2022 8.8 13.5 $34.00 22000 1.67 $1,300 72%
$681 23% 3
Edge 2% 64 6/30/2018 YES 9.4 15.5 $34.00 25000 4.50 $300
25% $155 17% 7
Daze 0% 1 8/22/2022 6.8 13.3 $29.00 18100 1.84 $1,100 66%
$1,440 38% 0
CAPSTONE® COURIER Page 8
2/22/2020 Report Page
https://ww3.capsim.com/cgi-
bin/displayReport.cfm?Report=CapCourier#frontpage 10/14
Top
Size Market Segment Analysis C116647_042 Round:
2December 31, 2022
Size Statistics
Total Industry Unit Demand 2,776
Actual Industry Unit Sales 2,776
Segment % of Total Industry 9.6%
Next Year's Segment Growth Rate 18.3%
Size Customer Buying Criteria
Expectations Importance
1. Ideal Position Pfmn 5.4 Size 8.6 43%
2. Age Ideal Age = 1.5 29%
3. Reliability MTBF 16000-21000 19%
4. Price $24.00 - 34.00 9%
Perceptual Map for Size Segment
Top Products in Size Segment
Name
Market
Share
Units Sold
to Seg
Revision
Date Stock Out
Pfmn
Coord
Size
Coord
List
Price MTBF
Age
Dec.31
Promo
Budget
Cust. Aware-
ness
Sales
Budget
Cust. Access-
ibility
Dec. Cust.
Survey
Fume 26% 708 11/9/2022 5.4 8.4 $34.00 19000 1.48 $1,100
59% $1,235 39% 39
Cure 26% 708 9/10/2022 5.4 8.6 $32.50 17000 1.56 $1,000 56%
$1,206 37% 33
Dune 25% 687 11/13/2022 5.8 8.6 $34.00 19000 1.50 $1,100
62% $1,368 42% 39
Agape 13% 348 11/9/2022 5.0 9.0 $32.00 18500 1.58 $700 40%
$700 27% 26
Buddy 8% 225 9/18/2022 6.2 11.4 $34.00 16000 1.64 $1,300
72% $737 28% 7
Egg 3% 75 12/24/2022 6.9 13.4 $34.00 19000 2.30 $1,050 56%
$775 29% 0
Echo 1% 16 7/20/2022 6.4 13.6 $27.00 16000 1.40 $1,050 57%
$775 29% 0
Able 0% 4 11/22/2022 YES 7.0 13.0 $27.00 18000 1.72 $1,000
61% $1,000 27% 0
Daze 0% 4 8/22/2022 6.8 13.3 $29.00 18100 1.84 $1,100 66%
$1,440 42% 0
Cake 0% 1 8/26/2022 6.4 13.6 $26.50 14000 1.87 $1,100 66%
$1,270 37% 0
CAPSTONE® COURIER Page 9
2/22/2020 Report Page
https://ww3.capsim.com/cgi-
bin/displayReport.cfm?Report=CapCourier#frontpage 11/14
Top
Market Share Report C116647_042 Round: 2December 31, 2022
Actual Market Share in Units
Trad Low High Pfmn Size Total
Industry Unit
Sales 8,809 11,180 3,448 2,749 2,776 28,961
% of Market 30.4% 38.6% 11.9% 9.5% 9.6% 100.0%
Able 11.2% 0.1% 0.1% 0.0% 0.1% 3.5%
Acre 4.0% 6.5% 3.7%
Adam 13.9% 1.6%
Aft 0.1% 13.2% 1.3%
Agape 12.5% 1.2%
Total 15.2% 6.5% 14.0% 13.3% 12.7% 11.3%
Baker 11.2% 0.0% 3.4%
Bead 0.0% 19.8% 7.6%
Bid 21.6% 2.6%
Bold 5.5% 4.3% 1.1%
Buddy 0.5% 8.1% 0.8%
Total 11.2% 19.8% 27.5% 4.3% 8.1% 15.5%
Cake 15.1% 0.2% 0.1% 4.7%
Cedar 0.0% 21.6% 8.4%
Cid 18.6% 2.2%
Coat 0.3% 26.8% 2.6%
Cure 25.5% 2.4%
Total 15.1% 21.8% 18.9% 26.8% 25.6% 20.3%
Daze 16.0% 0.8% 0.1% 0.1% 5.0%
Dell 0.0% 17.4% 6.7%
Dixie 18.9% 2.3%
Dot 0.3% 27.0% 2.6%
Dune 24.7% 2.4%
Total 16.0% 17.4% 20.0% 27.0% 24.9% 18.9%
Eat 16.3% 0.3% 5.1%
Ebb 0.0% 20.3% 7.8%
Echo 13.3% 0.5% 0.6% 4.2%
Edge 2.3% 0.2%
Egg 0.0% 2.7% 0.3%
Total 29.6% 20.7% 0.6% 2.3% 3.3% 17.6%
Fast 12.9% 3.9%
Feat 0.0% 13.9% 5.4%
Fist 18.9% 2.3%
Foam 0.1% 26.3% 2.5%
Fume 25.5% 2.5%
Total 12.9% 13.9% 19.0% 26.3% 25.5% 16.5%
Potential Market Share in Units
Trad Low High Pfmn Size Total
Units
Demanded 8,809 11,180 3,448 2,749 2,776 28,961
% of Market 30.4% 38.6% 11.9% 9.5% 9.6% 100.0%
Able 13.5% 0.1% 0.2% 0.2% 4.2%
Acre 4.1% 6.8% 3.9%
Adam 13.9% 1.7%
Aft 0.1% 13.3% 1.3%
Agape 12.5% 1.2%
Total 17.8% 6.9% 14.0% 13.3% 12.7% 12.2%
Baker 10.8% 3.3%
Bead 19.6% 7.6%
Bid 21.6% 2.6%
Bold 5.5% 4.0% 1.0%
Buddy 0.5% 8.1% 0.8%
Total 10.8% 19.6% 27.5% 4.0% 8.1% 15.3%
Cake 14.7% 0.2% 4.5%
Cedar 21.5% 8.3%
Cid 18.6% 2.2%
Coat 0.3% 25.1% 2.4%
Cure 25.5% 2.4%
Total 14.7% 21.6% 18.9% 25.1% 25.5% 19.9%
Daze 15.5% 0.8% 0.1% 0.1% 4.8%
Dell 17.2% 6.7%
Dixie 18.9% 2.2%
Dot 0.3% 25.3% 2.4%
Dune 24.7% 2.4%
Total 15.5% 17.3% 20.0% 25.3% 24.9% 18.6%
Eat 15.8% 0.3% 4.9%
Ebb 20.1% 7.8%
Echo 12.9% 0.5% 0.6% 4.0%
Edge 7.6% 0.7%
Egg 2.7% 0.3%
Total 28.7% 20.5% 0.6% 7.6% 3.3% 17.7%
Fast 12.5% 3.8%
Feat 14.2% 5.5%
Fist 18.9% 2.2%
Foam 0.1% 24.7% 2.4%
Fume 25.5% 2.4%
Total 12.5% 14.2% 19.0% 24.6% 25.5% 16.3%
CAPSTONE® COURIER Page 10
2/22/2020 Report Page
https://ww3.capsim.com/cgi-
bin/displayReport.cfm?Report=CapCourier#frontpage 12/14
Top
Perceptual Map C116647_042 Round: 2December 31, 2022
Perceptual Map for All Segments
Andrews
Name Pfmn Size Revised
Able 7.0 13.0 11/22/2022
Acre 3.0 15.0 12/22/2022
Adam 10.0 10.0 11/16/2022
Aft 10.0 15.0 8/5/2022
Agape 5.0 9.0 11/9/2022
Aque 10.0 10.0 7/2/2022
Baldwin
Name Pfmn Size Revised
Baker 6.5 13.5 12/5/2022
Bead 3.0 17.0 5/24/2016
Bid 10.4 9.6 12/18/2022
Bold 8.8 13.5 7/27/2022
Buddy 6.2 11.4 9/18/2022
Chester
Name Pfmn Size Revised
Cake 6.4 13.6 8/26/2022
Cedar 3.0 17.0 1/29/2021
Cid 10.2 9.8 11/15/2022
Coat 11.8 13.9 11/3/2022
Cure 5.4 8.6 9/10/2022
Digby
Name Pfmn Size Revised
Daze 6.8 13.3 8/22/2022
Dell 3.0 17.0 5/24/2016
Dixie 10.2 9.8 12/3/2022
Dot 11.8 13.9 11/13/2022
Dune 5.8 8.6 11/13/2022
Erie
Name Pfmn Size Revised
Eat 5.5 14.5 4/8/2022
Ebb 3.0 17.0 1/15/2022
Echo 6.4 13.6 7/20/2022
Edge 9.4 15.5 6/30/2018
Egg 6.9 13.4 12/24/2022
Ferris
Name Pfmn Size Revised
Fast 5.5 14.5 4/22/2022
Feat 3.0 17.0 7/27/2025
Fist 10.2 9.8 12/22/2022
Foam 11.8 14.2 11/11/2022
Fume 5.4 8.4 11/9/2022
Fox 11.0 9.0 12/12/2022
CAPSTONE® COURIER Page 11
2/22/2020 Report Page
https://ww3.capsim.com/cgi-
bin/displayReport.cfm?Report=CapCourier#frontpage 13/14
Top
HR/TQM Report C116647_042 Round: 2December 31, 2022
HUMAN RESOURCES SUMMARY
Andrews Baldwin Chester Digby Erie Ferris
Needed Complement 580 706 898 887 728 801
Complement 580 706 898 887 728 801
1st Shift Complement 580 534 650 678 538 541
2nd Shift Complement 0 172 249 209 190 260
Overtime% 0.0% 0.0% 0.0% 0.0% 0.0% 0.0%
Turnover Rate 7.3% 8.8% 9.0% 8.8% 9.0% 8.8%
New Employees 42 62 205 255 65 179
Separated Employees 119 56 0 0 2 0
Recruiting Spend $4,000 $2,000 $2,000 $2,200 $2,000 $2,500
Training Hours 70 30 25 30 25 30
Productivity Index 106.8% 101.1% 100.3% 101.2% 100.0%
101.4%
Recruiting Cost $211 $186 $615 $816 $196 $627
Separation Cost $595 $280 $0 $0 $10 $0
Training Cost $812 $424 $449 $532 $364 $481
Total HR Admin Cost $1,618 $890 $1,065 $1,348 $570 $1,108
Labor Contract Next Year
Wages $23.15 $23.15 $23.15 $23.15 $23.15 $23.15
Benefits 2,500 2,500 2,500 2,500 2,500 2,500
Profit Sharing 2.0% 2.0% 2.0% 2.0% 2.0% 2.0%
Annual Raise 5.0% 5.0% 5.0% 5.0% 5.0% 5.0%
Starting Negotiation Position
Wages
Benefits
Profit Sharing
Annual Raise
Ceiling Negotiation Position
Wages
Benefits
Profit Sharing
Annual Raise
Adjusted Labor Demands
Wages
Benefits
Profit Sharing
Annual Raise
Strike Days
TQM SUMMARY
Andrews Baldwin Chester Digby Erie Ferris
Process Mgt Budgets Last Year
CPI Systems $0 $0 $0 $0 $0 $0
Vendor/JIT $0 $0 $0 $0 $0 $0
Quality Initiative Training $0 $0 $0 $0 $0 $0
Channel Support Systems $0 $0 $0 $0 $0 $0
Concurrent Engineering $0 $0 $0 $0 $0 $0
UNEP Green Programs $0 $0 $0 $0 $0 $0
TQM Budgets Last Year
Benchmarking $0 $0 $0 $0 $0 $0
Quality Function Deployment Effort $0 $0 $0 $0 $0 $0
CCE/6 Sigma Training $0 $0 $0 $0 $0 $0
GEMI TQEM Sustainability Initiatives $0 $0 $0 $0 $0 $0
Total Expenditures $0 $0 $0 $0 $0 $0
Cumulative Impacts
Material Cost Reduction 0.00% 0.00% 0.00% 0.00% 0.00%
0.00%
Labor Cost Reduction 0.00% 0.00% 0.00% 0.00% 0.00% 0.00%
Reduction R&D Cycle Time 0.00% 0.00% 0.00% 0.00% 0.00%
0.00%
Reduction Admin Costs 0.00% 0.00% 0.00% 0.00% 0.00%
0.00%
Demand Increase 0.00% 0.00% 0.00% 0.00% 0.00% 0.00%
CAPSTONE® COURIER Page 12
2/22/2020 Report Page
https://ww3.capsim.com/cgi-
bin/displayReport.cfm?Report=CapCourier#frontpage 14/14
2/22/2020 Report Page
https://ww3.capsim.com/cgi-
bin/displayReport.cfm?Report=CapCourier#frontpage 1/14
Page 1 Front Page
Page 2 Stocks & Bonds
Page 3 Financial Summary
Page 4 Production Analysis
Page 5 Traditional Segment Analysis
Page 6 Low End Segment Analysis
Page 7 High End Segment Analysis
Page 8 Performance Segment Analysis
Page 9 Size Segment Analysis
Page 10 Market Share
Page 11 Perceptual Map
Page 12 HR/TQM Report
PRINT
2/22/2020 Report Page
https://ww3.capsim.com/cgi-
bin/displayReport.cfm?Report=CapCourier#frontpage 2/14
Top
Round: 1
Dec. 31, 2021
Chen m
C116647_042
Andrews
Manling Chen
Baldwin
Chester
Digby
Erie
Ferris
Selected Financial Statistics
Andrews Baldwin Chester Digby Erie Ferris
ROS 0.3% 5.9% 2.8% 4.7% 3.9% 5.3%
Asset Turnover 1.09 1.13 1.09 1.10 0.99 1.26
ROA 0.3% 6.7% 3.1% 5.2% 3.9% 6.6%
Leverage (Assets/Equity) 1.9 1.9 2.0 2.0 2.0 2.0
ROE 0.6% 13.0% 6.3% 10.2% 7.7% 13.0%
Emergency Loan $0 $0 $0 $0 $0 $0
Sales $113,812,233 $125,255,995 $118,816,949 $117,121,154
$111,729,614 $114,288,313
EBIT $5,914,081 $17,527,255 $11,255,607 $14,409,026
$13,083,261 $14,216,878
Profits $318,193 $7,412,779 $3,362,028 $5,501,709 $4,384,585
$6,010,684
Cumulative Profit $4,506,700 $11,601,286 $7,550,536
$9,690,216 $8,573,092 $10,199,192
SG&A / Sales 12.7% 12.8% 12.9% 14.2% 10.3% 14.5%
Contrib. Margin % 27.3% 33.1% 29.1% 33.1% 29.5% 32.9%
CAPSTONE® COURIER Page 1
2/22/2020 Report Page
https://ww3.capsim.com/cgi-
bin/displayReport.cfm?Report=CapCourier#frontpage 3/14
Top
Stocks & Bonds C116647_042
Round: 1
December 31 , 2021
Stock Market Summary
Company Close Change Shares MarketCap ($M) Book Value
PerShare EPS Dividend Yield P/E
Andrews $31.16 ($3.09) 2,291,939 $71 $24.42 $0.14 $1.00
3.2% 222.9
Baldwin $44.88 $10.63 2,046,274 $92 $27.83 $3.62 $0.00 0.0%
12.4
Chester $37.00 $2.75 2,069,366 $77 $25.94 $1.62 $0.00 0.0%
22.8
Digby $41.16 $6.90 2,015,280 $83 $26.78 $2.73 $0.00 0.0%
15.1
Erie $39.02 $4.77 2,128,085 $83 $26.65 $2.06 $0.00 0.0% 18.9
Ferris $41.34 $7.08 2,000,000 $83 $23.13 $3.01 $3.85 9.3%
13.8
Bond Market Summary
Company Series# Face Yield Close$ S&P
Andrews
12.5S2024 $10,924,506 12.1% 102.92 BB
14.0S2026 $20,850,000 12.7% 109.90 BB
11.3S2031 $10,000,000 11.3% 100.00 BB
Baldwin
11.0S2022 $993,022 11.1% 99.46 B
12.5S2024 $13,900,000 12.2% 102.18 B
14.0S2026 $20,850,000 12.9% 108.74 B
Chester
11.0S2022 $1,788,091 11.1% 99.28 B
12.5S2024 $13,900,000 12.3% 101.69 B
14.0S2026 $20,850,000 13.0% 107.97 B
Digby
12.5S2024 $13,828,904 12.3% 101.93 B
14.0S2026 $20,850,000 12.9% 108.35 B
Erie
11.0S2022 $3,809,769 11.1% 99.28 B
12.5S2024 $13,900,000 12.3% 101.69 B
14.0S2026 $20,850,000 13.0% 107.97 B
Ferris
12.5S2024 $5,899,561 12.3% 101.93 B
14.0S2026 $20,850,000 12.9% 108.35 B
Next Year's Prime Rate 7.50%
CAPSTONE® COURIER Page 2
2/22/2020 Report Page
https://ww3.capsim.com/cgi-
bin/displayReport.cfm?Report=CapCourier#frontpage 4/14
Top
Financial Summary C116647_042 Round: 1December 31, 2021
Cash Flow Statement Survey Andrews Baldwin Chester Digby
Erie Ferris
Cash flows from operating activities
Net Income (Loss) $318 $7,413 $3,362 $5,502 $4,385 $6,011
Adjustment for non-cash items:
Depreciation $9,347 $7,553 $7,573 $7,267 $7,987 $5,853
Extraordinary gains/losses/writeoffs $75 $178 $210 $234
$131 $774
Changes in current assets and liabilities:
Accounts payable ($372) $277 $313 ($114) ($101) ($264)
Inventory $6,953 ($839) ($807) ($1,526) ($1,289) ($1,442)
Accounts receivable ($1,047) ($1,988) ($1,458) ($1,319)
($876) ($1,086)
Net cash from operations $15,273 $12,595 $9,193 $10,043
$10,236 $9,846
Cash flows from investing activities
Plant improvements (net) ($26,400) ($3,875) ($4,770) ($800)
($9,080) $15,220
Cash flows from financing activities
Dividends paid ($2,292) $0 $0 $0 $0 ($7,699)
Sales of common stock $12,000 $1,585 $2,376 $523 $4,387 $0
Purchase of common stock ($2,000) $0 $0 $0 $0 $0
Cash from long term debt issued $10,000 $0 $0 $0 $0 $0
Early retirement of long term debt ($10,000) ($5,926) ($5,135)
($6,988) ($3,124) ($15,211)
Retirement of current debt $0 $0 $0 $0 $0 $0
Cash from current debt borrowing $0 $11,359 $11,359 $11,359
$11,359 $11,359
Cash from emergency loan $0 $0 $0 $0 $0 $0
Net cash from financing activities $7,708 $7,017 $8,599 $4,894
$12,622 ($11,551)
Net change in cash position ($3,419) $15,737 $13,022 $14,137
$13,777 $13,515
Balance Sheet Survey Andrews Baldwin Chester Digby Erie
Ferris
Cash $15 $19,171 $16,456 $17,571 $17,211 $16,948
Accounts Receivable $9,354 $10,295 $9,766 $9,626 $9,183
$9,394
Inventory $1,664 $9,456 $9,424 $10,143 $9,907 $10,059
Total Current Assets $11,033 $38,922 $35,646 $37,340 $36,301
$36,401
Plant and equipment $140,200 $113,300 $113,600 $109,000
$119,800 $87,800
Accumulated Depreciation ($47,280) ($41,320) ($40,773)
($39,867) ($42,987) ($33,520)
Total Fixed Assets $92,920 $71,980 $72,827 $69,133 $76,813
$54,280
Total Assets $103,953 $110,902 $108,473 $106,474 $113,114
$90,681
Accounts Payable $6,211 $6,860 $6,896 $6,469 $6,482 $6,319
Current Debt $0 $11,359 $11,359 $11,359 $11,359 $11,359
Total Current Liabilities $6,211 $18,219 $18,255 $17,828
$17,841 $17,678
Long Term Debt $41,775 $35,743 $36,538 $34,679 $38,560
$26,750
Total Liabilities $47,985 $53,962 $54,793 $52,507 $56,400
$44,428
Common Stock $29,347 $19,945 $20,736 $18,883 $22,747
$18,360
Retained Earnings $26,621 $36,995 $32,944 $35,084 $33,967
$27,894
Total Equity $55,968 $56,940 $53,680 $53,967 $56,714 $46,253
Total Liabilities & Owners' Equity $103,953 $110,902 $108,473
$106,474 $113,114 $90,681
Income Statement Survey Andrews Baldwin Chester Digby Erie
Ferris
Sales $113,812 $125,256 $118,817 $117,121 $111,730 $114,288
Variable Costs (Labor, Material, Carry) $82,717 $83,762
$84,224 $78,399 $78,763 $76,650
Contribution Margin $31,095 $41,494 $34,593 $38,722 $32,967
$37,638
Depreciation $9,347 $7,553 $7,573 $7,267 $7,987 $5,853
SGA (R&D, Promo, Sales, Admin) $14,480 $16,067 $15,358
$16,681 $11,500 $16,566
Other (Fees, Writeoffs, TQM, Bonuses) $1,355 $346 $406 $365
$397 $1,002
EBIT $5,914 $17,527 $11,256 $14,409 $13,083 $14,217
Interest (Short term, Long term) $5,415 $5,890 $5,978 $5,772
$6,200 $4,781
Taxes $175 $4,073 $1,847 $3,023 $2,409 $3,303
Profit Sharing $6 $151 $69 $112 $89 $123
Net Profit $318 $7,413 $3,362 $5,502 $4,385 $6,011
CAPSTONE® COURIER Page 3
2/22/2020 Report Page
https://ww3.capsim.com/cgi-
bin/displayReport.cfm?Report=CapCourier#frontpage 5/14
Top
Production Analysis C116647_042 Round: 1December 31, 2021
Production Information
Name
Primary
Segment
Units
Sold
Unit
Inven
tory Revision Date
Age
Dec.31 MTBF
Pfmn
Coord
Size
Coord Price
Material
Cost
Labor
Cost
Contr.
Marg.
2nd Shift
&
Over-
time
Auto
mation
Next
Round
Capacity
Next
Round
Plant
Utiliz.
Able Trad 1,130 0 5/29/2021 2.3 17500 6.0 14.0 $27.00 $11.16
$7.87 29% 0% 4.0 2,200 52%
Acre Low 1,918 101 12/7/2021 2.8 14000 4.0 16.0 $20.00 $8.07
$7.70 24% 43% 5.0 1,800 141%
Adam High 397 0 11/2/2021 1.4 23000 9.0 11.0 $37.00 $15.86
$8.99 34% 0% 3.0 1,100 40%
Aft Pfmn 454 0 6/1/2021 2.0 25000 10.0 16.0 $32.00 $15.07
$8.99 24% 0% 3.0 700 63%
Agape Size 492 6 7/22/2021 2.0 19000 4.0 10.0 $32.00 $13.27
$8.99 30% 0% 3.0 700 73%
Baker Trad 1,432 93 3/10/2021 2.5 17000 5.4 14.5 $29.50
$10.45 $7.85 36% 0% 5.0 1,600 84%
Bead Low 1,774 146 5/24/2016 5.6 14000 3.0 17.0 $21.50 $7.05
$7.57 30% 36% 6.0 1,400 134%
Bid High 453 83 12/25/2021 1.4 23500 9.2 10.8 $39.50 $16.22
$9.40 36% 11% 3.0 450 110%
Bold Pfmn 394 80 8/25/2021 1.9 22500 9.1 14.5 $34.50 $14.21
$8.98 29% 0% 3.0 600 66%
Buddy Size 388 70 8/6/2021 2.0 19000 5.1 11.2 $34.50 $12.83
$8.98 35% 0% 3.0 600 66%
Cake Trad 1,279 98 4/22/2021 2.4 15000 5.7 14.3 $27.50 $10.10
$7.85 32% 0% 5.0 1,400 85%
Cedar Low 1,942 176 1/29/2021 5.6 12000 3.0 17.0 $20.00
$6.45 $7.79 27% 50% 6.5 1,400 149%
Cid High 482 103 11/26/2021 1.4 23000 9.1 10.9 $37.50 $15.96
$8.97 33% 0% 3.0 600 91%
Coat Pfmn 481 42 11/13/2021 1.8 26000 10.6 14.7 $32.50
$16.14 $8.97 24% 0% 3.0 600 74%
Cure Size 342 67 12/17/2021 1.8 18000 4.9 9.7 $32.50 $13.42
$8.97 30% 0% 3.0 600 58%
Daze Trad 1,151 127 6/11/2021 2.3 17800 6.1 14.0 $29.50
$11.30 $7.85 34% 0% 5.0 1,400 78%
Dell Low 1,554 168 5/24/2016 5.6 14000 3.0 17.0 $22.00 $7.05
$7.29 33% 21% 6.0 1,400 120%
Dixie High 494 91 11/23/2021 1.4 23500 9.1 10.9 $39.50
$16.11 $9.36 36% 10% 3.0 500 109%
Dot Pfmn 459 64 11/3/2021 1.8 26000 10.6 14.7 $34.50 $16.14
$8.98 28% 0% 3.0 600 74%
Dune Size 394 64 11/2/2021 1.9 19000 4.9 9.8 $34.50 $13.66
$8.98 35% 0% 3.0 600 66%
Eat Trad 1,401 75 3/17/2021 2.4 16500 5.6 14.5 $27.50 $10.40
$7.85 31% 0% 5.0 1,400 92%
Ebb Low 2,002 166 1/15/2021 5.6 13000 3.0 17.0 $20.00 $6.75
$7.84 25% 54% 6.0 1,400 152%
Echo High 334 102 12/23/2021 1.4 17000 7.0 12.9 $39.50
$12.08 $8.97 37% 0% 4.0 900 44%
Edge Pfmn 312 62 6/30/2018 3.5 25000 9.4 15.5 $34.50 $14.81
$8.97 28% 0% 3.0 600 50%
Egg Size 266 93 12/24/2022 3.6 19000 4.0 11.0 $34.50 $12.60
$8.97 33% 0% 3.0 600 50%
Fast Trad 1,356 120 3/3/2021 2.5 17500 5.6 14.5 $29.50 $10.70
$8.14 34% 8% 4.0 1,200 107%
Feat Low 1,408 166 1/15/2021 5.6 13000 3.0 17.0 $22.00 $6.75
$7.86 31% 55% 5.0 1,000 153%
Fist High 422 113 12/22/2021 1.4 24000 9.1 10.9 $39.50 $16.26
$8.98 36% 0% 3.0 500 99%
Foam Pfmn 442 32 11/10/2021 1.8 26000 10.6 14.8 $34.50
$16.11 $8.98 29% 0% 4.0 600 66%
Fume Size 330 79 12/10/2021 1.8 19000 4.7 9.6 $34.50 $13.73
$8.98 34% 0% 4.0 600 58%
CAPSTONE® COURIER Page 4
2/22/2020 Report Page
https://ww3.capsim.com/cgi-
bin/displayReport.cfm?Report=CapCourier#frontpage 6/14
Top
Traditional Market Segment Analysis C116647_042 Round:
1December 31, 2021
Traditional Statistics
Total Industry Unit Demand 8,067
Actual Industry Unit Sales 8,067
Segment % of Total Industry 31.4%
Next Year's Segment Growth Rate 9.2%
Traditional Customer Buying Criteria
Expectations Importance
1. Age Ideal Age = 2.0 47%
2. Price $19.50 - 29.50 23%
3. Ideal Position Pfmn 5.7 Size 14.3 21%
4. Reliability MTBF 14000-19000 9%
Perceptual Map for Traditional Segment
Top Products in Traditional Segment
Name
Market
Share
Units Sold
to Seg
Revision
Date Stock Out
Pfmn
Coord
Size
Coord
List
Price MTBF
Age
Dec.31
Promo
Budget
Cust. Aware-
ness
Sales
Budget
Cust. Access-
ibility
Dec. Cust.
Survey
Baker 17% 1,382 3/10/2021 5.4 14.5 $29.50 17000 2.45 $1,300
67% $1,362 58% 33
Eat 17% 1,363 3/17/2021 5.6 14.5 $27.50 16500 2.44 $1,050
60% $1,015 51% 33
Fast 16% 1,309 3/3/2021 5.6 14.5 $29.50 17500 2.46 $1,100
61% $1,175 54% 31
Cake 15% 1,249 4/22/2021 5.7 14.3 $27.50 15000 2.39 $1,100
61% $1,070 53% 32
Daze 13% 1,079 6/11/2021 6.1 14.0 $29.50 17800 2.33 $1,100
61% $1,330 58% 34
Able 13% 1,078 5/29/2021 YES 6.0 14.0 $27.00 17500 2.34
$1,000 58% $1,000 50% 35
Acre 2% 169 12/7/2021 4.0 16.0 $20.00 14000 2.83 $800 50%
$800 50% 20
Bead 1% 103 5/24/2016 3.0 17.0 $21.50 14000 5.60 $1,300 65%
$1,362 58% 1
Dell 1% 92 5/24/2016 3.0 17.0 $22.00 14000 5.60 $1,100 59%
$1,396 58% 1
Ebb 1% 91 1/15/2021 3.0 17.0 $20.00 13000 5.60 $1,050 58%
$1,015 51% 1
Feat 1% 71 1/15/2021 3.0 17.0 $22.00 13000 5.60 $1,100 59%
$1,175 54% 0
Cedar 1% 71 1/29/2021 3.0 17.0 $20.00 12000 5.60 $1,100 59%
$1,123 53% 0
CAPSTONE® COURIER Page 5
2/22/2020 Report Page
https://ww3.capsim.com/cgi-
bin/displayReport.cfm?Report=CapCourier#frontpage 7/14
Top
Low End Market Segment Analysis C116647_042 Round:
1December 31, 2021
Low End Statistics
Total Industry Unit Demand 10,009
Actual Industry Unit Sales 10,009
Segment % of Total Industry 39.0%
Next Year's Segment Growth Rate 11.7%
Low End Customer Buying Criteria
Expectations Importance
1. Price $14.50 - 24.50 53%
2. Age Ideal Age = 7.0 24%
3. Ideal Position Pfmn 2.2 Size 17.8 16%
4. Reliability MTBF 12000-17000 7%
Perceptual Map for Low End Segment
Top Products in Low End Segment
Name
Market
Share
Units Sold
to Seg
Revision
Date Stock Out
Pfmn
Coord
Size
Coord
List
Price MTBF
Age
Dec.31
Promo
Budget
Cust. Aware-
ness
Sales
Budget
Cust. Access-
ibility
Dec. Cust.
Survey
Ebb 19% 1,910 1/15/2021 3.0 17.0 $20.00 13000 5.60 $1,050
58% $1,015 35% 18
Cedar 19% 1,871 1/29/2021 3.0 17.0 $20.00 12000 5.60 $1,100
59% $1,123 37% 18
Acre 17% 1,749 12/7/2021 4.0 16.0 $20.00 14000 2.83 $800
50% $800 32% 8
Bead 17% 1,671 5/24/2016 3.0 17.0 $21.50 14000 5.60 $1,300
65% $1,362 40% 16
Dell 15% 1,462 5/24/2016 3.0 17.0 $22.00 14000 5.60 $1,100
59% $1,396 40% 14
Feat 13% 1,336 1/15/2021 3.0 17.0 $22.00 13000 5.60 $1,100
59% $1,175 37% 13
Eat 0% 8 3/17/2021 5.6 14.5 $27.50 16500 2.44 $1,050 60%
$1,015 35% 0
Cake 0% 2 4/22/2021 5.7 14.3 $27.50 15000 2.39 $1,100 61%
$1,070 37% 0
CAPSTONE® COURIER Page 6
2/22/2020 Report Page
https://ww3.capsim.com/cgi-
bin/displayReport.cfm?Report=CapCourier#frontpage 8/14
Top
High End Market Segment Analysis C116647_042 Round:
1December 31, 2021
High End Statistics
Total Industry Unit Demand 2,967
Actual Industry Unit Sales 2,967
Segment % of Total Industry 11.6%
Next Year's Segment Growth Rate 16.2%
High End Customer Buying Criteria
Expectations Importance
1. Ideal Position Pfmn 9.8 Size 10.2 43%
2. Age Ideal Age = 0.0 29%
3. Reliability MTBF 20000-25000 19%
4. Price $29.50 - 39.50 9%
Perceptual Map for High End Segment
Top Products in High End Segment
Name
Market
Share
Units Sold
to Seg
Revision
Date Stock Out
Pfmn
Coord
Size
Coord
List
Price MTBF
Age
Dec.31
Promo
Budget
Cust. Aware-
ness
Sales
Budget
Cust. Access-
ibility
Dec. Cust.
Survey
Dixie 17% 494 11/23/2021 9.1 10.9 $39.50 23500 1.40 $1,100
57% $1,396 53% 29
Cid 16% 482 11/26/2021 9.1 10.9 $37.50 23000 1.39 $1,000
54% $1,123 46% 27
Bid 15% 453 12/25/2021 9.2 10.8 $39.50 23500 1.35 $1,250
62% $1,362 51% 31
Fist 14% 422 12/22/2021 9.1 10.9 $39.50 24000 1.36 $1,000
54% $1,175 49% 29
Adam 13% 397 11/2/2021 YES 9.0 11.0 $37.00 23000 1.43
$800 48% $800 40% 23
Echo 11% 334 12/23/2021 7.0 12.9 $39.50 17000 1.36 $900
51% $725 38% 2
Bold 4% 107 8/25/2021 9.1 14.5 $34.50 22500 1.92 $1,300 61%
$654 51% 4
Daze 1% 41 6/11/2021 6.1 14.0 $29.50 17800 2.33 $1,100 61%
$1,330 53% 1
Coat 1% 37 11/13/2021 10.6 14.7 $32.50 26000 1.81 $1,000
52% $1,016 46% 1
Dot 1% 37 11/3/2021 10.6 14.7 $34.50 26000 1.82 $1,100 55%
$1,263 53% 1
Foam 1% 33 11/10/2021 10.6 14.8 $34.50 26000 1.81 $1,000
52% $1,175 49% 1
Buddy 1% 24 8/6/2021 5.1 11.2 $34.50 19000 2.00 $1,300 61%
$708 51% 1
CAPSTONE® COURIER Page 7
2/22/2020 Report Page
https://ww3.capsim.com/cgi-
bin/displayReport.cfm?Report=CapCourier#frontpage 9/14
Top
Performance Market Segment Analysis C116647_042 Round:
1December 31, 2021
Performance Statistics
Total Industry Unit Demand 2,294
Actual Industry Unit Sales 2,294
Segment % of Total Industry 8.9%
Next Year's Segment Growth Rate 19.8%
Performance Customer Buying Criteria
Expectations Importance
1. Reliability MTBF 22000-27000 43%
2. Ideal Position Pfmn 10.4 Size 15.3 29%
3. Price $24.50 - 34.50 19%
4. Age Ideal Age = 1.0 9%
Perceptual Map for Performance Segment
Top Products in Performance Segment
Name
Market
Share
Units Sold
to Seg
Revision
Date Stock Out
Pfmn
Coord
Size
Coord
List
Price MTBF
Age
Dec.31
Promo
Budget
Cust. Aware-
ness
Sales
Budget
Cust. Access-
ibility
Dec. Cust.
Survey
Coat 19% 444 11/13/2021 10.6 14.7 $32.50 26000 1.81 $1,000
52% $1,016 33% 28
Aft 19% 436 6/1/2021 YES 10.0 16.0 $32.00 25000 2.04 $800
46% $800 30% 20
Dot 18% 423 11/3/2021 10.6 14.7 $34.50 26000 1.82 $1,100
55% $1,263 37% 27
Foam 18% 409 11/10/2021 10.6 14.8 $34.50 26000 1.81 $1,000
52% $1,175 35% 26
Edge 13% 290 6/30/2018 9.4 15.5 $34.50 25000 3.50 $300 33%
$145 25% 12
Bold 13% 287 8/25/2021 9.1 14.5 $34.50 22500 1.92 $1,300
61% $654 29% 7
Daze 0% 2 6/11/2021 6.1 14.0 $29.50 17800 2.33 $1,100 61%
$1,330 37% 0
Able 0% 2 5/29/2021 YES 6.0 14.0 $27.00 17500 2.34 $1,000
58% $1,000 30% 0
Fast 0% 2 3/3/2021 5.6 14.5 $29.50 17500 2.46 $1,100 61%
$1,175 35% 0
CAPSTONE® COURIER Page 8
2/22/2020 Report Page
https://ww3.capsim.com/cgi-
bin/displayReport.cfm?Report=CapCourier#frontpage 10/14
Top
Size Market Segment Analysis C116647_042 Round:
1December 31, 2021
Size Statistics
Total Industry Unit Demand 2,347
Actual Industry Unit Sales 2,347
Segment % of Total Industry 9.1%
Next Year's Segment Growth Rate 18.3%
Size Customer Buying Criteria
Expectations Importance
1. Ideal Position Pfmn 4.7 Size 9.6 43%
2. Age Ideal Age = 1.5 29%
3. Reliability MTBF 16000-21000 19%
4. Price $24.50 - 34.50 9%
Perceptual Map for Size Segment
Top Products in Size Segment
Name
Market
Share
Units Sold
to Seg
Revision
Date Stock Out
Pfmn
Coord
Size
Coord
List
Price MTBF
Age
Dec.31
Promo
Budget
Cust. Aware-
ness
Sales
Budget
Cust. Access-
ibility
Dec. Cust.
Survey
Agape 21% 490 7/22/2021 4.0 10.0 $32.00 19000 2.02 $700
42% $700 35% 25
Dune 17% 393 11/2/2021 4.9 9.8 $34.50 19000 1.88 $1,100 55%
$1,263 44% 37
Buddy 15% 364 8/6/2021 5.1 11.2 $34.50 19000 2.00 $1,300
61% $708 36% 15
Cure 14% 335 12/17/2021 4.9 9.7 $32.50 18000 1.81 $1,000
52% $1,016 39% 34
Fume 14% 329 12/10/2021 4.7 9.6 $34.50 19000 1.82 $1,000
52% $1,175 42% 37
Egg 11% 266 12/24/2022 4.0 11.0 $34.50 19000 3.60 $900 49%
$725 35% 6
Baker 2% 36 3/10/2021 5.4 14.5 $29.50 17000 2.45 $1,300 67%
$1,362 36% 1
Able 1% 34 5/29/2021 YES 6.0 14.0 $27.00 17500 2.34 $1,000
58% $1,000 35% 1
Daze 1% 28 6/11/2021 6.1 14.0 $29.50 17800 2.33 $1,100 61%
$1,330 44% 1
Fast 1% 26 3/3/2021 5.6 14.5 $29.50 17500 2.46 $1,100 61%
$1,175 42% 0
Cake 1% 25 4/22/2021 5.7 14.3 $27.50 15000 2.39 $1,100 61%
$1,070 39% 1
Eat 1% 23 3/17/2021 5.6 14.5 $27.50 16500 2.44 $1,050 60%
$1,015 35% 0
CAPSTONE® COURIER Page 9
2/22/2020 Report Page
https://ww3.capsim.com/cgi-
bin/displayReport.cfm?Report=CapCourier#frontpage 11/14
Top
Market Share Report C116647_042 Round: 1December 31, 2021
Actual Market Share in Units
Trad Low High Pfmn Size Total
Industry Unit
Sales 8,067 10,009 2,967 2,294 2,347 25,684
% of Market 31.4% 39.0% 11.6% 8.9% 9.1% 100.0%
Able 13.4% 0.6% 0.1% 1.4% 4.4%
Acre 2.1% 17.5% 7.5%
Adam 13.4% 1.5%
Aft 0.6% 19.0% 1.8%
Agape 0.0% 0.0% 20.9% 1.9%
Total 15.5% 17.5% 14.6% 19.1% 22.3% 17.1%
Baker 17.1% 0.5% 0.0% 1.5% 5.6%
Bead 1.3% 16.7% 6.9%
Bid 15.3% 1.8%
Bold 3.6% 12.5% 1.5%
Buddy 0.8% 15.5% 1.5%
Total 18.4% 16.7% 20.2% 12.5% 17.0% 17.3%
Cake 15.5% 0.0% 0.1% 0.0% 1.1% 5.0%
Cedar 0.9% 18.7% 7.6%
Cid 16.2% 1.9%
Coat 1.3% 19.3% 1.9%
Cure 0.1% 0.0% 14.3% 1.3%
Total 16.4% 18.7% 17.6% 19.4% 15.3% 17.6%
Daze 13.4% 1.4% 0.1% 1.2% 4.5%
Dell 1.1% 14.6% 6.0%
Dixie 16.6% 1.9%
Dot 1.2% 18.4% 1.8%
Dune 0.0% 16.8% 1.5%
Total 14.5% 14.6% 19.3% 18.5% 18.0% 15.8%
Eat 16.9% 0.1% 0.3% 0.0% 1.0% 5.5%
Ebb 1.1% 19.1% 7.8%
Echo 11.3% 1.3%
Edge 0.8% 12.6% 1.2%
Egg 0.0% 11.3% 1.0%
Total 18.0% 19.2% 12.3% 12.6% 12.3% 16.8%
Fast 16.2% 0.7% 0.1% 1.1% 5.3%
Feat 0.9% 13.3% 5.5%
Fist 14.2% 1.6%
Foam 1.1% 17.8% 1.7%
Fume 0.0% 14.0% 1.3%
Total 17.1% 13.3% 16.0% 17.9% 15.1% 15.4%
Potential Market Share in Units
Trad Low High Pfmn Size Total
Units
Demanded 8,067 10,009 2,967 2,294 2,347 25,684
% of Market 31.4% 39.0% 11.6% 8.9% 9.1% 100.0%
Able 14.8% 0.6% 0.1% 1.6% 4.9%
Acre 2.0% 17.5% 7.5%
Adam 14.5% 1.7%
Aft 0.6% 19.1% 1.8%
Agape 20.8% 1.9%
Total 16.9% 17.5% 15.7% 19.2% 22.4% 17.7%
Baker 16.9% 0.5% 1.5% 5.5%
Bead 1.3% 16.7% 6.9%
Bid 15.1% 1.7%
Bold 3.5% 12.5% 1.5%
Buddy 0.8% 15.5% 1.5%
Total 18.1% 16.7% 19.9% 12.5% 17.0% 17.2%
Cake 15.2% 0.1% 1.1% 4.9%
Cedar 0.9% 18.7% 7.6%
Cid 15.9% 1.8%
Coat 1.2% 19.3% 1.9%
Cure 0.1% 14.2% 1.3%
Total 16.2% 18.7% 17.3% 19.3% 15.3% 17.5%
Daze 13.1% 1.4% 0.1% 1.2% 4.4%
Dell 1.1% 14.6% 6.1%
Dixie 16.3% 1.9%
Dot 1.2% 18.4% 1.8%
Dune 16.7% 1.5%
Total 14.2% 14.6% 19.0% 18.5% 17.9% 15.6%
Eat 16.6% 0.1% 0.3% 1.0% 5.4%
Ebb 1.1% 19.1% 7.8%
Echo 11.2% 1.3%
Edge 0.8% 12.6% 1.2%
Egg 11.3% 1.0%
Total 17.8% 19.2% 12.2% 12.6% 12.3% 16.7%
Fast 16.0% 0.7% 0.1% 1.1% 5.2%
Feat 0.9% 13.4% 5.5%
Fist 14.1% 1.6%
Foam 1.1% 17.8% 1.7%
Fume 14.0% 1.3%
Total 16.8% 13.3% 15.9% 17.9% 15.1% 15.3%
CAPSTONE® COURIER Page 10
2/22/2020 Report Page
https://ww3.capsim.com/cgi-
bin/displayReport.cfm?Report=CapCourier#frontpage 12/14
Top
Perceptual Map C116647_042 Round: 1December 31, 2021
Perceptual Map for All Segments
Andrews
Name Pfmn Size Revised
Able 6.0 14.0 5/29/2021
Acre 4.0 16.0 12/7/2021
Adam 9.0 11.0 11/2/2021
Aft 10.0 16.0 6/1/2021
Agape 4.0 10.0 7/22/2021
Baldwin
Name Pfmn Size Revised
Baker 5.4 14.5 3/10/2021
Bead 3.0 17.0 5/24/2016
Bid 9.2 10.8 12/25/2021
Bold 9.1 14.5 8/25/2021
Buddy 5.1 11.2 8/6/2021
Chester
Name Pfmn Size Revised
Cake 5.7 14.3 4/22/2021
Cedar 3.0 17.0 1/29/2021
Cid 9.1 10.9 11/26/2021
Coat 10.6 14.7 11/13/2021
Cure 4.9 9.7 12/17/2021
Digby
Name Pfmn Size Revised
Daze 6.1 14.0 6/11/2021
Dell 3.0 17.0 5/24/2016
Dixie 9.1 10.9 11/23/2021
Dot 10.6 14.7 11/3/2021
Dune 4.9 9.8 11/2/2021
Erie
Name Pfmn Size Revised
Eat 5.6 14.5 3/17/2021
Ebb 3.0 17.0 1/15/2021
Echo 7.0 12.9 12/23/2021
Edge 9.4 15.5 6/30/2018
Egg 4.0 11.0 12/24/2022
Ferris
Name Pfmn Size Revised
Fast 5.6 14.5 3/3/2021
Feat 3.0 17.0 1/15/2021
Fist 9.1 10.9 12/22/2021
Foam 10.6 14.8 11/10/2021
Fume 4.7 9.6 12/10/2021
CAPSTONE® COURIER Page 11
2/22/2020 Report Page
https://ww3.capsim.com/cgi-
bin/displayReport.cfm?Report=CapCourier#frontpage 13/14
Top
HR/TQM Report C116647_042 Round: 1December 31, 2021
HUMAN RESOURCES SUMMARY
Andrews Baldwin Chester Digby Erie Ferris
Needed Complement 699 762 774 710 730 693
Complement 699 762 774 710 730 693
1st Shift Complement 609 679 672 656 620 595
2nd Shift Complement 90 83 102 54 109 98
Overtime% 0.0% 0.0% 0.0% 0.0% 0.0% 0.0%
Turnover Rate 7.4% 8.9% 9.1% 8.9% 9.1% 8.9%
New Employees 52 130 144 73 96 61
Separated Employees 1 0 0 0 0 7
Recruiting Spend $5,000 $2,000 $2,000 $2,200 $2,000 $2,500
Training Hours 70 30 25 30 25 30
Productivity Index 101.8% 100.0% 100.0% 100.0% 100.0%
100.0%
Recruiting Cost $309 $390 $432 $233 $288 $215
Separation Cost $5 $0 $0 $0 $0 $37
Training Cost $979 $457 $387 $426 $365 $416
Total HR Admin Cost $1,293 $847 $818 $659 $653 $667
Labor Contract Next Year
Wages $22.05 $22.05 $22.05 $22.05 $22.05 $22.05
Benefits 2,500 2,500 2,500 2,500 2,500 2,500
Profit Sharing 2.0% 2.0% 2.0% 2.0% 2.0% 2.0%
Annual Raise 5.0% 5.0% 5.0% 5.0% 5.0% 5.0%
Starting Negotiation Position
Wages
Benefits
Profit Sharing
Annual Raise
Ceiling Negotiation Position
Wages
Benefits
Profit Sharing
Annual Raise
Adjusted Labor Demands
Wages
Benefits
Profit Sharing
Annual Raise
Strike Days
TQM SUMMARY
Andrews Baldwin Chester Digby Erie Ferris
Process Mgt Budgets Last Year
CPI Systems $0 $0 $0 $0 $0 $0
Vendor/JIT $0 $0 $0 $0 $0 $0
Quality Initiative Training $0 $0 $0 $0 $0 $0
Channel Support Systems $0 $0 $0 $0 $0 $0
Concurrent Engineering $0 $0 $0 $0 $0 $0
UNEP Green Programs $0 $0 $0 $0 $0 $0
TQM Budgets Last Year
Benchmarking $0 $0 $0 $0 $0 $0
Quality Function Deployment Effort $0 $0 $0 $0 $0 $0
CCE/6 Sigma Training $0 $0 $0 $0 $0 $0
GEMI TQEM Sustainability Initiatives $0 $0 $0 $0 $0 $0
Total Expenditures $0 $0 $0 $0 $0 $0
Cumulative Impacts
Material Cost Reduction 0.00% 0.00% 0.00% 0.00% 0.00%
0.00%
Labor Cost Reduction 0.00% 0.00% 0.00% 0.00% 0.00% 0.00%
Reduction R&D Cycle Time 0.00% 0.00% 0.00% 0.00% 0.00%
0.00%
Reduction Admin Costs 0.00% 0.00% 0.00% 0.00% 0.00%
0.00%
Demand Increase 0.00% 0.00% 0.00% 0.00% 0.00% 0.00%
CAPSTONE® COURIER Page 12
2/22/2020 Report Page
https://ww3.capsim.com/cgi-
bin/displayReport.cfm?Report=CapCourier#frontpage 14/14

2222020 Report Pagehttpsww3.capsim.comcgi-bindispla.docx

  • 1.
    2/22/2020 Report Page https://ww3.capsim.com/cgi- bin/displayReport.cfm?Report=CapCourier#frontpage1/14 Page 1 Front Page Page 2 Stocks & Bonds Page 3 Financial Summary Page 4 Production Analysis Page 5 Traditional Segment Analysis Page 6 Low End Segment Analysis Page 7 High End Segment Analysis Page 8 Performance Segment Analysis Page 9 Size Segment Analysis Page 10 Market Share Page 11 Perceptual Map Page 12 HR/TQM Report PRINT 2/22/2020 Report Page https://ww3.capsim.com/cgi- bin/displayReport.cfm?Report=CapCourier#frontpage 2/14 Top Round: 2
  • 2.
    Dec. 31, 2022 Chenm C116647_042 Andrews Manling Chen Baldwin Chester
  • 3.
    Digby Erie Ferris Selected Financial Statistics AndrewsBaldwin Chester Digby Erie Ferris ROS -2.8% 5.5% 6.5% 6.7% 5.7% 7.0% Asset Turnover 0.90 1.06 1.24 1.19 0.98 1.35 ROA -2.6% 5.8% 8.1% 8.0% 5.6% 9.5% Leverage (Assets/Equity) 1.8 2.0 2.0 2.0 2.0 2.0
  • 4.
    ROE -4.7% 11.8%15.8% 15.7% 11.3% 18.6% Emergency Loan $0 $0 $0 $0 $0 $0 Sales $89,035,307 $122,587,013 $154,293,704 $157,992,088 $121,430,647 $141,272,826 EBIT $1,515,688 $16,879,190 $22,135,853 $23,545,648 $17,738,015 $20,964,167 Profits ($2,534,269) $6,704,268 $10,008,748 $10,617,319 $6,897,788 $9,957,111 Cumulative Profit $1,972,431 $18,305,555 $17,559,284 $20,307,535 $15,470,880 $20,156,303 SG&A / Sales 17.1% 13.9% 10.9% 12.3% 9.6% 13.1% Contrib. Margin % 29.4% 34.0% 30.2% 32.2% 30.8% 31.6% CAPSTONE® COURIER Page 1 2/22/2020 Report Page https://ww3.capsim.com/cgi- bin/displayReport.cfm?Report=CapCourier#frontpage 3/14 Top Stocks & Bonds C116647_042 Round: 2 December 31 , 2022 Stock Market Summary Company Close Change Shares MarketCap ($M) Book Value PerShare EPS Dividend Yield P/E Andrews $19.86 ($11.30) 2,388,206 $47 $22.63 ($1.06) $1.00 5.0% -18.7
  • 5.
    Baldwin $48.18 $3.292,046,274 $99 $27.87 $3.28 $3.23 6.7% 14.7 Chester $48.54 $11.53 2,069,366 $100 $30.69 $4.84 $0.09 0.2% 10.0 Digby $53.08 $11.93 2,086,720 $111 $32.36 $5.09 $0.00 0.0% 10.4 Erie $43.74 $4.72 2,128,085 $93 $28.78 $3.24 $1.11 2.5% 13.5 Ferris $52.06 $10.72 2,000,000 $104 $26.77 $4.98 $1.34 2.6% 10.4 Bond Market Summary Company Series# Face Yield Close$ S&P Andrews 12.5S2024 $10,924,506 12.3% 101.36 BB 14.0S2026 $20,850,000 13.1% 107.03 BB 11.3S2031 $10,000,000 11.5% 97.84 BB Baldwin 12.5S2024 $11,609,210 12.5% 100.34 B 14.0S2026 $20,850,000 13.3% 105.13 B Chester 12.5S2024 $13,900,000 12.4% 100.67 B 14.0S2026 $20,850,000 13.2% 105.76 B Digby 12.5S2024 $13,828,904 12.4% 100.51 B 14.0S2026 $20,850,000 13.3% 105.44 B 11.7S2032 $2,891,032 12.0% 97.20 B Erie 12.5S2024 $13,900,000 12.5% 100.34 B 14.0S2026 $20,850,000 13.3% 105.13 B 11.8S2032 $2,640,750 12.1% 97.21 B
  • 6.
    Ferris 12.5S2024 $4,626,007 12.4%100.67 B 14.0S2026 $20,850,000 13.2% 105.76 B Next Year's Prime Rate 8.00% CAPSTONE® COURIER Page 2 2/22/2020 Report Page https://ww3.capsim.com/cgi- bin/displayReport.cfm?Report=CapCourier#frontpage 4/14 Top Financial Summary C116647_042 Round: 2December 31, 2022 Cash Flow Statement Survey Andrews Baldwin Chester Digby Erie Ferris Cash flows from operating activities Net Income (Loss) ($2,534) $6,704 $10,009 $10,617 $6,898 $9,957 Adjustment for non-cash items: Depreciation $9,347 $7,647 $7,707 $7,473 $8,355 $5,927 Extraordinary gains/losses/writeoffs $0 $55 $9 $7 ($539) ($805) Changes in current assets and liabilities: Accounts payable ($3,562) ($29) $2,021 $2,450 $239 $1,551 Inventory ($2,091) ($3,830) ($2,248) ($2,906) $1,286 ($422) Accounts receivable $3,256 $219 ($2,916) ($3,359) ($797) ($2,218) Net cash from operations $4,416 $10,765 $14,582 $14,283 $15,440 $13,990
  • 7.
    Cash flows frominvesting activities Plant improvements (net) $0 ($4,130) ($5,640) ($19,920) ($9,292) ($6,910) Cash flows from financing activities Dividends paid ($2,388) ($6,617) ($190) $0 ($2,369) ($2,671) Sales of common stock $3,000 $0 $0 $2,940 $0 $0 Purchase of common stock $0 $0 $0 $0 $0 $0 Cash from long term debt issued $0 $0 $0 $2,891 $2,641 $0 Early retirement of long term debt $0 ($3,328) ($536) $0 $0 ($1,298) Retirement of current debt $0 ($11,359) ($11,359) ($11,359) ($11,359) ($11,359) Cash from current debt borrowing $0 $19,454 $15,742 $18,370 $14,857 $17,822 Cash from emergency loan $0 $0 $0 $0 $0 $0 Net cash from financing activities $612 ($1,850) $3,658 $12,842 $3,771 $2,494 Net change in cash position $5,028 $4,785 $12,601 $7,205 $9,919 $9,574 Balance Sheet Survey Andrews Baldwin Chester Digby Erie Ferris Cash $5,043 $23,955 $29,056 $24,776 $27,130 $26,522 Accounts Receivable $6,098 $10,076 $12,682 $12,986 $9,981 $11,611 Inventory $3,755 $13,287 $11,672 $13,049 $8,621 $10,481 Total Current Assets $14,896 $47,318 $53,410 $50,810 $45,732 $48,614 Plant and equipment $140,200 $114,700 $115,600 $127,100 $125,318 $88,900 Accumulated Depreciation ($56,627) ($46,247) ($44,853)
  • 8.
    ($45,527) ($47,028) ($32,807) TotalFixed Assets $83,573 $68,453 $70,747 $81,573 $78,290 $56,093 Total Assets $98,469 $115,771 $124,157 $132,384 $124,021 $104,708 Accounts Payable $2,649 $6,831 $8,917 $8,919 $6,721 $7,871 Current Debt $0 $19,454 $16,991 $18,370 $18,667 $17,822 Total Current Liabilities $2,649 $26,285 $25,908 $27,289 $25,388 $25,693 Long Term Debt $41,775 $32,459 $34,750 $37,570 $37,391 $25,476 Total Liabilities $44,424 $58,744 $60,658 $64,859 $62,778 $51,169 Common Stock $32,347 $19,945 $20,736 $21,823 $22,747 $18,360 Retained Earnings $21,699 $37,082 $42,763 $45,701 $38,496 $35,179 Total Equity $54,046 $57,027 $63,499 $67,525 $61,243 $53,539 Total Liabilities & Owners' Equity $98,469 $115,771 $124,157 $132,384 $124,021 $104,708 Income Statement Survey Andrews Baldwin Chester Digby Erie Ferris Sales $89,035 $122,587 $154,294 $157,992 $121,431 $141,273 Variable Costs (Labor, Material, Carry) $62,824 $80,872 $107,642 $107,179 $84,088 $96,596 Contribution Margin $26,211 $41,715 $46,652 $50,813 $37,343 $44,677 Depreciation $9,347 $7,647 $7,707 $7,473 $8,355 $5,927 SGA (R&D, Promo, Sales, Admin) $15,199 $17,085 $16,792
  • 9.
    $19,496 $11,657 $18,572 Other(Fees, Writeoffs, TQM, Bonuses) $150 $104 $18 $298 ($407) ($786) EBIT $1,516 $16,879 $22,136 $23,546 $17,738 $20,964 Interest (Short term, Long term) $5,415 $6,354 $6,424 $6,878 $6,909 $5,333 Taxes ($1,365) $3,684 $5,499 $5,834 $3,790 $5,471 Profit Sharing $0 $137 $204 $217 $141 $203 Net Profit ($2,534) $6,704 $10,009 $10,617 $6,898 $9,957 CAPSTONE® COURIER Page 3 2/22/2020 Report Page https://ww3.capsim.com/cgi- bin/displayReport.cfm?Report=CapCourier#frontpage 5/14 Top Production Analysis C116647_042 Round: 2December 31, 2022 Production Information Name Primary Segment Units Sold Unit Inven tory Revision Date
  • 10.
    Age Dec.31 MTBF Pfmn Coord Size Coord Price Material Cost Labor Cost Contr. Marg. 2ndShift & Over- time Auto mation Next Round Capacity Next Round Plant Utiliz.
  • 11.
    Able Trad 9990 11/22/2022 1.7 18000 7.0 13.0 $27.00 $11.38 $8.02 30% 0% 4.0 2,200 45% Acre Low 1,070 30 12/22/2022 1.9 13000 3.0 15.0 $20.00 $7.17 $6.88 27% 0% 5.0 1,800 55% Adam High 478 21 11/16/2022 1.3 22000 10.0 10.0 $37.00 $15.43 $9.17 34% 0% 3.0 1,100 45% Aft Pfmn 369 10 8/5/2022 1.7 24000 10.0 15.0 $32.00 $14.08 $9.17 26% 0% 3.0 700 54% Agape Size 348 117 11/9/2022 1.6 18500 5.0 9.0 $32.00 $13.04 $9.17 29% 0% 3.0 700 66% Baker Trad 985 246 12/5/2022 1.8 17000 6.5 13.5 $29.00 $10.60 $7.05 39% 0% 5.0 1,300 88% Bead Low 2,209 165 5/24/2016 6.6 14000 3.0 17.0 $21.00 $6.38 $6.93 34% 61% 7.0 1,400 159% Bid High 744 131 12/18/2022 1.2 23500 10.4 9.6 $39.00 $16.26 $11.35 30% 78% 3.0 600 176% Bold High 305 71 7/27/2022 1.7 22000 8.8 13.5 $34.00 $13.29 $9.40 30% 0% 3.0 600 50% Buddy Size 242 76 9/18/2022 1.6 16000 6.2 11.4 $34.00 $11.26 $9.40 34% 0% 3.0 650 41% Cake Trad 1,350 185 8/26/2022 1.9 14000 6.4 13.6 $26.50 $9.61 $8.09 32% 45% 5.5 1,000 144% Cedar Low 2,420 182 1/29/2021 6.6 12000 3.0 17.0 $19.50 $5.78 $6.36 35% 75% 7.5 1,400 173% Cid High 641 155 11/15/2022 1.3 23000 10.2 9.8 $37.50 $15.92 $10.04 31% 17% 3.0 600 116% Coat Pfmn 747 38 11/3/2022 1.5 27000 11.8 13.9 $32.50 $16.38 $10.29 20% 25% 4.0 600 124% Cure Size 708 52 9/10/2022 1.6 17000 5.4 8.6 $32.50 $12.94 $10.04 29% 17% 4.0 600 116% Daze Trad 1,442 170 8/22/2022 1.8 18100 6.8 13.3 $29.00 $11.17 $7.72 34% 25% 5.0 1,200 124%
  • 12.
    Dell Low 1,946153 5/24/2016 6.6 14000 3.0 17.0 $21.50 $6.38 $6.66 37% 39% 7.0 1,400 138% Dixie High 651 182 12/3/2022 1.2 24000 10.2 9.8 $39.00 $16.22 $10.88 31% 50% 3.0 600 149% Dot Pfmn 752 55 11/13/2022 1.5 27000 11.8 13.9 $34.00 $16.38 $10.29 23% 25% 3.0 650 124% Dune Size 687 70 11/13/2022 1.5 19000 5.8 8.6 $34.00 $13.65 $10.04 31% 17% 3.0 600 116% Doom 0 0 8/9/2023 0.0 0 0.0 0.0 $0.00 $0.00 $0.00 0% 0% 6.0 500 0% Eat Trad 1,476 183 4/8/2022 2.1 15500 5.5 14.5 $27.00 $9.21 $7.47 36% 14% 7.0 1,400 113% Ebb Low 2,271 172 1/15/2022 6.6 12000 3.0 17.0 $19.50 $5.78 $6.96 32% 64% 6.0 1,450 163% Echo Trad 1,204 86 7/20/2022 1.4 16000 6.4 13.6 $27.00 $10.21 $9.20 23% 33% 5.0 900 132% Edge Pfmn 64 0 6/30/2018 4.5 25000 9.4 15.5 $34.00 $13.87 $11.63 28% 99% 3.0 1 198% Egg Size 76 67 12/24/2022 2.3 19000 6.9 13.4 $34.00 $11.44 $9.40 29% 0% 3.0 600 8% Fast Trad 1,136 271 4/22/2022 2.1 14000 5.5 14.5 $29.00 $8.76 $9.72 32% 63% 4.0 800 161% Feat Low 1,552 0 7/27/2025 6.6 13000 3.0 17.0 $22.00 $6.08 $8.72 32% 100% 6.0 700 198% Fist High 652 105 12/22/2022 1.2 25000 10.2 9.8 $39.00 $16.52 $10.43 33% 30% 3.0 550 129% Foam Pfmn 726 48 11/11/2022 1.5 27000 11.8 14.2 $34.00 $16.30 $9.00 27% 25% 4.0 600 124% Fume Size 708 64 11/9/2022 1.5 19000 5.4 8.4 $34.00 $13.67 $8.78 35% 17% 4.0 600 116% Fox 0 0 12/12/2022 0.0 25000 11.0 9.0 $39.00 $0.00 $0.00 0% 0% 5.5 500 0%
  • 13.
    CAPSTONE® COURIER Page4 2/22/2020 Report Page https://ww3.capsim.com/cgi- bin/displayReport.cfm?Report=CapCourier#frontpage 6/14 Top Traditional Market Segment Analysis C116647_042 Round: 2December 31, 2022 Traditional Statistics Total Industry Unit Demand 8,809 Actual Industry Unit Sales 8,809 Segment % of Total Industry 30.4% Next Year's Segment Growth Rate 9.2% Traditional Customer Buying Criteria Expectations Importance 1. Age Ideal Age = 2.0 47% 2. Price $19.00 - 29.00 23% 3. Ideal Position Pfmn 6.4 Size 13.6 21% 4. Reliability MTBF 14000-19000 9% Perceptual Map for Traditional Segment Top Products in Traditional Segment Name Market Share
  • 14.
    Units Sold to Seg Revision DateStock Out Pfmn Coord Size Coord List Price MTBF Age Dec.31 Promo Budget Cust. Aware- ness Sales Budget Cust. Access- ibility Dec. Cust. Survey Eat 16% 1,437 4/8/2022 5.5 14.5 $27.00 15500 2.09 $1,050 63% $1,085 54% 31 Daze 16% 1,409 8/22/2022 6.8 13.3 $29.00 18100 1.84 $1,100
  • 15.
    66% $1,440 53%36 Cake 15% 1,329 8/26/2022 6.4 13.6 $26.50 14000 1.87 $1,100 66% $1,270 47% 35 Echo 13% 1,170 7/20/2022 6.4 13.6 $27.00 16000 1.40 $1,050 57% $775 54% 29 Fast 13% 1,136 4/22/2022 5.5 14.5 $29.00 14000 2.08 $900 59% $1,235 48% 24 Baker 11% 985 12/5/2022 6.5 13.5 $29.00 17000 1.76 $1,300 76% $1,418 53% 37 Able 11% 984 11/22/2022 YES 7.0 13.0 $27.00 18000 1.72 $1,000 61% $1,000 50% 33 Acre 4% 349 12/22/2022 3.0 15.0 $20.00 13000 1.92 $800 48% $800 50% 5 Aft 0% 6 8/5/2022 10.0 15.0 $32.00 24000 1.72 $800 46% $800 50% 1 Bead 0% 1 5/24/2016 3.0 17.0 $21.00 14000 6.60 $1,300 74% $1,418 53% 0 Dell 0% 1 5/24/2016 3.0 17.0 $21.50 14000 6.60 $1,100 64% $1,512 53% 0 CAPSTONE® COURIER Page 5 2/22/2020 Report Page https://ww3.capsim.com/cgi- bin/displayReport.cfm?Report=CapCourier#frontpage 7/14 Top Low End Market Segment Analysis C116647_042 Round: 2December 31, 2022 Low End Statistics Total Industry Unit Demand 11,180
  • 16.
    Actual Industry UnitSales 11,180 Segment % of Total Industry 38.6% Next Year's Segment Growth Rate 11.7% Low End Customer Buying Criteria Expectations Importance 1. Price $14.00 - 24.00 53% 2. Age Ideal Age = 7.0 24% 3. Ideal Position Pfmn 2.7 Size 17.3 16% 4. Reliability MTBF 12000-17000 7% Perceptual Map for Low End Segment Top Products in Low End Segment Name Market Share Units Sold to Seg Revision Date Stock Out Pfmn Coord Size Coord List Price MTBF Age
  • 17.
    Dec.31 Promo Budget Cust. Aware- ness Sales Budget Cust. Access- ibility Dec.Cust. Survey Cedar 22% 2,419 1/29/2021 3.0 17.0 $19.50 12000 6.60 $1,100 64% $1,333 40% 25 Ebb 20% 2,270 1/15/2022 3.0 17.0 $19.50 12000 6.60 $1,050 62% $1,085 36% 23 Bead 20% 2,208 5/24/2016 3.0 17.0 $21.00 14000 6.60 $1,300 74% $1,418 40% 23 Dell 17% 1,945 5/24/2016 3.0 17.0 $21.50 14000 6.60 $1,100 64% $1,512 42% 20 Feat 14% 1,551 7/27/2025 YES 3.0 17.0 $22.00 13000 6.60 $1,100 64% $1,235 36% 17 Acre 6% 722 12/22/2022 3.0 15.0 $20.00 13000 1.92 $800 48% $800 27% 5 Eat 0% 39 4/8/2022 5.5 14.5 $27.00 15500 2.09 $1,050 63% $1,085 36% 1 Cake 0% 19 8/26/2022 6.4 13.6 $26.50 14000 1.87 $1,100 66% $1,270 40% 0 Able 0% 6 11/22/2022 YES 7.0 13.0 $27.00 18000 1.72 $1,000 61% $1,000 27% 0
  • 18.
    CAPSTONE® COURIER Page6 2/22/2020 Report Page https://ww3.capsim.com/cgi- bin/displayReport.cfm?Report=CapCourier#frontpage 8/14 Top High End Market Segment Analysis C116647_042 Round: 2December 31, 2022 High End Statistics Total Industry Unit Demand 3,448 Actual Industry Unit Sales 3,448 Segment % of Total Industry 11.9% Next Year's Segment Growth Rate 16.2% High End Customer Buying Criteria Expectations Importance 1. Ideal Position Pfmn 10.7 Size 9.3 43% 2. Age Ideal Age = 0.0 29% 3. Reliability MTBF 20000-25000 19% 4. Price $29.00 - 39.00 9% Perceptual Map for High End Segment Top Products in High End Segment Name Market Share
  • 19.
    Units Sold to Seg Revision DateStock Out Pfmn Coord Size Coord List Price MTBF Age Dec.31 Promo Budget Cust. Aware- ness Sales Budget Cust. Access- ibility Dec. Cust. Survey Bid 22% 744 12/18/2022 10.4 9.6 $39.00 23500 1.19 $1,250 71% $1,418 53% 38 Fist 19% 652 12/22/2022 10.2 9.8 $39.00 25000 1.18 $1,100
  • 20.
    61% $1,235 44%36 Dixie 19% 651 12/3/2022 10.2 9.8 $39.00 24000 1.23 $1,100 63% $1,512 51% 36 Cid 19% 641 11/15/2022 10.2 9.8 $37.50 23000 1.25 $1,000 58% $1,333 44% 30 Adam 14% 478 11/16/2022 10.0 10.0 $37.00 22000 1.27 $800 47% $800 32% 21 Bold 5% 188 7/27/2022 8.8 13.5 $34.00 22000 1.67 $1,300 72% $681 53% 5 Daze 1% 28 8/22/2022 6.8 13.3 $29.00 18100 1.84 $1,100 66% $1,440 51% 1 Echo 1% 19 7/20/2022 6.4 13.6 $27.00 16000 1.40 $1,050 57% $775 26% 0 Buddy 1% 18 9/18/2022 6.2 11.4 $34.00 16000 1.64 $1,300 72% $737 53% 1 Dot 0% 10 11/13/2022 11.8 13.9 $34.00 27000 1.47 $1,100 62% $1,368 51% 0 Coat 0% 10 11/3/2022 11.8 13.9 $32.50 27000 1.48 $1,000 56% $1,206 44% 0 Able 0% 4 11/22/2022 YES 7.0 13.0 $27.00 18000 1.72 $1,000 61% $1,000 32% 1 CAPSTONE® COURIER Page 7 2/22/2020 Report Page https://ww3.capsim.com/cgi- bin/displayReport.cfm?Report=CapCourier#frontpage 9/14 Top Performance Market Segment Analysis C116647_042 Round: 2December 31, 2022
  • 21.
    Performance Statistics Total IndustryUnit Demand 2,749 Actual Industry Unit Sales 2,749 Segment % of Total Industry 9.5% Next Year's Segment Growth Rate 19.8% Performance Customer Buying Criteria Expectations Importance 1. Reliability MTBF 22000-27000 43% 2. Ideal Position Pfmn 11.4 Size 14.6 29% 3. Price $24.00 - 34.00 19% 4. Age Ideal Age = 1.0 9% Perceptual Map for Performance Segment Top Products in Performance Segment Name Market Share Units Sold to Seg Revision Date Stock Out Pfmn Coord Size Coord List Price MTBF
  • 22.
    Age Dec.31 Promo Budget Cust. Aware- ness Sales Budget Cust. Access- ibility Dec.Cust. Survey Dot 27% 742 11/13/2022 11.8 13.9 $34.00 27000 1.47 $1,100 62% $1,368 38% 35 Coat 27% 737 11/3/2022 11.8 13.9 $32.50 27000 1.48 $1,000 56% $1,206 33% 34 Foam 26% 723 11/11/2022 11.8 14.2 $34.00 27000 1.47 $1,100 59% $1,235 35% 35 Aft 13% 364 8/5/2022 10.0 15.0 $32.00 24000 1.72 $800 46% $800 25% 12 Bold 4% 117 7/27/2022 8.8 13.5 $34.00 22000 1.67 $1,300 72% $681 23% 3 Edge 2% 64 6/30/2018 YES 9.4 15.5 $34.00 25000 4.50 $300 25% $155 17% 7 Daze 0% 1 8/22/2022 6.8 13.3 $29.00 18100 1.84 $1,100 66% $1,440 38% 0 CAPSTONE® COURIER Page 8
  • 23.
    2/22/2020 Report Page https://ww3.capsim.com/cgi- bin/displayReport.cfm?Report=CapCourier#frontpage10/14 Top Size Market Segment Analysis C116647_042 Round: 2December 31, 2022 Size Statistics Total Industry Unit Demand 2,776 Actual Industry Unit Sales 2,776 Segment % of Total Industry 9.6% Next Year's Segment Growth Rate 18.3% Size Customer Buying Criteria Expectations Importance 1. Ideal Position Pfmn 5.4 Size 8.6 43% 2. Age Ideal Age = 1.5 29% 3. Reliability MTBF 16000-21000 19% 4. Price $24.00 - 34.00 9% Perceptual Map for Size Segment Top Products in Size Segment Name Market Share Units Sold to Seg
  • 24.
    Revision Date Stock Out Pfmn Coord Size Coord List PriceMTBF Age Dec.31 Promo Budget Cust. Aware- ness Sales Budget Cust. Access- ibility Dec. Cust. Survey Fume 26% 708 11/9/2022 5.4 8.4 $34.00 19000 1.48 $1,100 59% $1,235 39% 39 Cure 26% 708 9/10/2022 5.4 8.6 $32.50 17000 1.56 $1,000 56% $1,206 37% 33 Dune 25% 687 11/13/2022 5.8 8.6 $34.00 19000 1.50 $1,100
  • 25.
    62% $1,368 42%39 Agape 13% 348 11/9/2022 5.0 9.0 $32.00 18500 1.58 $700 40% $700 27% 26 Buddy 8% 225 9/18/2022 6.2 11.4 $34.00 16000 1.64 $1,300 72% $737 28% 7 Egg 3% 75 12/24/2022 6.9 13.4 $34.00 19000 2.30 $1,050 56% $775 29% 0 Echo 1% 16 7/20/2022 6.4 13.6 $27.00 16000 1.40 $1,050 57% $775 29% 0 Able 0% 4 11/22/2022 YES 7.0 13.0 $27.00 18000 1.72 $1,000 61% $1,000 27% 0 Daze 0% 4 8/22/2022 6.8 13.3 $29.00 18100 1.84 $1,100 66% $1,440 42% 0 Cake 0% 1 8/26/2022 6.4 13.6 $26.50 14000 1.87 $1,100 66% $1,270 37% 0 CAPSTONE® COURIER Page 9 2/22/2020 Report Page https://ww3.capsim.com/cgi- bin/displayReport.cfm?Report=CapCourier#frontpage 11/14 Top Market Share Report C116647_042 Round: 2December 31, 2022 Actual Market Share in Units Trad Low High Pfmn Size Total Industry Unit Sales 8,809 11,180 3,448 2,749 2,776 28,961 % of Market 30.4% 38.6% 11.9% 9.5% 9.6% 100.0% Able 11.2% 0.1% 0.1% 0.0% 0.1% 3.5%
  • 26.
    Acre 4.0% 6.5%3.7% Adam 13.9% 1.6% Aft 0.1% 13.2% 1.3% Agape 12.5% 1.2% Total 15.2% 6.5% 14.0% 13.3% 12.7% 11.3% Baker 11.2% 0.0% 3.4% Bead 0.0% 19.8% 7.6% Bid 21.6% 2.6% Bold 5.5% 4.3% 1.1% Buddy 0.5% 8.1% 0.8% Total 11.2% 19.8% 27.5% 4.3% 8.1% 15.5% Cake 15.1% 0.2% 0.1% 4.7% Cedar 0.0% 21.6% 8.4% Cid 18.6% 2.2% Coat 0.3% 26.8% 2.6% Cure 25.5% 2.4% Total 15.1% 21.8% 18.9% 26.8% 25.6% 20.3% Daze 16.0% 0.8% 0.1% 0.1% 5.0% Dell 0.0% 17.4% 6.7% Dixie 18.9% 2.3% Dot 0.3% 27.0% 2.6% Dune 24.7% 2.4% Total 16.0% 17.4% 20.0% 27.0% 24.9% 18.9% Eat 16.3% 0.3% 5.1% Ebb 0.0% 20.3% 7.8% Echo 13.3% 0.5% 0.6% 4.2% Edge 2.3% 0.2% Egg 0.0% 2.7% 0.3% Total 29.6% 20.7% 0.6% 2.3% 3.3% 17.6% Fast 12.9% 3.9% Feat 0.0% 13.9% 5.4%
  • 27.
    Fist 18.9% 2.3% Foam0.1% 26.3% 2.5% Fume 25.5% 2.5% Total 12.9% 13.9% 19.0% 26.3% 25.5% 16.5% Potential Market Share in Units Trad Low High Pfmn Size Total Units Demanded 8,809 11,180 3,448 2,749 2,776 28,961 % of Market 30.4% 38.6% 11.9% 9.5% 9.6% 100.0% Able 13.5% 0.1% 0.2% 0.2% 4.2% Acre 4.1% 6.8% 3.9% Adam 13.9% 1.7% Aft 0.1% 13.3% 1.3% Agape 12.5% 1.2% Total 17.8% 6.9% 14.0% 13.3% 12.7% 12.2% Baker 10.8% 3.3% Bead 19.6% 7.6% Bid 21.6% 2.6% Bold 5.5% 4.0% 1.0% Buddy 0.5% 8.1% 0.8% Total 10.8% 19.6% 27.5% 4.0% 8.1% 15.3% Cake 14.7% 0.2% 4.5% Cedar 21.5% 8.3% Cid 18.6% 2.2% Coat 0.3% 25.1% 2.4% Cure 25.5% 2.4% Total 14.7% 21.6% 18.9% 25.1% 25.5% 19.9% Daze 15.5% 0.8% 0.1% 0.1% 4.8% Dell 17.2% 6.7% Dixie 18.9% 2.2% Dot 0.3% 25.3% 2.4%
  • 28.
    Dune 24.7% 2.4% Total15.5% 17.3% 20.0% 25.3% 24.9% 18.6% Eat 15.8% 0.3% 4.9% Ebb 20.1% 7.8% Echo 12.9% 0.5% 0.6% 4.0% Edge 7.6% 0.7% Egg 2.7% 0.3% Total 28.7% 20.5% 0.6% 7.6% 3.3% 17.7% Fast 12.5% 3.8% Feat 14.2% 5.5% Fist 18.9% 2.2% Foam 0.1% 24.7% 2.4% Fume 25.5% 2.4% Total 12.5% 14.2% 19.0% 24.6% 25.5% 16.3% CAPSTONE® COURIER Page 10 2/22/2020 Report Page https://ww3.capsim.com/cgi- bin/displayReport.cfm?Report=CapCourier#frontpage 12/14 Top Perceptual Map C116647_042 Round: 2December 31, 2022 Perceptual Map for All Segments Andrews Name Pfmn Size Revised Able 7.0 13.0 11/22/2022 Acre 3.0 15.0 12/22/2022
  • 29.
    Adam 10.0 10.011/16/2022 Aft 10.0 15.0 8/5/2022 Agape 5.0 9.0 11/9/2022 Aque 10.0 10.0 7/2/2022 Baldwin Name Pfmn Size Revised Baker 6.5 13.5 12/5/2022 Bead 3.0 17.0 5/24/2016 Bid 10.4 9.6 12/18/2022 Bold 8.8 13.5 7/27/2022 Buddy 6.2 11.4 9/18/2022 Chester Name Pfmn Size Revised Cake 6.4 13.6 8/26/2022 Cedar 3.0 17.0 1/29/2021 Cid 10.2 9.8 11/15/2022 Coat 11.8 13.9 11/3/2022 Cure 5.4 8.6 9/10/2022 Digby Name Pfmn Size Revised Daze 6.8 13.3 8/22/2022 Dell 3.0 17.0 5/24/2016 Dixie 10.2 9.8 12/3/2022 Dot 11.8 13.9 11/13/2022 Dune 5.8 8.6 11/13/2022 Erie Name Pfmn Size Revised Eat 5.5 14.5 4/8/2022 Ebb 3.0 17.0 1/15/2022 Echo 6.4 13.6 7/20/2022 Edge 9.4 15.5 6/30/2018 Egg 6.9 13.4 12/24/2022
  • 30.
    Ferris Name Pfmn SizeRevised Fast 5.5 14.5 4/22/2022 Feat 3.0 17.0 7/27/2025 Fist 10.2 9.8 12/22/2022 Foam 11.8 14.2 11/11/2022 Fume 5.4 8.4 11/9/2022 Fox 11.0 9.0 12/12/2022 CAPSTONE® COURIER Page 11 2/22/2020 Report Page https://ww3.capsim.com/cgi- bin/displayReport.cfm?Report=CapCourier#frontpage 13/14 Top HR/TQM Report C116647_042 Round: 2December 31, 2022 HUMAN RESOURCES SUMMARY Andrews Baldwin Chester Digby Erie Ferris Needed Complement 580 706 898 887 728 801 Complement 580 706 898 887 728 801 1st Shift Complement 580 534 650 678 538 541 2nd Shift Complement 0 172 249 209 190 260 Overtime% 0.0% 0.0% 0.0% 0.0% 0.0% 0.0% Turnover Rate 7.3% 8.8% 9.0% 8.8% 9.0% 8.8% New Employees 42 62 205 255 65 179 Separated Employees 119 56 0 0 2 0 Recruiting Spend $4,000 $2,000 $2,000 $2,200 $2,000 $2,500 Training Hours 70 30 25 30 25 30
  • 31.
    Productivity Index 106.8%101.1% 100.3% 101.2% 100.0% 101.4% Recruiting Cost $211 $186 $615 $816 $196 $627 Separation Cost $595 $280 $0 $0 $10 $0 Training Cost $812 $424 $449 $532 $364 $481 Total HR Admin Cost $1,618 $890 $1,065 $1,348 $570 $1,108 Labor Contract Next Year Wages $23.15 $23.15 $23.15 $23.15 $23.15 $23.15 Benefits 2,500 2,500 2,500 2,500 2,500 2,500 Profit Sharing 2.0% 2.0% 2.0% 2.0% 2.0% 2.0% Annual Raise 5.0% 5.0% 5.0% 5.0% 5.0% 5.0% Starting Negotiation Position Wages Benefits Profit Sharing Annual Raise Ceiling Negotiation Position Wages Benefits Profit Sharing Annual Raise Adjusted Labor Demands Wages Benefits Profit Sharing Annual Raise Strike Days TQM SUMMARY Andrews Baldwin Chester Digby Erie Ferris
  • 32.
    Process Mgt BudgetsLast Year CPI Systems $0 $0 $0 $0 $0 $0 Vendor/JIT $0 $0 $0 $0 $0 $0 Quality Initiative Training $0 $0 $0 $0 $0 $0 Channel Support Systems $0 $0 $0 $0 $0 $0 Concurrent Engineering $0 $0 $0 $0 $0 $0 UNEP Green Programs $0 $0 $0 $0 $0 $0 TQM Budgets Last Year Benchmarking $0 $0 $0 $0 $0 $0 Quality Function Deployment Effort $0 $0 $0 $0 $0 $0 CCE/6 Sigma Training $0 $0 $0 $0 $0 $0 GEMI TQEM Sustainability Initiatives $0 $0 $0 $0 $0 $0 Total Expenditures $0 $0 $0 $0 $0 $0 Cumulative Impacts Material Cost Reduction 0.00% 0.00% 0.00% 0.00% 0.00% 0.00% Labor Cost Reduction 0.00% 0.00% 0.00% 0.00% 0.00% 0.00% Reduction R&D Cycle Time 0.00% 0.00% 0.00% 0.00% 0.00% 0.00% Reduction Admin Costs 0.00% 0.00% 0.00% 0.00% 0.00% 0.00% Demand Increase 0.00% 0.00% 0.00% 0.00% 0.00% 0.00% CAPSTONE® COURIER Page 12 2/22/2020 Report Page https://ww3.capsim.com/cgi- bin/displayReport.cfm?Report=CapCourier#frontpage 14/14
  • 33.
    2/22/2020 Report Page https://ww3.capsim.com/cgi- bin/displayReport.cfm?Report=CapCourier#frontpage1/14 Page 1 Front Page Page 2 Stocks & Bonds Page 3 Financial Summary Page 4 Production Analysis Page 5 Traditional Segment Analysis Page 6 Low End Segment Analysis Page 7 High End Segment Analysis Page 8 Performance Segment Analysis Page 9 Size Segment Analysis Page 10 Market Share Page 11 Perceptual Map Page 12 HR/TQM Report PRINT 2/22/2020 Report Page https://ww3.capsim.com/cgi- bin/displayReport.cfm?Report=CapCourier#frontpage 2/14 Top Round: 4 Dec. 31, 2024 Chen m
  • 34.
  • 35.
    Erie Ferris Selected Financial Statistics AndrewsBaldwin Chester Digby Erie Ferris ROS -16.0% 5.2% 7.5% 6.7% 5.0% 5.9% Asset Turnover 0.64 1.09 1.01 1.13 0.86 1.20 ROA -10.1% 5.7% 7.6% 7.6% 4.3% 7.0% Leverage (Assets/Equity) 2.9 2.1 2.1 2.1 2.1 2.0 ROE -29.4% 12.1% 15.7% 15.6% 9.0% 14.0% Emergency Loan $15,505,273 $0 $0 $0 $0 $0 Sales $63,796,285 $190,006,170 $176,928,942 $213,364,729
  • 36.
    $147,912,638 $196,521,262 EBIT ($6,973,832)$25,793,457 $31,027,057 $33,326,192 $21,959,720 $27,087,558 Profits ($10,190,507) $9,878,255 $13,251,989 $14,317,544 $7,329,463 $11,521,794 Cumulative Profit ($14,275,132) $36,133,559 $35,530,937 $40,501,439 $25,362,835 $37,973,297 SG&A / Sales 18.2% 8.9% 10.7% 10.8% 9.7% 10.4% Contrib. Margin % 22.1% 31.4% 37.1% 34.0% 36.3% 31.2% CAPSTONE® COURIER Page 1 2/22/2020 Report Page https://ww3.capsim.com/cgi- bin/displayReport.cfm?Report=CapCourier#frontpage 3/14 Top Stocks & Bonds C116647_042 Round: 4 December 31 , 2024 Stock Market Summary Company Close Change Shares MarketCap ($M) Book Value PerShare EPS Dividend Yield P/E Andrews $1.00 ($6.13) 2,287,518 $2 $15.15 ($4.45) $0.00 0.0% -0.2 Baldwin $59.19 $5.99 2,243,914 $133 $36.32 $4.40 $0.00 0.0% 13.4 Chester $62.78 $13.06 2,134,506 $134 $39.67 $6.21 $0.00 0.0%
  • 37.
    10.1 Digby $67.94 $14.142,164,189 $147 $42.38 $6.62 $0.00 0.0% 10.3 Erie $45.89 $4.70 2,387,461 $110 $34.22 $3.07 $0.00 0.0% 14.9 Ferris $58.97 $8.11 2,219,929 $131 $37.20 $5.19 $0.00 0.0% 11.4 Bond Market Summary Company Series# Face Yield Close$ S&P Andrews 14.0S2026 $20,850,000 14.2% 98.86 C 11.3S2031 $10,000,000 13.2% 85.73 C 13.1S2034 $2,000,000 14.3% 91.88 C Baldwin 14.0S2026 $20,850,000 13.9% 100.66 CCC 12.3S2033 $1,245,546 13.2% 93.47 CCC 12.8S2034 $26,954,468 13.4% 95.76 CCC Chester 14.0S2026 $20,850,000 13.9% 101.00 B 12.1S2033 $11,078,553 13.0% 93.43 B 13.0S2034 $15,883,727 13.3% 97.86 B Digby 14.0S2026 $20,850,000 13.9% 101.00 B 11.7S2032 $2,891,032 12.7% 91.95 B 12.2S2033 $6,871,224 13.0% 93.93 B 13.0S2034 $18,502,490 13.3% 97.86 B Erie 14.0S2026 $20,850,000 13.9% 100.83 CCC 11.8S2032 $2,640,750 12.8% 91.98 CCC 12.3S2033 $9,105,020 13.1% 93.95 CCC
  • 38.
    13.0S2034 $22,180,769 13.4%97.34 CCC Ferris 14.0S2026 $20,850,000 13.8% 101.33 B 12.1S2033 $9,340,983 12.8% 94.40 B 13.0S2034 $12,986,272 13.1% 98.92 B Next Year's Prime Rate 9.00% CAPSTONE® COURIER Page 2 2/22/2020 Report Page https://ww3.capsim.com/cgi- bin/displayReport.cfm?Report=CapCourier#frontpage 4/14 Top Financial Summary C116647_042 Round: 4December 31, 2024 Cash Flow Statement Survey Andrews Baldwin Chester Digby Erie Ferris Cash flows from operating activities Net Income (Loss) ($10,191) $9,878 $13,252 $14,318 $7,329 $11,522 Adjustment for non-cash items: Depreciation $9,347 $11,393 $10,993 $11,193 $11,973 $9,247 Extraordinary gains/losses/writeoffs $0 $0 $0 $0 $0 ($403) Changes in current assets and liabilities: Accounts payable ($65) $1,106 $124 $636 ($1,004) ($130) Inventory ($15,661) $4,556 $3,508 $3,251 $4,675 $5,443 Accounts receivable $577 ($2,504) ($2,200) ($3,143) ($775) ($1,882) Net cash from operations ($15,993) $24,430 $25,678 $26,255
  • 39.
    $22,199 $23,796 Cash flowsfrom investing activities Plant improvements (net) $0 ($44,400) ($12,900) ($15,800) ($26,600) ($23,470) Cash flows from financing activities Dividends paid $0 $0 $0 $0 $0 $0 Sales of common stock $0 $10,513 $1,484 $4,168 $10,684 $9,559 Purchase of common stock $0 $0 $0 $0 $0 $0 Cash from long term debt issued $2,000 $26,954 $15,884 $18,502 $22,181 $12,986 Early retirement of long term debt $0 $0 $0 $0 $0 $0 Retirement of current debt ($5,512) ($19,336) ($20,475) ($24,609) ($14,810) ($22,471) Cash from current debt borrowing $4,000 $21,405 $19,711 $23,661 $13,854 $23,499 Cash from emergency loan $15,505 $0 $0 $0 $0 $0 Net cash from financing activities $15,993 $39,537 $16,605 $21,722 $31,908 $23,573 Net change in cash position $0 $19,567 $29,383 $32,177 $27,507 $23,899 Balance Sheet Survey Andrews Baldwin Chester Digby Erie Ferris Cash $0 $40,768 $48,553 $50,769 $42,883 $43,549 Accounts Receivable $4,370 $15,617 $14,542 $17,537 $12,157 $16,152 Inventory $31,215 $10,433 $12,812 $17,946 $6,092 $12,585 Total Current Assets $35,585 $66,818 $75,907 $86,251 $61,132 $72,286 Plant and equipment $140,200 $170,900 $164,900 $167,900
  • 40.
    $179,600 $138,700 Accumulated Depreciation($75,320) ($63,913) ($65,980) ($64,700) ($69,193) ($46,560) Total Fixed Assets $64,880 $106,987 $98,920 $103,200 $110,407 $92,140 Total Assets $100,465 $173,805 $174,827 $189,451 $171,539 $164,426 Accounts Payable $2,531 $10,232 $8,736 $11,133 $7,303 $10,545 Current Debt $30,430 $33,014 $33,611 $37,490 $27,754 $28,125 Total Current Liabilities $32,961 $43,246 $42,347 $48,623 $35,057 $38,670 Long Term Debt $32,850 $49,050 $47,812 $49,115 $54,777 $43,177 Total Liabilities $65,811 $92,296 $90,159 $97,737 $89,834 $81,847 Common Stock $31,150 $30,458 $23,933 $25,991 $33,431 $29,582 Retained Earnings $3,505 $51,051 $60,735 $65,723 $48,274 $52,996 Total Equity $34,654 $81,509 $84,668 $91,714 $81,705 $82,578 Total Liabilities & Owners' Equity $100,465 $173,805 $174,827 $189,451 $171,539 $164,426 Income Statement Survey Andrews Baldwin Chester Digby Erie Ferris Sales $63,796 $190,006 $176,929 $213,365 $147,913 $196,521 Variable Costs (Labor, Material, Carry) $49,669 $130,293 $111,332 $140,854 $94,261 $135,254
  • 41.
    Contribution Margin $14,127$59,713 $65,597 $72,511 $53,652 $61,267 Depreciation $9,347 $11,393 $10,993 $11,193 $11,973 $9,247 SGA (R&D, Promo, Sales, Admin) $11,605 $16,903 $18,958 $23,108 $14,325 $20,459 Other (Fees, Writeoffs, TQM, Bonuses) $150 $5,623 $4,618 $4,884 $5,393 $4,474 EBIT ($6,974) $25,793 $31,027 $33,326 $21,960 $27,088 Interest (Short term, Long term) $8,704 $10,286 $10,223 $10,850 $10,453 $9,000 Taxes ($5,487) $5,428 $7,281 $7,867 $4,027 $6,331 Profit Sharing $0 $202 $270 $292 $150 $235 Net Profit ($10,191) $9,878 $13,252 $14,318 $7,329 $11,522 CAPSTONE® COURIER Page 3 2/22/2020 Report Page https://ww3.capsim.com/cgi- bin/displayReport.cfm?Report=CapCourier#frontpage 5/14 Top Production Analysis C116647_042 Round: 4December 31, 2024 Production Information Name Primary Segment Units Sold
  • 42.
    Unit Inven tory Revision Date Age Dec.31MTBF Pfmn Coord Size Coord Price Material Cost Labor Cost Contr. Marg. 2nd Shift & Over- time Auto mation Next Round Capacity Next
  • 43.
    Round Plant Utiliz. Able Trad 1,0250 1/15/2024 2.4 16000 8.0 12.0 $25.00 $10.00 $8.11 26% 0% 4.0 2,200 45% Acre Low 629 777 9/1/2024 1.5 12000 3.0 15.0 $19.00 $5.67 $6.95 20% 0% 5.0 1,800 55% Adam High 220 432 7/28/2024 1.4 21000 10.0 8.0 $35.00 $14.02 $9.27 17% 0% 3.0 1,100 45% Aft Pfmn 218 299 5/31/2025 2.4 23500 11.0 14.0 $30.00 $13.03 $9.27 12% 0% 3.0 700 54% Agape Size 399 182 7/21/2024 1.5 18000 6.0 8.0 $30.00 $11.91 $9.27 25% 0% 3.0 700 66% Aque 0 0 7/25/2025 2.0 20000 10.0 9.0 $26.00 $0.00 $0.00 0% 0% 0.0 0 0% Baker Trad 1,242 144 4/4/2023 2.7 16000 6.5 13.6 $28.00 $8.71 $7.65 40% 5% 6.0 1,100 104% Bead Low 2,372 431 5/24/2016 8.6 14000 3.0 17.0 $20.00 $5.27 $5.20 45% 66% 8.0 1,700 164% Bid High 871 132 10/6/2024 1.2 23500 12.8 7.2 $38.00 $16.20 $9.99 31% 0% 4.0 850 99% Bold Trad 1,265 0 5/10/2024 1.6 19000 8.0 12.0 $28.00 $10.89 $11.60 18% 100% 5.0 1,050 198% Buddy Trad 1,402 0 5/1/2024 1.6 18000 8.0 12.0 $28.00 $10.59 $11.60 20% 100% 5.0 1,050 198% Cake Trad 1,229 62 9/13/2024 1.4 14000 7.8 12.2 $26.00 $9.06 $6.21 40% 0% 6.0 1,000 99% Cedar Low 2,583 438 1/29/2021 8.6 12000 3.0 17.0 $19.00 $4.59 $4.43 50% 66% 8.0 1,900 164% Cid High 718 113 11/14/2024 1.1 23000 12.5 7.5 $37.00 $15.52 $9.93 31% 0% 3.0 750 92% Coat Pfmn 1,018 98 9/20/2024 1.4 27000 13.4 13.2 $32.00
  • 44.
    $15.26 $8.64 24%18% 4.5 1,050 116% Cure Size 1,149 122 9/20/2024 1.3 17000 6.8 6.6 $32.00 $12.31 $8.90 33% 28% 4.5 1,000 127% Daze Trad 1,250 105 8/2/2024 1.5 18700 8.2 11.9 $28.50 $10.93 $6.99 36% 5% 5.5 1,000 104% Dell Low 2,119 457 1/12/2026 8.6 14000 3.0 17.0 $21.00 $5.27 $5.12 48% 60% 7.5 1,600 158% Dixie High 819 171 10/23/2024 1.2 25000 12.4 7.6 $38.50 $16.32 $10.22 31% 6% 3.0 800 105% Dot Pfmn 935 80 8/16/2024 1.4 27000 13.8 12.8 $33.50 $15.85 $8.70 25% 0% 4.0 1,050 94% Dune Size 1,275 134 8/16/2024 1.4 19000 7.2 6.4 $33.50 $13.34 $9.81 30% 37% 4.0 1,150 136% Doom Pfmn 827 69 7/18/2024 0.9 27000 13.7 12.9 $33.50 $15.77 $7.43 30% 70% 6.0 650 168% Eat Low 1,127 198 1/15/2024 4.1 13500 5.5 14.5 $20.50 $7.05 $4.36 40% 0% 8.0 1,400 74% Ebb Low 2,941 314 6/18/2026 8.6 12000 3.0 17.0 $18.50 $4.59 $5.35 44% 91% 8.0 1,800 189% Echo Trad 1,446 29 9/13/2024 1.3 15000 7.8 12.2 $26.00 $9.36 $6.92 37% 30% 6.5 1,000 129% Egg Trad 1,262 0 7/20/2024 1.7 16000 7.8 12.2 $26.00 $9.65 $10.81 21% 100% 5.0 1,000 198% Fast Low 659 74 1/24/2024 4.1 12000 5.5 14.5 $21.00 $6.73 $8.68 20% 0% 4.0 500 99% Feat Low 1,940 139 7/27/2025 8.6 13000 3.0 17.0 $21.00 $4.97 $7.47 39% 75% 6.0 1,250 173% Fist High 1,022 88 10/22/2024 1.2 25000 12.5 7.5 $38.00 $16.40 $11.16 28% 36% 3.0 700 134% Foam Pfmn 981 109 8/18/2024 1.4 27000 13.8 12.8 $33.00 $15.85 $8.27 25% 6% 5.0 900 105% Fume Size 1,029 157 9/25/2024 1.3 17000 6.8 6.0 $33.00 $12.86 $9.27 33% 17% 5.0 900 116%
  • 45.
    Fox High 96845 10/19/2024 0.9 25000 13.0 7.0 $38.00 $16.81 $8.44 34% 100% 5.5 1,100 198% CAPSTONE® COURIER Page 4 2/22/2020 Report Page https://ww3.capsim.com/cgi- bin/displayReport.cfm?Report=CapCourier#frontpage 6/14 Top Traditional Market Segment Analysis C116647_042 Round: 4December 31, 2024 Traditional Statistics Total Industry Unit Demand 10,504 Actual Industry Unit Sales 10,504 Segment % of Total Industry 28.4% Next Year's Segment Growth Rate 9.2% Traditional Customer Buying Criteria Expectations Importance 1. Age Ideal Age = 2.0 47% 2. Price $18.00 - 28.00 23% 3. Ideal Position Pfmn 7.8 Size 12.2 21% 4. Reliability MTBF 14000-19000 9% Perceptual Map for Traditional Segment Top Products in Traditional Segment
  • 46.
    Name Market Share Units Sold to Seg Revision DateStock Out Pfmn Coord Size Coord List Price MTBF Age Dec.31 Promo Budget Cust. Aware- ness Sales Budget Cust. Access- ibility Dec. Cust. Survey
  • 47.
    Echo 14% 1,4459/13/2024 7.8 12.2 $26.00 15000 1.33 $1,350 76% $1,056 77% 34 Buddy 13% 1,357 5/1/2024 YES 8.0 12.0 $28.00 18000 1.57 $1,450 87% $1,200 80% 45 Egg 12% 1,262 7/20/2024 YES 7.8 12.2 $26.00 16000 1.70 $1,350 76% $1,056 77% 45 Daze 12% 1,245 8/2/2024 8.2 11.9 $28.50 18700 1.51 $1,225 77% $1,670 51% 32 Baker 12% 1,242 4/4/2023 6.5 13.6 $28.00 16000 2.75 $1,450 89% $1,200 80% 21 Bold 12% 1,240 5/10/2024 YES 8.0 12.0 $28.00 19000 1.59 $1,450 87% $1,200 80% 47 Cake 12% 1,229 9/13/2024 7.8 12.2 $26.00 14000 1.45 $1,150 71% $1,675 50% 30 Able 10% 1,023 1/15/2024 YES 8.0 12.0 $25.00 16000 2.40 $900 58% $900 34% 29 Eat 3% 295 1/15/2024 5.5 14.5 $20.50 13500 4.09 $1,350 79% $1,056 77% 3 Fast 1% 118 1/24/2024 5.5 14.5 $21.00 12000 4.08 $900 57% $710 27% 1 Aft 0% 39 5/31/2025 11.0 14.0 $30.00 23500 2.43 $400 28% $400 34% 2 Acre 0% 8 9/1/2024 3.0 15.0 $19.00 12000 1.47 $900 50% $900 34% 0 CAPSTONE® COURIER Page 5 2/22/2020 Report Page https://ww3.capsim.com/cgi- bin/displayReport.cfm?Report=CapCourier#frontpage 7/14 Top
  • 48.
    Low End MarketSegment Analysis C116647_042 Round: 4December 31, 2024 Low End Statistics Total Industry Unit Demand 13,949 Actual Industry Unit Sales 13,949 Segment % of Total Industry 37.8% Next Year's Segment Growth Rate 11.7% Low End Customer Buying Criteria Expectations Importance 1. Price $13.00 - 23.00 53% 2. Age Ideal Age = 7.0 24% 3. Ideal Position Pfmn 3.7 Size 16.3 16% 4. Reliability MTBF 12000-17000 7% Perceptual Map for Low End Segment Top Products in Low End Segment Name Market Share Units Sold to Seg Revision Date Stock Out Pfmn Coord Size
  • 49.
    Coord List Price MTBF Age Dec.31 Promo Budget Cust. Aware- ness Sales Budget Cust.Access- ibility Dec. Cust. Survey Ebb 21% 2,941 6/18/2026 3.0 17.0 $18.50 12000 8.60 $1,350 78% $1,056 56% 23 Cedar 19% 2,583 1/29/2021 3.0 17.0 $19.00 12000 8.60 $1,150 70% $1,758 50% 20 Bead 17% 2,372 5/24/2016 3.0 17.0 $20.00 14000 8.60 $1,450 89% $1,200 36% 18 Dell 15% 2,119 1/12/2026 3.0 17.0 $21.00 14000 8.60 $1,225 76% $1,753 50% 16 Feat 14% 1,940 7/27/2025 3.0 17.0 $21.00 13000 8.60 $1,100 70% $1,278 53% 15 Eat 6% 832 1/15/2024 5.5 14.5 $20.50 13500 4.09 $1,350 79% $1,056 56% 9 Acre 4% 621 9/1/2024 3.0 15.0 $19.00 12000 1.47 $900 50%
  • 50.
    $900 22% 6 Fast4% 541 1/24/2024 5.5 14.5 $21.00 12000 4.08 $900 57% $710 53% 6 CAPSTONE® COURIER Page 6 2/22/2020 Report Page https://ww3.capsim.com/cgi- bin/displayReport.cfm?Report=CapCourier#frontpage 8/14 Top High End Market Segment Analysis C116647_042 Round: 4December 31, 2024 High End Statistics Total Industry Unit Demand 4,656 Actual Industry Unit Sales 4,656 Segment % of Total Industry 12.6% Next Year's Segment Growth Rate 16.2% High End Customer Buying Criteria Expectations Importance 1. Ideal Position Pfmn 12.5 Size 7.5 43% 2. Age Ideal Age = 0.0 29% 3. Reliability MTBF 20000-25000 19% 4. Price $28.00 - 38.00 9% Perceptual Map for High End Segment Top Products in High End Segment
  • 51.
    Name Market Share Units Sold to Seg Revision DateStock Out Pfmn Coord Size Coord List Price MTBF Age Dec.31 Promo Budget Cust. Aware- ness Sales Budget Cust. Access- ibility Dec. Cust. Survey
  • 52.
    Fist 22% 1,02210/22/2024 12.5 7.5 $38.00 25000 1.15 $1,300 74% $1,278 67% 51 Fox 21% 968 10/19/2024 13.0 7.0 $38.00 25000 0.87 $1,300 58% $1,278 67% 41 Bid 19% 871 10/6/2024 12.8 7.2 $38.00 23500 1.17 $1,400 85% $1,200 49% 41 Dixie 18% 819 10/23/2024 12.4 7.6 $38.50 25000 1.17 $1,250 77% $1,753 52% 43 Cid 15% 718 11/14/2024 12.5 7.5 $37.00 23000 1.13 $1,100 65% $1,758 50% 38 Adam 5% 220 7/28/2024 10.0 8.0 $35.00 21000 1.38 $500 36% $500 22% 7 Bold 0% 20 5/10/2024 YES 8.0 12.0 $28.00 19000 1.59 $1,450 87% $1,200 49% 0 Buddy 0% 11 5/1/2024 YES 8.0 12.0 $28.00 18000 1.57 $1,450 87% $1,200 49% 0 Daze 0% 4 8/2/2024 8.2 11.9 $28.50 18700 1.51 $1,225 77% $1,670 52% 0 Able 0% 1 1/15/2024 YES 8.0 12.0 $25.00 16000 2.40 $900 58% $900 22% 0 CAPSTONE® COURIER Page 7 2/22/2020 Report Page https://ww3.capsim.com/cgi- bin/displayReport.cfm?Report=CapCourier#frontpage 9/14 Top Performance Market Segment Analysis C116647_042 Round: 4December 31, 2024
  • 53.
    Performance Statistics Total IndustryUnit Demand 3,945 Actual Industry Unit Sales 3,945 Segment % of Total Industry 10.7% Next Year's Segment Growth Rate 19.8% Performance Customer Buying Criteria Expectations Importance 1. Reliability MTBF 22000-27000 43% 2. Ideal Position Pfmn 13.4 Size 13.2 29% 3. Price $23.00 - 33.00 19% 4. Age Ideal Age = 1.0 9% Perceptual Map for Performance Segment Top Products in Performance Segment Name Market Share Units Sold to Seg Revision Date Stock Out Pfmn Coord Size Coord List Price MTBF
  • 54.
    Age Dec.31 Promo Budget Cust. Aware- ness Sales Budget Cust. Access- ibility Dec.Cust. Survey Coat 26% 1,018 9/20/2024 13.4 13.2 $32.00 27000 1.42 $1,100 64% $1,591 41% 41 Foam 25% 981 8/18/2024 13.8 12.8 $33.00 27000 1.37 $1,300 74% $1,278 35% 39 Dot 24% 935 8/16/2024 13.8 12.8 $33.50 27000 1.41 $1,200 74% $1,586 42% 37 Doom 21% 827 7/18/2024 13.7 12.9 $33.50 27000 0.92 $1,200 63% $0 42% 33 Aft 5% 179 5/31/2025 11.0 14.0 $30.00 23500 2.43 $400 28% $400 14% 5 Bold 0% 5 5/10/2024 YES 8.0 12.0 $28.00 19000 1.59 $1,450 87% $1,200 18% 0 CAPSTONE® COURIER Page 8
  • 55.
    2/22/2020 Report Page https://ww3.capsim.com/cgi- bin/displayReport.cfm?Report=CapCourier#frontpage10/14 Top Size Market Segment Analysis C116647_042 Round: 4December 31, 2024 Size Statistics Total Industry Unit Demand 3,885 Actual Industry Unit Sales 3,885 Segment % of Total Industry 10.5% Next Year's Segment Growth Rate 18.3% Size Customer Buying Criteria Expectations Importance 1. Ideal Position Pfmn 6.8 Size 6.6 43% 2. Age Ideal Age = 1.5 29% 3. Reliability MTBF 16000-21000 19% 4. Price $23.00 - 33.00 9% Perceptual Map for Size Segment Top Products in Size Segment Name Market Share Units Sold to Seg Revision
  • 56.
    Date Stock Out Pfmn Coord Size Coord List PriceMTBF Age Dec.31 Promo Budget Cust. Aware- ness Sales Budget Cust. Access- ibility Dec. Cust. Survey Dune 33% 1,275 8/16/2024 7.2 6.4 $33.50 19000 1.36 $1,200 74% $1,586 44% 38 Cure 30% 1,149 9/20/2024 6.8 6.6 $32.00 17000 1.35 $1,150 66% $1,591 43% 37 Fume 26% 1,029 9/25/2024 6.8 6.0 $33.00 17000 1.27 $1,300 74% $1,278 37% 31 Agape 10% 399 7/21/2024 6.0 8.0 $30.00 18000 1.47 $400 25%
  • 57.
    $400 14% 10 Buddy1% 34 5/1/2024 YES 8.0 12.0 $28.00 18000 1.57 $1,450 87% $1,200 20% 0 CAPSTONE® COURIER Page 9 2/22/2020 Report Page https://ww3.capsim.com/cgi- bin/displayReport.cfm?Report=CapCourier#frontpage 11/14 Top Market Share Report C116647_042 Round: 4December 31, 2024 Actual Market Share in Units Trad Low High Pfmn Size Total Industry Unit Sales 10,504 13,949 4,656 3,945 3,885 36,939 % of Market 28.4% 37.8% 12.6% 10.7% 10.5% 100.0% Able 9.7% 0.0% 2.8% Acre 0.1% 4.5% 1.7% Adam 4.7% 0.6% Aft 0.4% 4.5% 0.6% Agape 10.3% 1.1% Total 10.2% 4.5% 4.8% 4.5% 10.3% 6.7% Baker 11.8% 3.4% Bead 17.0% 6.4% Bid 18.7% 2.4% Bold 11.8% 0.4% 0.1% 3.4% Buddy 12.9% 0.3% 0.9% 3.8% Total 36.5% 17.0% 19.4% 0.1% 0.9% 19.4%
  • 58.
    Cake 11.7% 3.3% Cedar18.5% 7.0% Cid 15.4% 1.9% Coat 25.8% 2.8% Cure 29.6% 3.1% Total 11.7% 18.5% 15.4% 25.8% 29.6% 18.1% Daze 11.9% 0.1% 3.4% Dell 15.2% 5.7% Dixie 17.6% 2.2% Dot 23.7% 2.5% Dune 32.8% 3.5% Doom 21.0% 2.2% Total 11.9% 15.2% 17.7% 44.7% 32.8% 19.6% Eat 2.8% 6.0% 3.0% Ebb 21.1% 8.0% Echo 13.8% 3.9% Egg 12.0% 3.4% Total 28.6% 27.1% 18.3% Fast 1.1% 3.9% 1.8% Feat 13.9% 5.3% Fist 21.9% 2.8% Foam 24.9% 2.7% Fume 26.5% 2.8% Fox 20.8% 2.6% Total 1.1% 17.8% 42.8% 24.9% 26.5% 17.9% Potential Market Share in Units Trad Low High Pfmn Size Total Units Demanded 10,504 13,949 4,656 3,945 3,885 36,939 % of Market 28.4% 37.8% 12.6% 10.7% 10.5% 100.0%
  • 59.
    Able 9.8% 2.8% Acre0.1% 4.4% 1.7% Adam 4.6% 0.6% Aft 0.3% 4.5% 0.6% Agape 10.3% 1.1% Total 10.2% 4.5% 4.6% 4.5% 10.3% 6.7% Baker 11.2% 3.2% Bead 17.0% 6.4% Bid 18.2% 2.3% Bold 13.2% 0.4% 0.1% 3.8% Buddy 12.3% 0.2% 0.9% 3.6% Total 36.7% 17.0% 18.9% 0.1% 0.9% 19.3% Cake 11.0% 3.1% Cedar 18.5% 7.0% Cid 15.0% 1.9% Coat 25.8% 2.8% Cure 29.6% 3.1% Total 11.0% 18.5% 15.0% 25.8% 29.6% 17.9% Daze 11.1% 0.1% 3.2% Dell 15.2% 5.7% Dixie 17.1% 2.2% Dot 23.7% 2.5% Dune 32.8% 3.5% Doom 21.0% 2.2% Total 11.1% 15.2% 17.2% 44.7% 32.8% 19.3% Eat 2.7% 6.0% 3.0% Ebb 21.1% 8.0% Echo 12.9% 3.7% Egg 14.3% 4.1% Total 29.9% 27.1% 18.7% Fast 1.1% 3.9% 1.8%
  • 60.
    Feat 13.9% 5.3% Fist21.4% 2.7% Foam 24.9% 2.7% Fume 26.5% 2.8% Fox 22.9% 2.9% Total 1.1% 17.8% 44.3% 24.9% 26.5% 18.1% CAPSTONE® COURIER Page 10 2/22/2020 Report Page https://ww3.capsim.com/cgi- bin/displayReport.cfm?Report=CapCourier#frontpage 12/14 Top Perceptual Map C116647_042 Round: 4December 31, 2024 Perceptual Map for All Segments Andrews Name Pfmn Size Revised Able 8.0 12.0 1/15/2024 Acre 3.0 15.0 9/1/2024 Adam 10.0 8.0 7/28/2024 Aft 11.0 14.0 5/31/2025 Agape 6.0 8.0 7/21/2024 Aque 10.0 9.0 7/25/2025 Baldwin Name Pfmn Size Revised Baker 6.5 13.6 4/4/2023 Bead 3.0 17.0 5/24/2016 Bid 12.8 7.2 10/6/2024
  • 61.
    Bold 8.0 12.05/10/2024 Buddy 8.0 12.0 5/1/2024 Chester Name Pfmn Size Revised Cake 7.8 12.2 9/13/2024 Cedar 3.0 17.0 1/29/2021 Cid 12.5 7.5 11/14/2024 Coat 13.4 13.2 9/20/2024 Cure 6.8 6.6 9/20/2024 Digby Name Pfmn Size Revised Daze 8.2 11.9 8/2/2024 Dell 3.0 17.0 1/12/2026 Dixie 12.4 7.6 10/23/2024 Dot 13.8 12.8 8/16/2024 Dune 7.2 6.4 8/16/2024 Doom 13.7 12.9 7/18/2024 Erie Name Pfmn Size Revised Eat 5.5 14.5 1/15/2024 Ebb 3.0 17.0 6/18/2026 Echo 7.8 12.2 9/13/2024 Egg 7.8 12.2 7/20/2024 Ferris Name Pfmn Size Revised Fast 5.5 14.5 1/24/2024 Feat 3.0 17.0 7/27/2025 Fist 12.5 7.5 10/22/2024 Foam 13.8 12.8 8/18/2024 Fume 6.8 6.0 9/25/2024 Fox 13.0 7.0 10/19/2024
  • 62.
    CAPSTONE® COURIER Page11 2/22/2020 Report Page https://ww3.capsim.com/cgi- bin/displayReport.cfm?Report=CapCourier#frontpage 13/14 Top HR/TQM Report C116647_042 Round: 4December 31, 2024 HUMAN RESOURCES SUMMARY Andrews Baldwin Chester Digby Erie Ferris Needed Complement 527 986 779 947 697 945 Complement 527 986 779 947 697 945 1st Shift Complement 527 671 638 758 439 696 2nd Shift Complement 0 316 142 189 258 249 Overtime% 0.0% 0.0% 0.0% 0.0% 0.0% 0.0% Turnover Rate 8.2% 8.6% 8.8% 8.6% 8.8% 8.5% New Employees 43 157 69 81 61 81 Separated Employees 20 0 14 17 169 4 Recruiting Spend $3,000 $2,000 $2,000 $2,200 $2,000 $2,500 Training Hours 40 30 25 30 25 30 Productivity Index 113.1% 104.9% 103.9% 105.8% 103.5% 106.1% Recruiting Cost $174 $471 $206 $260 $184 $282 Separation Cost $100 $0 $69 $84 $847 $22 Training Cost $422 $592 $390 $568 $348 $567 Total HR Admin Cost $695 $1,063 $664 $911 $1,379 $872 Labor Contract Next Year Wages $25.53 $25.53 $25.53 $25.53 $25.53 $25.53
  • 63.
    Benefits 2,500 2,5002,500 2,500 2,500 2,500 Profit Sharing 2.0% 2.0% 2.0% 2.0% 2.0% 2.0% Annual Raise 5.0% 5.0% 5.0% 5.0% 5.0% 5.0% Starting Negotiation Position Wages Benefits Profit Sharing Annual Raise Ceiling Negotiation Position Wages Benefits Profit Sharing Annual Raise Adjusted Labor Demands Wages Benefits Profit Sharing Annual Raise Strike Days TQM SUMMARY Andrews Baldwin Chester Digby Erie Ferris Process Mgt Budgets Last Year CPI Systems $0 $0 $750 $0 $750 $0 Vendor/JIT $0 $0 $750 $0 $750 $0 Quality Initiative Training $0 $0 $750 $0 $750 $0 Channel Support Systems $0 $750 $0 $750 $0 $750 Concurrent Engineering $0 $750 $0 $750 $0 $750 UNEP Green Programs $50 $0 $750 $0 $750 $0 TQM Budgets Last Year Benchmarking $0 $750 $0 $750 $0 $750
  • 64.
    Quality Function DeploymentEffort $0 $750 $0 $750 $0 $750 CCE/6 Sigma Training $0 $750 $0 $750 $0 $750 GEMI TQEM Sustainability Initiatives $0 $0 $750 $0 $750 $0 Total Expenditures $50 $3,750 $3,750 $3,750 $3,750 $3,750 Cumulative Impacts Material Cost Reduction 0.00% 0.05% 1.85% 0.05% 1.85% 0.05% Labor Cost Reduction 0.00% 0.21% 1.60% 0.21% 1.60% 0.21% Reduction R&D Cycle Time 0.00% 17.75% 0.00% 17.75% 0.00% 17.75% Reduction Admin Costs 0.00% 12.59% 2.44% 12.59% 2.44% 12.59% Demand Increase 0.00% 1.73% 0.23% 1.73% 0.23% 1.73% CAPSTONE® COURIER Page 12 2/22/2020 Report Page https://ww3.capsim.com/cgi- bin/displayReport.cfm?Report=CapCourier#frontpage 14/14 2/22/2020 Report Page https://ww3.capsim.com/cgi- bin/displayReport.cfm?Report=CapCourier#frontpage 1/14 Page 1 Front Page Page 2 Stocks & Bonds Page 3 Financial Summary Page 4 Production Analysis
  • 65.
    Page 5 TraditionalSegment Analysis Page 6 Low End Segment Analysis Page 7 High End Segment Analysis Page 8 Performance Segment Analysis Page 9 Size Segment Analysis Page 10 Market Share Page 11 Perceptual Map Page 12 HR/TQM Report PRINT 2/22/2020 Report Page https://ww3.capsim.com/cgi- bin/displayReport.cfm?Report=CapCourier#frontpage 2/14 Top Round: 2 Dec. 31, 2022 Chen m C116647_042 Andrews Manling Chen
  • 66.
  • 67.
    Ferris Selected Financial Statistics AndrewsBaldwin Chester Digby Erie Ferris ROS -2.8% 5.5% 6.5% 6.7% 5.7% 7.0% Asset Turnover 0.90 1.06 1.24 1.19 0.98 1.35 ROA -2.6% 5.8% 8.1% 8.0% 5.6% 9.5% Leverage (Assets/Equity) 1.8 2.0 2.0 2.0 2.0 2.0 ROE -4.7% 11.8% 15.8% 15.7% 11.3% 18.6% Emergency Loan $0 $0 $0 $0 $0 $0 Sales $89,035,307 $122,587,013 $154,293,704 $157,992,088 $121,430,647 $141,272,826 EBIT $1,515,688 $16,879,190 $22,135,853 $23,545,648 $17,738,015 $20,964,167 Profits ($2,534,269) $6,704,268 $10,008,748 $10,617,319 $6,897,788 $9,957,111 Cumulative Profit $1,972,431 $18,305,555 $17,559,284 $20,307,535 $15,470,880 $20,156,303 SG&A / Sales 17.1% 13.9% 10.9% 12.3% 9.6% 13.1% Contrib. Margin % 29.4% 34.0% 30.2% 32.2% 30.8% 31.6%
  • 68.
    CAPSTONE® COURIER Page1 2/22/2020 Report Page https://ww3.capsim.com/cgi- bin/displayReport.cfm?Report=CapCourier#frontpage 3/14 Top Stocks & Bonds C116647_042 Round: 2 December 31 , 2022 Stock Market Summary Company Close Change Shares MarketCap ($M) Book Value PerShare EPS Dividend Yield P/E Andrews $19.86 ($11.30) 2,388,206 $47 $22.63 ($1.06) $1.00 5.0% -18.7 Baldwin $48.18 $3.29 2,046,274 $99 $27.87 $3.28 $3.23 6.7% 14.7 Chester $48.54 $11.53 2,069,366 $100 $30.69 $4.84 $0.09 0.2% 10.0 Digby $53.08 $11.93 2,086,720 $111 $32.36 $5.09 $0.00 0.0% 10.4 Erie $43.74 $4.72 2,128,085 $93 $28.78 $3.24 $1.11 2.5% 13.5 Ferris $52.06 $10.72 2,000,000 $104 $26.77 $4.98 $1.34 2.6% 10.4 Bond Market Summary Company Series# Face Yield Close$ S&P
  • 69.
    Andrews 12.5S2024 $10,924,506 12.3%101.36 BB 14.0S2026 $20,850,000 13.1% 107.03 BB 11.3S2031 $10,000,000 11.5% 97.84 BB Baldwin 12.5S2024 $11,609,210 12.5% 100.34 B 14.0S2026 $20,850,000 13.3% 105.13 B Chester 12.5S2024 $13,900,000 12.4% 100.67 B 14.0S2026 $20,850,000 13.2% 105.76 B Digby 12.5S2024 $13,828,904 12.4% 100.51 B 14.0S2026 $20,850,000 13.3% 105.44 B 11.7S2032 $2,891,032 12.0% 97.20 B Erie 12.5S2024 $13,900,000 12.5% 100.34 B 14.0S2026 $20,850,000 13.3% 105.13 B 11.8S2032 $2,640,750 12.1% 97.21 B Ferris 12.5S2024 $4,626,007 12.4% 100.67 B 14.0S2026 $20,850,000 13.2% 105.76 B Next Year's Prime Rate 8.00% CAPSTONE® COURIER Page 2 2/22/2020 Report Page
  • 70.
    https://ww3.capsim.com/cgi- bin/displayReport.cfm?Report=CapCourier#frontpage 4/14 Top Financial SummaryC116647_042 Round: 2December 31, 2022 Cash Flow Statement Survey Andrews Baldwin Chester Digby Erie Ferris Cash flows from operating activities Net Income (Loss) ($2,534) $6,704 $10,009 $10,617 $6,898 $9,957 Adjustment for non-cash items: Depreciation $9,347 $7,647 $7,707 $7,473 $8,355 $5,927 Extraordinary gains/losses/writeoffs $0 $55 $9 $7 ($539) ($805) Changes in current assets and liabilities: Accounts payable ($3,562) ($29) $2,021 $2,450 $239 $1,551 Inventory ($2,091) ($3,830) ($2,248) ($2,906) $1,286 ($422) Accounts receivable $3,256 $219 ($2,916) ($3,359) ($797) ($2,218) Net cash from operations $4,416 $10,765 $14,582 $14,283 $15,440 $13,990 Cash flows from investing activities Plant improvements (net) $0 ($4,130) ($5,640) ($19,920) ($9,292) ($6,910) Cash flows from financing activities Dividends paid ($2,388) ($6,617) ($190) $0 ($2,369) ($2,671) Sales of common stock $3,000 $0 $0 $2,940 $0 $0 Purchase of common stock $0 $0 $0 $0 $0 $0 Cash from long term debt issued $0 $0 $0 $2,891 $2,641 $0 Early retirement of long term debt $0 ($3,328) ($536) $0 $0 ($1,298) Retirement of current debt $0 ($11,359) ($11,359) ($11,359)
  • 71.
    ($11,359) ($11,359) Cash fromcurrent debt borrowing $0 $19,454 $15,742 $18,370 $14,857 $17,822 Cash from emergency loan $0 $0 $0 $0 $0 $0 Net cash from financing activities $612 ($1,850) $3,658 $12,842 $3,771 $2,494 Net change in cash position $5,028 $4,785 $12,601 $7,205 $9,919 $9,574 Balance Sheet Survey Andrews Baldwin Chester Digby Erie Ferris Cash $5,043 $23,955 $29,056 $24,776 $27,130 $26,522 Accounts Receivable $6,098 $10,076 $12,682 $12,986 $9,981 $11,611 Inventory $3,755 $13,287 $11,672 $13,049 $8,621 $10,481 Total Current Assets $14,896 $47,318 $53,410 $50,810 $45,732 $48,614 Plant and equipment $140,200 $114,700 $115,600 $127,100 $125,318 $88,900 Accumulated Depreciation ($56,627) ($46,247) ($44,853) ($45,527) ($47,028) ($32,807) Total Fixed Assets $83,573 $68,453 $70,747 $81,573 $78,290 $56,093 Total Assets $98,469 $115,771 $124,157 $132,384 $124,021 $104,708 Accounts Payable $2,649 $6,831 $8,917 $8,919 $6,721 $7,871 Current Debt $0 $19,454 $16,991 $18,370 $18,667 $17,822 Total Current Liabilities $2,649 $26,285 $25,908 $27,289 $25,388 $25,693
  • 72.
    Long Term Debt$41,775 $32,459 $34,750 $37,570 $37,391 $25,476 Total Liabilities $44,424 $58,744 $60,658 $64,859 $62,778 $51,169 Common Stock $32,347 $19,945 $20,736 $21,823 $22,747 $18,360 Retained Earnings $21,699 $37,082 $42,763 $45,701 $38,496 $35,179 Total Equity $54,046 $57,027 $63,499 $67,525 $61,243 $53,539 Total Liabilities & Owners' Equity $98,469 $115,771 $124,157 $132,384 $124,021 $104,708 Income Statement Survey Andrews Baldwin Chester Digby Erie Ferris Sales $89,035 $122,587 $154,294 $157,992 $121,431 $141,273 Variable Costs (Labor, Material, Carry) $62,824 $80,872 $107,642 $107,179 $84,088 $96,596 Contribution Margin $26,211 $41,715 $46,652 $50,813 $37,343 $44,677 Depreciation $9,347 $7,647 $7,707 $7,473 $8,355 $5,927 SGA (R&D, Promo, Sales, Admin) $15,199 $17,085 $16,792 $19,496 $11,657 $18,572 Other (Fees, Writeoffs, TQM, Bonuses) $150 $104 $18 $298 ($407) ($786) EBIT $1,516 $16,879 $22,136 $23,546 $17,738 $20,964 Interest (Short term, Long term) $5,415 $6,354 $6,424 $6,878 $6,909 $5,333 Taxes ($1,365) $3,684 $5,499 $5,834 $3,790 $5,471 Profit Sharing $0 $137 $204 $217 $141 $203 Net Profit ($2,534) $6,704 $10,009 $10,617 $6,898 $9,957 CAPSTONE® COURIER Page 3
  • 73.
    2/22/2020 Report Page https://ww3.capsim.com/cgi- bin/displayReport.cfm?Report=CapCourier#frontpage5/14 Top Production Analysis C116647_042 Round: 2December 31, 2022 Production Information Name Primary Segment Units Sold Unit Inven tory Revision Date Age Dec.31 MTBF Pfmn Coord Size Coord Price Material Cost Labor
  • 74.
    Cost Contr. Marg. 2nd Shift & Over- time Auto mation Next Round Capacity Next Round Plant Utiliz. Able Trad999 0 11/22/2022 1.7 18000 7.0 13.0 $27.00 $11.38 $8.02 30% 0% 4.0 2,200 45% Acre Low 1,070 30 12/22/2022 1.9 13000 3.0 15.0 $20.00 $7.17 $6.88 27% 0% 5.0 1,800 55% Adam High 478 21 11/16/2022 1.3 22000 10.0 10.0 $37.00 $15.43 $9.17 34% 0% 3.0 1,100 45% Aft Pfmn 369 10 8/5/2022 1.7 24000 10.0 15.0 $32.00 $14.08 $9.17 26% 0% 3.0 700 54% Agape Size 348 117 11/9/2022 1.6 18500 5.0 9.0 $32.00 $13.04 $9.17 29% 0% 3.0 700 66% Baker Trad 985 246 12/5/2022 1.8 17000 6.5 13.5 $29.00
  • 75.
    $10.60 $7.05 39%0% 5.0 1,300 88% Bead Low 2,209 165 5/24/2016 6.6 14000 3.0 17.0 $21.00 $6.38 $6.93 34% 61% 7.0 1,400 159% Bid High 744 131 12/18/2022 1.2 23500 10.4 9.6 $39.00 $16.26 $11.35 30% 78% 3.0 600 176% Bold High 305 71 7/27/2022 1.7 22000 8.8 13.5 $34.00 $13.29 $9.40 30% 0% 3.0 600 50% Buddy Size 242 76 9/18/2022 1.6 16000 6.2 11.4 $34.00 $11.26 $9.40 34% 0% 3.0 650 41% Cake Trad 1,350 185 8/26/2022 1.9 14000 6.4 13.6 $26.50 $9.61 $8.09 32% 45% 5.5 1,000 144% Cedar Low 2,420 182 1/29/2021 6.6 12000 3.0 17.0 $19.50 $5.78 $6.36 35% 75% 7.5 1,400 173% Cid High 641 155 11/15/2022 1.3 23000 10.2 9.8 $37.50 $15.92 $10.04 31% 17% 3.0 600 116% Coat Pfmn 747 38 11/3/2022 1.5 27000 11.8 13.9 $32.50 $16.38 $10.29 20% 25% 4.0 600 124% Cure Size 708 52 9/10/2022 1.6 17000 5.4 8.6 $32.50 $12.94 $10.04 29% 17% 4.0 600 116% Daze Trad 1,442 170 8/22/2022 1.8 18100 6.8 13.3 $29.00 $11.17 $7.72 34% 25% 5.0 1,200 124% Dell Low 1,946 153 5/24/2016 6.6 14000 3.0 17.0 $21.50 $6.38 $6.66 37% 39% 7.0 1,400 138% Dixie High 651 182 12/3/2022 1.2 24000 10.2 9.8 $39.00 $16.22 $10.88 31% 50% 3.0 600 149% Dot Pfmn 752 55 11/13/2022 1.5 27000 11.8 13.9 $34.00 $16.38 $10.29 23% 25% 3.0 650 124% Dune Size 687 70 11/13/2022 1.5 19000 5.8 8.6 $34.00 $13.65 $10.04 31% 17% 3.0 600 116% Doom 0 0 8/9/2023 0.0 0 0.0 0.0 $0.00 $0.00 $0.00 0% 0% 6.0 500 0% Eat Trad 1,476 183 4/8/2022 2.1 15500 5.5 14.5 $27.00 $9.21 $7.47 36% 14% 7.0 1,400 113%
  • 76.
    Ebb Low 2,271172 1/15/2022 6.6 12000 3.0 17.0 $19.50 $5.78 $6.96 32% 64% 6.0 1,450 163% Echo Trad 1,204 86 7/20/2022 1.4 16000 6.4 13.6 $27.00 $10.21 $9.20 23% 33% 5.0 900 132% Edge Pfmn 64 0 6/30/2018 4.5 25000 9.4 15.5 $34.00 $13.87 $11.63 28% 99% 3.0 1 198% Egg Size 76 67 12/24/2022 2.3 19000 6.9 13.4 $34.00 $11.44 $9.40 29% 0% 3.0 600 8% Fast Trad 1,136 271 4/22/2022 2.1 14000 5.5 14.5 $29.00 $8.76 $9.72 32% 63% 4.0 800 161% Feat Low 1,552 0 7/27/2025 6.6 13000 3.0 17.0 $22.00 $6.08 $8.72 32% 100% 6.0 700 198% Fist High 652 105 12/22/2022 1.2 25000 10.2 9.8 $39.00 $16.52 $10.43 33% 30% 3.0 550 129% Foam Pfmn 726 48 11/11/2022 1.5 27000 11.8 14.2 $34.00 $16.30 $9.00 27% 25% 4.0 600 124% Fume Size 708 64 11/9/2022 1.5 19000 5.4 8.4 $34.00 $13.67 $8.78 35% 17% 4.0 600 116% Fox 0 0 12/12/2022 0.0 25000 11.0 9.0 $39.00 $0.00 $0.00 0% 0% 5.5 500 0% CAPSTONE® COURIER Page 4 2/22/2020 Report Page https://ww3.capsim.com/cgi- bin/displayReport.cfm?Report=CapCourier#frontpage 6/14 Top Traditional Market Segment Analysis C116647_042 Round: 2December 31, 2022
  • 77.
    Traditional Statistics Total IndustryUnit Demand 8,809 Actual Industry Unit Sales 8,809 Segment % of Total Industry 30.4% Next Year's Segment Growth Rate 9.2% Traditional Customer Buying Criteria Expectations Importance 1. Age Ideal Age = 2.0 47% 2. Price $19.00 - 29.00 23% 3. Ideal Position Pfmn 6.4 Size 13.6 21% 4. Reliability MTBF 14000-19000 9% Perceptual Map for Traditional Segment Top Products in Traditional Segment Name Market Share Units Sold to Seg Revision Date Stock Out Pfmn Coord Size Coord List
  • 78.
    Price MTBF Age Dec.31 Promo Budget Cust. Aware- ness Sales Budget Cust.Access- ibility Dec. Cust. Survey Eat 16% 1,437 4/8/2022 5.5 14.5 $27.00 15500 2.09 $1,050 63% $1,085 54% 31 Daze 16% 1,409 8/22/2022 6.8 13.3 $29.00 18100 1.84 $1,100 66% $1,440 53% 36 Cake 15% 1,329 8/26/2022 6.4 13.6 $26.50 14000 1.87 $1,100 66% $1,270 47% 35 Echo 13% 1,170 7/20/2022 6.4 13.6 $27.00 16000 1.40 $1,050 57% $775 54% 29 Fast 13% 1,136 4/22/2022 5.5 14.5 $29.00 14000 2.08 $900 59% $1,235 48% 24 Baker 11% 985 12/5/2022 6.5 13.5 $29.00 17000 1.76 $1,300 76% $1,418 53% 37 Able 11% 984 11/22/2022 YES 7.0 13.0 $27.00 18000 1.72 $1,000 61% $1,000 50% 33 Acre 4% 349 12/22/2022 3.0 15.0 $20.00 13000 1.92 $800 48% $800 50% 5
  • 79.
    Aft 0% 68/5/2022 10.0 15.0 $32.00 24000 1.72 $800 46% $800 50% 1 Bead 0% 1 5/24/2016 3.0 17.0 $21.00 14000 6.60 $1,300 74% $1,418 53% 0 Dell 0% 1 5/24/2016 3.0 17.0 $21.50 14000 6.60 $1,100 64% $1,512 53% 0 CAPSTONE® COURIER Page 5 2/22/2020 Report Page https://ww3.capsim.com/cgi- bin/displayReport.cfm?Report=CapCourier#frontpage 7/14 Top Low End Market Segment Analysis C116647_042 Round: 2December 31, 2022 Low End Statistics Total Industry Unit Demand 11,180 Actual Industry Unit Sales 11,180 Segment % of Total Industry 38.6% Next Year's Segment Growth Rate 11.7% Low End Customer Buying Criteria Expectations Importance 1. Price $14.00 - 24.00 53% 2. Age Ideal Age = 7.0 24% 3. Ideal Position Pfmn 2.7 Size 17.3 16% 4. Reliability MTBF 12000-17000 7% Perceptual Map for Low End Segment
  • 80.
    Top Products inLow End Segment Name Market Share Units Sold to Seg Revision Date Stock Out Pfmn Coord Size Coord List Price MTBF Age Dec.31 Promo Budget Cust. Aware- ness Sales Budget Cust. Access- ibility
  • 81.
    Dec. Cust. Survey Cedar 22%2,419 1/29/2021 3.0 17.0 $19.50 12000 6.60 $1,100 64% $1,333 40% 25 Ebb 20% 2,270 1/15/2022 3.0 17.0 $19.50 12000 6.60 $1,050 62% $1,085 36% 23 Bead 20% 2,208 5/24/2016 3.0 17.0 $21.00 14000 6.60 $1,300 74% $1,418 40% 23 Dell 17% 1,945 5/24/2016 3.0 17.0 $21.50 14000 6.60 $1,100 64% $1,512 42% 20 Feat 14% 1,551 7/27/2025 YES 3.0 17.0 $22.00 13000 6.60 $1,100 64% $1,235 36% 17 Acre 6% 722 12/22/2022 3.0 15.0 $20.00 13000 1.92 $800 48% $800 27% 5 Eat 0% 39 4/8/2022 5.5 14.5 $27.00 15500 2.09 $1,050 63% $1,085 36% 1 Cake 0% 19 8/26/2022 6.4 13.6 $26.50 14000 1.87 $1,100 66% $1,270 40% 0 Able 0% 6 11/22/2022 YES 7.0 13.0 $27.00 18000 1.72 $1,000 61% $1,000 27% 0 CAPSTONE® COURIER Page 6 2/22/2020 Report Page https://ww3.capsim.com/cgi- bin/displayReport.cfm?Report=CapCourier#frontpage 8/14 Top High End Market Segment Analysis C116647_042 Round: 2December 31, 2022
  • 82.
    High End Statistics TotalIndustry Unit Demand 3,448 Actual Industry Unit Sales 3,448 Segment % of Total Industry 11.9% Next Year's Segment Growth Rate 16.2% High End Customer Buying Criteria Expectations Importance 1. Ideal Position Pfmn 10.7 Size 9.3 43% 2. Age Ideal Age = 0.0 29% 3. Reliability MTBF 20000-25000 19% 4. Price $29.00 - 39.00 9% Perceptual Map for High End Segment Top Products in High End Segment Name Market Share Units Sold to Seg Revision Date Stock Out Pfmn Coord Size Coord List
  • 83.
    Price MTBF Age Dec.31 Promo Budget Cust. Aware- ness Sales Budget Cust.Access- ibility Dec. Cust. Survey Bid 22% 744 12/18/2022 10.4 9.6 $39.00 23500 1.19 $1,250 71% $1,418 53% 38 Fist 19% 652 12/22/2022 10.2 9.8 $39.00 25000 1.18 $1,100 61% $1,235 44% 36 Dixie 19% 651 12/3/2022 10.2 9.8 $39.00 24000 1.23 $1,100 63% $1,512 51% 36 Cid 19% 641 11/15/2022 10.2 9.8 $37.50 23000 1.25 $1,000 58% $1,333 44% 30 Adam 14% 478 11/16/2022 10.0 10.0 $37.00 22000 1.27 $800 47% $800 32% 21 Bold 5% 188 7/27/2022 8.8 13.5 $34.00 22000 1.67 $1,300 72% $681 53% 5 Daze 1% 28 8/22/2022 6.8 13.3 $29.00 18100 1.84 $1,100 66% $1,440 51% 1 Echo 1% 19 7/20/2022 6.4 13.6 $27.00 16000 1.40 $1,050 57% $775 26% 0
  • 84.
    Buddy 1% 189/18/2022 6.2 11.4 $34.00 16000 1.64 $1,300 72% $737 53% 1 Dot 0% 10 11/13/2022 11.8 13.9 $34.00 27000 1.47 $1,100 62% $1,368 51% 0 Coat 0% 10 11/3/2022 11.8 13.9 $32.50 27000 1.48 $1,000 56% $1,206 44% 0 Able 0% 4 11/22/2022 YES 7.0 13.0 $27.00 18000 1.72 $1,000 61% $1,000 32% 1 CAPSTONE® COURIER Page 7 2/22/2020 Report Page https://ww3.capsim.com/cgi- bin/displayReport.cfm?Report=CapCourier#frontpage 9/14 Top Performance Market Segment Analysis C116647_042 Round: 2December 31, 2022 Performance Statistics Total Industry Unit Demand 2,749 Actual Industry Unit Sales 2,749 Segment % of Total Industry 9.5% Next Year's Segment Growth Rate 19.8% Performance Customer Buying Criteria Expectations Importance 1. Reliability MTBF 22000-27000 43% 2. Ideal Position Pfmn 11.4 Size 14.6 29% 3. Price $24.00 - 34.00 19% 4. Age Ideal Age = 1.0 9%
  • 85.
    Perceptual Map forPerformance Segment Top Products in Performance Segment Name Market Share Units Sold to Seg Revision Date Stock Out Pfmn Coord Size Coord List Price MTBF Age Dec.31 Promo Budget Cust. Aware- ness Sales Budget
  • 86.
    Cust. Access- ibility Dec. Cust. Survey Dot27% 742 11/13/2022 11.8 13.9 $34.00 27000 1.47 $1,100 62% $1,368 38% 35 Coat 27% 737 11/3/2022 11.8 13.9 $32.50 27000 1.48 $1,000 56% $1,206 33% 34 Foam 26% 723 11/11/2022 11.8 14.2 $34.00 27000 1.47 $1,100 59% $1,235 35% 35 Aft 13% 364 8/5/2022 10.0 15.0 $32.00 24000 1.72 $800 46% $800 25% 12 Bold 4% 117 7/27/2022 8.8 13.5 $34.00 22000 1.67 $1,300 72% $681 23% 3 Edge 2% 64 6/30/2018 YES 9.4 15.5 $34.00 25000 4.50 $300 25% $155 17% 7 Daze 0% 1 8/22/2022 6.8 13.3 $29.00 18100 1.84 $1,100 66% $1,440 38% 0 CAPSTONE® COURIER Page 8 2/22/2020 Report Page https://ww3.capsim.com/cgi- bin/displayReport.cfm?Report=CapCourier#frontpage 10/14 Top Size Market Segment Analysis C116647_042 Round: 2December 31, 2022 Size Statistics
  • 87.
    Total Industry UnitDemand 2,776 Actual Industry Unit Sales 2,776 Segment % of Total Industry 9.6% Next Year's Segment Growth Rate 18.3% Size Customer Buying Criteria Expectations Importance 1. Ideal Position Pfmn 5.4 Size 8.6 43% 2. Age Ideal Age = 1.5 29% 3. Reliability MTBF 16000-21000 19% 4. Price $24.00 - 34.00 9% Perceptual Map for Size Segment Top Products in Size Segment Name Market Share Units Sold to Seg Revision Date Stock Out Pfmn Coord Size Coord List Price MTBF
  • 88.
    Age Dec.31 Promo Budget Cust. Aware- ness Sales Budget Cust. Access- ibility Dec.Cust. Survey Fume 26% 708 11/9/2022 5.4 8.4 $34.00 19000 1.48 $1,100 59% $1,235 39% 39 Cure 26% 708 9/10/2022 5.4 8.6 $32.50 17000 1.56 $1,000 56% $1,206 37% 33 Dune 25% 687 11/13/2022 5.8 8.6 $34.00 19000 1.50 $1,100 62% $1,368 42% 39 Agape 13% 348 11/9/2022 5.0 9.0 $32.00 18500 1.58 $700 40% $700 27% 26 Buddy 8% 225 9/18/2022 6.2 11.4 $34.00 16000 1.64 $1,300 72% $737 28% 7 Egg 3% 75 12/24/2022 6.9 13.4 $34.00 19000 2.30 $1,050 56% $775 29% 0 Echo 1% 16 7/20/2022 6.4 13.6 $27.00 16000 1.40 $1,050 57% $775 29% 0 Able 0% 4 11/22/2022 YES 7.0 13.0 $27.00 18000 1.72 $1,000 61% $1,000 27% 0 Daze 0% 4 8/22/2022 6.8 13.3 $29.00 18100 1.84 $1,100 66% $1,440 42% 0
  • 89.
    Cake 0% 18/26/2022 6.4 13.6 $26.50 14000 1.87 $1,100 66% $1,270 37% 0 CAPSTONE® COURIER Page 9 2/22/2020 Report Page https://ww3.capsim.com/cgi- bin/displayReport.cfm?Report=CapCourier#frontpage 11/14 Top Market Share Report C116647_042 Round: 2December 31, 2022 Actual Market Share in Units Trad Low High Pfmn Size Total Industry Unit Sales 8,809 11,180 3,448 2,749 2,776 28,961 % of Market 30.4% 38.6% 11.9% 9.5% 9.6% 100.0% Able 11.2% 0.1% 0.1% 0.0% 0.1% 3.5% Acre 4.0% 6.5% 3.7% Adam 13.9% 1.6% Aft 0.1% 13.2% 1.3% Agape 12.5% 1.2% Total 15.2% 6.5% 14.0% 13.3% 12.7% 11.3% Baker 11.2% 0.0% 3.4% Bead 0.0% 19.8% 7.6% Bid 21.6% 2.6% Bold 5.5% 4.3% 1.1% Buddy 0.5% 8.1% 0.8% Total 11.2% 19.8% 27.5% 4.3% 8.1% 15.5%
  • 90.
    Cake 15.1% 0.2%0.1% 4.7% Cedar 0.0% 21.6% 8.4% Cid 18.6% 2.2% Coat 0.3% 26.8% 2.6% Cure 25.5% 2.4% Total 15.1% 21.8% 18.9% 26.8% 25.6% 20.3% Daze 16.0% 0.8% 0.1% 0.1% 5.0% Dell 0.0% 17.4% 6.7% Dixie 18.9% 2.3% Dot 0.3% 27.0% 2.6% Dune 24.7% 2.4% Total 16.0% 17.4% 20.0% 27.0% 24.9% 18.9% Eat 16.3% 0.3% 5.1% Ebb 0.0% 20.3% 7.8% Echo 13.3% 0.5% 0.6% 4.2% Edge 2.3% 0.2% Egg 0.0% 2.7% 0.3% Total 29.6% 20.7% 0.6% 2.3% 3.3% 17.6% Fast 12.9% 3.9% Feat 0.0% 13.9% 5.4% Fist 18.9% 2.3% Foam 0.1% 26.3% 2.5% Fume 25.5% 2.5% Total 12.9% 13.9% 19.0% 26.3% 25.5% 16.5% Potential Market Share in Units Trad Low High Pfmn Size Total Units Demanded 8,809 11,180 3,448 2,749 2,776 28,961 % of Market 30.4% 38.6% 11.9% 9.5% 9.6% 100.0% Able 13.5% 0.1% 0.2% 0.2% 4.2% Acre 4.1% 6.8% 3.9%
  • 91.
    Adam 13.9% 1.7% Aft0.1% 13.3% 1.3% Agape 12.5% 1.2% Total 17.8% 6.9% 14.0% 13.3% 12.7% 12.2% Baker 10.8% 3.3% Bead 19.6% 7.6% Bid 21.6% 2.6% Bold 5.5% 4.0% 1.0% Buddy 0.5% 8.1% 0.8% Total 10.8% 19.6% 27.5% 4.0% 8.1% 15.3% Cake 14.7% 0.2% 4.5% Cedar 21.5% 8.3% Cid 18.6% 2.2% Coat 0.3% 25.1% 2.4% Cure 25.5% 2.4% Total 14.7% 21.6% 18.9% 25.1% 25.5% 19.9% Daze 15.5% 0.8% 0.1% 0.1% 4.8% Dell 17.2% 6.7% Dixie 18.9% 2.2% Dot 0.3% 25.3% 2.4% Dune 24.7% 2.4% Total 15.5% 17.3% 20.0% 25.3% 24.9% 18.6% Eat 15.8% 0.3% 4.9% Ebb 20.1% 7.8% Echo 12.9% 0.5% 0.6% 4.0% Edge 7.6% 0.7% Egg 2.7% 0.3% Total 28.7% 20.5% 0.6% 7.6% 3.3% 17.7% Fast 12.5% 3.8% Feat 14.2% 5.5% Fist 18.9% 2.2%
  • 92.
    Foam 0.1% 24.7%2.4% Fume 25.5% 2.4% Total 12.5% 14.2% 19.0% 24.6% 25.5% 16.3% CAPSTONE® COURIER Page 10 2/22/2020 Report Page https://ww3.capsim.com/cgi- bin/displayReport.cfm?Report=CapCourier#frontpage 12/14 Top Perceptual Map C116647_042 Round: 2December 31, 2022 Perceptual Map for All Segments Andrews Name Pfmn Size Revised Able 7.0 13.0 11/22/2022 Acre 3.0 15.0 12/22/2022 Adam 10.0 10.0 11/16/2022 Aft 10.0 15.0 8/5/2022 Agape 5.0 9.0 11/9/2022 Aque 10.0 10.0 7/2/2022 Baldwin Name Pfmn Size Revised Baker 6.5 13.5 12/5/2022 Bead 3.0 17.0 5/24/2016 Bid 10.4 9.6 12/18/2022 Bold 8.8 13.5 7/27/2022 Buddy 6.2 11.4 9/18/2022
  • 93.
    Chester Name Pfmn SizeRevised Cake 6.4 13.6 8/26/2022 Cedar 3.0 17.0 1/29/2021 Cid 10.2 9.8 11/15/2022 Coat 11.8 13.9 11/3/2022 Cure 5.4 8.6 9/10/2022 Digby Name Pfmn Size Revised Daze 6.8 13.3 8/22/2022 Dell 3.0 17.0 5/24/2016 Dixie 10.2 9.8 12/3/2022 Dot 11.8 13.9 11/13/2022 Dune 5.8 8.6 11/13/2022 Erie Name Pfmn Size Revised Eat 5.5 14.5 4/8/2022 Ebb 3.0 17.0 1/15/2022 Echo 6.4 13.6 7/20/2022 Edge 9.4 15.5 6/30/2018 Egg 6.9 13.4 12/24/2022 Ferris Name Pfmn Size Revised Fast 5.5 14.5 4/22/2022 Feat 3.0 17.0 7/27/2025 Fist 10.2 9.8 12/22/2022 Foam 11.8 14.2 11/11/2022 Fume 5.4 8.4 11/9/2022 Fox 11.0 9.0 12/12/2022 CAPSTONE® COURIER Page 11
  • 94.
    2/22/2020 Report Page https://ww3.capsim.com/cgi- bin/displayReport.cfm?Report=CapCourier#frontpage13/14 Top HR/TQM Report C116647_042 Round: 2December 31, 2022 HUMAN RESOURCES SUMMARY Andrews Baldwin Chester Digby Erie Ferris Needed Complement 580 706 898 887 728 801 Complement 580 706 898 887 728 801 1st Shift Complement 580 534 650 678 538 541 2nd Shift Complement 0 172 249 209 190 260 Overtime% 0.0% 0.0% 0.0% 0.0% 0.0% 0.0% Turnover Rate 7.3% 8.8% 9.0% 8.8% 9.0% 8.8% New Employees 42 62 205 255 65 179 Separated Employees 119 56 0 0 2 0 Recruiting Spend $4,000 $2,000 $2,000 $2,200 $2,000 $2,500 Training Hours 70 30 25 30 25 30 Productivity Index 106.8% 101.1% 100.3% 101.2% 100.0% 101.4% Recruiting Cost $211 $186 $615 $816 $196 $627 Separation Cost $595 $280 $0 $0 $10 $0 Training Cost $812 $424 $449 $532 $364 $481 Total HR Admin Cost $1,618 $890 $1,065 $1,348 $570 $1,108 Labor Contract Next Year Wages $23.15 $23.15 $23.15 $23.15 $23.15 $23.15 Benefits 2,500 2,500 2,500 2,500 2,500 2,500 Profit Sharing 2.0% 2.0% 2.0% 2.0% 2.0% 2.0% Annual Raise 5.0% 5.0% 5.0% 5.0% 5.0% 5.0%
  • 95.
    Starting Negotiation Position Wages Benefits ProfitSharing Annual Raise Ceiling Negotiation Position Wages Benefits Profit Sharing Annual Raise Adjusted Labor Demands Wages Benefits Profit Sharing Annual Raise Strike Days TQM SUMMARY Andrews Baldwin Chester Digby Erie Ferris Process Mgt Budgets Last Year CPI Systems $0 $0 $0 $0 $0 $0 Vendor/JIT $0 $0 $0 $0 $0 $0 Quality Initiative Training $0 $0 $0 $0 $0 $0 Channel Support Systems $0 $0 $0 $0 $0 $0 Concurrent Engineering $0 $0 $0 $0 $0 $0 UNEP Green Programs $0 $0 $0 $0 $0 $0 TQM Budgets Last Year Benchmarking $0 $0 $0 $0 $0 $0 Quality Function Deployment Effort $0 $0 $0 $0 $0 $0 CCE/6 Sigma Training $0 $0 $0 $0 $0 $0 GEMI TQEM Sustainability Initiatives $0 $0 $0 $0 $0 $0
  • 96.
    Total Expenditures $0$0 $0 $0 $0 $0 Cumulative Impacts Material Cost Reduction 0.00% 0.00% 0.00% 0.00% 0.00% 0.00% Labor Cost Reduction 0.00% 0.00% 0.00% 0.00% 0.00% 0.00% Reduction R&D Cycle Time 0.00% 0.00% 0.00% 0.00% 0.00% 0.00% Reduction Admin Costs 0.00% 0.00% 0.00% 0.00% 0.00% 0.00% Demand Increase 0.00% 0.00% 0.00% 0.00% 0.00% 0.00% CAPSTONE® COURIER Page 12 2/22/2020 Report Page https://ww3.capsim.com/cgi- bin/displayReport.cfm?Report=CapCourier#frontpage 14/14 2/22/2020 Report Page https://ww3.capsim.com/cgi- bin/displayReport.cfm?Report=CapCourier#frontpage 1/14 Page 1 Front Page Page 2 Stocks & Bonds Page 3 Financial Summary Page 4 Production Analysis Page 5 Traditional Segment Analysis Page 6 Low End Segment Analysis
  • 97.
    Page 7 HighEnd Segment Analysis Page 8 Performance Segment Analysis Page 9 Size Segment Analysis Page 10 Market Share Page 11 Perceptual Map Page 12 HR/TQM Report PRINT 2/22/2020 Report Page https://ww3.capsim.com/cgi- bin/displayReport.cfm?Report=CapCourier#frontpage 2/14 Top Round: 1 Dec. 31, 2021 Chen m C116647_042 Andrews Manling Chen
  • 98.
  • 99.
    Ferris Selected Financial Statistics AndrewsBaldwin Chester Digby Erie Ferris ROS 0.3% 5.9% 2.8% 4.7% 3.9% 5.3% Asset Turnover 1.09 1.13 1.09 1.10 0.99 1.26 ROA 0.3% 6.7% 3.1% 5.2% 3.9% 6.6% Leverage (Assets/Equity) 1.9 1.9 2.0 2.0 2.0 2.0 ROE 0.6% 13.0% 6.3% 10.2% 7.7% 13.0% Emergency Loan $0 $0 $0 $0 $0 $0 Sales $113,812,233 $125,255,995 $118,816,949 $117,121,154 $111,729,614 $114,288,313 EBIT $5,914,081 $17,527,255 $11,255,607 $14,409,026 $13,083,261 $14,216,878 Profits $318,193 $7,412,779 $3,362,028 $5,501,709 $4,384,585 $6,010,684 Cumulative Profit $4,506,700 $11,601,286 $7,550,536 $9,690,216 $8,573,092 $10,199,192 SG&A / Sales 12.7% 12.8% 12.9% 14.2% 10.3% 14.5% Contrib. Margin % 27.3% 33.1% 29.1% 33.1% 29.5% 32.9% CAPSTONE® COURIER Page 1
  • 100.
    2/22/2020 Report Page https://ww3.capsim.com/cgi- bin/displayReport.cfm?Report=CapCourier#frontpage3/14 Top Stocks & Bonds C116647_042 Round: 1 December 31 , 2021 Stock Market Summary Company Close Change Shares MarketCap ($M) Book Value PerShare EPS Dividend Yield P/E Andrews $31.16 ($3.09) 2,291,939 $71 $24.42 $0.14 $1.00 3.2% 222.9 Baldwin $44.88 $10.63 2,046,274 $92 $27.83 $3.62 $0.00 0.0% 12.4 Chester $37.00 $2.75 2,069,366 $77 $25.94 $1.62 $0.00 0.0% 22.8 Digby $41.16 $6.90 2,015,280 $83 $26.78 $2.73 $0.00 0.0% 15.1 Erie $39.02 $4.77 2,128,085 $83 $26.65 $2.06 $0.00 0.0% 18.9 Ferris $41.34 $7.08 2,000,000 $83 $23.13 $3.01 $3.85 9.3% 13.8 Bond Market Summary Company Series# Face Yield Close$ S&P Andrews 12.5S2024 $10,924,506 12.1% 102.92 BB
  • 101.
    14.0S2026 $20,850,000 12.7%109.90 BB 11.3S2031 $10,000,000 11.3% 100.00 BB Baldwin 11.0S2022 $993,022 11.1% 99.46 B 12.5S2024 $13,900,000 12.2% 102.18 B 14.0S2026 $20,850,000 12.9% 108.74 B Chester 11.0S2022 $1,788,091 11.1% 99.28 B 12.5S2024 $13,900,000 12.3% 101.69 B 14.0S2026 $20,850,000 13.0% 107.97 B Digby 12.5S2024 $13,828,904 12.3% 101.93 B 14.0S2026 $20,850,000 12.9% 108.35 B Erie 11.0S2022 $3,809,769 11.1% 99.28 B 12.5S2024 $13,900,000 12.3% 101.69 B 14.0S2026 $20,850,000 13.0% 107.97 B Ferris 12.5S2024 $5,899,561 12.3% 101.93 B 14.0S2026 $20,850,000 12.9% 108.35 B Next Year's Prime Rate 7.50% CAPSTONE® COURIER Page 2 2/22/2020 Report Page https://ww3.capsim.com/cgi- bin/displayReport.cfm?Report=CapCourier#frontpage 4/14
  • 102.
    Top Financial Summary C116647_042Round: 1December 31, 2021 Cash Flow Statement Survey Andrews Baldwin Chester Digby Erie Ferris Cash flows from operating activities Net Income (Loss) $318 $7,413 $3,362 $5,502 $4,385 $6,011 Adjustment for non-cash items: Depreciation $9,347 $7,553 $7,573 $7,267 $7,987 $5,853 Extraordinary gains/losses/writeoffs $75 $178 $210 $234 $131 $774 Changes in current assets and liabilities: Accounts payable ($372) $277 $313 ($114) ($101) ($264) Inventory $6,953 ($839) ($807) ($1,526) ($1,289) ($1,442) Accounts receivable ($1,047) ($1,988) ($1,458) ($1,319) ($876) ($1,086) Net cash from operations $15,273 $12,595 $9,193 $10,043 $10,236 $9,846 Cash flows from investing activities Plant improvements (net) ($26,400) ($3,875) ($4,770) ($800) ($9,080) $15,220 Cash flows from financing activities Dividends paid ($2,292) $0 $0 $0 $0 ($7,699) Sales of common stock $12,000 $1,585 $2,376 $523 $4,387 $0 Purchase of common stock ($2,000) $0 $0 $0 $0 $0 Cash from long term debt issued $10,000 $0 $0 $0 $0 $0 Early retirement of long term debt ($10,000) ($5,926) ($5,135) ($6,988) ($3,124) ($15,211) Retirement of current debt $0 $0 $0 $0 $0 $0 Cash from current debt borrowing $0 $11,359 $11,359 $11,359 $11,359 $11,359 Cash from emergency loan $0 $0 $0 $0 $0 $0
  • 103.
    Net cash fromfinancing activities $7,708 $7,017 $8,599 $4,894 $12,622 ($11,551) Net change in cash position ($3,419) $15,737 $13,022 $14,137 $13,777 $13,515 Balance Sheet Survey Andrews Baldwin Chester Digby Erie Ferris Cash $15 $19,171 $16,456 $17,571 $17,211 $16,948 Accounts Receivable $9,354 $10,295 $9,766 $9,626 $9,183 $9,394 Inventory $1,664 $9,456 $9,424 $10,143 $9,907 $10,059 Total Current Assets $11,033 $38,922 $35,646 $37,340 $36,301 $36,401 Plant and equipment $140,200 $113,300 $113,600 $109,000 $119,800 $87,800 Accumulated Depreciation ($47,280) ($41,320) ($40,773) ($39,867) ($42,987) ($33,520) Total Fixed Assets $92,920 $71,980 $72,827 $69,133 $76,813 $54,280 Total Assets $103,953 $110,902 $108,473 $106,474 $113,114 $90,681 Accounts Payable $6,211 $6,860 $6,896 $6,469 $6,482 $6,319 Current Debt $0 $11,359 $11,359 $11,359 $11,359 $11,359 Total Current Liabilities $6,211 $18,219 $18,255 $17,828 $17,841 $17,678 Long Term Debt $41,775 $35,743 $36,538 $34,679 $38,560 $26,750 Total Liabilities $47,985 $53,962 $54,793 $52,507 $56,400 $44,428
  • 104.
    Common Stock $29,347$19,945 $20,736 $18,883 $22,747 $18,360 Retained Earnings $26,621 $36,995 $32,944 $35,084 $33,967 $27,894 Total Equity $55,968 $56,940 $53,680 $53,967 $56,714 $46,253 Total Liabilities & Owners' Equity $103,953 $110,902 $108,473 $106,474 $113,114 $90,681 Income Statement Survey Andrews Baldwin Chester Digby Erie Ferris Sales $113,812 $125,256 $118,817 $117,121 $111,730 $114,288 Variable Costs (Labor, Material, Carry) $82,717 $83,762 $84,224 $78,399 $78,763 $76,650 Contribution Margin $31,095 $41,494 $34,593 $38,722 $32,967 $37,638 Depreciation $9,347 $7,553 $7,573 $7,267 $7,987 $5,853 SGA (R&D, Promo, Sales, Admin) $14,480 $16,067 $15,358 $16,681 $11,500 $16,566 Other (Fees, Writeoffs, TQM, Bonuses) $1,355 $346 $406 $365 $397 $1,002 EBIT $5,914 $17,527 $11,256 $14,409 $13,083 $14,217 Interest (Short term, Long term) $5,415 $5,890 $5,978 $5,772 $6,200 $4,781 Taxes $175 $4,073 $1,847 $3,023 $2,409 $3,303 Profit Sharing $6 $151 $69 $112 $89 $123 Net Profit $318 $7,413 $3,362 $5,502 $4,385 $6,011 CAPSTONE® COURIER Page 3 2/22/2020 Report Page https://ww3.capsim.com/cgi-
  • 105.
    bin/displayReport.cfm?Report=CapCourier#frontpage 5/14 Top Production AnalysisC116647_042 Round: 1December 31, 2021 Production Information Name Primary Segment Units Sold Unit Inven tory Revision Date Age Dec.31 MTBF Pfmn Coord Size Coord Price Material Cost Labor Cost Contr. Marg.
  • 106.
    2nd Shift & Over- time Auto mation Next Round Capacity Next Round Plant Utiliz. Able Trad1,130 0 5/29/2021 2.3 17500 6.0 14.0 $27.00 $11.16 $7.87 29% 0% 4.0 2,200 52% Acre Low 1,918 101 12/7/2021 2.8 14000 4.0 16.0 $20.00 $8.07 $7.70 24% 43% 5.0 1,800 141% Adam High 397 0 11/2/2021 1.4 23000 9.0 11.0 $37.00 $15.86 $8.99 34% 0% 3.0 1,100 40% Aft Pfmn 454 0 6/1/2021 2.0 25000 10.0 16.0 $32.00 $15.07 $8.99 24% 0% 3.0 700 63% Agape Size 492 6 7/22/2021 2.0 19000 4.0 10.0 $32.00 $13.27 $8.99 30% 0% 3.0 700 73% Baker Trad 1,432 93 3/10/2021 2.5 17000 5.4 14.5 $29.50 $10.45 $7.85 36% 0% 5.0 1,600 84% Bead Low 1,774 146 5/24/2016 5.6 14000 3.0 17.0 $21.50 $7.05 $7.57 30% 36% 6.0 1,400 134% Bid High 453 83 12/25/2021 1.4 23500 9.2 10.8 $39.50 $16.22
  • 107.
    $9.40 36% 11%3.0 450 110% Bold Pfmn 394 80 8/25/2021 1.9 22500 9.1 14.5 $34.50 $14.21 $8.98 29% 0% 3.0 600 66% Buddy Size 388 70 8/6/2021 2.0 19000 5.1 11.2 $34.50 $12.83 $8.98 35% 0% 3.0 600 66% Cake Trad 1,279 98 4/22/2021 2.4 15000 5.7 14.3 $27.50 $10.10 $7.85 32% 0% 5.0 1,400 85% Cedar Low 1,942 176 1/29/2021 5.6 12000 3.0 17.0 $20.00 $6.45 $7.79 27% 50% 6.5 1,400 149% Cid High 482 103 11/26/2021 1.4 23000 9.1 10.9 $37.50 $15.96 $8.97 33% 0% 3.0 600 91% Coat Pfmn 481 42 11/13/2021 1.8 26000 10.6 14.7 $32.50 $16.14 $8.97 24% 0% 3.0 600 74% Cure Size 342 67 12/17/2021 1.8 18000 4.9 9.7 $32.50 $13.42 $8.97 30% 0% 3.0 600 58% Daze Trad 1,151 127 6/11/2021 2.3 17800 6.1 14.0 $29.50 $11.30 $7.85 34% 0% 5.0 1,400 78% Dell Low 1,554 168 5/24/2016 5.6 14000 3.0 17.0 $22.00 $7.05 $7.29 33% 21% 6.0 1,400 120% Dixie High 494 91 11/23/2021 1.4 23500 9.1 10.9 $39.50 $16.11 $9.36 36% 10% 3.0 500 109% Dot Pfmn 459 64 11/3/2021 1.8 26000 10.6 14.7 $34.50 $16.14 $8.98 28% 0% 3.0 600 74% Dune Size 394 64 11/2/2021 1.9 19000 4.9 9.8 $34.50 $13.66 $8.98 35% 0% 3.0 600 66% Eat Trad 1,401 75 3/17/2021 2.4 16500 5.6 14.5 $27.50 $10.40 $7.85 31% 0% 5.0 1,400 92% Ebb Low 2,002 166 1/15/2021 5.6 13000 3.0 17.0 $20.00 $6.75 $7.84 25% 54% 6.0 1,400 152% Echo High 334 102 12/23/2021 1.4 17000 7.0 12.9 $39.50 $12.08 $8.97 37% 0% 4.0 900 44% Edge Pfmn 312 62 6/30/2018 3.5 25000 9.4 15.5 $34.50 $14.81 $8.97 28% 0% 3.0 600 50%
  • 108.
    Egg Size 26693 12/24/2022 3.6 19000 4.0 11.0 $34.50 $12.60 $8.97 33% 0% 3.0 600 50% Fast Trad 1,356 120 3/3/2021 2.5 17500 5.6 14.5 $29.50 $10.70 $8.14 34% 8% 4.0 1,200 107% Feat Low 1,408 166 1/15/2021 5.6 13000 3.0 17.0 $22.00 $6.75 $7.86 31% 55% 5.0 1,000 153% Fist High 422 113 12/22/2021 1.4 24000 9.1 10.9 $39.50 $16.26 $8.98 36% 0% 3.0 500 99% Foam Pfmn 442 32 11/10/2021 1.8 26000 10.6 14.8 $34.50 $16.11 $8.98 29% 0% 4.0 600 66% Fume Size 330 79 12/10/2021 1.8 19000 4.7 9.6 $34.50 $13.73 $8.98 34% 0% 4.0 600 58% CAPSTONE® COURIER Page 4 2/22/2020 Report Page https://ww3.capsim.com/cgi- bin/displayReport.cfm?Report=CapCourier#frontpage 6/14 Top Traditional Market Segment Analysis C116647_042 Round: 1December 31, 2021 Traditional Statistics Total Industry Unit Demand 8,067 Actual Industry Unit Sales 8,067 Segment % of Total Industry 31.4% Next Year's Segment Growth Rate 9.2%
  • 109.
    Traditional Customer BuyingCriteria Expectations Importance 1. Age Ideal Age = 2.0 47% 2. Price $19.50 - 29.50 23% 3. Ideal Position Pfmn 5.7 Size 14.3 21% 4. Reliability MTBF 14000-19000 9% Perceptual Map for Traditional Segment Top Products in Traditional Segment Name Market Share Units Sold to Seg Revision Date Stock Out Pfmn Coord Size Coord List Price MTBF Age Dec.31 Promo Budget
  • 110.
    Cust. Aware- ness Sales Budget Cust. Access- ibility Dec.Cust. Survey Baker 17% 1,382 3/10/2021 5.4 14.5 $29.50 17000 2.45 $1,300 67% $1,362 58% 33 Eat 17% 1,363 3/17/2021 5.6 14.5 $27.50 16500 2.44 $1,050 60% $1,015 51% 33 Fast 16% 1,309 3/3/2021 5.6 14.5 $29.50 17500 2.46 $1,100 61% $1,175 54% 31 Cake 15% 1,249 4/22/2021 5.7 14.3 $27.50 15000 2.39 $1,100 61% $1,070 53% 32 Daze 13% 1,079 6/11/2021 6.1 14.0 $29.50 17800 2.33 $1,100 61% $1,330 58% 34 Able 13% 1,078 5/29/2021 YES 6.0 14.0 $27.00 17500 2.34 $1,000 58% $1,000 50% 35 Acre 2% 169 12/7/2021 4.0 16.0 $20.00 14000 2.83 $800 50% $800 50% 20 Bead 1% 103 5/24/2016 3.0 17.0 $21.50 14000 5.60 $1,300 65% $1,362 58% 1 Dell 1% 92 5/24/2016 3.0 17.0 $22.00 14000 5.60 $1,100 59% $1,396 58% 1 Ebb 1% 91 1/15/2021 3.0 17.0 $20.00 13000 5.60 $1,050 58% $1,015 51% 1 Feat 1% 71 1/15/2021 3.0 17.0 $22.00 13000 5.60 $1,100 59% $1,175 54% 0 Cedar 1% 71 1/29/2021 3.0 17.0 $20.00 12000 5.60 $1,100 59% $1,123 53% 0
  • 111.
    CAPSTONE® COURIER Page5 2/22/2020 Report Page https://ww3.capsim.com/cgi- bin/displayReport.cfm?Report=CapCourier#frontpage 7/14 Top Low End Market Segment Analysis C116647_042 Round: 1December 31, 2021 Low End Statistics Total Industry Unit Demand 10,009 Actual Industry Unit Sales 10,009 Segment % of Total Industry 39.0% Next Year's Segment Growth Rate 11.7% Low End Customer Buying Criteria Expectations Importance 1. Price $14.50 - 24.50 53% 2. Age Ideal Age = 7.0 24% 3. Ideal Position Pfmn 2.2 Size 17.8 16% 4. Reliability MTBF 12000-17000 7% Perceptual Map for Low End Segment Top Products in Low End Segment Name Market Share
  • 112.
    Units Sold to Seg Revision DateStock Out Pfmn Coord Size Coord List Price MTBF Age Dec.31 Promo Budget Cust. Aware- ness Sales Budget Cust. Access- ibility Dec. Cust. Survey Ebb 19% 1,910 1/15/2021 3.0 17.0 $20.00 13000 5.60 $1,050 58% $1,015 35% 18
  • 113.
    Cedar 19% 1,8711/29/2021 3.0 17.0 $20.00 12000 5.60 $1,100 59% $1,123 37% 18 Acre 17% 1,749 12/7/2021 4.0 16.0 $20.00 14000 2.83 $800 50% $800 32% 8 Bead 17% 1,671 5/24/2016 3.0 17.0 $21.50 14000 5.60 $1,300 65% $1,362 40% 16 Dell 15% 1,462 5/24/2016 3.0 17.0 $22.00 14000 5.60 $1,100 59% $1,396 40% 14 Feat 13% 1,336 1/15/2021 3.0 17.0 $22.00 13000 5.60 $1,100 59% $1,175 37% 13 Eat 0% 8 3/17/2021 5.6 14.5 $27.50 16500 2.44 $1,050 60% $1,015 35% 0 Cake 0% 2 4/22/2021 5.7 14.3 $27.50 15000 2.39 $1,100 61% $1,070 37% 0 CAPSTONE® COURIER Page 6 2/22/2020 Report Page https://ww3.capsim.com/cgi- bin/displayReport.cfm?Report=CapCourier#frontpage 8/14 Top High End Market Segment Analysis C116647_042 Round: 1December 31, 2021 High End Statistics Total Industry Unit Demand 2,967 Actual Industry Unit Sales 2,967 Segment % of Total Industry 11.6% Next Year's Segment Growth Rate 16.2%
  • 114.
    High End CustomerBuying Criteria Expectations Importance 1. Ideal Position Pfmn 9.8 Size 10.2 43% 2. Age Ideal Age = 0.0 29% 3. Reliability MTBF 20000-25000 19% 4. Price $29.50 - 39.50 9% Perceptual Map for High End Segment Top Products in High End Segment Name Market Share Units Sold to Seg Revision Date Stock Out Pfmn Coord Size Coord List Price MTBF Age Dec.31 Promo Budget
  • 115.
    Cust. Aware- ness Sales Budget Cust. Access- ibility Dec.Cust. Survey Dixie 17% 494 11/23/2021 9.1 10.9 $39.50 23500 1.40 $1,100 57% $1,396 53% 29 Cid 16% 482 11/26/2021 9.1 10.9 $37.50 23000 1.39 $1,000 54% $1,123 46% 27 Bid 15% 453 12/25/2021 9.2 10.8 $39.50 23500 1.35 $1,250 62% $1,362 51% 31 Fist 14% 422 12/22/2021 9.1 10.9 $39.50 24000 1.36 $1,000 54% $1,175 49% 29 Adam 13% 397 11/2/2021 YES 9.0 11.0 $37.00 23000 1.43 $800 48% $800 40% 23 Echo 11% 334 12/23/2021 7.0 12.9 $39.50 17000 1.36 $900 51% $725 38% 2 Bold 4% 107 8/25/2021 9.1 14.5 $34.50 22500 1.92 $1,300 61% $654 51% 4 Daze 1% 41 6/11/2021 6.1 14.0 $29.50 17800 2.33 $1,100 61% $1,330 53% 1 Coat 1% 37 11/13/2021 10.6 14.7 $32.50 26000 1.81 $1,000 52% $1,016 46% 1 Dot 1% 37 11/3/2021 10.6 14.7 $34.50 26000 1.82 $1,100 55% $1,263 53% 1 Foam 1% 33 11/10/2021 10.6 14.8 $34.50 26000 1.81 $1,000 52% $1,175 49% 1 Buddy 1% 24 8/6/2021 5.1 11.2 $34.50 19000 2.00 $1,300 61% $708 51% 1
  • 116.
    CAPSTONE® COURIER Page7 2/22/2020 Report Page https://ww3.capsim.com/cgi- bin/displayReport.cfm?Report=CapCourier#frontpage 9/14 Top Performance Market Segment Analysis C116647_042 Round: 1December 31, 2021 Performance Statistics Total Industry Unit Demand 2,294 Actual Industry Unit Sales 2,294 Segment % of Total Industry 8.9% Next Year's Segment Growth Rate 19.8% Performance Customer Buying Criteria Expectations Importance 1. Reliability MTBF 22000-27000 43% 2. Ideal Position Pfmn 10.4 Size 15.3 29% 3. Price $24.50 - 34.50 19% 4. Age Ideal Age = 1.0 9% Perceptual Map for Performance Segment Top Products in Performance Segment Name Market Share
  • 117.
    Units Sold to Seg Revision DateStock Out Pfmn Coord Size Coord List Price MTBF Age Dec.31 Promo Budget Cust. Aware- ness Sales Budget Cust. Access- ibility Dec. Cust. Survey Coat 19% 444 11/13/2021 10.6 14.7 $32.50 26000 1.81 $1,000 52% $1,016 33% 28
  • 118.
    Aft 19% 4366/1/2021 YES 10.0 16.0 $32.00 25000 2.04 $800 46% $800 30% 20 Dot 18% 423 11/3/2021 10.6 14.7 $34.50 26000 1.82 $1,100 55% $1,263 37% 27 Foam 18% 409 11/10/2021 10.6 14.8 $34.50 26000 1.81 $1,000 52% $1,175 35% 26 Edge 13% 290 6/30/2018 9.4 15.5 $34.50 25000 3.50 $300 33% $145 25% 12 Bold 13% 287 8/25/2021 9.1 14.5 $34.50 22500 1.92 $1,300 61% $654 29% 7 Daze 0% 2 6/11/2021 6.1 14.0 $29.50 17800 2.33 $1,100 61% $1,330 37% 0 Able 0% 2 5/29/2021 YES 6.0 14.0 $27.00 17500 2.34 $1,000 58% $1,000 30% 0 Fast 0% 2 3/3/2021 5.6 14.5 $29.50 17500 2.46 $1,100 61% $1,175 35% 0 CAPSTONE® COURIER Page 8 2/22/2020 Report Page https://ww3.capsim.com/cgi- bin/displayReport.cfm?Report=CapCourier#frontpage 10/14 Top Size Market Segment Analysis C116647_042 Round: 1December 31, 2021 Size Statistics Total Industry Unit Demand 2,347 Actual Industry Unit Sales 2,347 Segment % of Total Industry 9.1%
  • 119.
    Next Year's SegmentGrowth Rate 18.3% Size Customer Buying Criteria Expectations Importance 1. Ideal Position Pfmn 4.7 Size 9.6 43% 2. Age Ideal Age = 1.5 29% 3. Reliability MTBF 16000-21000 19% 4. Price $24.50 - 34.50 9% Perceptual Map for Size Segment Top Products in Size Segment Name Market Share Units Sold to Seg Revision Date Stock Out Pfmn Coord Size Coord List Price MTBF Age Dec.31 Promo
  • 120.
    Budget Cust. Aware- ness Sales Budget Cust. Access- ibility Dec.Cust. Survey Agape 21% 490 7/22/2021 4.0 10.0 $32.00 19000 2.02 $700 42% $700 35% 25 Dune 17% 393 11/2/2021 4.9 9.8 $34.50 19000 1.88 $1,100 55% $1,263 44% 37 Buddy 15% 364 8/6/2021 5.1 11.2 $34.50 19000 2.00 $1,300 61% $708 36% 15 Cure 14% 335 12/17/2021 4.9 9.7 $32.50 18000 1.81 $1,000 52% $1,016 39% 34 Fume 14% 329 12/10/2021 4.7 9.6 $34.50 19000 1.82 $1,000 52% $1,175 42% 37 Egg 11% 266 12/24/2022 4.0 11.0 $34.50 19000 3.60 $900 49% $725 35% 6 Baker 2% 36 3/10/2021 5.4 14.5 $29.50 17000 2.45 $1,300 67% $1,362 36% 1 Able 1% 34 5/29/2021 YES 6.0 14.0 $27.00 17500 2.34 $1,000 58% $1,000 35% 1 Daze 1% 28 6/11/2021 6.1 14.0 $29.50 17800 2.33 $1,100 61% $1,330 44% 1 Fast 1% 26 3/3/2021 5.6 14.5 $29.50 17500 2.46 $1,100 61% $1,175 42% 0 Cake 1% 25 4/22/2021 5.7 14.3 $27.50 15000 2.39 $1,100 61% $1,070 39% 1
  • 121.
    Eat 1% 233/17/2021 5.6 14.5 $27.50 16500 2.44 $1,050 60% $1,015 35% 0 CAPSTONE® COURIER Page 9 2/22/2020 Report Page https://ww3.capsim.com/cgi- bin/displayReport.cfm?Report=CapCourier#frontpage 11/14 Top Market Share Report C116647_042 Round: 1December 31, 2021 Actual Market Share in Units Trad Low High Pfmn Size Total Industry Unit Sales 8,067 10,009 2,967 2,294 2,347 25,684 % of Market 31.4% 39.0% 11.6% 8.9% 9.1% 100.0% Able 13.4% 0.6% 0.1% 1.4% 4.4% Acre 2.1% 17.5% 7.5% Adam 13.4% 1.5% Aft 0.6% 19.0% 1.8% Agape 0.0% 0.0% 20.9% 1.9% Total 15.5% 17.5% 14.6% 19.1% 22.3% 17.1% Baker 17.1% 0.5% 0.0% 1.5% 5.6% Bead 1.3% 16.7% 6.9% Bid 15.3% 1.8% Bold 3.6% 12.5% 1.5% Buddy 0.8% 15.5% 1.5% Total 18.4% 16.7% 20.2% 12.5% 17.0% 17.3%
  • 122.
    Cake 15.5% 0.0%0.1% 0.0% 1.1% 5.0% Cedar 0.9% 18.7% 7.6% Cid 16.2% 1.9% Coat 1.3% 19.3% 1.9% Cure 0.1% 0.0% 14.3% 1.3% Total 16.4% 18.7% 17.6% 19.4% 15.3% 17.6% Daze 13.4% 1.4% 0.1% 1.2% 4.5% Dell 1.1% 14.6% 6.0% Dixie 16.6% 1.9% Dot 1.2% 18.4% 1.8% Dune 0.0% 16.8% 1.5% Total 14.5% 14.6% 19.3% 18.5% 18.0% 15.8% Eat 16.9% 0.1% 0.3% 0.0% 1.0% 5.5% Ebb 1.1% 19.1% 7.8% Echo 11.3% 1.3% Edge 0.8% 12.6% 1.2% Egg 0.0% 11.3% 1.0% Total 18.0% 19.2% 12.3% 12.6% 12.3% 16.8% Fast 16.2% 0.7% 0.1% 1.1% 5.3% Feat 0.9% 13.3% 5.5% Fist 14.2% 1.6% Foam 1.1% 17.8% 1.7% Fume 0.0% 14.0% 1.3% Total 17.1% 13.3% 16.0% 17.9% 15.1% 15.4% Potential Market Share in Units Trad Low High Pfmn Size Total Units Demanded 8,067 10,009 2,967 2,294 2,347 25,684 % of Market 31.4% 39.0% 11.6% 8.9% 9.1% 100.0% Able 14.8% 0.6% 0.1% 1.6% 4.9% Acre 2.0% 17.5% 7.5%
  • 123.
    Adam 14.5% 1.7% Aft0.6% 19.1% 1.8% Agape 20.8% 1.9% Total 16.9% 17.5% 15.7% 19.2% 22.4% 17.7% Baker 16.9% 0.5% 1.5% 5.5% Bead 1.3% 16.7% 6.9% Bid 15.1% 1.7% Bold 3.5% 12.5% 1.5% Buddy 0.8% 15.5% 1.5% Total 18.1% 16.7% 19.9% 12.5% 17.0% 17.2% Cake 15.2% 0.1% 1.1% 4.9% Cedar 0.9% 18.7% 7.6% Cid 15.9% 1.8% Coat 1.2% 19.3% 1.9% Cure 0.1% 14.2% 1.3% Total 16.2% 18.7% 17.3% 19.3% 15.3% 17.5% Daze 13.1% 1.4% 0.1% 1.2% 4.4% Dell 1.1% 14.6% 6.1% Dixie 16.3% 1.9% Dot 1.2% 18.4% 1.8% Dune 16.7% 1.5% Total 14.2% 14.6% 19.0% 18.5% 17.9% 15.6% Eat 16.6% 0.1% 0.3% 1.0% 5.4% Ebb 1.1% 19.1% 7.8% Echo 11.2% 1.3% Edge 0.8% 12.6% 1.2% Egg 11.3% 1.0% Total 17.8% 19.2% 12.2% 12.6% 12.3% 16.7% Fast 16.0% 0.7% 0.1% 1.1% 5.2% Feat 0.9% 13.4% 5.5% Fist 14.1% 1.6%
  • 124.
    Foam 1.1% 17.8%1.7% Fume 14.0% 1.3% Total 16.8% 13.3% 15.9% 17.9% 15.1% 15.3% CAPSTONE® COURIER Page 10 2/22/2020 Report Page https://ww3.capsim.com/cgi- bin/displayReport.cfm?Report=CapCourier#frontpage 12/14 Top Perceptual Map C116647_042 Round: 1December 31, 2021 Perceptual Map for All Segments Andrews Name Pfmn Size Revised Able 6.0 14.0 5/29/2021 Acre 4.0 16.0 12/7/2021 Adam 9.0 11.0 11/2/2021 Aft 10.0 16.0 6/1/2021 Agape 4.0 10.0 7/22/2021 Baldwin Name Pfmn Size Revised Baker 5.4 14.5 3/10/2021 Bead 3.0 17.0 5/24/2016 Bid 9.2 10.8 12/25/2021 Bold 9.1 14.5 8/25/2021 Buddy 5.1 11.2 8/6/2021 Chester
  • 125.
    Name Pfmn SizeRevised Cake 5.7 14.3 4/22/2021 Cedar 3.0 17.0 1/29/2021 Cid 9.1 10.9 11/26/2021 Coat 10.6 14.7 11/13/2021 Cure 4.9 9.7 12/17/2021 Digby Name Pfmn Size Revised Daze 6.1 14.0 6/11/2021 Dell 3.0 17.0 5/24/2016 Dixie 9.1 10.9 11/23/2021 Dot 10.6 14.7 11/3/2021 Dune 4.9 9.8 11/2/2021 Erie Name Pfmn Size Revised Eat 5.6 14.5 3/17/2021 Ebb 3.0 17.0 1/15/2021 Echo 7.0 12.9 12/23/2021 Edge 9.4 15.5 6/30/2018 Egg 4.0 11.0 12/24/2022 Ferris Name Pfmn Size Revised Fast 5.6 14.5 3/3/2021 Feat 3.0 17.0 1/15/2021 Fist 9.1 10.9 12/22/2021 Foam 10.6 14.8 11/10/2021 Fume 4.7 9.6 12/10/2021 CAPSTONE® COURIER Page 11 2/22/2020 Report Page
  • 126.
    https://ww3.capsim.com/cgi- bin/displayReport.cfm?Report=CapCourier#frontpage 13/14 Top HR/TQM ReportC116647_042 Round: 1December 31, 2021 HUMAN RESOURCES SUMMARY Andrews Baldwin Chester Digby Erie Ferris Needed Complement 699 762 774 710 730 693 Complement 699 762 774 710 730 693 1st Shift Complement 609 679 672 656 620 595 2nd Shift Complement 90 83 102 54 109 98 Overtime% 0.0% 0.0% 0.0% 0.0% 0.0% 0.0% Turnover Rate 7.4% 8.9% 9.1% 8.9% 9.1% 8.9% New Employees 52 130 144 73 96 61 Separated Employees 1 0 0 0 0 7 Recruiting Spend $5,000 $2,000 $2,000 $2,200 $2,000 $2,500 Training Hours 70 30 25 30 25 30 Productivity Index 101.8% 100.0% 100.0% 100.0% 100.0% 100.0% Recruiting Cost $309 $390 $432 $233 $288 $215 Separation Cost $5 $0 $0 $0 $0 $37 Training Cost $979 $457 $387 $426 $365 $416 Total HR Admin Cost $1,293 $847 $818 $659 $653 $667 Labor Contract Next Year Wages $22.05 $22.05 $22.05 $22.05 $22.05 $22.05 Benefits 2,500 2,500 2,500 2,500 2,500 2,500 Profit Sharing 2.0% 2.0% 2.0% 2.0% 2.0% 2.0% Annual Raise 5.0% 5.0% 5.0% 5.0% 5.0% 5.0% Starting Negotiation Position
  • 127.
    Wages Benefits Profit Sharing Annual Raise CeilingNegotiation Position Wages Benefits Profit Sharing Annual Raise Adjusted Labor Demands Wages Benefits Profit Sharing Annual Raise Strike Days TQM SUMMARY Andrews Baldwin Chester Digby Erie Ferris Process Mgt Budgets Last Year CPI Systems $0 $0 $0 $0 $0 $0 Vendor/JIT $0 $0 $0 $0 $0 $0 Quality Initiative Training $0 $0 $0 $0 $0 $0 Channel Support Systems $0 $0 $0 $0 $0 $0 Concurrent Engineering $0 $0 $0 $0 $0 $0 UNEP Green Programs $0 $0 $0 $0 $0 $0 TQM Budgets Last Year Benchmarking $0 $0 $0 $0 $0 $0 Quality Function Deployment Effort $0 $0 $0 $0 $0 $0 CCE/6 Sigma Training $0 $0 $0 $0 $0 $0 GEMI TQEM Sustainability Initiatives $0 $0 $0 $0 $0 $0 Total Expenditures $0 $0 $0 $0 $0 $0
  • 128.
    Cumulative Impacts Material CostReduction 0.00% 0.00% 0.00% 0.00% 0.00% 0.00% Labor Cost Reduction 0.00% 0.00% 0.00% 0.00% 0.00% 0.00% Reduction R&D Cycle Time 0.00% 0.00% 0.00% 0.00% 0.00% 0.00% Reduction Admin Costs 0.00% 0.00% 0.00% 0.00% 0.00% 0.00% Demand Increase 0.00% 0.00% 0.00% 0.00% 0.00% 0.00% CAPSTONE® COURIER Page 12 2/22/2020 Report Page https://ww3.capsim.com/cgi- bin/displayReport.cfm?Report=CapCourier#frontpage 14/14