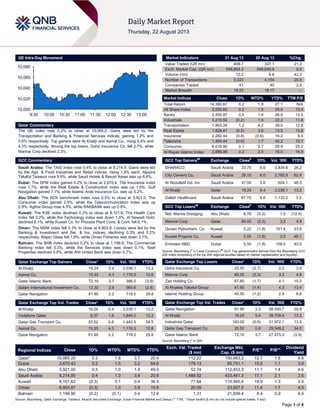
The QE index in Qatar rose 0.2% led by gains in the Transportation and Banking indices. Al Khaliji and Aamal Co. were the top gainers rising 5.4% and 4.3% respectively, while Doha Insurance Co. fell 2.7%. Trading volume on the QE exchange rose 42.2% compared to the previous day. Regional indices were mixed with Saudi Arabia and Abu Dhabi rising while Kuwait and Oman declined.
The QE index in Qatar rose 0.6% led by gains in the telecom and transportation indices. Top gainers were Qatar General Insurance and Al Ahli Bank, rising 2.9% each. Volume traded declined 49.8% from the previous day. Regional indices were mixed with Dubai and Oman rising while Abu Dhabi fell.
- The QE Index in Qatar declined 0.7% led by losses in the Industrials and Banks & Financial Services indices. Industries Qatar and QNB Group were the top losers.
- Regional indices were mixed with Saudi Arabia and Abu Dhabi rising while Dubai fell.
- Ezdan Holding Group saw strong gains in Qatar while losses in Dubai Investments weighed on that market. Trading volumes increased across many Gulf exchanges.
The QSE Index declined 0.9% led by losses in the Banks & Financial Services and Insurance indices. Qatar General Insurance and Ahli Bank fell 4.2% each, while Medicare Group rose 3.0% and Gulf Warehousing Co. rose 2.0%. Trading volume rose 53.8% but remained below the 30-day average. Regional markets were mixed with Saudi and Dubai rising while Oman fell slightly.
The QSE Index in Qatar declined slightly, led by losses in the Industrials and Banks indices. Dlala Brokerage and Medicare Group were the top losers. Regional markets were mixed, with Saudi Arabia down but Dubai and Abu Dhabi up marginally. Globally, US and European manufacturing PMIs were mixed while construction spending rose in the US. In Qatar news, the central bank auctioned treasury bills and will protect banks' foreign investments, and UDCD signed a large financing deal with Qatari banks.
The QE index in Qatar declined 0.4% led by losses in the telecom and real estate indices. Ezdan Holding Group and Ooredoo were the top losers falling 3.4% and 3.0% respectively. In other GCC markets, indices in Saudi Arabia and Dubai fell while Abu Dhabi and Kuwait rose marginally. Global economic data showed mixed signals with UK unemployment falling but wages and Spanish home sales rising less than expected.
QNBFS Daily Market Report January 26, 2022QNB Group
The QE Index rose 0.2% to close at 12,548.5. Gains were led by the Transportation and Banks & Financial Services indices, gaining 1.3% and 0.3%, respectively.
QNBFS Daily Market Report October 20, 2021QNB Group
The QE Index rose 0.2% to close at 11,767.5. Gains were led by the Consumer Goods & Services and Banks & Financial Services indices, gaining 0.4% each.
The QE index in Qatar declined 1.5% led by losses in the telecom and transportation indices. Widam Food Co. and Gulf Warehousing Co. were the top losers. Qatar National Cement Co. and Ezdan Holding Group were among the top gainers. Trading volume rose 19.5% but was 43.1% lower than the 30-day average. The Qatari economy grew 6.2% YoY in 1Q2014 led by double-digit growth in construction, trade and finance sectors, while the hydrocarbon sector fell 1.2%.
QNBFS Daily Market Report September 18, 2017QNB Group
The QSE Index declined 0.4% to close at 8,375.2. Losses were led by the Real Estate and Consumer Goods & Services indices, falling 1.1% and 0.9%, respectively.
The QE index in Qatar declined 0.2% led by declines in the real estate and transportation indices. United Development Co. and Islamic Holding Group were the top losers falling 4.1% and 3.3% respectively, while Gulf International Services rose 3.5%. Regional indices in Saudi Arabia, Dubai, Abu Dhabi and Kuwait rose, while Oman's index gained 0.3%. News from Qatar included proposals to establish an investment fund with Kazakhstan and requests from Egypt to extend gas payment terms and prices.
The QE index in Qatar rose 0.2% led by gains in the real estate and industrial indices. Islamic Holding Group and Mesaieed Petrochemical Holding Co. were the top gainers rising 10% and 7.2% respectively, while Zad Holding Co. fell 9.4%. Trading volume on the Qatar exchange rose 6.9% compared to the previous day. Regional indices were mixed with Saudi Arabia and Dubai rising while Oman and Bahrain fell.
The QE index rose 0.5% to close at 10,436.5 led by gains in the real estate and telecom indices. Barwa Real Estate Co. and Qatar General Ins. & Rein. Co. were the top gainers rising 3.3% and 3.1% respectively, while Qatar German Co. for Med. Dev. fell 1.8% and Qatar Navigation declined 1.5%. Trading volume on the Qatar Exchange declined 37.2% compared to the previous day. Regionally, indices in Dubai, Abu Dhabi and Saudi Arabia rose between 0.9-1.4% while Kuwait and Bahrain indices gained around 0.1-0.2%.
The QE index in Qatar declined 0.9% led by losses in the industrial and banking sectors. Qatar Cinema and Ezdan Holding were the top losers falling 9.7% and 3.5% respectively. Trading volume rose 18.4% despite being 65% lower than the 30-day average. The Qatari economy is forecasted to grow 6.3% in 2014 and 7.8% in 2015 driven by non-hydrocarbon sectors like construction benefiting from government infrastructure spending. Domestic inflation is also expected to rise due to strong domestic demand and population growth.
The QE Index declined 0.2% to close at 9,957.0. Losses were led by the Real Estate and Banks & Financial Services indices, falling 4.1% and 0.9%, respectively.
The QE index declined marginally to close at 9,067.6, led by losses in the Transportation and Real Estate indices. Doha Insurance Co. and Qatar Islamic Insurance were the top losers, while Islamic Holding Group rose 3.0% as one of the top gainers. Regional indices were mostly higher, with Saudi Arabia and Dubai rising 0.7% each. Qatari shareholders sold shares despite buying support from non-Qatari investors. Qatar may change its currency peg once its economy is less dependent on hydrocarbons and markets deepen.
The QE index in Qatar declined 1.8% led by losses in the Transportation and Banking & Financial Services indices. Qatar General Ins. & Rein. Co. and Qatari Investors Group were the top losers falling 4.7% and 4.4% respectively. Regional indices also declined except for Oman which gained marginally and Bahrain which was flat. Volume on the Qatar exchange rose 117.2% compared to the previous day.
The QE index in Qatar rose 0.3% led by gains in the Industrials and Banking indices. Gulf International Services and Industries Qatar were the top gainers, while Zad Holding and Qatar Islamic Bank declined the most. Trading volume fell 33.9% compared to the previous day but was higher than the 30-day average. Non-Qatari investors were net buyers while Qatari investors were net sellers. QNB Group reported a 13.7% rise in annual profit and Qatar's inflation fell to 2.7% year-over-year in December, with rental inflation at its lowest since February 2013.
The QE index declined 0.7% as the Real Estate and Industrials indices fell. Vodafone Qatar and Medicare Group were the top losers while Salam International Investment Co. and Widam Food Co. gained the most. Trading volume declined 27.6% but was 48% higher than the 30-day average, with Vodafone Qatar and Salam International Investment Co. being the most active stocks. Regional indices were mixed with Qatar, Saudi Arabia, Kuwait and Oman down while Dubai and Abu Dhabi rose.
QNBFS Daily Market Report September 08, 2019QNB Group
The QE Index declined 0.4% to close at 10,253.2. Losses were led by the Real Estate
and Banks & Financial Services indices, falling 1.5% and 1.0%, respectively.
QNBFS Daily Market Report October 19, 2021QNB Group
The QE Index declined 0.1% to close at 11,743.4. Losses were led by the Industrials and Banks & Financial Services indices, falling 0.5% and 0.1%, respectively.
QNBFS Daily Market Report October 12, 2021QNB Group
The QE Index in Qatar rose 0.1% driven by gains in the Insurance and Industrials indices. Gulf International Services and Mannai Corporation were the top gainers. Doha Insurance Group and Ooredoo declined. Trading volume increased 29.1% compared to the previous day. Regional indices were mixed with Abu Dhabi up 0.7% and Saudi Arabia down 0.5%. Several Qatar companies announced earnings release and AGM dates.
The QE Index rose 0.9% to close at 13,397.6. Gains were led by the Industrials and Consumer Goods & Services indices, gaining 2.8% and 2.3%, respectively.
The QSE Index declined 0.4% to close at 8,856.9. Losses were led by the Telecoms and
Banks & Financial Services indices, falling 1.3% and 0.6%, respectively.
The QE index in Qatar rose 0.8% led by gains in the Transportation and Banking & Financial Services indices. Qatari Investors Group and Gulf International Services were the top gainers rising 3.6% and 3.1% respectively, while Qatar Industrial Manufacturing Co. fell 2.3%. Regional indices were mixed with Abu Dhabi and Oman rising while Saudi Arabia fell. Volume on the QE exchange rose 12.6% from the previous day.
The QE index fell 0.1% to close at 8,404.7, led by declines in the Telecoms and Insurance indices. Trading activity decreased from the previous day. Top gainers were Islamic Holding Group (+9.9%) and United Development Co (+1.8%). Saudi markets were mostly higher and Abu Dhabi's index rose 0.2%. Kuwait's index declined 0.4%. Qatar Exchange's top traded stocks were Qatari Investors Group and Mazaya Qatar Real Estate.
This document is a newspaper from Trinidad, Colorado dated September 17, 2014. It contains local news briefs, event listings, weather forecasts, and other community information. Some of the main stories include a meeting being held to gather public input on a proposed expansion of the city's trail and greenway system, and an article introducing the new director of the Trinidad-Las Animas County Economic Development organization who wants to see sustainable economic growth while maintaining the area's character.
The document provides a technical analysis of the QE Index and several key Qatari stocks, identifying short-term trends as uptrends. It finds the QE Index reached a new all-time high and may continue gaining. Several stocks like Barwa Real Estate, Gulf International Services and Vodafone Qatar breached resistances and strengthened, suggesting further potential upmoves. Technical indicators for most stocks examined, including the QE Index, appear positive in the short-term.
Presentation to career coaches and work force coordinators regarding role of WFC: Referrals: reciprocal partnership, Grant activities, Assessment/Data support, Business Services
This document contains musical notation for the Christian song "In Christ Alone". The notation includes the chord progressions and structure for the song's introduction, verses and instrumental section. It also provides instructions for transitioning between the different parts of the song.
The document provides instructions and examples for an English writing task. Students are asked to join sentences using "so" or "such that" and answer questions about a conversation describing someone with an unusual appearance. The deadline for the task is March 1st.
This document discusses digital libraries and provides examples of metadata for describing a map from the Library of Congress American Memory collection using Dublin Core elements. It defines key aspects of digital libraries including content, users, and services. Metadata examples are given for elements like title, subject, description, and creator to catalog the historical map. The document demonstrates how Dublin Core can be used to provide structured descriptive information about digital objects.
The document outlines six steps for creating a successful revolution: 1) Create an organization to dedicate to the cause, using the ANC as an example. 2) Create goals like the Freedom Charter to inspire recruits and raise awareness. 3) Find a dedicated leader like Nelson Mandela who is willing to die for the cause. 4) Create alliances with other groups to gain power and influence, like the ANC's alliance with MK and the Communist Party. 5) Organize public protests to capture international attention, such as protests in Sharpeville and Soweto. 6) Include former enemies in the new government to avoid future opposition, as Mandela did with whites in South Africa.
This document discusses heat and thermal energy. It explains that materials expand as their thermal energy increases due to heat. The amount of expansion depends on the material and change in temperature. Common materials like steel, aluminum, and glass expand between 0.1-3.0 mm for every 1 degree Celsius of temperature increase. Thermal energy is measured using concepts like specific heat - the amount of heat required to change an object's temperature. Heat is transferred between objects via conduction, convection and radiation processes. Controlling heat transfer is important for applications like insulation.
The document compares different fitness and weight loss options including Fat Loss Formula, fitness centers/gyms, exercising on your own, weight loss centers, and pills/supplements. It indicates that Fat Loss Formula provides accountability, encouragement, simple nutrition plans, support, and supervised safe workouts, which other options may lack. It also claims Fat Loss Formula helps develop firm muscles, increased metabolism, fun and effective workouts, and lifelong healthy habits.
The transportation agreement outlines the terms and conditions between a carrier and contractor for transporting goods. It specifies that the contractor will accept, transport, and deliver goods as designated by the carrier without delay. The contractor must provide equipment and bear all costs, and will be compensated by the carrier at agreed upon rates. The contractor assumes liability and will indemnify the carrier for any losses or damages that occur while goods are in the contractor's possession. The contractor must also maintain various insurance policies naming the carrier. The initial term of the agreement is two years, after which it can be terminated with written notice.
Critical systems engineering focuses on developing dependable and secure systems for applications where failure could result in loss of life, injury, or significant economic damage. These systems often require certification by regulators to demonstrate compliance with safety and dependability standards before use. The development process for critical systems uses rigorous, plan-driven methodologies and techniques like formal methods, fault detection tools, and redundancy to reduce risk of failure, which may involve higher costs than for other systems due to the potentially severe consequences of errors.
Chalk and Talk: Silverlight, WCF RIA Services, ArchitectuurDennis Doomen
The document discusses a reference architecture for building Silverlight applications that uses WCF RIA Services. It includes a diagram showing the architecture with layers for the client project, server project, entities, data access layer, application logic, views, and database. It also discusses using RIA Services for the programming model and stack, and shows dependencies between projects for the solution including entities, data access layer, views, domain service, and database.
This document discusses risks and challenges with international project teams due to cultural differences. It notes differences can include understanding of time, communication styles, and work habits. To manage these issues, the document recommends defining common terms, establishing clear communication channels, and creating awareness of cultural differences among team members. International project success requires extra effort to understand different perspectives and adjust to working together effectively across borders.
The QE index in Qatar rose 1.3% led by gains in the transportation and real estate indices. Al Khalij Commercial Bank and Ezdan Holding Group were the top gainers rising 10.0% and 9.9% respectively. Volume traded fell by 2.7% but was 133.1% higher than the 30-day moving average. Qatar Gas Transport Co. and Vodafone Qatar were the most active stocks. KCBK reported a 28.5% drop in 1Q2014 net profit year-over-year mainly due to lower fees and commissions and muted investment income, despite a 12.4% rise in net interest income. Qatar Gas Transport expanded its LNG fleet through a joint
The QE index in Qatar rose 0.1% led by gains in the real estate and telecom indices. Al Khaliji and Zad Holding Co. were the top gainers rising 3.8% and 2.7% respectively, while Qatar Gas Transport Co. fell 2.9%. Regional indices were mixed with Abu Dhabi rising 0.1% while Saudi Arabia fell 0.3%. Trading activity on the Qatar Exchange declined 27.7% in volume terms day-over-day.
The QE index in Qatar rose 0.2% led by gains in the transportation and telecom sectors. Qatar Gas Transport Co. and Qatari Investors Group were the top gainers rising 3.8% and 2.6% respectively, while Qatar General Ins. & Rein. Co. fell 5.0%. Regional indices were mixed with Saudi Arabia and Kuwait rising while Dubai and Abu Dhabi fell.
The QE Index declined 0.2% to close at 12,828.5. Losses were led by the Banks & Financial Services and Insurance indices, falling 1.2% and 0.4%, respectively.
The QE index in Qatar rose 0.2% led by gains in the telecom and banking indices. Ooredoo and Masraf Al Rayan were the top gainers while Doha Insurance and Medicare Group declined. Regional indices were mixed with Saudi Arabia down slightly but Dubai and Abu Dhabi up. Earnings news included Etisalat reporting a 5.9% rise in net profit and CBQK's net profit rising 2.4% quarter-on-quarter. Fitch upgraded Alternatifbank's ratings following its acquisition by CBQK.
The QE index in Qatar rose 0.4% led by gains in the transportation and telecom sectors. Qatar Electricity & Water Co. and Qatar Gas Transport Co. were the top gainers, while Al Ahli Bank fell 3.2%. Most other GCC markets fell except for Saudi Arabia and Oman. Earnings were reported from Dubai Refreshments Co., and global economic data was mixed with US factory orders beating estimates but economic optimism declining. In company news, Qatar established a new economic council and various Qatar companies set dates to disclose earnings. The US Fed adopted new Basel III rules to regulate banks while the BoE plans new bank capital rules.
The QSE Index gained 0.6% led by the Banks & Financial Services and Industrials indices. Zad Holding Co. and Gulf International Services were the top gainers while Qatar German Co for Medical Devices fell the most. Trading volume fell 37.5% compared to the previous day. In other GCC markets, indices in Saudi Arabia, Abu Dhabi and Dubai rose while Kuwait and Oman fell marginally. Several Kuwaiti bank ratings were affirmed by Moody's. Globally, US GDP fell less than expected in Q1 while German business confidence rose in June. Qatar Petroleum plans to expand overseas operations and exit management of some industrial areas.
- The QE Index in Qatar declined 0.7% on Thursday led by losses in the Telecom and Transportation indices. Qatar Islamic Bank and Baladna were the top losers.
- Trading volume on the QSE fell 72.3% compared to the previous day.
- The World Bank regional director praised Qatar's economic growth outlook above 4.5% in 2023-2024 and expected increased surpluses in Qatar's financial and current accounts due to higher energy prices and revenues from tourism and the World Cup.
The QSE Index rose 0.5% led by gains in the Insurance and Transportation indices. Qatar Navigation and Qatar Insurance Company were the top gainers rising 3.3% and 2.1% respectively, while Mannai Corporation fell 3.0%. Regional indices were mixed with Saudi Arabia and Kuwait rising while Abu Dhabi fell. Fitch upgraded Doha Bank's outlook to stable and Qatari FDI rose 27% in 2017, showing investor confidence remains intact despite diplomatic issues. Analysts expect Qatar's economy to grow around 2.8% in 2018 and 2019, supported by oil prices, reforms and infrastructure spending.
The QE Index in Qatar rose slightly by 0.1% led by gains in the telecom and consumer goods sectors. Qatari Investors Group and Al Khalij Commercial Bank were the top gainers while Ahli Bank and Qatar General Insurance fell. Regional markets were mixed with Dubai up and Saudi Arabia and Abu Dhabi down. Real estate indices declined in Saudi Arabia and Abu Dhabi while telecoms gained in Qatar. Ezdan reported a 91.4% rise in Qatari real estate transactions for August.
The QE index in Qatar rose 1.7% led by gains in the banking and financial services and industrials indices. Qatar Islamic Bank and Doha Insurance Co. were the top gainers while Mesaieed Petrochemical Holding Co. declined. Overall trading activity in the region was mixed with indices in Qatar, Dubai and Abu Dhabi rising while Oman and Bahrain declined.
The QSE Index declined 0.8% to close at 9,188.1. Losses were led by the Insurance and Banks & Financial Services indices, falling 2.4% and 1.2%, respectively.
The document summarizes daily market activity in Qatar and other GCC countries. In Qatar, the QSE Index declined 0.9% as the Transportation and Real Estate indices fell. Qatar Gas Transport Co. and United Development Co. were the top losers. Dlala Brokerage & Investment Holding Co. gained the most. Trading volume fell 30.2% compared to the previous day. In other GCC countries, indices in Saudi Arabia and Dubai declined while Abu Dhabi and Kuwait rose. The document also provides company-specific news from Qatar, including the QFMA planning to split nominal share values and an increase in non-Qatari ownership of Barwa Real Estate Company.
QNBFS Daily Market Report September 30, 2021QNB Group
The QE Index in Qatar rose 0.4% driven by gains in the transportation and telecom sectors. Zad Holding Company and Qatar Navigation were the top gainers rising 1.5% each. Regional indices were mixed with Saudi Arabia up marginally but Dubai and Abu Dhabi down. Qatar Petroleum signed a 15-year deal to supply China's CNOOC with LNG. The Qatar central bank governor said there is no immediate need for a retail digital currency in Qatar.
The QSE Index declined 0.2% led by losses in the Insurance and Transportation indices. Qatar General Insurance and Ahli Bank were the top losers falling 7.2% and 4.7% respectively, while Dlala' Brokerage rose 2.7% and Medicare Group rose 1.8%. Trading volume fell 47.7% compared to the previous day. Regional markets were mixed with Saudi and Oman rising while Kuwait and Bahrain fell. Earnings releases from regional companies showed revenue declines but some growth in net profits. News articles discussed plans to boost Qatar's cruise tourism industry and the view that Qatar's sovereign wealth fund and debt market access cushion the impact of lower oil prices on the economy.
The QSE Index rose 0.3% to close at 9,142.3, led by gains in the Transportation and Industrials indices. Doha Insurance Group and Qatari Investors Group were the top gainers while Dlala Brokerage & Investment Holding Company and Mannai Corporation were the top losers. Trading volume rose 75.3% compared to the previous day but was lower than the 30-day average. Meanwhile, industrial producers' earnings in Qatar grew double digits in May driven by higher prices for crude oil and other commodities.
The QSE Index gained 1.0% led by the Real Estate and Telecoms indices. Top gainers were Doha Insurance and Medicare Group. Regional markets were mixed with Saudi and Dubai rising while Abu Dhabi fell. Global economic data showed existing US home sales declined more than expected in August while UK house prices rose.
QNBFS Daily Market Report December 24, 2023QNB Group
The QE Index rose 0.8% to close at 10,285.3. Gains were led by the Transportation and Banks & Financial Services indices, gaining 1.4% and 1.2%, respectively.
QNBFS Daily Technical Trader Qatar - October 10, 2023 التحليل الفني اليومي لب...QNB Group
The document provides a daily technical analysis of the QE Index and QATAR INSURANCE CO stock. For the QE Index, it notes the index remains in a downtrend but is approaching a support level of 9,700, where long positions could be taken. It provides expected resistance and support levels. For QATAR INSURANCE CO stock, it notes the stock has not fallen as much as others and the uptrend remains intact above moving averages, though liquidity is low. It provides expected price targets and resistance/support levels for the stock. Definitions of technical analysis terms like candlesticks, support, and simple moving average are also included.
QNBFS Daily Market Report October 04, 2023QNB Group
The QE Index rose 0.2% to close at 10,273.3. Gains were led by the Transportation and Consumer Goods & Services indices, gaining 1.7% and 0.1%, respectively.
QNBFS Daily Technical Trader Qatar - October 04, 2023 التحليل الفني اليومي لب...QNB Group
The General Index failed to sustain its breakout above the double-bottom formation’s neckline and continued with its decline into the formation’s territory.
QNBFS Daily Technical Trader Qatar - September 28, 2023 التحليل الفني اليومي ...QNB Group
The General Index failed to sustain its breakout above the double-bottom formation’s neckline and continued with its decline into the formation’s territory.
QNBFS Daily Market Report September 24, 2023QNB Group
- The QE Index in Qatar rose 0.3% led by gains in the Transportation and Industrials indices. Qatar Navigation and Al Khaleej Takaful Insurance were the top gainers.
- Regional markets were mixed with Saudi Arabia down 1% but Abu Dhabi up marginally. Economic data from the US and Europe was mixed.
- In Qatar news, QR500mn in bills were sold at a yield of 5.755% and Gulf International Services approved final merger agreements. Ooredoo also signed an MoU to support businesses in Qatar free zones.
QNBFS Daily Technical Trader Qatar - September 24, 2023 التحليل الفني اليومي ...QNB Group
The General Index failed to sustain its breakout above the double-bottom formation’s neckline and continued with its decline into the formation’s territory.
QNBFS Daily Technical Trader Qatar - September 19, 2023 التحليل الفني اليومي ...QNB Group
The General Index failed to sustain its breakout above the double-bottom formation’s neckline and continued with its decline into the formation’s territory.
QNBFS Daily Market Report September 17, 2023QNB Group
The QE Index declined 0.5% to close at 10,319.3. Losses were led by the Industrials and Consumer Goods & Services indices, falling 1.4% and 1.1%, respectively.
QNBFS Daily Technical Trader Qatar - September 07, 2023 التحليل الفني اليومي ...QNB Group
The General Index failed to
sustain its breakout above the
double-bottom formation’s
neckline and continued with
its decline into the
formation’s territory.
Economic Risk Factor Update: June 2024 [SlideShare]Commonwealth
May’s reports showed signs of continued economic growth, said Sam Millette, director, fixed income, in his latest Economic Risk Factor Update.
For more market updates, subscribe to The Independent Market Observer at https://blog.commonwealth.com/independent-market-observer.
In a tight labour market, job-seekers gain bargaining power and leverage it into greater job quality—at least, that’s the conventional wisdom.
Michael, LMIC Economist, presented findings that reveal a weakened relationship between labour market tightness and job quality indicators following the pandemic. Labour market tightness coincided with growth in real wages for only a portion of workers: those in low-wage jobs requiring little education. Several factors—including labour market composition, worker and employer behaviour, and labour market practices—have contributed to the absence of worker benefits. These will be investigated further in future work.
Discover the Future of Dogecoin with Our Comprehensive Guidance36 Crypto
Learn in-depth about Dogecoin's trajectory and stay informed with 36crypto's essential and up-to-date information about the crypto space.
Our presentation delves into Dogecoin's potential future, exploring whether it's destined to skyrocket to the moon or face a downward spiral. In addition, it highlights invaluable insights. Don't miss out on this opportunity to enhance your crypto understanding!
https://36crypto.com/the-future-of-dogecoin-how-high-can-this-cryptocurrency-reach/
University of North Carolina at Charlotte degree offer diploma Transcripttscdzuip
办理美国UNCC毕业证书制作北卡大学夏洛特分校假文凭定制Q微168899991做UNCC留信网教留服认证海牙认证改UNCC成绩单GPA做UNCC假学位证假文凭高仿毕业证GRE代考如何申请北卡罗莱纳大学夏洛特分校University of North Carolina at Charlotte degree offer diploma Transcript
The Universal Account Number (UAN) by EPFO centralizes multiple PF accounts, simplifying management for Indian employees. It streamlines PF transfers, withdrawals, and KYC updates, providing transparency and reducing employer dependency. Despite challenges like digital literacy and internet access, UAN is vital for financial empowerment and efficient provident fund management in today's digital age.
OJP data from firms like Vicinity Jobs have emerged as a complement to traditional sources of labour demand data, such as the Job Vacancy and Wages Survey (JVWS). Ibrahim Abuallail, PhD Candidate, University of Ottawa, presented research relating to bias in OJPs and a proposed approach to effectively adjust OJP data to complement existing official data (such as from the JVWS) and improve the measurement of labour demand.
Vicinity Jobs’ data includes more than three million 2023 OJPs and thousands of skills. Most skills appear in less than 0.02% of job postings, so most postings rely on a small subset of commonly used terms, like teamwork.
Laura Adkins-Hackett, Economist, LMIC, and Sukriti Trehan, Data Scientist, LMIC, presented their research exploring trends in the skills listed in OJPs to develop a deeper understanding of in-demand skills. This research project uses pointwise mutual information and other methods to extract more information about common skills from the relationships between skills, occupations and regions.
South Dakota State University degree offer diploma Transcriptynfqplhm
办理美国SDSU毕业证书制作南达科他州立大学假文凭定制Q微168899991做SDSU留信网教留服认证海牙认证改SDSU成绩单GPA做SDSU假学位证假文凭高仿毕业证GRE代考如何申请南达科他州立大学South Dakota State University degree offer diploma Transcript
Solution Manual For Financial Accounting, 8th Canadian Edition 2024, by Libby...Donc Test
Solution Manual For Financial Accounting, 8th Canadian Edition 2024, by Libby, Hodge, Verified Chapters 1 - 13, Complete Newest Version Solution Manual For Financial Accounting, 8th Canadian Edition by Libby, Hodge, Verified Chapters 1 - 13, Complete Newest Version Solution Manual For Financial Accounting 8th Canadian Edition Pdf Chapters Download Stuvia Solution Manual For Financial Accounting 8th Canadian Edition Ebook Download Stuvia Solution Manual For Financial Accounting 8th Canadian Edition Pdf Solution Manual For Financial Accounting 8th Canadian Edition Pdf Download Stuvia Financial Accounting 8th Canadian Edition Pdf Chapters Download Stuvia Financial Accounting 8th Canadian Edition Ebook Download Stuvia Financial Accounting 8th Canadian Edition Pdf Financial Accounting 8th Canadian Edition Pdf Download Stuvia
Optimizing Net Interest Margin (NIM) in the Financial Sector (With Examples).pdfshruti1menon2
NIM is calculated as the difference between interest income earned and interest expenses paid, divided by interest-earning assets.
Importance: NIM serves as a critical measure of a financial institution's profitability and operational efficiency. It reflects how effectively the institution is utilizing its interest-earning assets to generate income while managing interest costs.
Falcon stands out as a top-tier P2P Invoice Discounting platform in India, bridging esteemed blue-chip companies and eager investors. Our goal is to transform the investment landscape in India by establishing a comprehensive destination for borrowers and investors with diverse profiles and needs, all while minimizing risk. What sets Falcon apart is the elimination of intermediaries such as commercial banks and depository institutions, allowing investors to enjoy higher yields.
1. Elemental Economics - Introduction to mining.pdfNeal Brewster
After this first you should: Understand the nature of mining; have an awareness of the industry’s boundaries, corporate structure and size; appreciation the complex motivations and objectives of the industries’ various participants; know how mineral reserves are defined and estimated, and how they evolve over time.
Eco-Innovations and Firm Heterogeneity.Evidence from Italian Family and Nonf...
21 August Daily Market Report
1. Page 1 of 4
QE Intra-Day Movement
Qatar Commentary
The QE index rose 0.2% to close at 10,065.2. Gains were led by the
Transportation and Banking & Financial Services indices, gaining 1.2% and
0.5% respectively. Top gainers were Al Khaliji and Aamal Co., rising 5.4% and
4.3% respectively. Among the top losers, Doha Insurance Co. fell 2.7%, while
Mannai Corp declined 2.3%.
GCC Commentary
Saudi Arabia: The TASI index rose 0.4% to close at 8,214.9. Gains were led
by the Agri. & Food Industries and Retail indices, rising 1.8% each. Aljazira
Takaful Taawuni rose 9.6%, while Saudi Hotels & Resort Areas was up 6.6%.
Dubai: The DFM index gained 0.2% to close at 2,670.4. The Insurance index
rose 1.7%, while the Real Estate & Construction index was up 1.0%. Gulf
Navigation gained 7.1%, while Islamic Arab Insurance Co. was up 5.2%.
Abu Dhabi: The ADX benchmark index rose 0.5% to close at 3,921.0. The
Consumer index gained 2.9%, while the Telecommunication index was up
0.9%. Agthia Group rose 4.5%, while RAKBANK was up 2.9%.
Kuwait: The KSE index declined 0.3% to close at 8,101.6. The Health Care
index fell 2.2%, while the Technology index was down 1.4%. Al Nawadi Hold.
declined 8.1%, while Kuwait Co. for Process Plant Cons. & Cont. fell 6.1%.
Oman: The MSM index fell 0.3% to close at 6,903.9. Losses were led by the
Banking & Investment and Ser. & Ins. indices, declining 0.3% and 0.2%
respectively. Majan Glass fell 7.9%, while Oman Fisheries was down 3.7%.
Bahrain: The BHB index declined 0.2% to close at 1,199.9. The Commercial
Banking index fell 0.3%, while the Services index was down 0.1%. Seef
Properties declined 0.8%, while Ahli United Bank was down 0.7%.
Qatar Exchange Top Gainers Close* 1D% Vol. ‘000 YTD%
Al Khaliji 19.24 5.4 2,039.1 13.2
Aamal Co. 15.33 4.3 1,176.5 12.6
Qatar Islamic Bank 72.10 3.7 386.5 (3.9)
Salam International Investment Co. 12.30 2.9 560.6 (2.8)
Qatar Navigation 81.90 2.2 718.0 29.8
Qatar Exchange Top Vol. Trades Close* 1D% Vol. ‘000 YTD%
Al Khaliji 19.24 5.4 2,039.1 13.2
Vodafone Qatar 9.37 1.6 1,646.0 12.2
Qatar Gas Transport Co. 20.52 0.6 1,442.5 34.5
Aamal Co. 15.33 4.3 1,176.5 12.6
Qatar Navigation 81.90 2.2 718.0 29.8
Market Indicators 21 Aug 13 20 Aug 13 %Chg.
Value Traded (QR mn) 408.7 337.1 21.2
Exch. Market Cap. (QR mn) 548,664.3 548,645.9 0.0
Volume (mn) 12.2 8.6 42.2
Number of Transactions 5,023 4,154 20.9
Companies Traded 41 40 2.5
Market Breadth 18:23 18:17 –
Market Indices Close 1D% WTD% YTD% TTM P/E
Total Return 14,380.87 0.2 1.8 27.1 N/A
All Share Index 2,530.60 0.2 1.5 25.6 13.4
Banks 2,455.97 0.5 1.6 26.0 13.0
Industrials 3,210.50 (0.2) 1.0 22.2 11.8
Transportation 1,863.28 1.2 4.2 39.0 12.8
Real Estate 1,829.41 (0.5) 2.6 13.5 13.8
Insurance 2,282.44 (0.8) (0.6) 16.2 9.5
Telecoms 1,493.44 (0.6) 1.7 40.2 15.7
Consumer 6,018.80 0.1 0.7 28.9 25.2
Al Rayan Islamic Index 2,886.99 0.2 2.0 16.0 14.9
GCC Top Gainers##
Exchange Close#
1D% Vol. ‘000 YTD%
SHARACO Saudi Arabia 33.70 6.6 3,834.6 26.2
City Cement Co. Saudi Arabia 28.10 6.0 2,765.9 62.9
Al Abdullatif Ind. Inv. Saudi Arabia 47.00 5.6 604.1 48.3
Al Khaliji Qatar 19.24 5.4 2,039.1 13.2
Dallah Healthcare Saudi Arabia 67.75 4.6 1,133.2 3.0
GCC Top Losers##
Exchange Close#
1D% Vol. ‘000 YTD%
Nat. Marine Dredging Abu Dhabi 8.76 (5.3) 1.0 (12.4)
Mannai Corp Qatar 85.00 (2.3) 3.2 4.9
Qurain Petrochem. Co. Kuwait 0.22 (1.8) 161.4 23.6
Kuwait Projects Co. Kuwait 0.55 (1.8) 2.0 48.1
Emirates NBD Dubai 5.50 (1.8) 108.0 93.0
Source: Bloomberg (
#
in Local Currency) (
##
GCC Top gainers/losers derived from the Bloomberg GCC
200 Index comprising of the top 200 regional equities based on market capitalization and liquidity)
Qatar Exchange Top Losers Close* 1D% Vol. ‘000 YTD%
Doha Insurance Co. 25.50 (2.7) 2.2 3.9
Mannai Corp 85.00 (2.3) 3.2 4.9
Zad Holding Co. 67.60 (1.7) 4.1 15.0
Al Khaleej Takaful Group 41.60 (1.4) 4.3 13.4
Islamic Holding Group 40.50 (1.2) 2.4 6.6
Qatar Exchange Top Val. Trades Close* 1D% Val. ‘000 YTD%
Qatar Navigation 81.90 2.2 58,549.7 29.8
Al Khaliji 19.24 5.4 38,709.4 13.2
Industries Qatar 160.00 (0.9) 31,972.1 13.5
Qatar Gas Transport Co. 20.52 0.6 29,548.2 34.5
Qatar Islamic Bank 72.10 3.7 27,475.3 (3.9)
Source: Bloomberg (* in QR)
Regional Indices Close 1D% WTD% MTD% YTD%
Exch. Val. Traded
($ mn)
Exchange Mkt.
Cap. ($ mn)
P/E** P/B**
Dividend
Yield
Qatar* 10,065.20 0.2 1.8 3.7 20.4 112.22 150,663.2 12.7 1.8 4.6
Dubai 2,670.43 0.2 1.5 3.2 64.6 179.13 65,751.1 15.5 1.1 3.0
Abu Dhabi 3,921.00 0.5 1.0 1.9 49.0 52.74 112,453.3 11.1 1.4 4.6
Saudi Arabia 8,214.85 0.4 1.0 3.8 20.8 1,488.52 433,461.3 17.1 2.1 3.6
Kuwait 8,101.62 (0.3) 0.1 0.4 36.5 77.64 110,945.4 19.9 1.3 3.5
Oman 6,903.87 (0.3) 1.0 3.9 19.8 20.05 23,927.5 11.4 1.7 4.0
Bahrain 1,199.90 (0.2) (0.1) 0.4 12.6 1.31 21,939.4 8.4 0.9 4.0
Source: Bloomberg, Qatar Exchange, Tadawul, Muscat Securities Exchange, Dubai Financial Market and Zawya (** TTM; * Value traded ($ mn) do not include special trades, if any)
10,000
10,020
10,040
10,060
10,080
9:30 10:00 10:30 11:00 11:30 12:00 12:30 13:00
2. Page 2 of 4
Qatar Market Commentary
The QE index rose 0.2% to close at 10,065.2. The
Transportation and Banking & Financial Services indices led the
gains. The index rose on the back of buying support from Qatari
shareholders despite selling pressure from non-Qatari
shareholders.
Al Khaliji and Aamal Co. were the top gainers, rising 5.4% and
4.3% respectively. Among the top losers, Doha Insurance Co.
fell 2.7%, while Mannai Corp declined 2.3%.
Volume of shares traded on Wednesday rose by 42.2% to
12.2mn from 8.6mn on Tuesday. Further, as compared to the 30-
day moving average of 5.9mn, volume for the day was 105.0%
higher. Al Khaliji and Vodafone Qatar were the most active
stocks, contributing 16.8% and 13.5% to the total volume
respectively.
Source: Qatar Exchange (* as a % of traded value)
Global Economic Data
Date Market Source Indicator Period Actual Consensus Previous
08/21 US MBA MBA Mortgage Applications 16-August -4.60% – -4.70%
08/21 US Nat. Assoc. of Realtors Existing Home Sales July 5.39mn 5.15mn 5.06mn
08/21 US Nat. Assoc. of Realtors Existing Home Sales MoM July 6.50% 1.40% -1.60%
08/21 UK ONS Public Finances (PSNCR) (£) July -19.6bn -8.7bn -1.0bn
08/21 UK ONS PSNB ex Interventions (£) July 0.1bn -2.9bn 8.7bn
08/21 UK ONS Public Sector Net Borrowing (£) July -1.6bn -5.0bn 10.5bn
Source: Bloomberg (s.a. = seasonally adjusted; n.s.a. = non-seasonally adjusted; w.d.a. = working day adjusted)
News
Qatar
Qatar’s current account surplus widens to QR71.3bn in
1Q2013 – According to the data released by the Qatar Central
Bank (QCB), Qatar's current account surplus has widened to
QR71.3bn in 1Q2013, which is 38.5% of the GDP. The data also
showed that Qatar had a surplus of QR49.6bn in 4Q2012, which
was 27.4% of the GDP. In 1Q2013, trade balance stood at
QR103.0bn as compared to QR92.6bn in 4Q2012. Exports were
up to QR129.8bn in 1Q2013, while imports declined to
QR26.8bn in 1Q2013. Meanwhile, according to the forecast of
analysts polled by Reuters in April, Qatar would post a current
account surplus of 25.5% of GDP in 2013 and 20.0% in 2014.
(Reuters)
QA begins flights to Sulaymaniyah – Qatar Airways (QA) has
launched flights to Sulaymaniyah in Iraq, increasing its weekly
frequency from 16 to 20 flights across the country. This is QA’s
fifth destination in Iraq, which brings the carrier’s global network
to 129 destinations. (AME Info)
International
Limited clues on timing of QE3 reduction in Fed’s minutes –
According to the minutes of the US Federal Reserve’s July 30-
31 meeting, almost all of the 12 members of the policy-making
Federal Open Market Committee agreed that changing the
stimulus was not appropriate right now. The minutes provided
limited clues on the potential timing of the proposed reduction
and did not mention September specifically, but they did little to
dissuade predictions. A few members emphasized the
importance of being patient and evaluating additional
information on the US economy before deciding on any changes
in asset purchases. At the same time, others pointed to the
contingent plan released in the previous month, and suggested
that it might be time to slow down the pace of asset purchases
as outlined in that plan. Meanwhile, minutes also showed that
the Fed is considering a new tool to help drain cash from the
banking system and keep short-term interest rates on target
when it shifts from its current cheap-money policy. (Reuters)
ECB and Germany play down talk of third Greek bailout –
The European Central Bank (ECB) have joined Germany in
playing down rumors about a third bailout package for Greece,
but reaffirmed the Eurozone’s resolve to help the country trim its
debt as long as it sticks to its latest aid program. The ECB
Executive Board Member Joerg Asmussen said the Eurozone
will consider various measures to support Greece as long as it
implements its latest bailout plan, but has no plans to review the
situation before spring next year. (Reuters)
Japanese economy may have bottomed out in late 2012 –
According to the findings of a government panel, Japan may
have emerged late last year from its shortest economic
contraction in roughly 60 years, as optimism generated by Prime
Minister Shinzo Abe's reflationary policies led to robust personal
consumption. Some members of a government panel felt the
economy may have hit bottom in November 2012 judging from
trends in the coincident indicators' index, a measurement of
current economic conditions. However, the panel decided that
more evidence would be needed before coming to a conclusion.
The panel also agreed that Japan's economy peaked in April
2012 to end a three-year expansion that pulled it out from the
aftermath of Lehman Brothers' collapse. (Reuters)
China’s Flash HSBC PMI for August hits four-month high –
Activity in China's manufacturing sector hit a four-month high in
August 2013 as new orders rebounded. The Flash HSBC
Purchasing Managers' Index (HSBC PMI) rose to 50.1 from
July's final reading of 47.7, which was the weakest in 11
months. This is mainly driven by the initial filtering-through of
Overall Activity Buy %* Sell %* Net (QR)
Qatari 73.51% 71.54% 8,061,594.41
Non-Qatari 26.48% 28.45% (8,061,594.41)
3. Page 3 of 4
recent fine-tuning measures and companies' restocking
activities, despite the continuous external weakness. (Reuters)
ADB warns Asian nations on bypassing manufacturing for
services – The Asian Development Bank (ADB) has cautioned
that Asian economies which bypass industrialization and
leapfrog from agriculture to the services sector may fall into a
middle income trap. The ADB said the region’s low-income
economies should focus on developing their manufacturing
sectors, which would generate high-quality service jobs and
improve agricultural productivity. The bank said a lion’s share of
Asian economies is moving directly from the agricultural sector
to the services sector, bypassing industrialization. The ADB
study identified the Philippines, India, Sri Lanka and Pakistan as
among Asia’s agriculture-driven economies that have bypassed
industrialization for the services sector. (Gulf-Times.com)
Regional
Al-Khodari Sons obtains SR696mn Islamic credit facilities,
gets SR24mn O&M contract – Abdullah A M Al-Khodari Sons
Company (Al-Khodari Sons) has obtained Islamic credit facilities
worth SR696mn for the renewal of its existing credit facilities
with Samba Financial Group. These credit facilities provide
bonding commitments and fund the capital & working capital
requirements for the company’s specific projects. These credit
facilities comprise of 38% of Murabaha financing and 62% of
multi-bonds & documentary credit. Meanwhile, Al-Khodari Sons
has also obtained a contract worth SR24mn from the Ministry of
Water & Electricity for the operation & maintenance (O&M) of
water projects in Assyah in Qassim for 60 months. (Tadawul)
SEC signs two contracts worth SR464mn – The Saudi
Electricity Company (SEC) has signed two contracts worth
SR464mn for the establishment and expansion of two electricity
conversion plants in Riyadh. (Bloomberg)
Mobily’s unit signs MoU with GO’s shareholders for stake
buy – Etihad Etisalat Company’s (Mobily) unit has signed a
MoU with four shareholders of Etihad Atheeb
Telecommunication Company (GO) to buy a controlling interest
in the loss-making fixed-line operator. Bayanat Al Oula, wholly
owned by Mobily, has signed the MoU with shareholders:
Atheeb Trading Company, Al Nahla Group, Traco Group for
Trading & Contracting and the Saudi Internet Company. The
MoU outlines the basis for which a final agreement will be
concluded and also requires regulatory approvals to be obtained
with Bayanat completing due diligence by November 30.
(Peninsula Qatar)
Indian firms’ investment in UAE reaches $52bn – The Indian
Business & Professional Council’s (IBPC) President Paras
Shahdadpuri said India is ranked among the top investors in the
UAE with around 26,500 companies from the subcontinent
investing as much as $52bn in the Emirates. He also said that
the trade between the two countries has reached a record high
of $75bn during FY2013, as compared to $43bn in FY2009-
2010. (Bloomberg)
Emirates NBD expects to raise $12bn for clients in 2013 –
Emirates NBD expects to raise more than $12bn for its clients in
the remainder of 2013, which will boost its investment banking
income as the lender seeks expansion. Emirates NBD’s Head of
Wholesale Banking Giel-Jan Van Der Tol said that the bank has
mandates for about 20 bonds & loan deals after helping to raise
$14.6bn for its clients in 23 such transactions in 2013. These
deals have an average size of about $500mn. He also said that
these new transactions will raise revenue at Emirates NBD’s
wholesale banking unit by around 10% over the next 12 months
and loan growth by 6%. Due to limited growth opportunities in
the Dubai market, the bank is also planning to expand into other
countries in East Asia by opening representative offices.
(Bloomberg)
Arabtec plans merger in Saudi Arabia and Kuwait – Arabtec
Holding Company’s CEO Hasan Abdullah Ismaik said the
company is planning a merger with two construction companies
in Saudi Arabia and Kuwait. According to sources, Arabtec is in
talks to merge with Kuwait-based Combined Group Contracting
Company and Saudi Arabia-based Saudi Oger Ltd. (Bloomberg)
Bank of Sharjah signs $200mn club term loan facility – The
Bank of Sharjah has signed a $200mn club term loan facility
with a group of local and international mandated lead arrangers.
These arrangers include the National Bank of Abu Dhabi (acting
as a facility agent & coordinator), the Commercial Bank of
Dubai, Commerzbank Aktiengesellschaft, First Gulf Bank and
Wells Fargo Bank. This two-year facility will be used by the Bank
of Sharjah for its general corporate purposes and specifically for
the USD denominated transactions. This facility carries a margin
of 1.25% per annum with a reduction of 25 basis points. (ADX)
Etihad Airways plans to buy stake in Croatia Airlines –
According to sources, Etihad Airways is reportedly planning to
buy a stake in Croatia Airlines. The Croatian government will
offer a tender for the airline’s sale before October 15, 2013, in
which it owns 90%, with a new investor expected to be
announced by February 2014. (Bloomberg)
Kuwait Municipality awards contract for commercial land
use background study – Kuwait Municipality has awarded a
contract to UK-based Building Design Partnership Limited for
undertaking a commercial land use background study. This
significant urban planning project will develop a comprehensive
set of commercial land use proposals and an appropriate
planning policy framework, which will underpin the Kuwait
National Masterplan 2040. (Bloomberg)
Oman budget return to surplus at the end of June 2013 –
According to the data released by the National Center for
Statistics & Information, Oman’s government budget returned to
a surplus of OMR95.3mn at the end of June 2013 from a deficit
of OMR110.4mn seen in the first five months of 2013. Despite
that, the January-June 2013 outcome indicates sharp decline
from a surplus of OMR1.6bn seen in January-June 2012.
Meanwhile, analysts polled by Reuters in April had forecasted
that Oman will post a fiscal surplus of 3.8% of GDP in 2013.
(Bloomberg)
Sembcorp Salalah plans to launch IPO on August 28 –
Sembcorp Salalah Power & Water Company is planning to
launch an IPO for 33.4mn of its existing ordinary shares,
representing 35% of the issued share capital of the company.
These shares will be priced at OMR1.59 per share, inferring a
total offer size of OMR53mn with a market capitalization of
OMR152mn after listing. HSBC Bank Middle East is the sole
global coordinator and book-runner, while HSBC Bank Oman is
the issue manager. This offer runs from August 28, 2013 to
September 26, 2013. (AME Info)
VLCC plans to invest $20mn for manufacturing facility in
Bahrain – Indian wellness company, VLCC seeks to invest
$20mn in developing a manufacturing facility in Bahrain, which
will be a part of its ongoing expansion plan across the Middle
East. (GulfBase.com)
4. Contacts
Saugata Sarkar Ahmed M. Shehada Keith Whitney Sahbi Kasraoui
Head of Research Head of Trading Head of Sales Manager - HNWI
Tel: (+974) 4476 6534 Tel: (+974) 4476 6535 Tel: (+974) 4476 6533 Tel: (+974) 4476 6544
saugata.sarkar@qnbfs.com.qa ahmed.shehada@qnbfs.com.qa keith.whitney@qnbfs.com.qa sahbi.alkasraoui@qnbfs.com.qa
QNB Financial Services SPC
Contact Center: (+974) 4476 6666
PO Box 24025
Doha, Qatar
DISCLAIMER: This publication has been prepared by QNB Financial Services SPC (“QNBFS”) a wholly-owned subsidiary of Qatar National Bank (“QNB”). QNBFS is regulated by the Qatar
Financial Markets Authority and the Qatar Exchange; QNB is regulated by the Qatar Central Bank. This publication expresses the views and opinions of QNBFS at a given time only. It is not an
offer, promotion or recommendation to buy or sell securities or other investments, nor is it intended to constitute legal, tax, accounting, or financial advice. We therefore strongly advise potential
investors to seek independent professional advice before making any investment decision. Although the information in this report has been obtained from sources that QNBFS believes to be
reliable, we have not independently verified such information and it may not be accurate or complete. While this publication has been prepared with the utmost degree of care by our analysts,
QNBFS does not make any representations or warranties as to the accuracy and completeness of the information it may contain, and declines any liability in that respect. QNBFS reserves the
right to amend the views and opinions expressed in this publication at any time. It may also express viewpoints or make investment decisions that differ significantly from, or even contradict, the
views and opinions included in this report.
COPYRIGHT: No part of this document may be reproduced without the explicit written permission of QNBFS.
Page 4 of 4
Rebased Performance Daily Index Performance
Source: Bloomberg Source: Bloomberg
Source: Bloomberg (*July 09, 2013) Source: Bloomberg
80.0
90.0
100.0
110.0
120.0
130.0
140.0
150.0
Jan-10 Aug-10 Mar-11 Oct-11 May-12 Dec-12 Jul-13
QE Index S&PPan Arab S&P GCC
0.4%
0.2%
(0.3%)
(0.2%)
(0.3%)
0.5%
0.2%
(0.6%)
(0.3%)
0.0%
0.3%
0.6%
SaudiArabia
Qatar
Kuwait
Bahrain
Oman
AbuDhabi
Dubai
Asset/Currency Performance Close ($) 1D% WTD% YTD% Global Indices Performance Close 1D% WTD% YTD%
Gold/Ounce 1,366.76 (0.3) (0.7) (18.4) DJ Industrial 14,897.55 (0.7) (1.2) 13.7
Silver/Ounce 22.88 (0.6) (1.6) (24.6) S&P 500 1,642.80 (0.6) (0.8) 15.2
Crude Oil (Brent)/Barrel (FM
Future)
109.81 (0.3) (0.5) (1.2) NASDAQ 100 3,599.79 (0.4) (0.1) 19.2
Natural Gas (Henry
Hub)/MMBtu
3.51 0.7 4.7 2.3 STOXX 600 300.61 (0.5) (1.9) 7.5
LPG Propane (Arab Gulf)/Ton* 810.00 0.0 0.0 (16.4) DAX 8,285.41 (0.2) (1.3) 8.8
LPG Butane (Arab Gulf)/Ton* 807.00 0.0 0.0 (16.7) FTSE 100 6,390.84 (1.0) (1.7) 8.4
Euro 1.34 (0.5) 0.2 1.2 CAC 40 4,015.09 (0.3) (2.6) 10.3
Yen 97.68 0.4 0.2 12.6 Nikkei 13,424.33 0.2 (1.7) 29.1
GBP 1.57 (0.0) 0.2 (3.6) MSCI EM 924.19 (0.9) (3.5) (12.4)
CHF 1.08 (0.5) 0.5 (0.8) SHANGHAI SE Composite 2,072.96 0.0 0.2 (8.6)
AUD 0.90 (1.1) (2.4) (13.7) HANG SENG 21,817.73 (0.7) (3.1) (3.7)
USD Index 81.21 0.4 (0.1) 1.8 BSE SENSEX 17,905.91 (1.9) (3.7) (7.8)
RUB 33.11 0.5 0.6 8.5 Bovespa 50,405.20 (0.2) (2.2) (17.3)
BRL 0.41 (2.4) (2.6) (16.4) RTS 1,312.47 (0.4) (0.8) (14.0)
144.6
128.3
115.9