QNBFS Daily Market Report September 08, 2019
•
0 likes•132 views

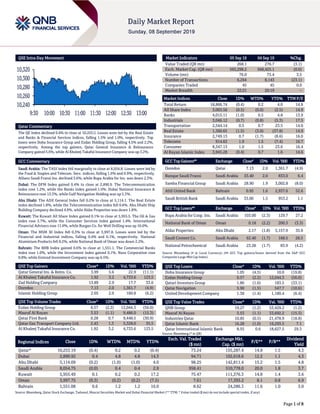
The QE Index declined 0.4% to close at 10,253.2. Losses were led by the Real Estate and Banks & Financial Services indices, falling 1.5% and 1.0%, respectively.

Recommended
Recommended
More Related Content
What's hot
What's hot (20)
Similar to QNBFS Daily Market Report September 08, 2019
Similar to QNBFS Daily Market Report September 08, 2019 (20)
More from QNB Group
More from QNB Group (20)
Recently uploaded
Recently uploaded (20)
QNBFS Daily Market Report September 08, 2019
- 1. Page 1 of 8 QSE Intra-Day Movement Qatar Commentary The QE Index declined 0.4% to close at 10,253.2. Losses were led by the Real Estate and Banks & Financial Services indices, falling 1.5% and 1.0%, respectively. Top losers were Doha Insurance Group and Ezdan Holding Group, falling 4.5% and 2.2%, respectively. Among the top gainers, Qatar General Insurance & Reinsurance Company gained 5.6%, while Al Khaleej Takaful Insurance Company was up 3.2%. GCC Commentary Saudi Arabia: The TASI Index fell marginally to close at 8,054.8. Losses were led by the Food & Staples and Telecom. Serv. indices, falling 1.6% and 0.9%, respectively. Allianz Saudi Fransi Ins. declined 3.6%, while Bupa Arabia for Ins. was down 2.3%. Dubai: The DFM Index gained 0.4% to close at 2,890.9. The Telecommunication index rose 1.2%, while the Banks index gained 1.0%. Dubai National Insurance & Reinsurance rose 13.3%, while Gulf Navigation Holding was up 5.3%. Abu Dhabi: The ADX General Index fell 0.2% to close at 5,114.1. The Real Estate index declined 1.8%, while the Telecommunication index fell 0.6%. Abu Dhabi Ship Building Company declined 4.9%, while Aldar Properties was down 1.8%. Kuwait: The Kuwait All Share Index gained 0.1% to close at 5,955.5. The Oil & Gas index rose 3.7%, while the Consumer Services index gained 1.4%. International Financial Advisers rose 11.6%, while Burgan Co. for Well Drilling was up 10.0%. Oman: The MSM 30 Index fell 0.3% to close at 3,997.8. Losses were led by the Financial and Industrial indices, falling 0.4% and 0.1%, respectively. National Aluminium Products fell 8.2%, while National Bank of Oman was down 2.2%. Bahrain: The BHB Index gained 0.6% to close at 1,551.1. The Commercial Banks index rose 1.0%, while the Investment index gained 0.1%. Nass Corporation rose 8.8%, while Esterad Investment Company was up 6.5%. QSE Top Gainers Close* 1D% Vol. ‘000 YTD% Qatar General Ins. & Reins. Co. 3.99 5.6 22.9 (11.1) Al Khaleej Takaful Insurance Co. 1.92 3.2 4,733.6 123.5 Zad Holding Company 13.89 2.9 17.7 33.6 Ooredoo 7.13 2.0 1,361.7 (4.9) Islamic Holding Group 2.05 2.0 160.8 (6.2) QSE Top Volume Trades Close* 1D% Vol. ‘000 YTD% Ezdan Holding Group 0.57 (2.2) 12,044.3 (56.0) Masraf Al Rayan 3.53 (1.1) 9,486.0 (15.3) Qatar First Bank 0.28 0.7 9,448.5 (30.9) Qatar Gas Transport Company Ltd. 2.43 1.3 5,328.0 35.5 Al Khaleej Takaful Insurance Co. 1.92 3.2 4,733.6 123.5 Market Indicators 05 Sep 19 04 Sep 19 %Chg. Value Traded (QR mn) 268.1 276.7 (3.1) Exch. Market Cap. (QR mn) 565,298.2 568,425.1 (0.6) Volume (mn) 76.0 73.4 3.5 Number of Transactions 6,264 8,143 (23.1) Companies Traded 45 45 0.0 Market Breadth 22:21 20:19 – Market Indices Close 1D% WTD% YTD% TTM P/E Total Return 18,866.74 (0.4) 0.2 4.0 14.8 All Share Index 3,003.56 (0.5) (0.0) (2.5) 14.9 Banks 4,015.11 (1.0) 0.5 4.8 13.9 Industrials 3,046.12 (0.7) (0.8) (5.3) 17.5 Transportation 2,544.14 0.5 0.7 23.5 14.0 Real Estate 1,360.65 (1.5) (3.0) (37.8) 14.9 Insurance 2,749.13 0.7 (1.7) (8.6) 16.0 Telecoms 914.62 1.9 1.5 (7.4) 16.7 Consumer 8,347.13 1.0 1.5 23.6 16.4 Al Rayan Islamic Index 3,945.28 (0.4) 0.7 1.6 14.6 GCC Top Gainers## Exchange Close# 1D% Vol. ‘000 YTD% Ooredoo Qatar 7.13 2.0 1,361.7 (4.9) Banque Saudi Fransi Saudi Arabia 33.40 2.0 833.0 6.4 Samba Financial Group Saudi Arabia 28.90 1.9 3,002.8 (8.0) Ahli United Bank Bahrain 0.95 1.6 2,937.6 52.6 Saudi British Bank Saudi Arabia 33.00 1.5 953.2 1.1 GCC Top Losers## Exchange Close# 1D% Vol. ‘000 YTD% Bupa Arabia for Coop. Ins. Saudi Arabia 103.00 (2.3) 129.7 27.2 National Bank of Oman Oman 0.18 (2.2) 200.3 (3.3) Aldar Properties Abu Dhabi 2.17 (1.8) 5,157.9 35.6 Saudi Cement Co. Saudi Arabia 62.40 (1.7) 168.5 28.5 National Petrochemical Saudi Arabia 23.28 (1.7) 83.9 (4.2) Source: Bloomberg (# in Local Currency) (## GCC Top gainers/losers derived from the S&P GCC Composite Large Mid Cap Index) QSE Top Losers Close* 1D% Vol. ‘000 YTD% Doha Insurance Group 1.05 (4.5) 10.0 (19.8) Ezdan Holding Group 0.57 (2.2) 12,044.3 (56.0) Qatari Investors Group 1.86 (1.6) 183.5 (33.1) Qatar Navigation 5.90 (1.5) 547.7 (10.6) United Development Company 1.38 (1.4) 1,180.4 (6.4) QSE Top Value Trades Close* 1D% Val. ‘000 YTD% QNB Group 19.27 (1.2) 53,429.2 (1.2) Masraf Al Rayan 3.53 (1.1) 33,692.2 (15.3) Industries Qatar 10.85 (0.5) 21,478.9 (18.8) Qatar Islamic Bank 16.28 (1.0) 19,293.5 7.1 Qatar International Islamic Bank 8.55 0.6 18,627.5 29.3 Source: Bloomberg (* in QR) Regional Indices Close 1D% WTD% MTD% YTD% Exch. Val. Traded ($ mn) Exchange Mkt. Cap. ($ mn) P/E** P/B** Dividend Yield Qatar* 10,253.19 (0.4) 0.2 0.2 (0.4) 73.24 155,287.4 14.8 1.5 4.3 Dubai 2,890.92 0.4 4.8 4.8 14.3 94.71 102,618.6 12.2 1.1 4.3 Abu Dhabi 5,114.09 (0.2) (1.0) (1.0) 4.0 98.25 142,811.4 15.2 1.5 4.8 Saudi Arabia 8,054.75 (0.0) 0.4 0.4 2.9 958.41 510,778.0 20.0 1.8 3.7 Kuwait 5,955.49 0.1 0.2 0.2 17.2 75.47 111,376.3 14.8 1.4 3.6 Oman 3,997.75 (0.3) (0.2) (0.2) (7.5) 7.61 17,393.2 8.1 0.8 6.9 Bahrain 1,551.08 0.6 1.2 1.2 16.0 8.62 24,286.3 11.6 1.0 5.0 Source: Bloomberg, Qatar Stock Exchange, Tadawul, Muscat Securities Market and Dubai Financial Market (** TTM; * Value traded ($ mn) do not include special trades, if any) 10,240 10,260 10,280 10,300 10,320 9:30 10:00 10:30 11:00 11:30 12:00 12:30 13:00
- 2. Page 2 of 8 Qatar Market Commentary The QE Index declined 0.4% to close at 10,253.2. The Real Estate and Banks & Financial Services indices led the losses. The index fell on the back of selling pressure from GCC and non-Qatari shareholders despite buying support from Qatari shareholders. Doha Insurance Group and Ezdan Holding Group were the top losers, falling 4.5% and 2.2%, respectively. Among the top gainers, Qatar General Insurance & Reinsurance Company gained 5.6%, while Al Khaleej Takaful Insurance Company was up 3.2%. Volume of shares traded on Thursday rose by 3.5% to 76.0mn from 73.4mn on Wednesday. Further, as compared to the 30-day moving average of 68.5mn, volume for the day was 10.9% higher. Ezdan Holding Group and Masraf Al Rayan were the most active stocks, contributing 15.9% and 12.5% to the total volume, respectively. Source: Qatar Stock Exchange (* as a % of traded value) Ratings and Global Economic Data Ratings Updates Company Agency Market Type* Old Rating New Rating Rating Change Outlook Outlook Change Al Ain Ahlia Insurance Co. Moody's Abu Dhabi LTR – A3 – Stable – Source: News reports, Bloomberg (* LTR – Long Term Rating) Global Economic Data Date Market Source Indicator Period Actual Consensus Previous 09/05 US Department of Labor Initial Jobless Claims 31-August 217k 215k 215k 09/05 US Department of Labor Continuing Claims 24-August 1,662k 1,688k 1,698k 09/05 US Markit Markit US Services PMI August 50.7 50.9 50.9 09/05 US Markit Markit US Composite PMI August 50.7 – 50.9 09/05 US Institute for Supply Management ISM Non-Manufacturing Index August 56.4 54.0 53.7 09/06 EU Eurostat GDP SA QoQ 2Q2019 0.2% 0.2% 0.2% 09/06 EU Eurostat GDP SA YoY 2Q2019 1.2% 1.1% 1.1% 09/05 Germany Markit Markit Germany Construction PMI August 46.3 – 49.5 09/06 Germany Deutsche Bundesbank Industrial Production SA MoM July -0.6% 0.4% -1.5% 09/06 Germany Bundesministerium fur Wirtscha Industrial Production WDA YoY July -4.2% -3.9% -5.2% Source: Bloomberg (s.a. = seasonally adjusted; n.s.a. = non-seasonally adjusted; w.d.a. = working day adjusted) News Qatar QE Index, QE Al Rayan Islamic Index and QE All Share Index update constituents effective from October 1 – Ezdan Holding Group and Qatar Aluminium Manufacturing Company will replace Medicare Group and Qatar First Bank in the QE Index, effective from October 1, 2019. Ezdan Holding Group, Qatar Aluminium Manufacturing Company and Qatar Islamic Insurance will join QE Al Rayan Islamic Index. Qatar Aluminium Manufacturing Company will join both QE All Share Index and QE Industrials Index. Further Qatar General Insurance & Reinsurance Company joins both QE All Share Index and QE Insurance Index, all effective from October 1, 2019. (QSE) Methodology change to all QSE indices, effective from October 1 – Qatar Stock Exchange (QSE) hereby informs of a methodology change to all QSE indices effective October 1, 2019, as approved by QSE Index Committee and QFMA. The rule amendment relates to the Index Free Float definition as applied for index components calculation. The Index Free Float definition reads as follows: Index Free Float for a stock is defined as the total outstanding shares less – (i) Shares directly owned by the Government and affiliated entities, (ii) Shares held by founders and board members of the company, and (iii) Shareholdings which are 10% or greater of the total outstanding shares except those held by pension funds in Qatar. (QSE) Angola to sell 39% of State Airline to Qatar Airways – Angola and Qatar will complete negotiations this year, after which the Doha-based airline will manage TAAG operations, despite being a minority shareholder, Luanda-based Novo Jornal newspaper reported. After selling 39% stake to Qatar Airways, Angola will retain 51% and the remaining 10% will be awarded to staff. (Bloomberg) Real Estate trading volume exceeds QR443mn in a week of August 25 to August 29 – The trading volume of registered real estate between August 25 to August 29 at the Ministry of Overall Activity Buy %* Sell %* Net (QR) Qatari Individuals 26.94% 30.92% (10,684,335.25) Qatari Institutions 26.18% 16.59% 25,710,578.15 Qatari 53.12% 47.51% 15,026,242.90 GCC Individuals 2.77% 0.80% 5,280,825.77 GCC Institutions 7.33% 13.23% (15,826,294.74) GCC 10.10% 14.03% (10,545,468.97) Non-Qatari Individuals 6.66% 6.49% 459,109.80 Non-Qatari Institutions 30.13% 31.97% (4,939,883.73) Non-Qatari 36.79% 38.46% (4,480,773.93)
- 3. Page 3 of 8 Justice’s real estate registration department stood at QR443,327,638. The department’s weekly report stated that the trading included empty lands, residential units, multipurpose buildings, multipurpose empty lands, residential buildings, residential complexes, a tower and a commercial building. Most of the trading took place in Al Rayyan, Doha, Al Da’ayen, Umm Salal, Al Wakrah, Al Khor and Al Thakhira. The trading volume of registered real estates between August 18 to August 22 was QR195,208,506. (Gulf-Times.com) Qatari ports register splendid performance in eight months of 2019 – Qatari ports have delivered impressive performance in the first eight months of this year. The ports have handled 892,525 containers during January- August period of 2019, showing that Qatar’s maritime sector is well prepared to meet the demand of Qatar’s growing economy. During the eight- month period, a total of 2,524 ships called at Hamad Port, Doha Port and Ruwais Port, making it a busy season for country’s maritime sector. These ports handled 277,600 tons of general cargo during the eight months, according to Mwani Qatar. The strong performance by the ports in the first eight months signals that Qatar’s maritime sector is expected to the end the current year on a very successful note. Container, livestock, vehicles and other cargo movement is expected to remain very strong in the last four months of this year as the last months are considered very busy because of increase in economic activities in the country. The all-round performance by ports in the first eight months comes after an impressive growth in the port sector in the first half of this year. These ports handled 218,330 tons of building materials in January-June period of this year, compared to 177,000 tons in the same period last year, showing a growth of around 24%. The ports received around 661,331 containers in the first half of 2019, which is around 2.5 percent more than the same period in the same period of last year. (Peninsula Qatar) Qatar trade diverted to major global partners, post-blockade, says Al Kuwari – Qatar has successfully established direct commercial routes with a number of strategic hubs around the world and trade has been diverted to the country’s major trading partners since the blockade, according to HE the Minister of Commerce and Industry, Ali bin Ahmed Al Kuwari. He was delivering a lecture at the Carnegie Mellon University in Qatar (CMU-Q). Al Kuwari highlighted the importance of diversification and self-sufficiency in the economic development of Qatar. In his remarks, the Minister noted, “Qatar’s response to the blockade of June 2017 has resulted in significant, positive changes to the economy. The blockade was a good thing for Qatar. We have achieved so much that we would not have achieved without it. Over the past two years, Qatar’s total exports and foreign trade have witnessed noticeable growth, while food production and local manufacturing have drastically increased. Qatar has successfully adopted many food security initiatives that move the country toward self-sufficiency.” The Minister discussed the initiatives that will foster a favorable business climate within Qatar and encourage international trade. He praised Qatar’s logistics capabilities, noting how well several industries have relied on Hamad International Airport and Hamad Port to manage a sudden spike in the inflow of goods to the country. “Qatar has successfully established direct commercial routes with a number of strategic hubs around the world and, since the blockade, trade has been diverted to our major trading partners,” the Minister noted. (Gulf-Times.com) QFC joins Islamic Financial Services Board as associate member – The Qatar Financial Centre (QFC) has been admitted to the international standard-setting organization, the Islamic Financial Services Board (IFSB), as an associate member. The QFC joins key organizations, stakeholders and market players in the Islamic financial services industry and the financial sector, and its membership reaffirms the QFC’s commitment to developing the Islamic Finance industry. As an Associate Member, the QFC can participate in the IFSB General Assembly, receive technical assistance from the IFSB and participate in Working Groups, Task Force and closed-door discussions for the development of IFSB prudential standards. QFC Authority’s CEO, Yousuf Mohamed Al Jaida said, “Islamic finance is a key focus as well as strength of Qatar and the QFC and we are in constant pursuit of strategies that will elevate the standards in this business sector and expand public awareness of Islamic financing and investment instruments. ISFB membership offers access to resources and industry insight that will move us forward in this aspiration.” (Qatar Tribune) About 70% work at port food security project complete – Qatar’s flagship food sustainability program, the QR1.6bn Hamad Port Food Security Project, is now 70% complete and will be fully operational within a year, a Qatar Chamber official has stated. The mammoth food security project not only seeks to address food sufficiency in the country, but also aims to put Qatar on the map as a strong food exporting hub. “About 70% of the project is done. It will be a huge storage of food and will also include some downstream industries. It is now in the final stage of construction. And it will take a year before it becomes operational. It will be run through a public-private partnership (PPP),” Qatar Chamber’s First Vice Chairman, Mohamed bin Ahmed bin Towar Al Kuwari. Spread over a 530,000 square meter land, the project consists of specialized facilities for the processing, manufacturing, and refining of rice, raw sugar, and edible oils. The products will be available for local, regional, and global use. The amount of production of the factories is stated to be enough for three million people, and the stock allows for two and a half years as a strategic stock in the country, and it can be re-exported abroad. (Peninsula Qatar) Mega sports events to attract thousands of tourists – A strong rush of tourists is expected in coming months as Qatar is all set to host several global sports events. The strong line-up of high- profile sports events will bring tourists from across the globe to Qatar. More than 20 major sports events will be hosted in Qatar in next four month time, making country a must-visit place for every sports enthusiast. One of main highlights of this sport season is FIFA Club World Cup Qatar 2019. The much awaited soccer tournament will not only bring some big names in the world of football to Qatar but will also bring thousands of fans who will come here to cheer their sporting idols. The seven- team club tournament will run from December 11 to 21. The IAAF World Athletics Championships Doha 2019 is another big event where world’s finest athletes will be competing for glory. Doha is all set to welcome over 3,500 athletes, coaches and
- 4. Page 4 of 8 officials to the sporting spectacle which will kick-off on September 28, and will run until October 6. (Peninsula Qatar) Qatar-Singapore trade volume expands to over QR26bn in 2018 – The bilateral trade volume between Qatar and Singapore reached at QR26.2bn in 2018, witnessing a YoY growth of 10%. With this remarkable growth in trade volume, Qatar has become Singapore’s third largest trading partner within the GCC countries, according to a senior official of Singapore Business Council Qatar (SBCQ) at a network event. The business and professional networking event organized by the council was well attended by professionals and dignitaries from different sectors. Over 100 Singaporean professionals working in Qatar and other members of the local business community with a close connection to Singapore and attended the third networking event organized by Singapore Business Council Qatar (SBCQ), which was registered with Qatar Financial Centre last year. (Peninsula Qatar) International US hiring cools; wages, hours offer silver lining – The US job growth slowed more than expected in August, with retail hiring declining for a seventh straight month, but strong wage gains should support consumer spending and keep the economy expanding moderately amid rising threats from trade tensions. The Labor Department’s closely watched monthly employment report also showed a rebound in the workweek after it shrunk to its shortest in nearly two years in July, suggesting that companies were not yet laying off workers. The slowdown in hiring last month was across all sectors, with the exception of government, which was boosted by recruitment for the 2020 decennial census. Private payrolls rose by only 96,000 jobs in August. Leading the slowdown was manufacturing, where employment rose by a tepid 3,000 jobs last month after increasing 4,000 in July. Manufacturing has ironically borne the brunt of the Trump administration’s trade war, which the White House has argued is intended to boost the sector. Average hourly earnings gained 0.4% last month, the largest increase since February, after rising 0.3% in July. The annual increase in wages dipped to 3.2% from 3.3% in July as last year’s surge dropped out of the calculation. Wage growth has held at or above 3.0% for 13 straight month, helping to drive consumer spending and the economy. The average workweek rose to 34.4 hours in August from 34.3 hours in July. A measure of hours worked, which is a proxy for gross domestic product, increased 0.4% after falling 0.2% in July. (Reuters) ADP: US private sector adds 195,000 jobs in August – The US private employers added 195,000 jobs in August, above economists’ expectations, a report by a payrolls processor showed. Economists surveyed by Reuters had forecasted the ADP National Employment Report would show a gain of 149,000 jobs, with estimates ranging from 110,000 to 175,000. Private payroll gains in July were revised down to 142,000 from an originally reported 156,000 increase. The report is jointly developed with Moody’s Analytics. The ADP figures come ahead of the US Labor Department’s more comprehensive non- farm payrolls report on Friday, which includes both public and private-sector employment. Economists polled by Reuters are looking for US private payroll employment to have grown by 150,000 jobs in August, up from 148,000 the month before. Total non-farm employment is expected to have changed by 158,000. The unemployment rate is forecast to stay steady at the 3.7% recorded a month earlier. (Reuters) QNB Group: US leading indicators are ‘flashing warning’ signs – Leading indicators are presenting a much less rosy picture and to some extent even flashing warning signs about the US economy moving forward, QNB Group has stated in an economic commentary. The US economic growth has been robust in recent quarters; supporting global demand through a period of weakness associated with a manufacturing slump and increased uncertainty, QNB Group stated. Indeed, it is not a daunting task to find macroeconomic and financial indicators supporting a US bullish story. Equity prices are close to all time highs, GDP is still growing above potential and different measures of unemployment are hovering around multi-decade lows. However, one should take a more nuanced approach when looking into the data, as certain indicators lag or coincide with the economic cycle while some others lead the cycle, it said. In the case of the US, positive macroeconomic data is mostly coming from lagging or coincident indicators, presenting a picture of the recent past or immediate present rather than telling us about the future. (Gulf-Times.com) Halifax: UK house prices increase at fastest rate in four months – British house prices increased in August at the fastest annual pace in four months, mortgage lender Halifax stated. House prices rose 1.8% YoY after a 1.5% rise in July, Halifax stated, citing figures based on new methodology introduced as of this month. Halifax’s new measure of annual house price growth no longer uses an average for the previous three months. On the month, house prices rose 0.3%, after a 0.4% rise in July. (Reuters) BoE: UK public expectations for inflation in coming year hit almost six-year high – The British public’s expectations for inflation in the coming 12 months hit an almost six-year high in August, but fell sharply for the longer-term, a Bank of England (BoE) survey showed. Gauges of public inflation expectations have risen sharply of late, reflecting the fall in the value of the pound as the Brexit crisis escalates which raises the price of imported goods. Inflation expectations for the year ahead stood at 3.3% in August, up from 3.1% in May and marking the highest level since November 2013, according to the survey from the BoE and market research firm TNS. However, for inflation in five years’ time, expectations fell to 3.1% from 3.8% in May, their lowest level since November 2016 and the biggest drop between surveys since records started in 2009, the BoE/TNS survey showed. The proportion of Britons who see interest rates rising in the next 12 months fell to 43% from 49% in May, the BoE stated. (Reuters) Eurozone's slowing growth confirmed, hit by weak trade – Eurozone’s growth halved in the second quarter of this year as Germany’s economy shrank and trade slowed, European Union’s data showed, confirming earlier estimates. The EU statistics agency Eurostat stated the Eurozone’s gross domestic product expanded by 0.2% in the second quarter, after a 0.4% expansion in the first three months of the year. The data matched Eurostat’s earlier estimates and market expectations, confirming a gloomy outlook for the 19-nation currency bloc which is facing twin threats and uncertainty over Brexit and
- 5. Page 5 of 8 global trade wars. Trade as a whole slowed during the quarter, as imports grew less than in the first quarter and exports were flat after a 0.9% growth in the previous quarter. Overall, trade contributed a negative 0.1 percentage point to the GDP figure. (Reuters) German industrial output drop fuels recession risk – German industrial output unexpectedly fell in July, adding to signs that struggling manufacturers could tip Europe’s biggest economy into a recession in the third quarter and supporting the case for the European Central Bank to take action next week. Industrial output fell by 0.6% on the month, figures released by the Statistics Office showed, and bucking expectations for a rise of 0.3%. The drop was driven by a decline in the production of capital goods. Economists generally define a technical recession as at least two consecutive quarters of contraction. June’s output reading was revised to a fall of 1.1% from a previously reported 1.5% fall. (Reuters) Greek PM outlines tax cuts in 2020, promises to stick to reforms – Greece’s Prime Minister, Kyriakos Mitsotakis outlined tax cuts that will benefit businesses and austerity-hit Greeks next year and promised to continue reforms which he said would help the country gain credibility after a huge debt crisis. Kyriakos Mitsotakis said corporate tax would be cut to 24% in 2020 from 28% currently and taxation on dividends would be halved to 5%. The tax-free threshold on incomes would be maintained, he said, promising to lower the tax rate to 9% from 22% on incomes up to 10,000 Euros annually. (Reuters) Reuters poll: Japan second-quarter GDP seen revised down as external risks hit capex – Japan’s GDP likely grew at a slower rate than initially estimated in further signs the Sino-US trade war is hurting manufacturing investment in the world’s third largest economy. A Reuters poll of 18 analysts predict Japan’s GDP grew at an annualized 1.3% in April-June, slower than the preliminary reading of 1.8%, reflecting slowdown in capital expenditure. The revised data, due to be issued by the Cabinet Office, would translate into 0.3% growth QoQ, versus the initial reading of a 0.4% expansion. Revised capital expenditure growth is expected to be trimmed to 0.7% QoQ from 1.5% initially. Separate Cabinet Office data published on September 12, is likely to show core machinery orders tumbled 9.9% MoM in July, reversing from a 13.9% gain in the previous month. Compared with a year earlier, core orders, a highly volatile data series regarded as a leading indicator of capital spending, likely fell 4.5% YoY in July, after a 12.5% gain in June. (Reuters) Japan real wages drop for 7th straight month in July – Real wages in Japan adjusted for inflation fell for a seventh month in July, adding to worries whether consumer spending can be sustained while the economy wrestles with slower global growth. Real wages slumped 0.9% in July from a year earlier, labor ministry data showed, after a 0.5% annual decline in June. Monthly wage data showed nominal total cash earnings dropped 0.3% in July, falling again after rising for the first time since last December the previous month. Regular pay, which accounts for the bulk of monthly wages, gained 0.6% to rise for the first time since December. One-off special payments shed 2.2% in July from a year earlier, after a 1.1% gain in June. (Reuters) China's August foreign exchange reserves rise to $3.1072tn – China’s foreign exchange reserves rose unexpectedly in August, even as the Yuan posted its biggest monthly drop in 25 years amid escalating trade tensions with the US. The country’s foreign exchange reserves - the world’s largest - rose by $3.5bn in August to $3.1072tn, central bank data showed. Economists polled by Reuters had expected reserves would fall $4bn from July to $3.100tn, likely due to fluctuations in global exchange rates and the prices of foreign bonds that China holds. The increase in August was due to China maintaining a stable balance of international payments and generally stable economic growth, the foreign exchange regulator said in a statement after the data release. (Reuters) China cuts banks' reserve ratios frees up 900bn Yuan for loans as economy slows – China’s central bank stated it was cutting the amount of cash that banks must hold as reserves for the third time this year, releasing 900bn Yuan in liquidity to shore up the flagging economy. Analysts had expected China to announce more policy easing measures soon as the world’s second-largest economy comes under growing pressure from escalating US tariffs and sluggish domestic demand. The People’s Bank of China (PBOC) stated it would cut the reserve requirement ratio (RRR) by 50 basis points (bps) for all banks, with an additional 100 bps cut for qualified city commercial banks. The RRR for large banks will be lowered to 13.0%. The PBOC has now slashed the ratio seven times since early 2018. The size of the latest move was at the upper end of market expectations, and the amount of funds released will be the largest so far in the current easing cycle. (Reuters) Regional IATA: Middle East airlines’ freight volumes drop 5.5% in July – Middle Eastern airlines’ freight volumes decreased 5.5% in July compared to the year-ago period as air cargo continues to suffer from weak global trade and the intensifying trade dispute between the US and China. According to the International Air Transport Association (IATA), this was the “sharpest drop” in freight demand of any region. Capacity increased by 0.2%. Escalating trade tensions, the slowing in global trade and airline restructuring have impacted the recent performance. IATA data for global air freight markets showed that demand, measured in freight ton kilometers (FTKs), contracted by 3.2% in July, compared to the same period in 2018. This marks the ninth consecutive month of YoY decline in freight volumes. Global trade volumes are 1.4% lower than a year ago and trade volumes between the US and China have fallen by 14% YTD compared to the same period in 2018. The global Purchasing Managers Index (PMI) does not indicate an uptick, it stated. Its tracking of new manufacturing export orders has pointed to falling orders since September 2018. And for the first time since February 2009, all major trading nations reported falling orders, IATA stated. (Gulf-Times.com) Saudi Arabia’s SABIC included in MSCI Emerging Markets Index – The MSCI Emerging Markets Index (MSCI) has announced that the Saudi Stock Exchange (Tadawul) has been added to the Index, covering 31 Saudi companies, including SABIC. MSCI is one of the most important emerging market benchmarks and Tadawul’s addition reflects the strength of the Saudi companies, the Saudi Arabian economy, and the
- 6. Page 6 of 8 governance and transparency standards adopted by Tadawul. It also reflects the success of the actions taken by the Capital Markets Authority (CMA) over the past years in line with Saudi Vision 2030 under the Financial Sector Development Program. The program has been instrumental in elevating Saudi Arabia’s financial market position, allowing it to compete with the most developed global financial markets. SABIC Vice Chairman and CEO, Yousef Al-Benyan said: “We congratulate Tadawul for this outstanding achievement, and SABIC is indeed proud to be the major national company listed in the Index. We are confident that this listing will raise our visibility enabling us to further develop and contribute to the diversification of the Kingdom's national economy and attract more global investors to share our economic success and support our long term strategy.” (Zawya) Saudi Aramco signs MoU with China’s Zhejiang free trade zone – Saudi Aramco signed a memorandum of understanding (MoU) with China’s Zhejiang free trade zone to facilitate its acquisition of 9% stake in Zhejiang integrated refinery and petrochemical complex, Saudi Aramco stated. The MoU was signed during a visit by Governor of the Chinese province of Zhejiang, Yuan Jiajun to Saudi Aramco’s headquarters in the Saudi Arabian city of Dhahran. The MoU also included a long-term crude oil supply agreement and will allow Saudi Aramco to utilize Zhejiang Petrochemical’s large crude oil storage facility to serve its customers in Asia, according to the statement. (Reuters) UAE economy poised to accelerate – Driven by robust government spending for Expo 2020 Dubai-related infrastructure projects coupled with some deregulation in the private sector that supports foreign investment activity, the UAE economy is projected to accelerate this year, economists said. "That said, OPEC production cuts, weaker global growth and volatile oil prices pose downside risks to the outlook," FocusEconomics panelists led by MENA lead economist, Ricard Torne said. They expect the UAE's GDP to increase 2.3% in 2019, which is unchanged from last month's forecast, and 2.9% in 2020. Consumer prices in the UAE, on an annual basis, fell 1.5% in June. This was a stronger drop than May's 1.1% fall. "A weak real estate market and a base effect should limit upward price pressures going forward." Economists project consumer prices to decline 0.9% in 2019, which is down 0.1 percentage points from last month's forecast. The panel expects inflation to return and average 1.4% in 2020. (Zawya) UAE banking sector assets surge to AED2.87tn – The UAE banking sector maintained its position as the largest in the Arab world with the combined assets of all banks growing 6.5% to AED2.87tn in 2018 as the amount of credit extended grew 5% to AED1.66tn, according to the UAE Banks Federation. "As the sector embraces new initiatives and developments, and with increased regulation and compliance requirements, prospects for 2019 and beyond appear promising," UBF stated. In its annual report, the UBF shed light on its significant progress and achievements of the UAE banking sector. While the total UAE bank deposits increased 8% to AED1.76tn last year, deposits of residents grew 7% to AED1.54tn as government deposits rose 16% to AED290bn. Deposits from government-related entities increased 8% to AED207bn, while private sector growth went up by 1% to AED1.01tn, the report stated. In the first seven months of 2019, UAE banks' saving account balances hit a record of circa AED165.8bn during the first seven months of the year, a 9% growth of AED13.8bn against AED152bn by the end of 2018, according to statistics revealed by the UAE Central Bank. The savings accounts for 11.4% of the total deposits held by the UAE banks which amounted to AED1.446tn by the end of July 2019. Savings in UAE Dirham comprised over 60% of the total savings which stood at around AED140.7bn by the end of July against AED25.1bn in foreign currency, according to CBUAE's statistics. The month of May saw the highest growth in savings, AED8.4bn, with first quarter witnessing an increase of AED4bn. The UAE national banks claimed the lion's share of savings - AED149.6bn by the end of July - AED131.27bn of which in Dirham and the rest in foreign currency. Savings held by UAE-based foreign banks reached AED16.3bn since the beginning of the year until July. (Zawya) Reuters poll: Dubai house prices to fall sharply – Dubai house prices will decline sharply this year and next, according to property market experts in a Reuters poll, who said a slowdown in the economy and an oversupply of housing units are big downside risks to their already weak outlook. Dubai - with a diversified trade and tourism economy and one of the seven territories of the UAE- has faced a sharp slowdown in its real estate market for most of this decade, barring a pick up for a brief period more than five years ago. That downward trend is likely to continue in Dubai housing market activity, one of the primary contributors to its gross domestic product. The August 14-September 3 Reuters poll of market analysts at 11 investment firms and research institutions showed house prices in Dubai would fall 10% this year and 5% next. They are forecast to decline 3.3% in 2021. Those views also driven by worries the US-China trade war is hurting global growth, and lines up with similar Reuters polls which showed housing market activity in the US, Britain, Canada and India is struggling. (Reuters) Emirates NBD close to hiring banks for $2bn rights issue – Emirates NBD is close to appointing Citigroup Inc. and Morgan Stanley to manage a rights share offering of as much as $2bn, sources said. Emirates NBD may also involve its investment banking division, Emirates NBD Capital Ltd., in the process and could hire other banks as well, sources said. Banks have not formally been hired for the sale and the situation may change, they said. (Bloomberg) Mubadala expected to invest in Vision Fund 2 in fourth quarter – Abu Dhabi state fund Mubadala Investment Company is expected to invest in Japanese group SoftBank’s Vision Fund 2 in the fourth quarter of 2019, which will focus on technology projects, sources said. In 2017, political and economic allies UAE and Saudi Arabia contributed nearly two-thirds to SoftBank’s technology and innovation focused $100bn Vision Fund 1 through their sovereign wealth funds. Mubadala committed $15bn while Saudi Arabia’s Public Investment Fund (PIF) committed $45bn. The Japanese telecom and investment group announced Vision Fund 2 in July, and has already secured pledges for it totaling about $108bn. Its founder and Chief Executive, Masayoshi Son said last month that the anchor investors from the first fund, Saudi Arabia and Abu Dhabi, were showing “high interest” in taking stakes and negotiations were
- 7. Page 7 of 8 continuing. “Talks have been ongoing, the exact investment will be finalized in the next quarter when a commitment could be made,” a source told Reuters. (Reuters) Kuwait's Enertech seeks Pakistan license for 50mw solar plant – Enertech plans to build a solar power project in Pashin district of southwestern Baluchistan province, according to its application posted on website of National Electric Power Regulatory Authority. The project’s total cost is $49.8mn. Enertech is in talks with UBL, CDC investment UK for the loan. Canadian Power has been assigned as module manufacturer of the solar plant. The project with more than 25-year life expected will be in operation by June 2020. EnerTech is a unit of National Technology Enterprises. (Bloomberg)
- 8. Contacts Saugata Sarkar, CFA, CAIA Shahan Keushgerian Zaid al-Nafoosi, CMT, CFTe Head of Research Senior Research Analyst Senior Research Analyst Tel: (+974) 4476 6534 Tel: (+974) 4476 6509 Tel: (+974) 4476 6535 saugata.sarkar@qnbfs.com.qa shahan.keushgerian@qnbfs.com.qa zaid.alnafoosi@qnbfs.com.qa Mehmet Aksoy, PhD QNB Financial Services Co. W.L.L. Senior Research Analyst Contact Center: (+974) 4476 6666 Tel: (+974) 4476 6589 PO Box 24025 mehmet.aksoy@qnbfs.com.qa Doha, Qatar Disclaimer and Copyright Notice: This publication has been prepared by QNB Financial Services Co. W.L.L. (“QNB FS”) a wholly-owned subsidiary of Qatar National Bank (Q.P.S.C.). QNB FS is regulated by the Qatar Financial Markets Authority and the Qatar Exchange. Qatar National Bank (Q.P.S.C.) is regulated by the Qatar Central Bank. This publication expresses the views and opinions of QNB FS at a given time only. It is not an offer, promotion or recommendation to buy or sell securities or other investments, nor is it intended to constitute legal, tax, accounting, or financial advice. QNB FS accepts no liability whatsoever for any direct or indirect losses arising from use of this report. Any investment decision should depend on the individual circumstances of the investor and be based on specifically engaged investment advice. We therefore strongly advise potential investors to seek independent professional advice before making any investment decision. Although the information in this report has been obtained from sources that QNB FS believes to be reliable, we have not independently verified such information and it may not be accurate or complete. QNB FS does not make any representations or warranties as to the accuracy and completeness of the information it may contain, and declines any liability in that respect. For reports dealing with Technical Analysis, expressed opinions and/or recommendations may be different or contrary to the opinions/recommendations of QNB FS Fundamental Research as a result of depending solely on the historical technical data (price and volume). QNB FS reserves the right to amend the views and opinions expressed in this publication at any time. It may also express viewpoints or make investment decisions that differ significantly from, or even contradict, the views and opinions included in this report. This report may not be reproduced in whole or in part without permission from QNB FS. COPYRIGHT: No part of this document may be reproduced without the explicit written permission of QNB FS. Page 8 of 8 Rebased Performance Daily Index Performance Source: Bloomberg Source: Bloomberg Source: Bloomberg Source: Bloomberg (*$ adjusted returns) 60.0 80.0 100.0 120.0 Aug-15 Aug-16 Aug-17 Aug-18 Aug-19 QSEIndex S&P Pan Arab S&P GCC (0.0%) (0.4%) 0.1% 0.6% (0.3%) (0.2%) 0.4% (1.0%) (0.5%) 0.0% 0.5% 1.0% SaudiArabia Qatar Kuwait Bahrain Oman AbuDhabi Dubai Asset/Currency Performance Close ($) 1D% WTD% YTD% Global Indices Performance Close 1D%* WTD%* YTD%* Gold/Ounce 1,506.71 (0.8) (0.9) 17.5 MSCI World Index 2,178.90 0.2 1.9 15.7 Silver/Ounce 18.18 (2.5) (1.1) 17.3 DJ Industrial 26,797.46 0.3 1.5 14.9 Crude Oil (Brent)/Barrel (FM Future) 61.54 1.0 1.8 14.4 S&P 500 2,978.71 0.1 1.8 18.8 Crude Oil (WTI)/Barrel (FM Future) 56.52 0.4 2.6 24.5 NASDAQ 100 8,103.07 (0.2) 1.8 22.1 Natural Gas (Henry Hub)/MMBtu 2.50 0.4 6.8 (21.6) STOXX 600 387.14 0.3 2.5 10.5 LPG Propane (Arab Gulf)/Ton 43.50 (1.1) 5.5 (31.5) DAX 12,191.73 0.5 2.6 11.4 LPG Butane (Arab Gulf)/Ton 51.00 (0.5) 10.9 (27.1) FTSE 100 7,282.34 (0.1) 2.1 4.4 Euro 1.10 (0.1) 0.4 (3.8) CAC 40 5,603.99 0.1 2.7 14.1 Yen 106.92 (0.0) 0.6 (2.5) Nikkei 21,199.57 0.6 1.9 9.4 GBP 1.23 (0.4) 1.0 (3.7) MSCI EM 1,007.96 0.5 2.4 4.4 CHF 1.01 (0.1) 0.3 (0.6) SHANGHAI SE Composite 2,999.60 0.9 4.5 16.3 AUD 0.68 0.5 1.7 (2.9) HANG SENG 26,690.76 0.7 3.8 3.2 USD Index 98.39 (0.0) (0.5) 2.3 BSE SENSEX 36,981.77 1.3 (1.0) (0.2) RUB 65.74 (0.7) (1.6) (5.7) Bovespa 102,935.40 1.2 3.5 11.5 BRL 0.25 1.3 2.1 (4.4) RTS 1,340.52 0.2 3.6 25.4 98.0 93.8 87.0