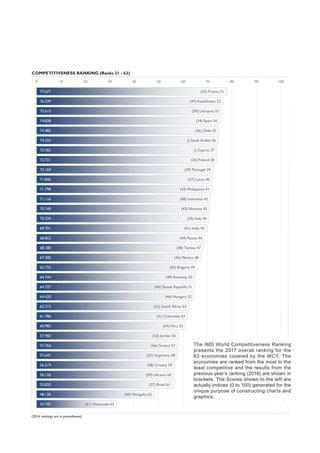
The 2017 IMD World
Competitiveness Ranking
(2016 rankings are in parentheses)
COMPETITIVENESS RANKING (Ranks 1 - 30)
(1) Hong Kong SAR 1
(2) Switzerland 2
(4) Singapore 3
(3) USA 4
(8) Netherlands 5
(7) Ireland 6
(6) Denmark 7
(11) Luxembourg 8
(5) Sweden 9
(15) UAE 10
(9) Norway 11
(10) Canada 12
(12) Germany 13
(14) Taiwan 14
(20) Finland 15
(16) New Zealand 16
(13) Qatar 17
(25) China Mainland 18
(18) United Kingdom 19
(23) Iceland 20
(17) Australia 21
(21) Israel 22
(22) Belgium 23
(19) Malaysia 24
(24) Austria 25
(26) Japan 26
(28) Thailand 27
(27) Czech Republic 28
(29) Korea Rep. 29
(31) Estonia 30
100.000
99.664
99.488
98.656
96.548
95.794
95.558
95.059
94.961
94.084
93.071
92.251
91.585
90.482
88.891
88.668
88.103
87.758
86.776
86.398
85.245
85.096
83.905
83.530
83.326
82.267
80.095
78.958
78.649
77.759
0 10 20 30 40 50 60 70 80 90 100
(2016 rankings are in parentheses)
COMPETITIVENESS RANKING (Ranks 31 - 63)
(32) France 31
(47) Kazakhstan 32
(30) Lithuania 33
(34) Spain 34
(36) Chile 35
() Saudi Arabia 36
() Cyprus 37
(33) Poland 38
(39) Portugal 39
(37) Latvia 40
(42) Philippines 41
(48) Indonesia 42
(43) Slovenia 43
(35) Italy 44
(41) India 45
(44) Russia 46
(38) Turkey 47
(45) Mexico 48
(50) Bulgaria 49
(49) Romania 50
(40) Slovak Republic 51
(46) Hungary 52
(52) South Africa 53
(51) Colombia 54
(54) Peru 55
(53) Jordan 56
(56) Greece 57
(55) Argentina 58
(58) Croatia 59
(59) Ukraine 60
(57) Brazil 61
(60) Mongolia 62
(61) Venezuela 63
77.677
76.339
75.615
74.838
74.482
74.333
73.765
73.721
72.169
71.846
71.798
71.116
70.749
70.539
69.701
68.852
68.180
67.300
65.733
64.744
64.727
64.420
62.315
61.786
60.982
57.960
57.764
57.647
56.519
56.126
55.820
48.136
32.742
0 10 20 30 40 50 60 70 80 90 100
The IMD World Competitiveness Ranking
presents the 2017 overall ranking for the
63 economies covered by the WCY. The
economies are ranked from the most to the
least competitive and the results from the
previous year’s ranking (2016) are shown in
brackets. The Scores shown to the left are
actually indices (0 to 100) generated for the
unique purpose of constructing charts and
graphics.

2017 world competitiveness-ranking

  • 1.
    The 2017 IMDWorld Competitiveness Ranking (2016 rankings are in parentheses) COMPETITIVENESS RANKING (Ranks 1 - 30) (1) Hong Kong SAR 1 (2) Switzerland 2 (4) Singapore 3 (3) USA 4 (8) Netherlands 5 (7) Ireland 6 (6) Denmark 7 (11) Luxembourg 8 (5) Sweden 9 (15) UAE 10 (9) Norway 11 (10) Canada 12 (12) Germany 13 (14) Taiwan 14 (20) Finland 15 (16) New Zealand 16 (13) Qatar 17 (25) China Mainland 18 (18) United Kingdom 19 (23) Iceland 20 (17) Australia 21 (21) Israel 22 (22) Belgium 23 (19) Malaysia 24 (24) Austria 25 (26) Japan 26 (28) Thailand 27 (27) Czech Republic 28 (29) Korea Rep. 29 (31) Estonia 30 100.000 99.664 99.488 98.656 96.548 95.794 95.558 95.059 94.961 94.084 93.071 92.251 91.585 90.482 88.891 88.668 88.103 87.758 86.776 86.398 85.245 85.096 83.905 83.530 83.326 82.267 80.095 78.958 78.649 77.759 0 10 20 30 40 50 60 70 80 90 100
  • 2.
    (2016 rankings arein parentheses) COMPETITIVENESS RANKING (Ranks 31 - 63) (32) France 31 (47) Kazakhstan 32 (30) Lithuania 33 (34) Spain 34 (36) Chile 35 () Saudi Arabia 36 () Cyprus 37 (33) Poland 38 (39) Portugal 39 (37) Latvia 40 (42) Philippines 41 (48) Indonesia 42 (43) Slovenia 43 (35) Italy 44 (41) India 45 (44) Russia 46 (38) Turkey 47 (45) Mexico 48 (50) Bulgaria 49 (49) Romania 50 (40) Slovak Republic 51 (46) Hungary 52 (52) South Africa 53 (51) Colombia 54 (54) Peru 55 (53) Jordan 56 (56) Greece 57 (55) Argentina 58 (58) Croatia 59 (59) Ukraine 60 (57) Brazil 61 (60) Mongolia 62 (61) Venezuela 63 77.677 76.339 75.615 74.838 74.482 74.333 73.765 73.721 72.169 71.846 71.798 71.116 70.749 70.539 69.701 68.852 68.180 67.300 65.733 64.744 64.727 64.420 62.315 61.786 60.982 57.960 57.764 57.647 56.519 56.126 55.820 48.136 32.742 0 10 20 30 40 50 60 70 80 90 100 The IMD World Competitiveness Ranking presents the 2017 overall ranking for the 63 economies covered by the WCY. The economies are ranked from the most to the least competitive and the results from the previous year’s ranking (2016) are shown in brackets. The Scores shown to the left are actually indices (0 to 100) generated for the unique purpose of constructing charts and graphics.