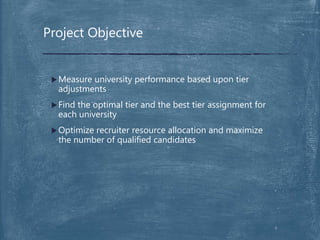
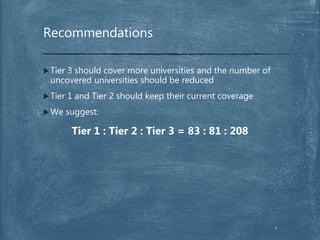
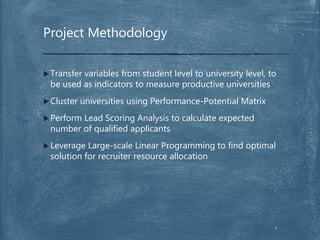
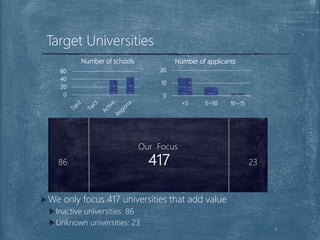
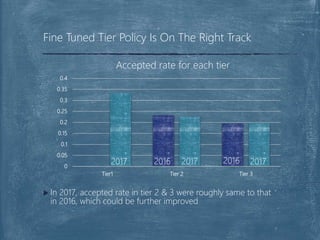
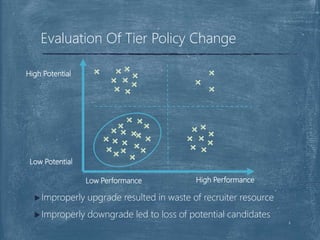
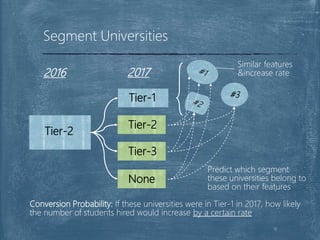
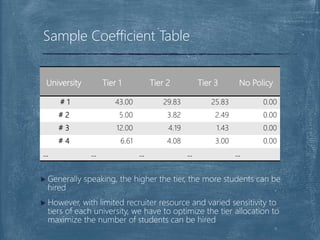
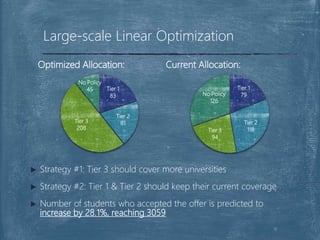
Team members: Yifei Tang
Donglin Jia
Mohan Wang
Wharton People Analytics Conference
Case Competition
Project Objective
Project Methodology
Key Findings
Recommendations
Q&A
Overview
2
Measure university performance based upon tier
adjustments
Find the optimal tier and the best tier assignment for
each university
Optimize recruiter resource allocation and maximize
the number of qualified candidates
Project Objective
3
Tier 3 should cover more universities and the number of
uncovered universities should be reduced
Tier 1 and Tier 2 should keep their current coverage
We suggest:
Tier 1 : Tier 2 : Tier 3 = 83 : 81 : 208
Recommendations
4
Project Methodology
Transfer variables from student level to university level, to
be used as indicators to measure productive universities
Cluster universities using Performance-Potential Matrix
Perform Lead Scoring Analysis to calculate expected
number of qualified applicants
Leverage Large-scale Linear Programming to find optimal
solution for recruiter resource allocation
5
2016 only 2017
only
126 279 12
Our Focus
86 417 23
Target Universities
6
0
20
40
60
Number of schools
0
10
20
<5 5--10 10--15
Number of applicants
We only focus 417 universities that add value
Inactive universities: 86
Unknown universities: 23
7
 In 2017, accepted rate in tier 2 & 3 were roughly same to that
in 2016, which could be further improved
Fine Tuned Tier Policy Is On The Right Track
0
0.05
0.1
0.15
0.2
0.25
0.3
0.35
0.4
Tier1 Tier 2 Tier 3
Accepted rate for each tier
20172016 20162017 2017
Evaluation Of Tier Policy Change
High Performance
High Potential
Low Potential
Low Performance
8
Improperly upgrade resulted in waste of recruiter resource
Improperly downgrade led to loss of potential candidates
Lead Scoring Model
Purpose: how many students can be hired from
each university if it was NOT in its current tier?
Based upon the predicted number of students,
optimize the allocation of recruiters
Example:
University of Husky was in Tier-2 in 2016 and in Tier-1 in 2017.
How many students can be hired from University of Husky if it
was in Tier-2 in 2017? What if in Tier-3?
9
Segment Universities
Tier-2
Tier-2
Tier-3
None
Tier-1
2016 2017
#3
Similar features
&increase rate
Predict which segment
these universities belong to
based on their features
Conversion Probability: If these universities were in Tier-1 in 2017, how likely
the number of students hired would increase by a certain rate
10
Sample Coefficient Table
University Tier 1 Tier 2 Tier 3 No Policy
# 1 43.00 29.83 25.83 0.00
# 2 5.00 3.82 2.49 0.00
# 3 12.00 4.19 1.43 0.00
# 4 6.61 4.08 3.00 0.00
… … … … …
 Generally speaking, the higher the tier, the more students can be
hired
 However, with limited recruiter resource and varied sensitivity to
tiers of each university, we have to optimize the tier allocation to
maximize the number of students can be hired
11
Tier 1
79
Tier 2
118Tier 3
94
No Policy
126
Large-scale Linear Optimization
Tier 1
83
Tier 2
81Tier 3
208
No Policy
45
Optimized Allocation: Current Allocation:
 Strategy #1: Tier 3 should cover more universities
 Strategy #2: Tier 1 & Tier 2 should keep their current coverage
 Number of students who accepted the offer is predicted to
increase by 28.1%, reaching 3059
12
Questions & Discussion
13

2017 Wharton People Analytics Conference Case Competition

  • 1.
    Team members: YifeiTang Donglin Jia Mohan Wang Wharton People Analytics Conference Case Competition
  • 2.
    Project Objective Project Methodology KeyFindings Recommendations Q&A Overview 2
  • 3.
    Measure university performancebased upon tier adjustments Find the optimal tier and the best tier assignment for each university Optimize recruiter resource allocation and maximize the number of qualified candidates Project Objective 3
  • 4.
    Tier 3 shouldcover more universities and the number of uncovered universities should be reduced Tier 1 and Tier 2 should keep their current coverage We suggest: Tier 1 : Tier 2 : Tier 3 = 83 : 81 : 208 Recommendations 4
  • 5.
    Project Methodology Transfer variablesfrom student level to university level, to be used as indicators to measure productive universities Cluster universities using Performance-Potential Matrix Perform Lead Scoring Analysis to calculate expected number of qualified applicants Leverage Large-scale Linear Programming to find optimal solution for recruiter resource allocation 5
  • 6.
    2016 only 2017 only 126279 12 Our Focus 86 417 23 Target Universities 6 0 20 40 60 Number of schools 0 10 20 <5 5--10 10--15 Number of applicants We only focus 417 universities that add value Inactive universities: 86 Unknown universities: 23
  • 7.
    7  In 2017,accepted rate in tier 2 & 3 were roughly same to that in 2016, which could be further improved Fine Tuned Tier Policy Is On The Right Track 0 0.05 0.1 0.15 0.2 0.25 0.3 0.35 0.4 Tier1 Tier 2 Tier 3 Accepted rate for each tier 20172016 20162017 2017
  • 8.
    Evaluation Of TierPolicy Change High Performance High Potential Low Potential Low Performance 8 Improperly upgrade resulted in waste of recruiter resource Improperly downgrade led to loss of potential candidates
  • 9.
    Lead Scoring Model Purpose:how many students can be hired from each university if it was NOT in its current tier? Based upon the predicted number of students, optimize the allocation of recruiters Example: University of Husky was in Tier-2 in 2016 and in Tier-1 in 2017. How many students can be hired from University of Husky if it was in Tier-2 in 2017? What if in Tier-3? 9
  • 10.
    Segment Universities Tier-2 Tier-2 Tier-3 None Tier-1 2016 2017 #3 Similarfeatures &increase rate Predict which segment these universities belong to based on their features Conversion Probability: If these universities were in Tier-1 in 2017, how likely the number of students hired would increase by a certain rate 10
  • 11.
    Sample Coefficient Table UniversityTier 1 Tier 2 Tier 3 No Policy # 1 43.00 29.83 25.83 0.00 # 2 5.00 3.82 2.49 0.00 # 3 12.00 4.19 1.43 0.00 # 4 6.61 4.08 3.00 0.00 … … … … …  Generally speaking, the higher the tier, the more students can be hired  However, with limited recruiter resource and varied sensitivity to tiers of each university, we have to optimize the tier allocation to maximize the number of students can be hired 11
  • 12.
    Tier 1 79 Tier 2 118Tier3 94 No Policy 126 Large-scale Linear Optimization Tier 1 83 Tier 2 81Tier 3 208 No Policy 45 Optimized Allocation: Current Allocation:  Strategy #1: Tier 3 should cover more universities  Strategy #2: Tier 1 & Tier 2 should keep their current coverage  Number of students who accepted the offer is predicted to increase by 28.1%, reaching 3059 12
  • 13.

Editor's Notes

  • #6 Clustering Linear programing Sensitivity—lead score
  • #13 2388 -> 3059