2016-21 State of the Environment Report for Councils in the Greater Central West Region of New South Wales
•
0 likes•178 views

A summary State of the Environment (SoE) Report for 15 local councils across the Central West Region of New South Wales, Australia. The report trends data for the past five years related to over 100 environmental indicators across five themes: Land, Biodiversity, Water and Waterways, People and Communities, and Towards Sustainability. A SoE report was also produced for each of the 15 local councils which related the trends to the council's environmental objectives.

Recommended
Recommended
More Related Content
What's hot
What's hot (20)
Similar to 2016-21 State of the Environment Report for Councils in the Greater Central West Region of New South Wales
Similar to 2016-21 State of the Environment Report for Councils in the Greater Central West Region of New South Wales (20)
Recently uploaded
Recently uploaded (20)
2016-21 State of the Environment Report for Councils in the Greater Central West Region of New South Wales
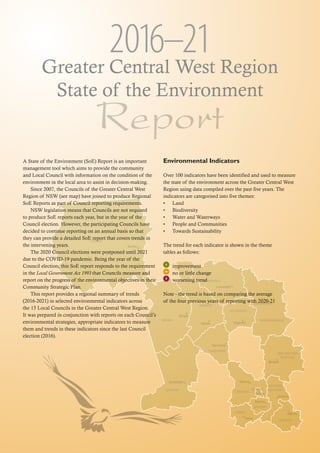
- 1. COWRA BLAYNEY OBERON MID-WESTERN REGIONAL BATHURST REGIONAL ORANGE BOURKE BOGAN COONAMBLE GILGANDRA WARRUMBUNGLE NARROMINE LACHLAN CABONNE WARREN Molong Narromine Nyngan Condobolin Orange Blayney Cowra Oberon Bathurst Mudgee Gilgandra Coonamble Bourke Coonabarabran Warren Greater Central West Region State of the Environment Report 2016–21 A State of the Environment (SoE) Report is an important management tool which aims to provide the community and Local Council with information on the condition of the environment in the local area to assist in decision-making. Since 2007, the Councils of the Greater Central West Region of NSW (see map) have joined to produce Regional SoE Reports as part of Council reporting requirements. NSW legislation means that Councils are not required to produce SoE reports each year, but in the year of the Council election. However, the participating Councils have decided to continue reporting on an annual basis so that they can provide a detailed SoE report that covers trends in the intervening years. The 2020 Council elections were postponed until 2021 due to the COVID-19 pandemic. Being the year of the Council election, this SoE report responds to the requirement in the Local Government Act 1993 that Councils measure and report on the progress of the environmental objectives in their Community Strategic Plan. This report provides a regional summary of trends (2016-2021) in selected environmental indicators across the 15 Local Councils in the Greater Central West Region. It was prepared in conjunction with reports on each Council’s environmental strategies, appropriate indicators to measure them and trends in these indicators since the last Council election (2016). Environmental Indicators Over 100 indicators have been identified and used to measure the state of the environment across the Greater Central West Region using data compiled over the past five years. The indicators are categorised into five themes: • Land • Biodiversity • Water and Waterways • People and Communities • Towards Sustainability The trend for each indicator is shown in the theme tables as follows: improvement no or little change worsening trend Note - the trend is based on comparing the average of the four previous years of reporting with 2020-21
- 2. Water andWaterways Issue Indicator 2016-17 2017-18 2018-19 2019-20 2020-21 Trend Surface & Ground Water Quality Average salinity levels in selected streams (EC) 431 551 547 518 444 E.coli remote from wastewater treatment plants (per 100ml) 201 240 266 244 69 Riparian Riparian vegetation recovery actions (number) 21 22 20 26 26 Riparian vegetation recovery area (ha) 200 220 213 95 59 Industrial/ Agricultural Pollution Load Based LicencingVolume (kg) 261,088 130,691 128,607 158,013 238,108 Exceedances of license discharge consent recorded (number) 17 12 11 6 11 Erosion & Sediment Control complaints received by Council (number) 47 49 82 64 58 Stormwater Pollution Number of gross pollutant traps installed 32 33 32 31 30 Total catchment area of GPTs (ha) 4,181 4,177 4,177 4,177 4,177 Water pollution complaints (number) 19 26 17 23 20 TownWater Quality Number of instances drinking water guidelines not met 98 59 76 61 98 Number of drinking water complaints 244 283 175 260 225 Dam Levels Average dam levels 87.4% 70.8% 48.2% 31.6% 44.4% Water extraction Number ofWater SupplyWork Approvals from surface water sources 2,257 2,512 Volume of surface water permissible for extraction under licences (GL) 870 1M Actual volume extracted through surface water licences (GL) 307,061 Number ofWater SupplyWork Approvals from groundwater resources 19,273 19,468 Volume of groundwater permissible for extraction under licences (GL) 229 259K Actual volume extracted through groundwater licences (GL) 125 60,439 Council water consumption Area of irrigated Council managed parks, sportsgrounds, public open space (ha) 973 913 892 959 984 Water used by council for irrigation (including treated and untreated) (ML) 767 1,135 1,157 970 975 Town water consumption Annual metered supply (ML) 17,987 19,687 17,604 14,032 14,070 Annual consumption (Total fromWTP) (ML) 16,791 17,714 15,249 12,549 11,408 Average annual household mains potable water usage (kL) 201 214 189 168 157 Average level of water restrictions implemented 0.5 1.2 2.6 3.0 1.9 Water conservation programs (number) 6 11 13 17 13 Land Issue Indicator 2016-17 2017-18 2018-19 2019-20 2020-21 Trend Contamination Contaminated land sites - Contaminated Land Register (number) 7 7 8 7 7 Contaminated land sites - potentially contaminated sites (number) 1,275 1,410 1,581 1,572 1,585 Contaminated sites rehabilitated (number) 10 6 6 16 6 Erosion Erosion affected land rehabilitated (ha) 2,266 1,798 248 0 1,002 Land use planning and management Number of development consents and building approvals 2,562 2,673 2,855 2,657 3,637 Landuse conflict complaints (number) 90 80 61 81 72 Loss of primary agricultural land through rezoning (ha) 124 40 41 257 150 Minerals & Petroleum Number of mining and exploration titles 1,408 765 Area covered by mining and exploration titles (ha) 5.3M 5.3M 5.1M 5.9M 6.2M
- 3. Biodiversity Issue Indicator 2016-17 2017-18 2018-19 2019-20 2020-21 Trend ClearHabitat Loss Total area in the National Parks Estate (ha) 753,560 753,560 753,948 755,528 763,421 Total area of State Forests (ha) 239,000 239,000 239,000 239,000 239,000 Total area protected inWildlife Refuges (ha) 304,397 240,617 Area protected in conservation reserves & under voluntary conservation agreements (ha) 12,535 39,425 15,324 34,552 37,890 Extent ofTraveling Stock Reserves in LGA (ha) 309,373 328,653 320,240 Proportion of Council reserves that is bushland/remnant vegetation 38% 35% 34% 35% 35% Habitat areas revegetated (ha) 140 20 9 11 15 Clearing complaints (number) 39 41 41 40 19 Roadside vegetation management plan (number) 12 12 11 12 12 Roadside vegetation rehabilitated (ha) 8 28 5 9 8 Threatened Species StateThreatened species (number) 1,462 1,452 Threatened species actions implemented (e.g. PAS, recovery plans) (number) 7 12 10 13 9 Fish restocking activities: native species (number) 380,705 188,210 184,270 198,322 511,196 Priority weeds and feral animals Fish restocking activities: non-native species (number) 315,568 171,634 257,675 249,500 249,400 Number of declared priority weeds 102 102 103 113 Invasive species (listed priority orWONS) under active management 185 180 166 157 148 People and Communities Issue Indicator 2016-17 2017-18 2018-19 2019-20 2020-21 Trend Active community involvement Environmental volunteers working on public open space (Hours) 5,464 5,671 4,670 4,122 3,351 Number of environmental community engagement programs 37 43 42 48 49 Number of growers’ markets/local food retailers specialising in local food 65 70 68 75 80 Community impacts Number of days that air pollution maximum goals for particulate matter were exceeded 17 169 4 Indigenous Heritage Number of Indigenous sites on AHIMS register 9,783 10,187 10,969 11,322 11,649 Inclusion in DCPs & rural strategies (number) 9 10 11 11 12 Extent of liaison with Indigenous communities (self-assessed from 0 = none to 3 = High) 1.7 2.0 1.4 2.0 1.6 Development approvals on listed Indigenous sites (number) 3 4 3 3 2 Number of Indigenous heritage management actions/responses 6 5 11 17 12 Non-Indigenous Heritage NSW Heritage Items (number) 99 100 106 105 104 Locally listed heritage items (number) 2,195 2,199 2,198 2,156 2,190 Actions to protect non-Indigenous heritage (including management plans) (number) 20 34 46 34 41 Heritage buildings on statutory heritage lists demolished/degraded in past year (number) 1 4 0 7 4 Heritage buildings on statutory heritage lists renovated/improved in past year (number) 88 66 120 190 70
- 4. Towards Sustainability Issue Indicator 2016-17 2017-18 2018-19 2019-20 2020-21 Trend Waste Generation Total waste entombed at primary landfill (tonnes) 90,164 95,560 83,686 83,466 104,183 Total waste entombed at other landfills (exc recyclables) (tonnes) 31,909 30,803 30,754 30,581 35,261 Average total waste generated per person (tonnes) 0.76 0.80 0.72 0.72 0.87 Average cost of waste service per residential household $355 $372 $415 $400 $440 Hazardous/Liquid Waste DrumMuster collections (number of drums) 59,221 84,478 67,742 63,464 70,900 Household HazardousWastes collected (kg) 44,365 31,539 86,068 15,076 98,394 Reduce Organics collected (diverted from landfill) (tonnes) 35,545 28,800 18,807 21,672 30,974 E-Waste collected (diverted from landfill) (tonnes) 69 97 119 113 172 Recycle Volume of material recycled (tonnes) 17,871 22,235 20,776 22,727 19,890 Volume of material recycled per person (kg) 98 123 115 125 109 Littering and illegal dumping Number of illegal waste disposal complaints to Council 301 327 316 289 196 Engineering, Infrastructure and CivilWorks New road construction (km) 15 14 15 60 36 Road upgrades (km) 1,246 1,236 1,143 932 660 Risk Management Flood management plans/ flood mapping - increase in area covered (ha) 2,513 303 100 100 7,229 Hazard reduction burns (number) 13 14 12 4 11 Climate Change Mitigation Office paper used by Council (A4 & A3 reams) 13,955 13,912 12,604 12,530 10,584 Council sustainability initiatives (number) 34 38 42 42 59 Council mitigation initiatives (number) 12 17 20 12 31 Council Greenhouse Gas Emissions Annual electricity consumption for Council controlled facilities (MWh) 33,354 33,611 33,820 32,546 31,979 Annual natural gas consumption for Council controlled facilities (Gj) 33,106 31,373 32,285 33,085 37,268 Annual bottled gas consumption for Council controlled facilities (L) 14,200 13,433 14,773 13,330 12,424 Total fuel consumption (KL) 5,769 6,533 6,748 6,772 6,548 Average proportion of Council’s electrical energy demand met from council-owned renewable energy infrastructure 11.2% 15.1% 19.1% 26.2% 32.3% Council total operational greenhouse gas emissions (tCO2 -e/year) 173,443 160,971 244,330 174,869 148,877 Community Greenhouse Gas Emissions Small scale renewable energy uptake (kW installed) 8,427 14,562 20,245 24,685 33,591 Number of solar water heaters and heat pumps installed 132 135 104 62 59