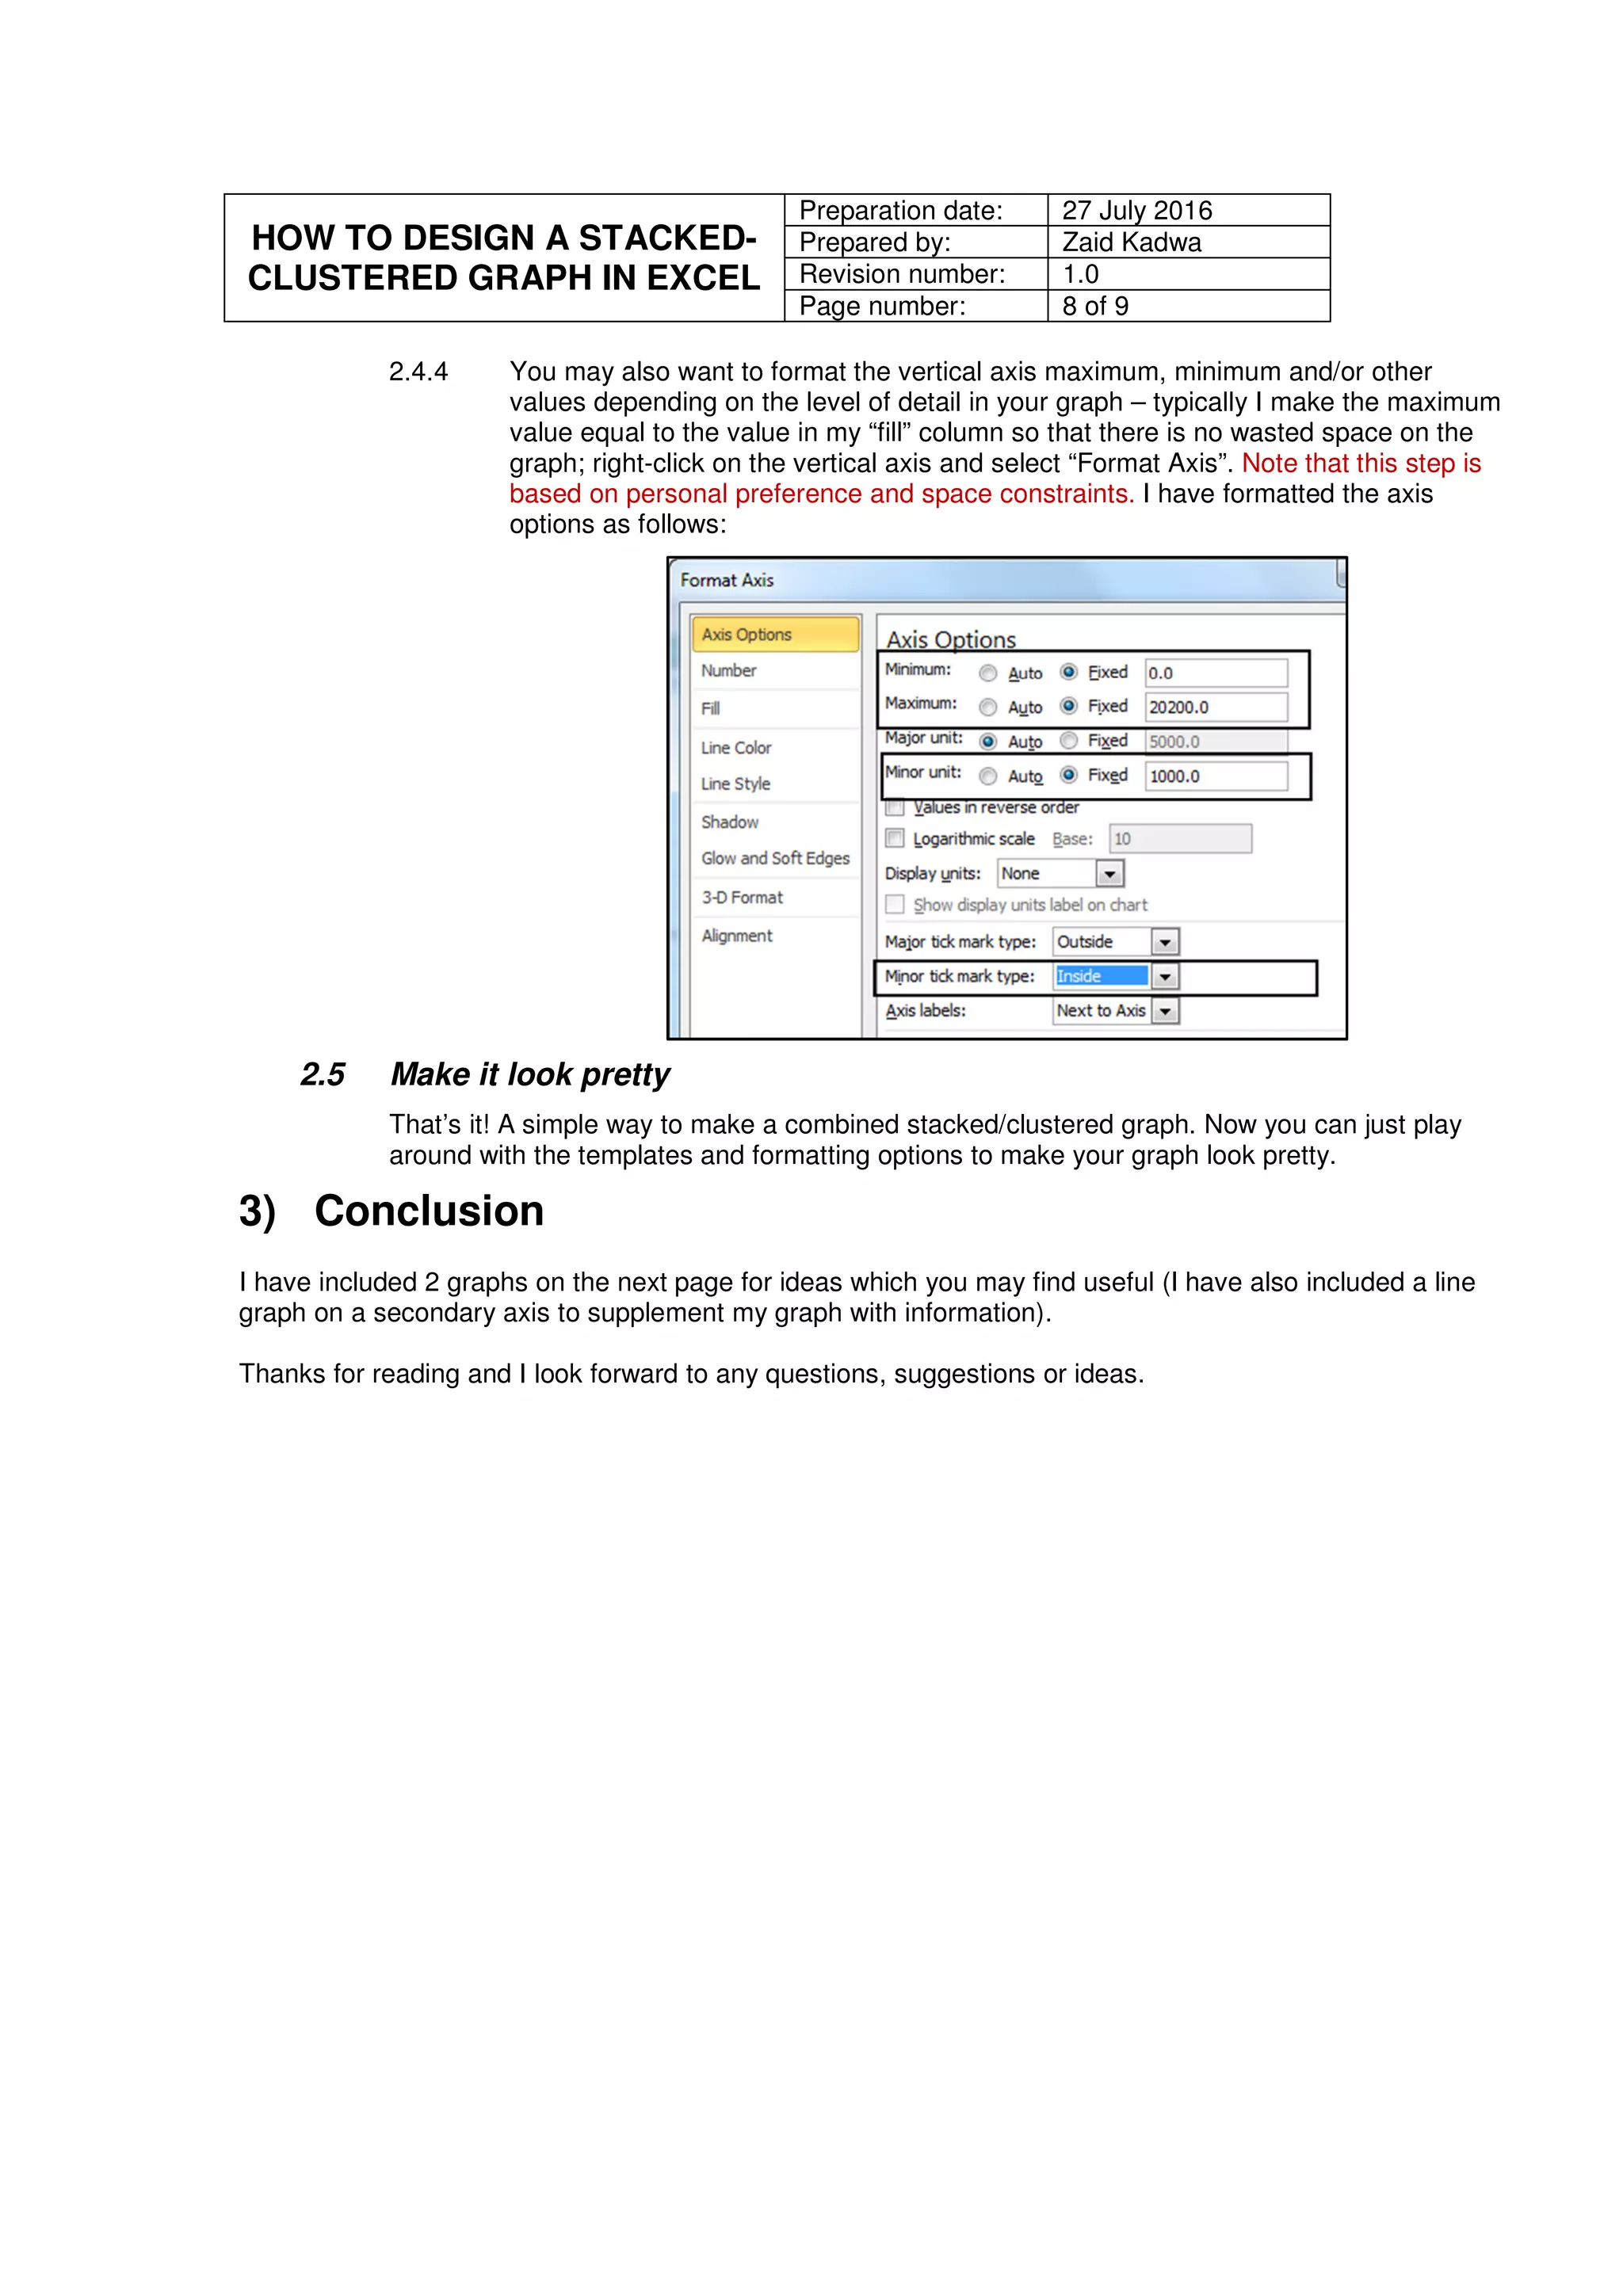
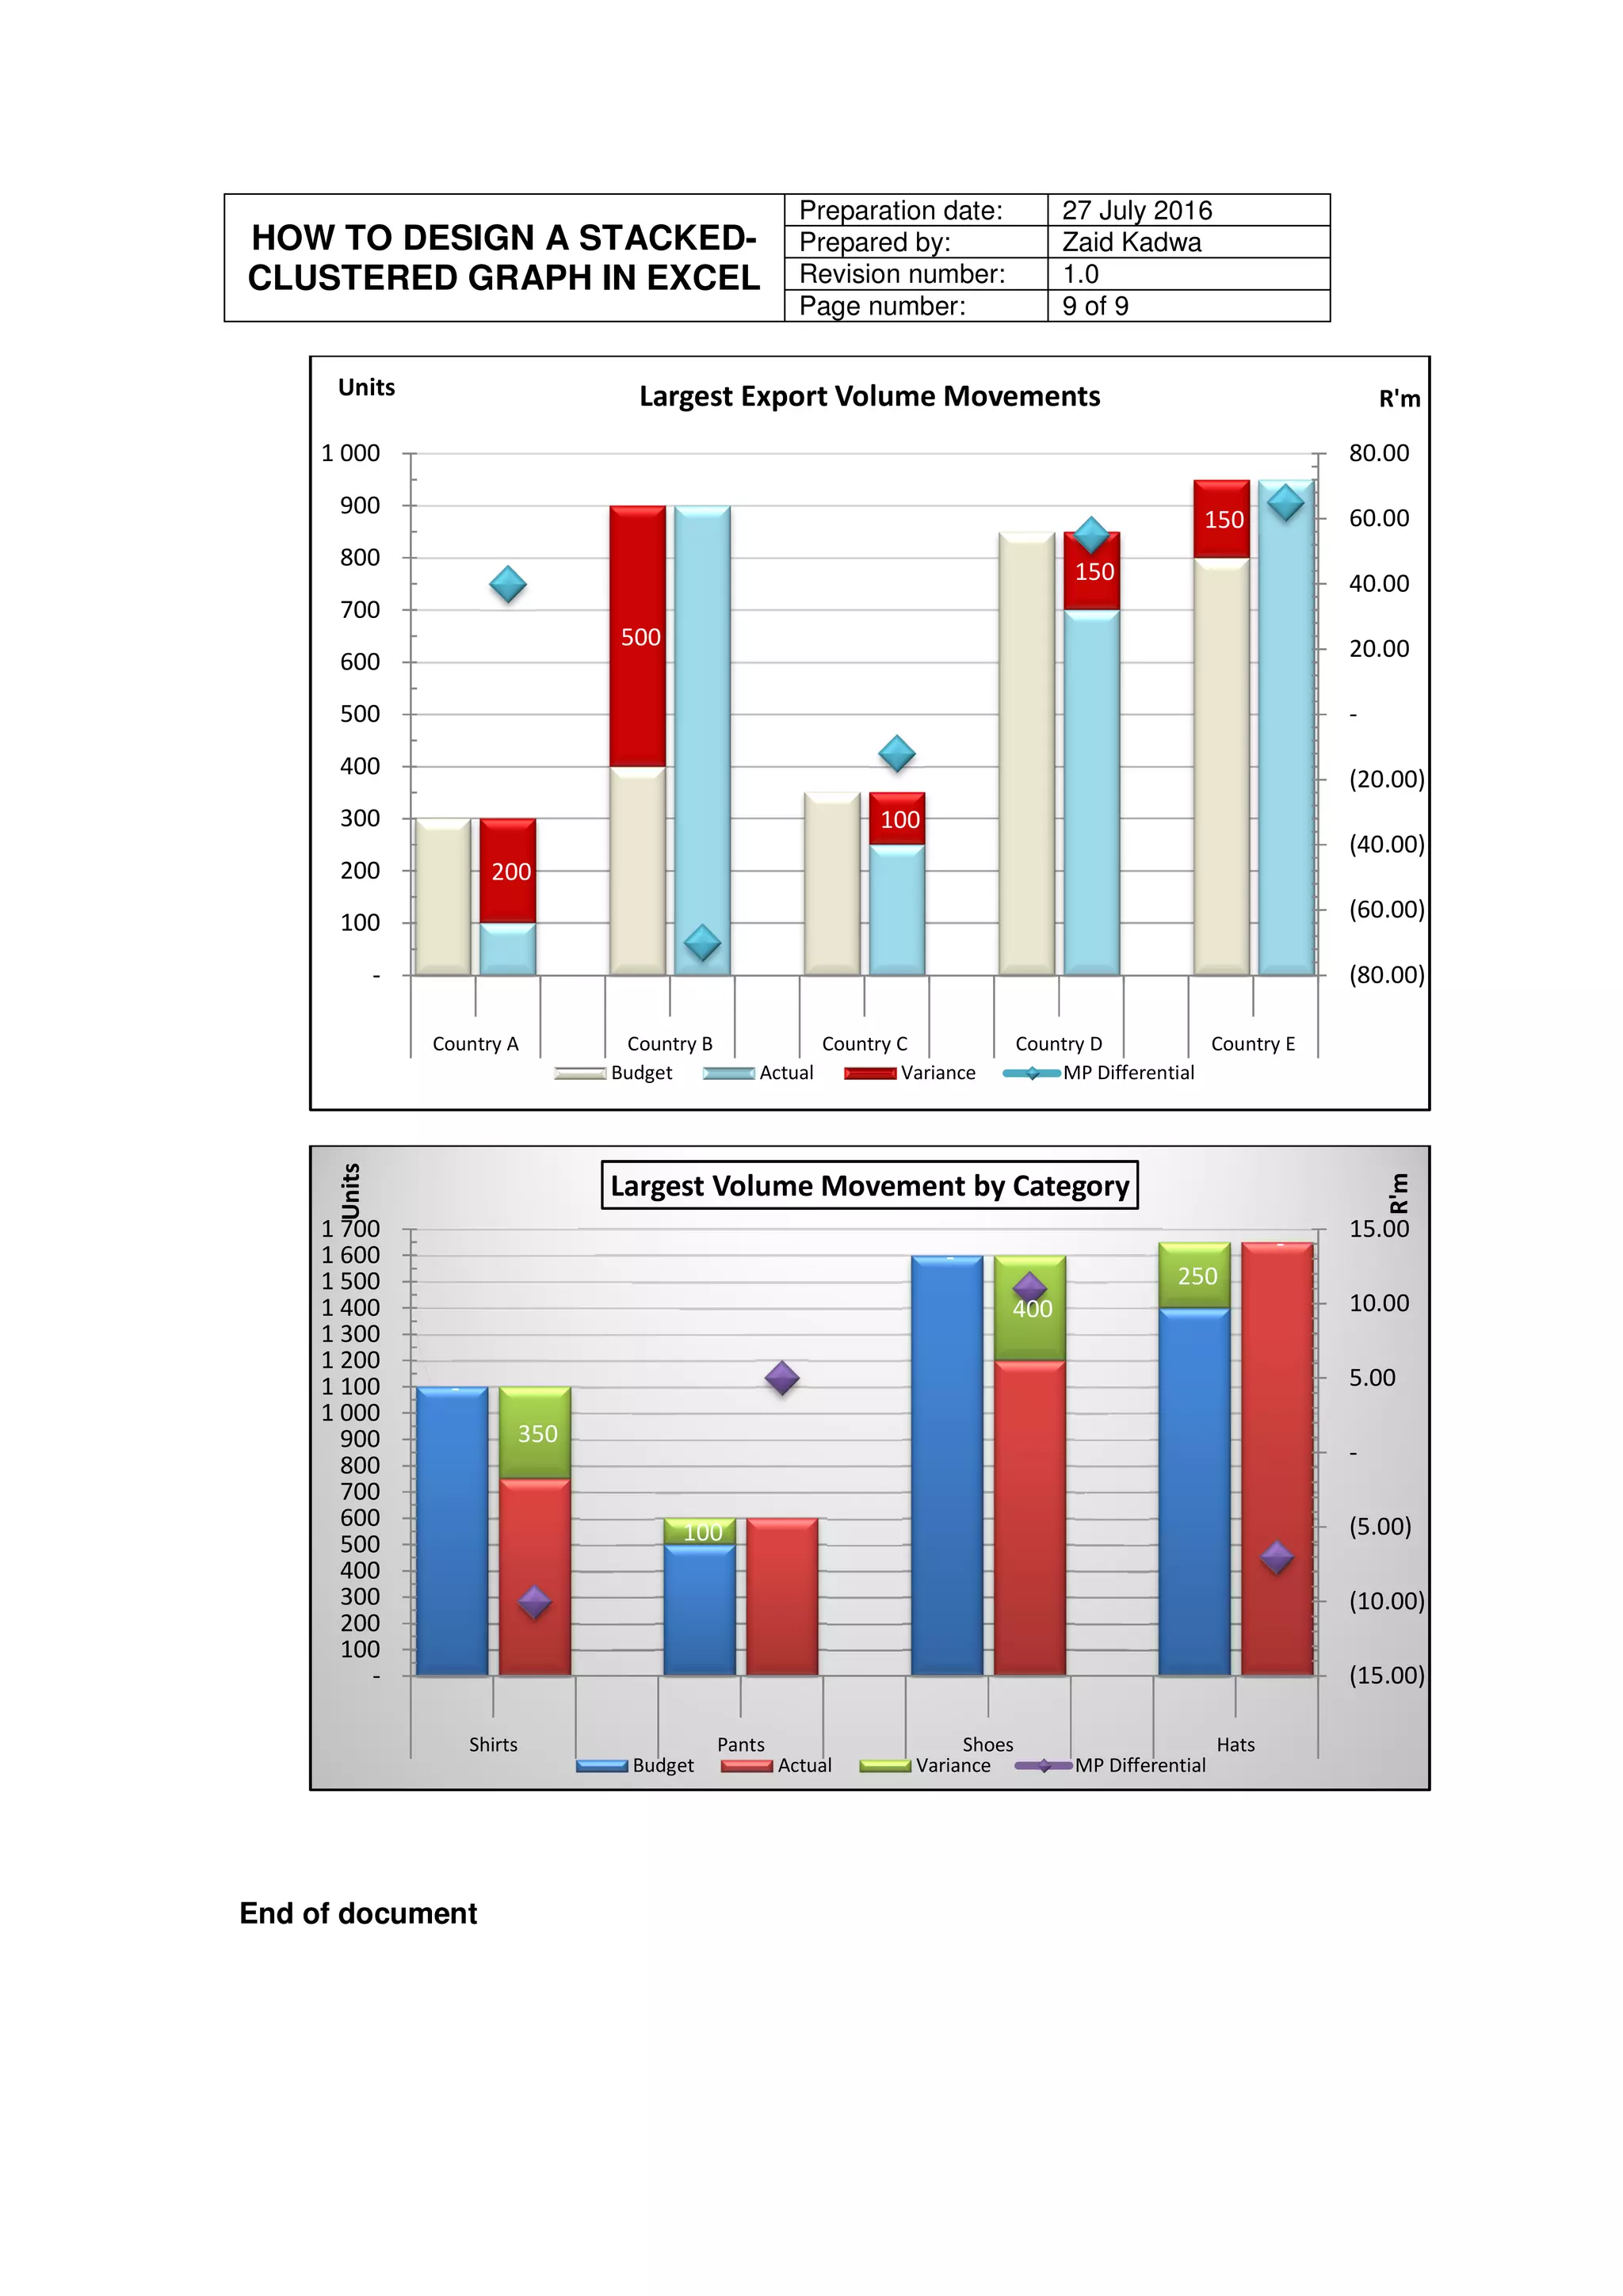
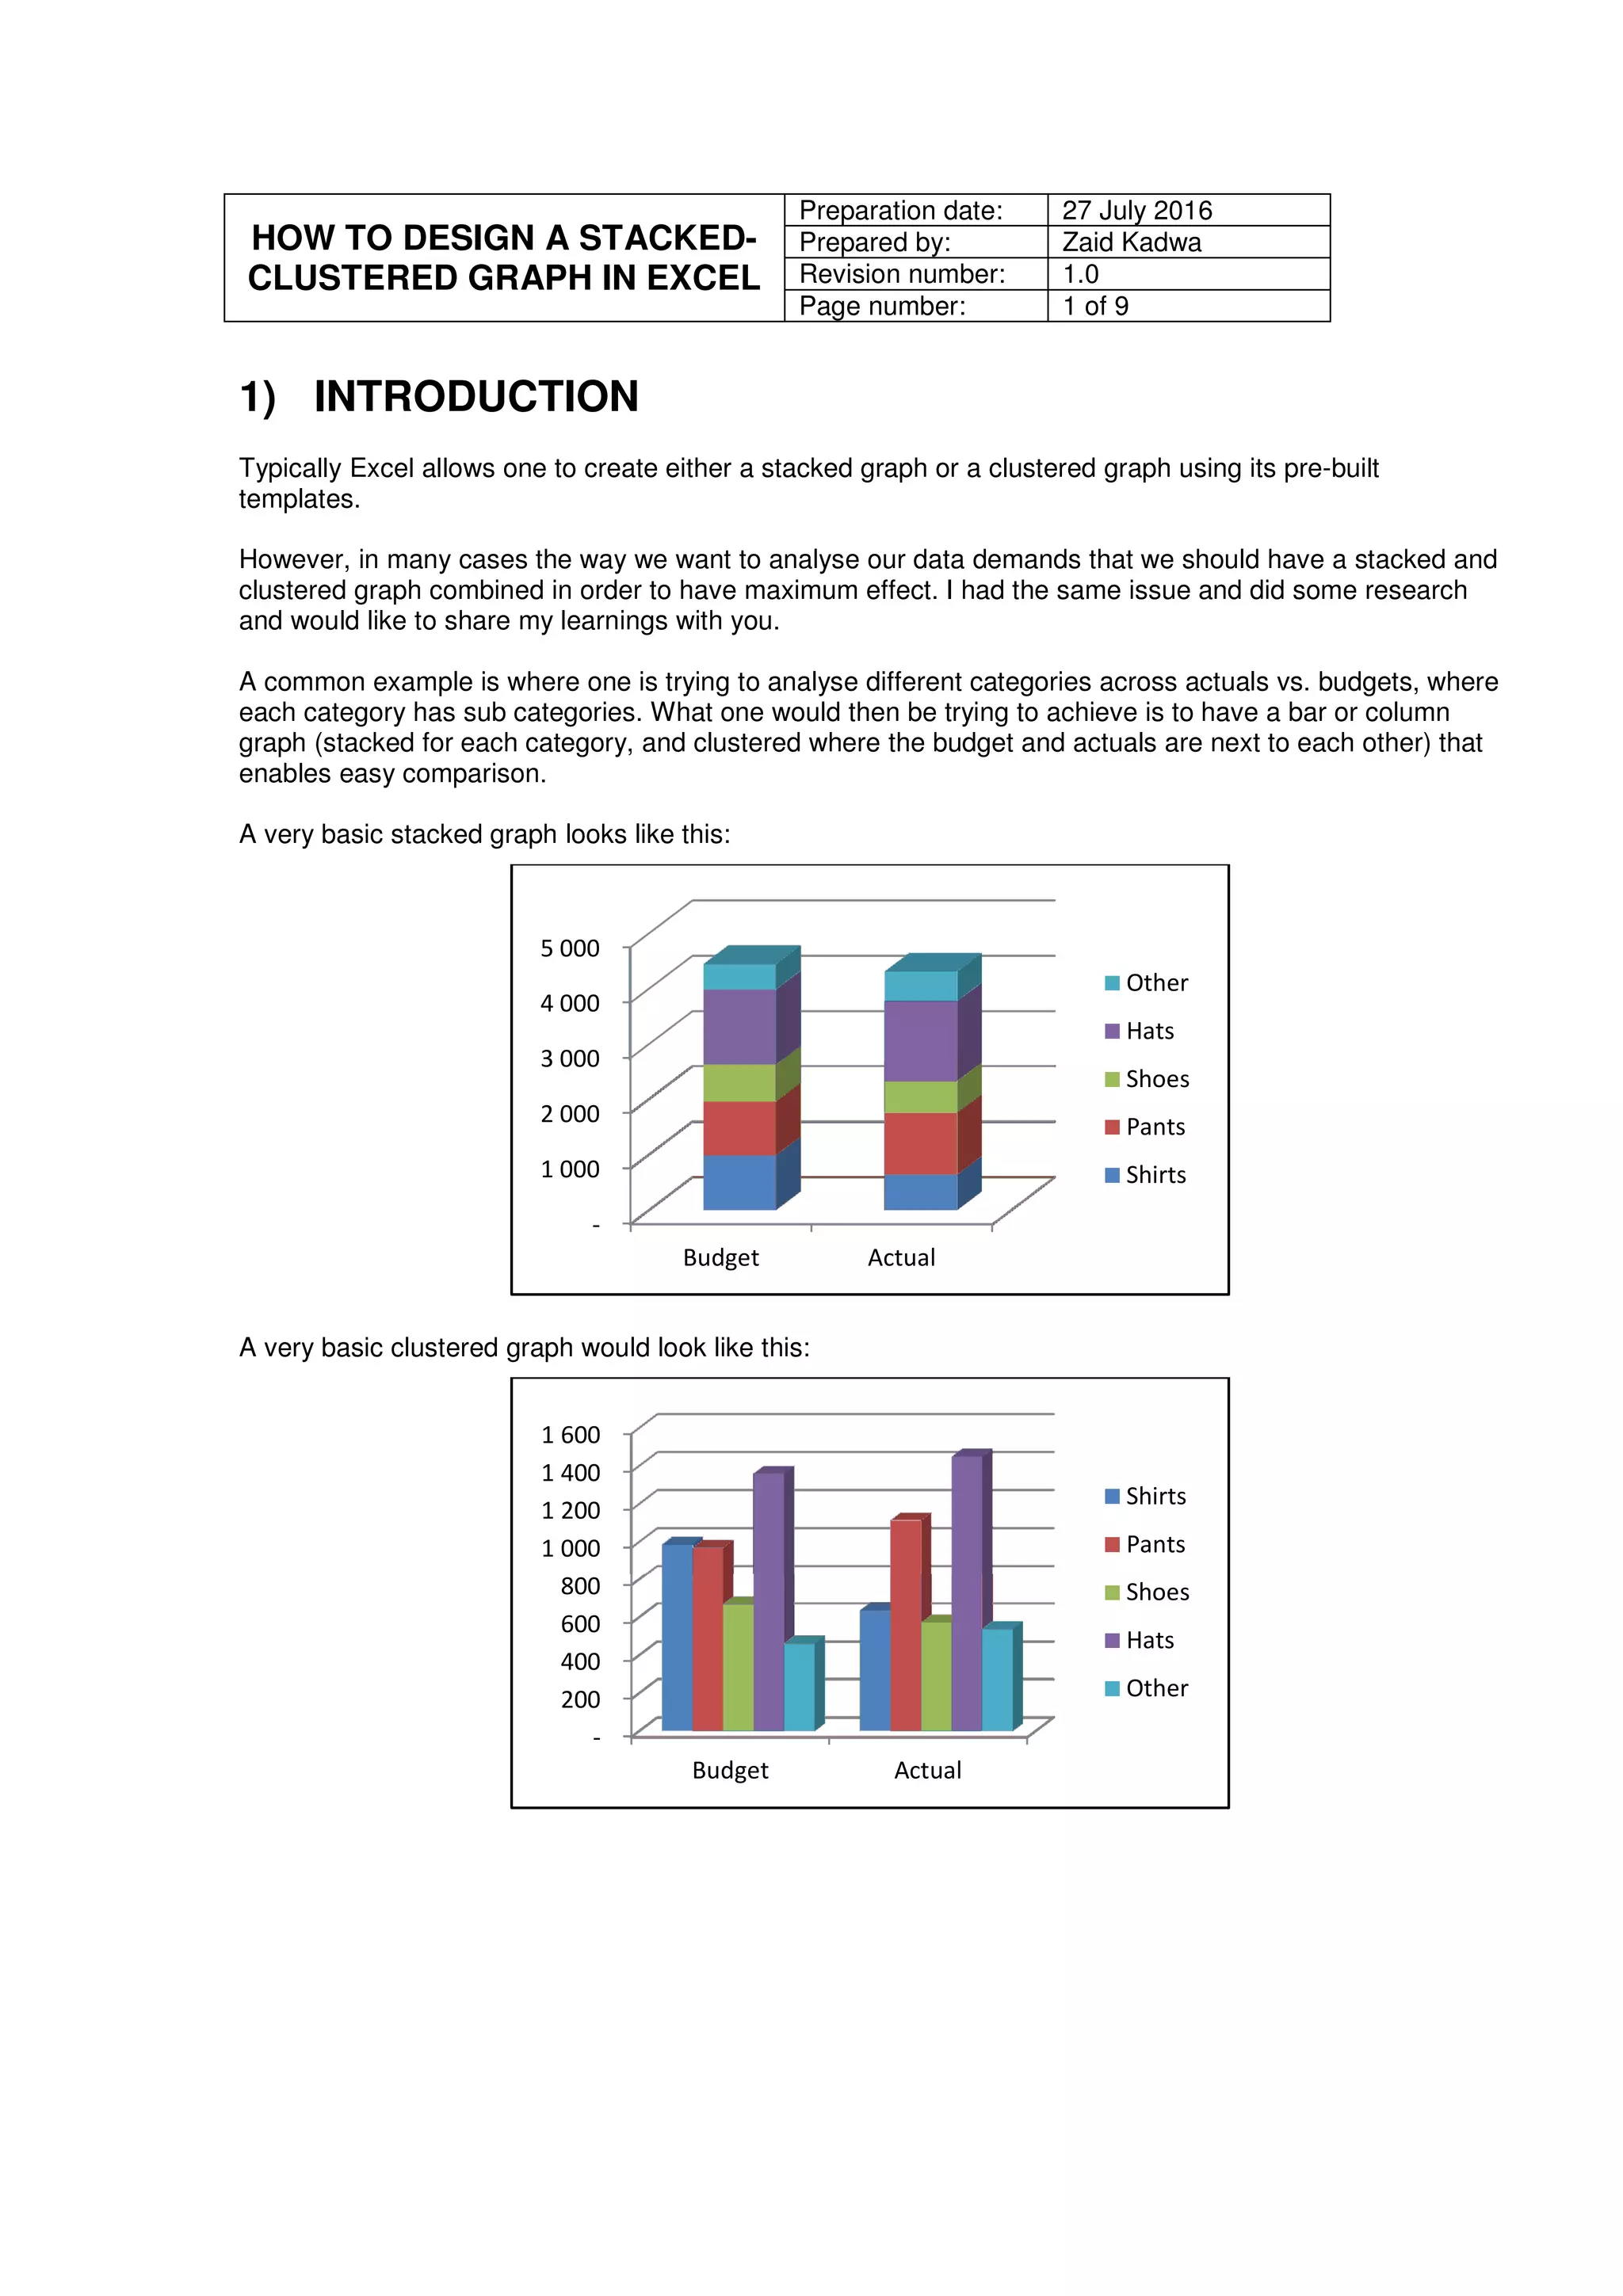
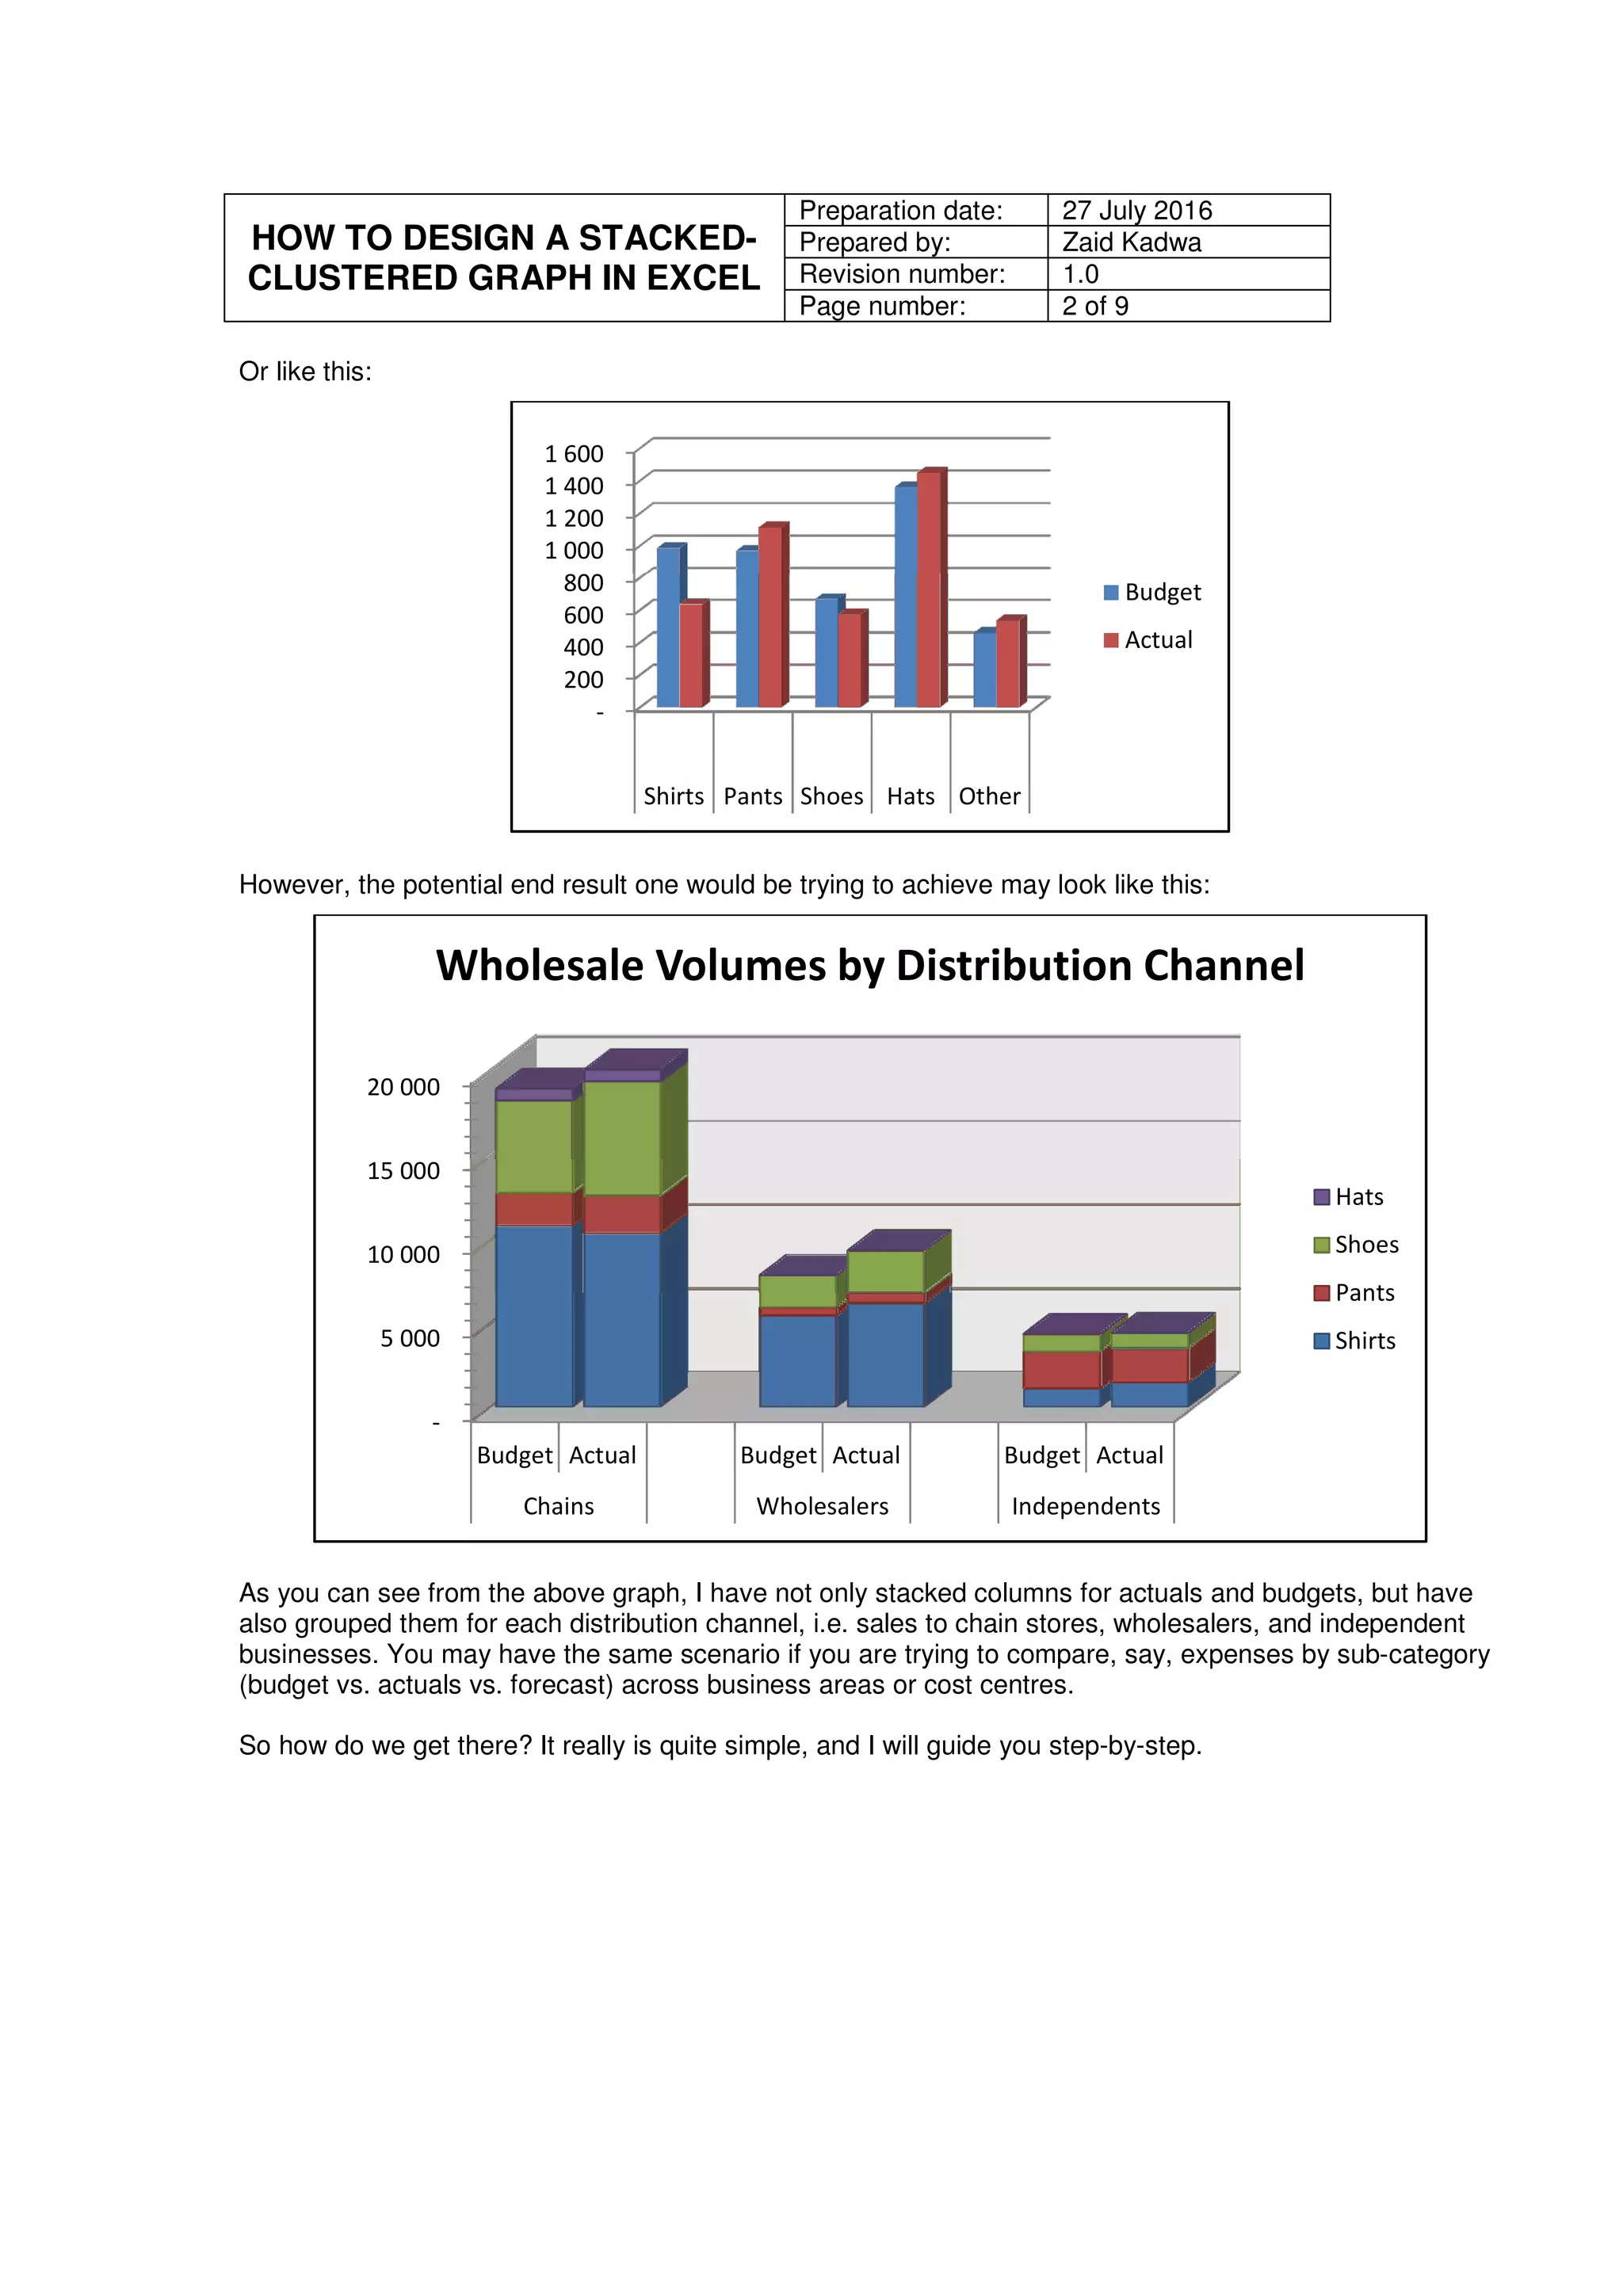
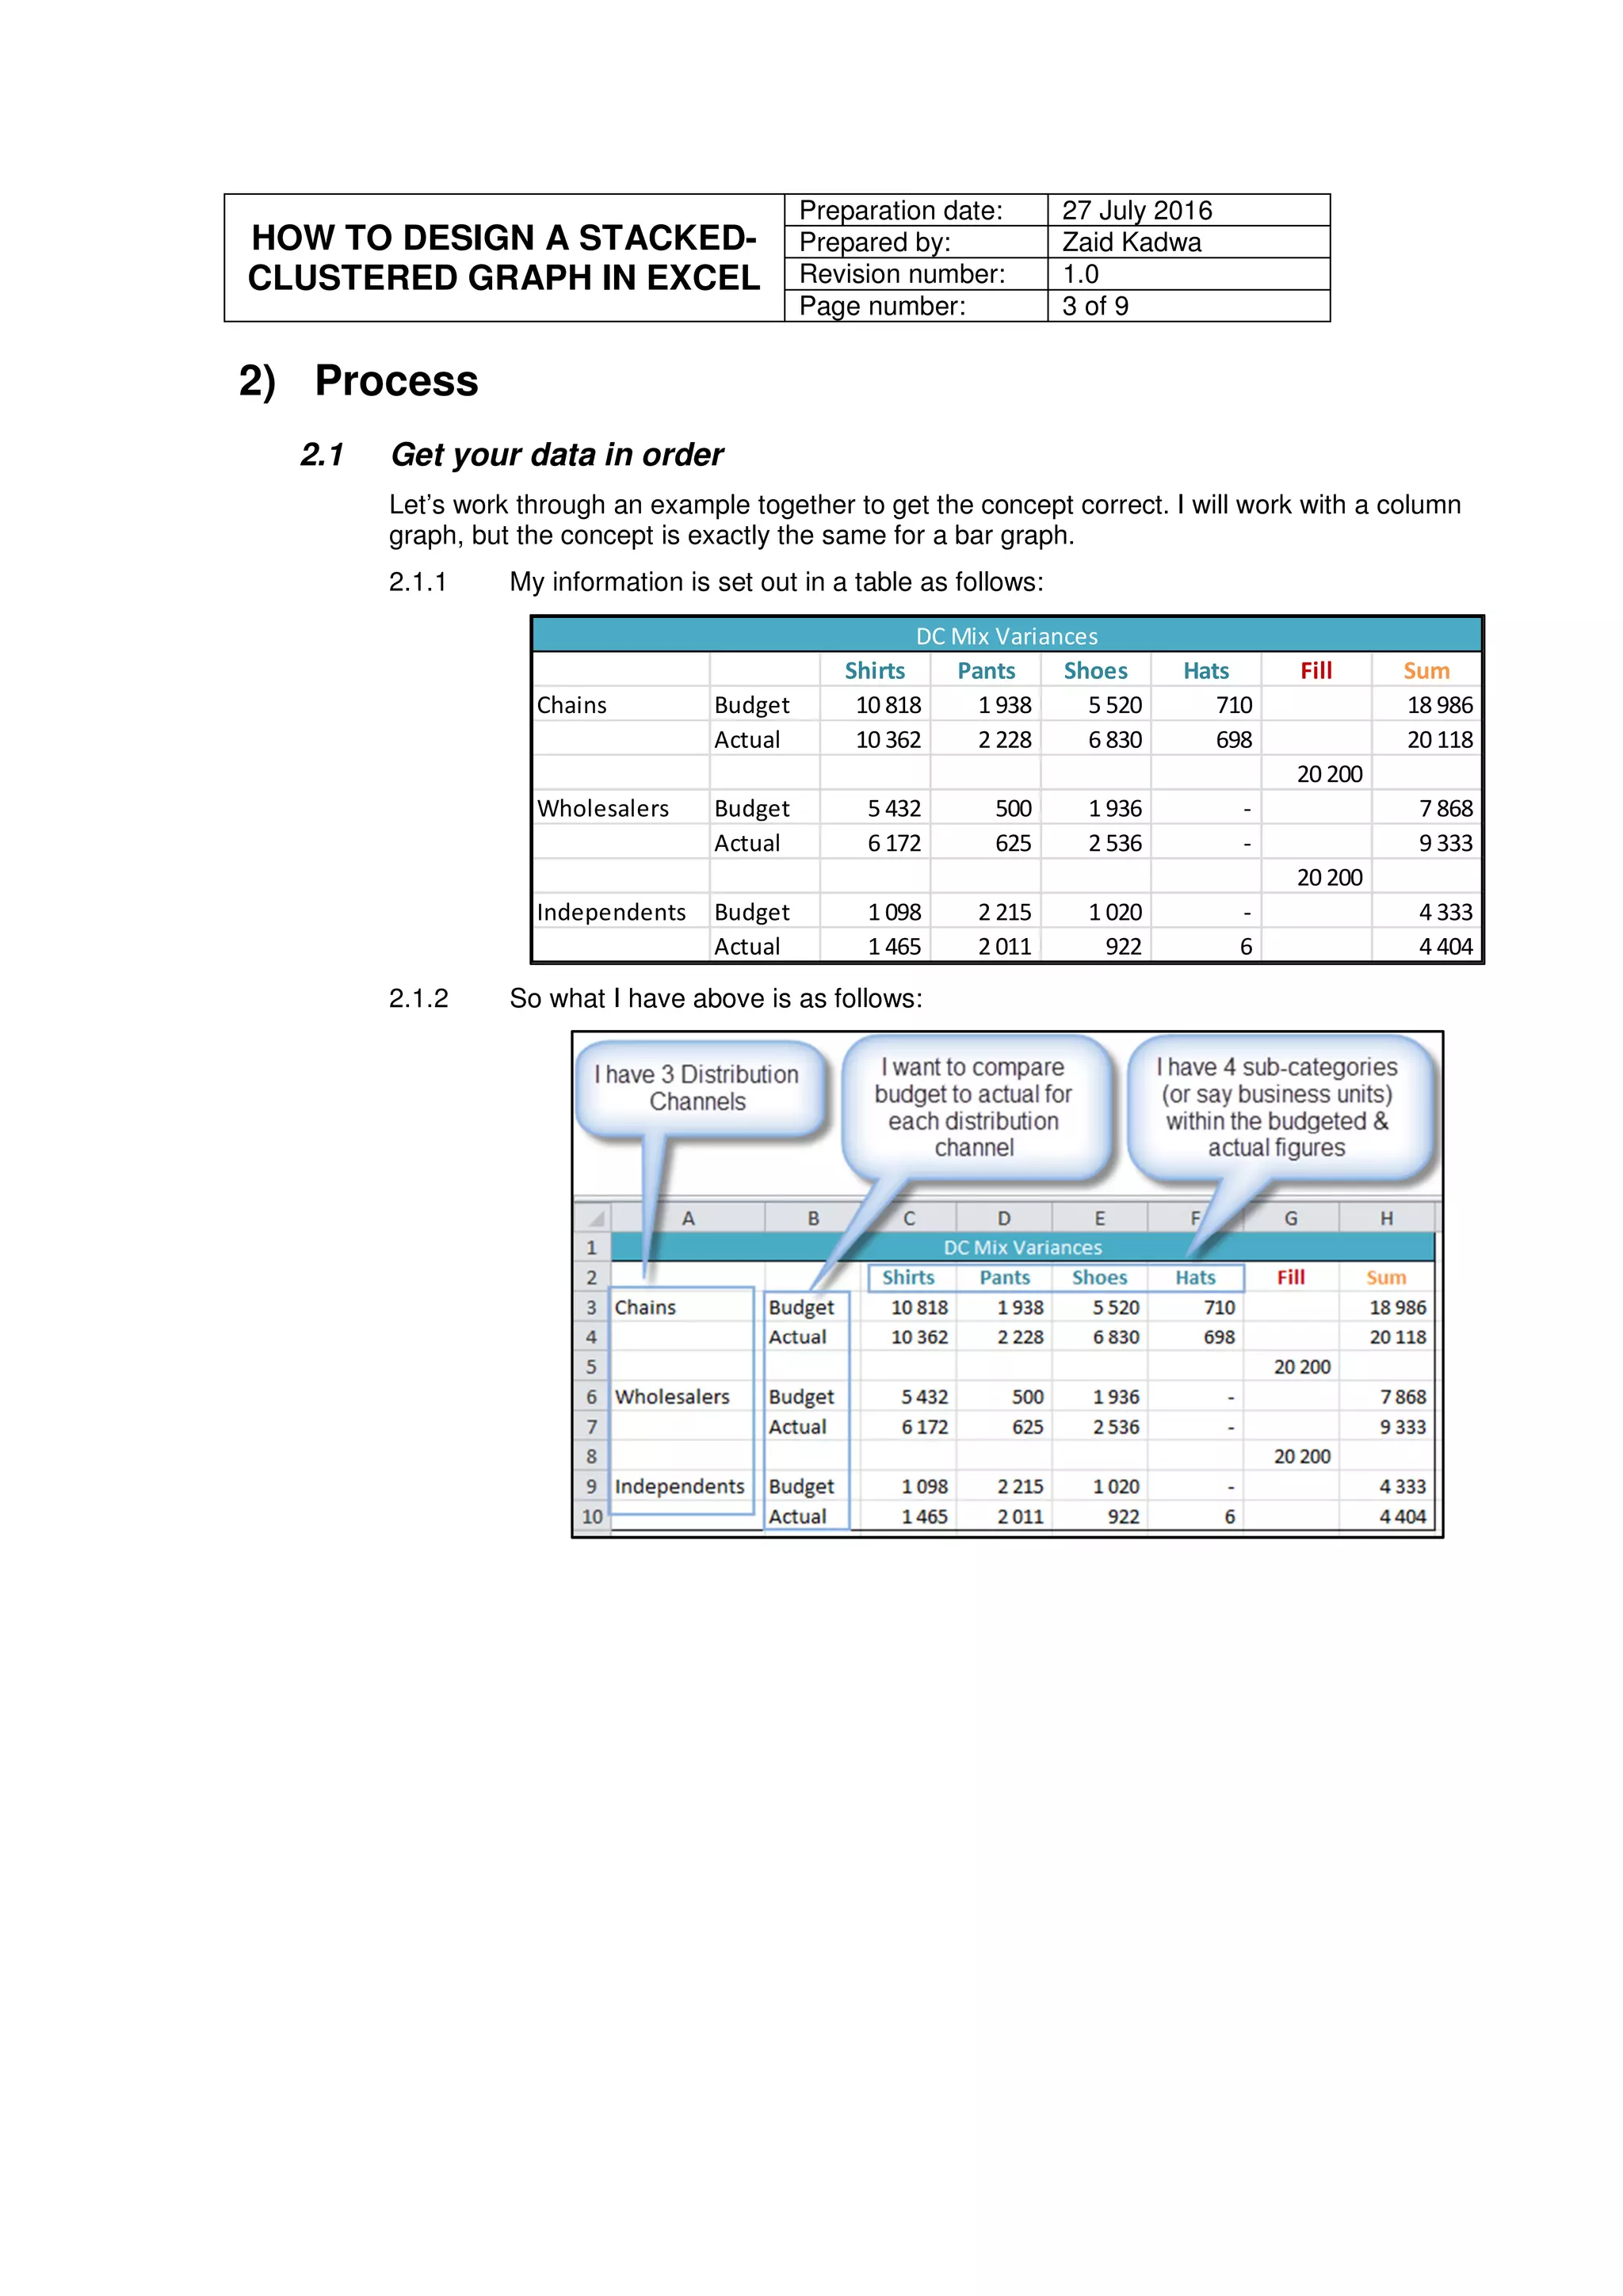
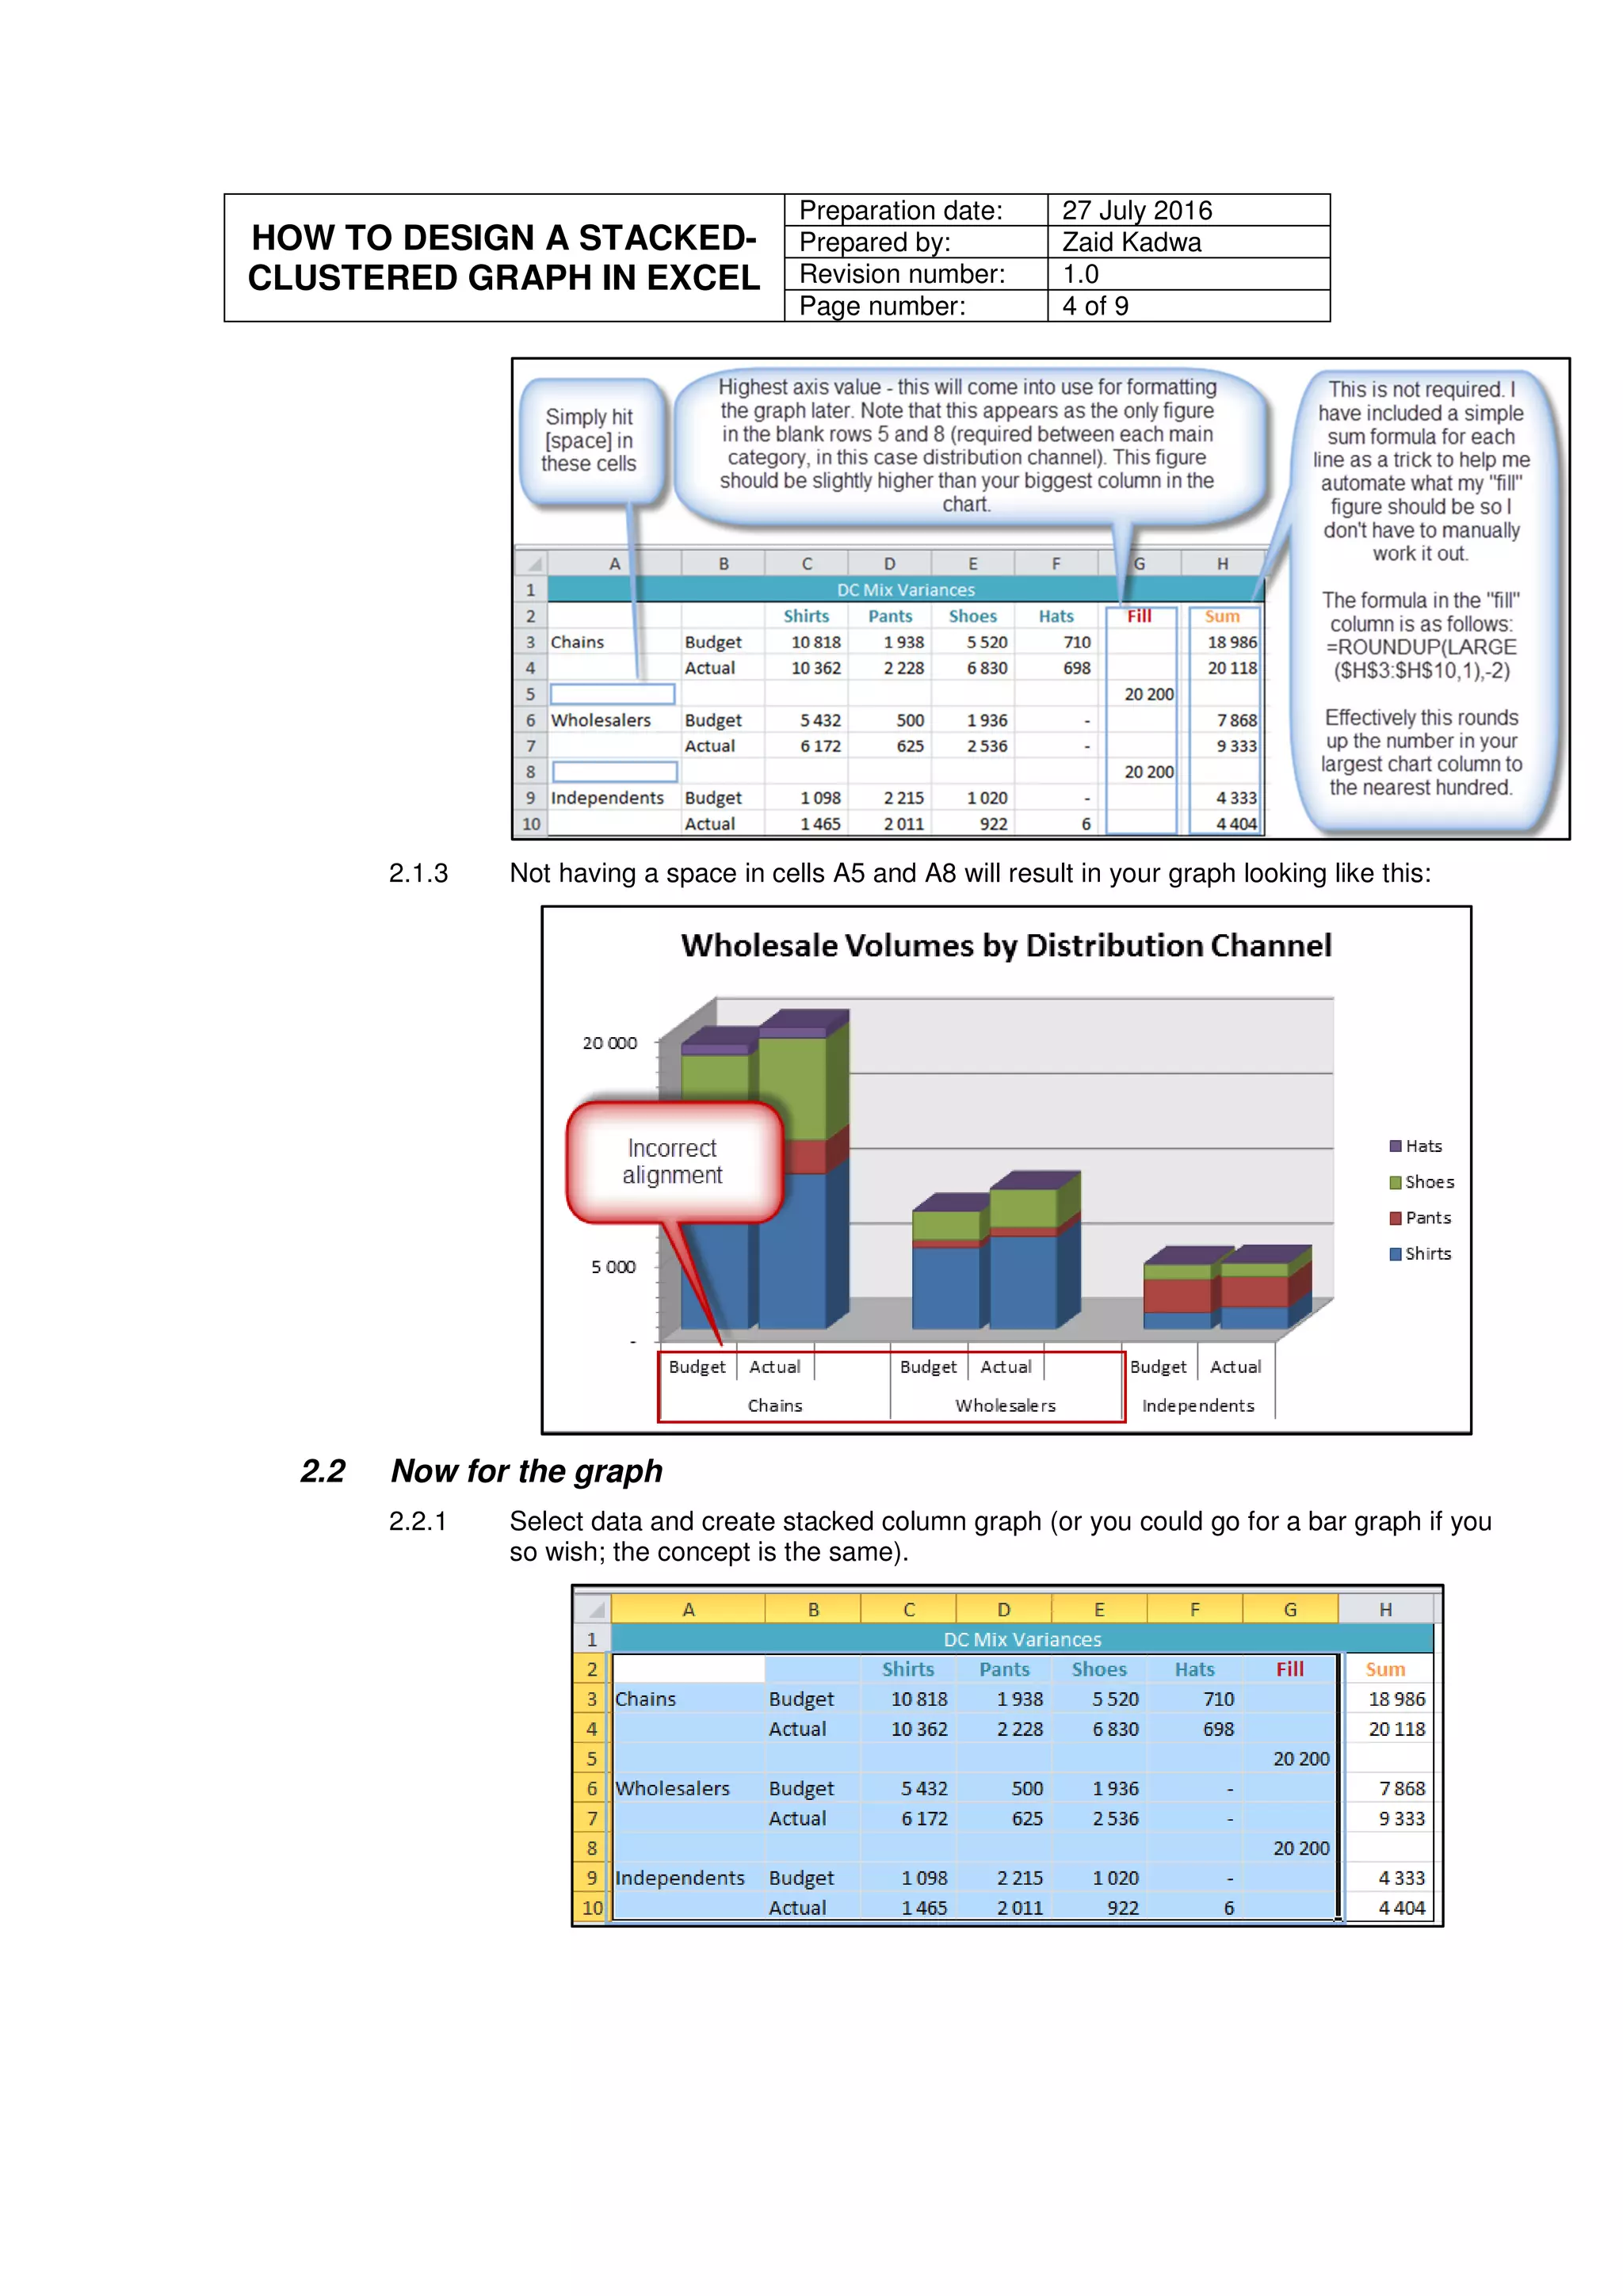
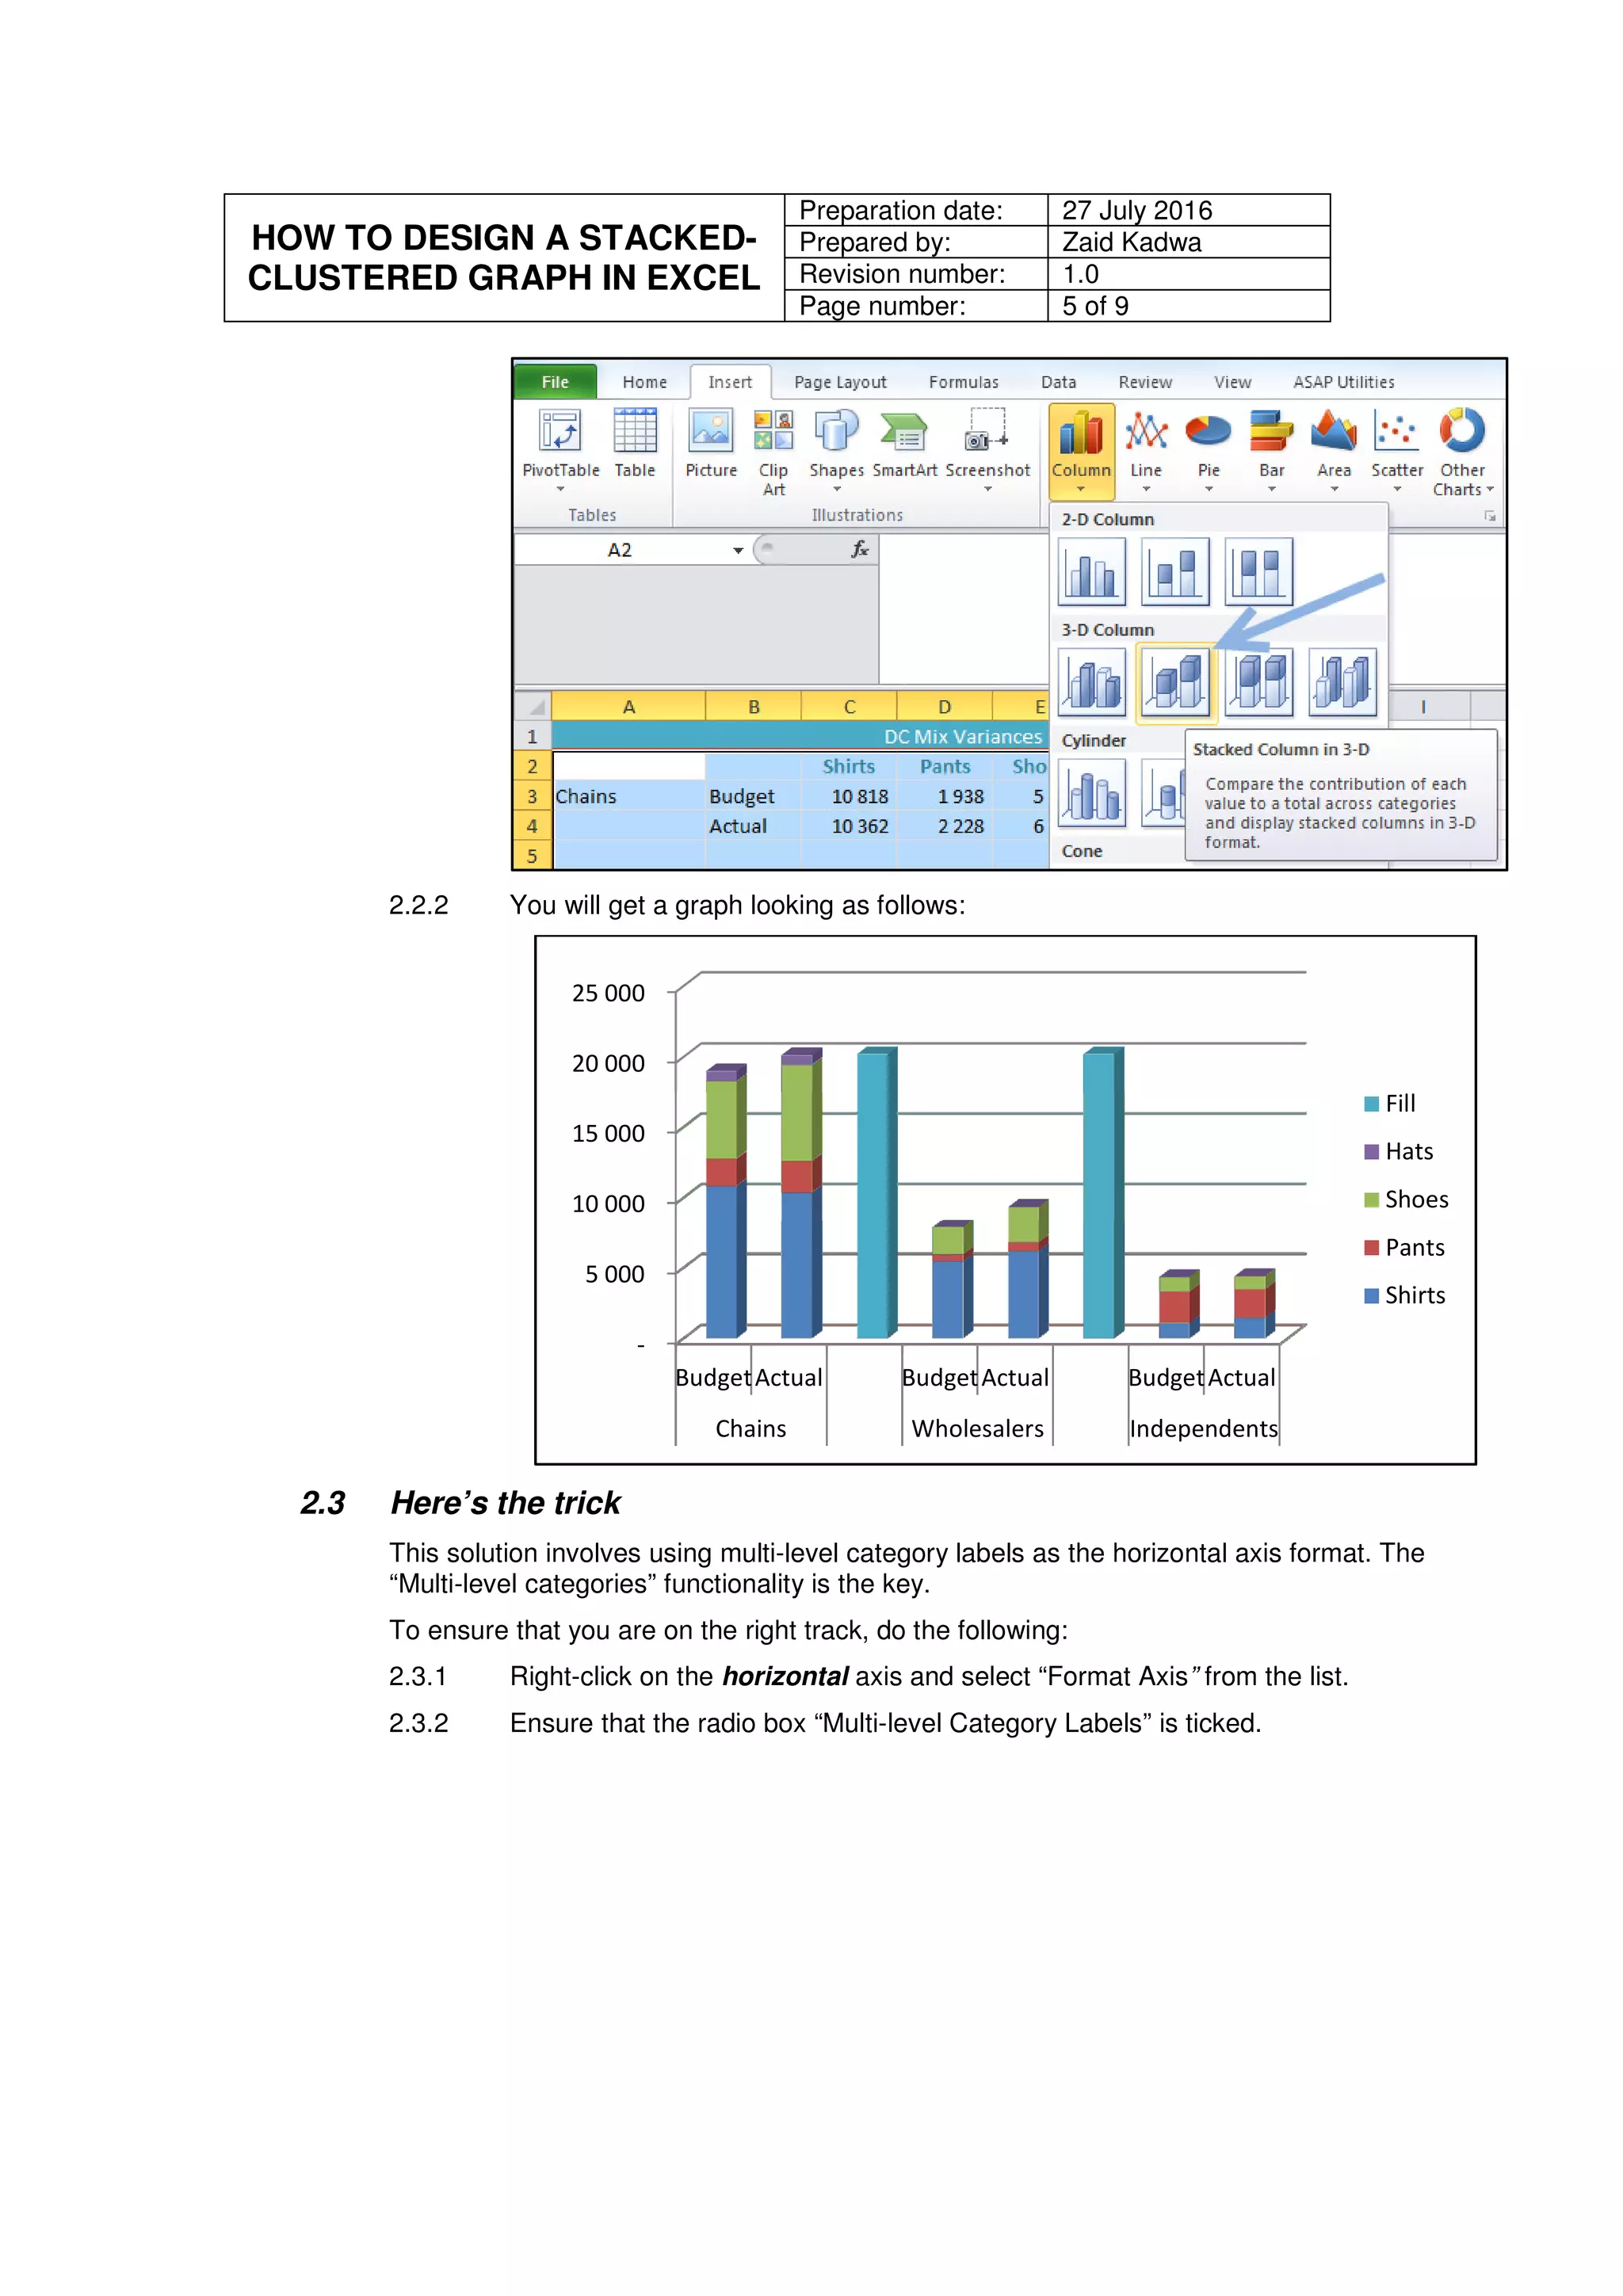
The document provides step-by-step instructions for creating a stacked and clustered column graph in Excel. It explains that Excel only allows stacked or clustered graphs by default, but not both together. It then demonstrates how to take a basic stacked graph and basic clustered graph and combine them into one graph that is both stacked and clustered. The instructions include preparing the data, creating a stacked column graph, using multi-level category labels on the horizontal axis, reducing column gaps, making empty categories invisible, and removing unnecessary items from the legend.
![HOW TO DESIGN A STACKED-
CLUSTERED GRAPH IN EXCEL
Preparation date: 27 July 2016
Prepared by: Zaid Kadwa
Revision number: 1.0
Page number: 7 of 9
Your graph now should look as follows:
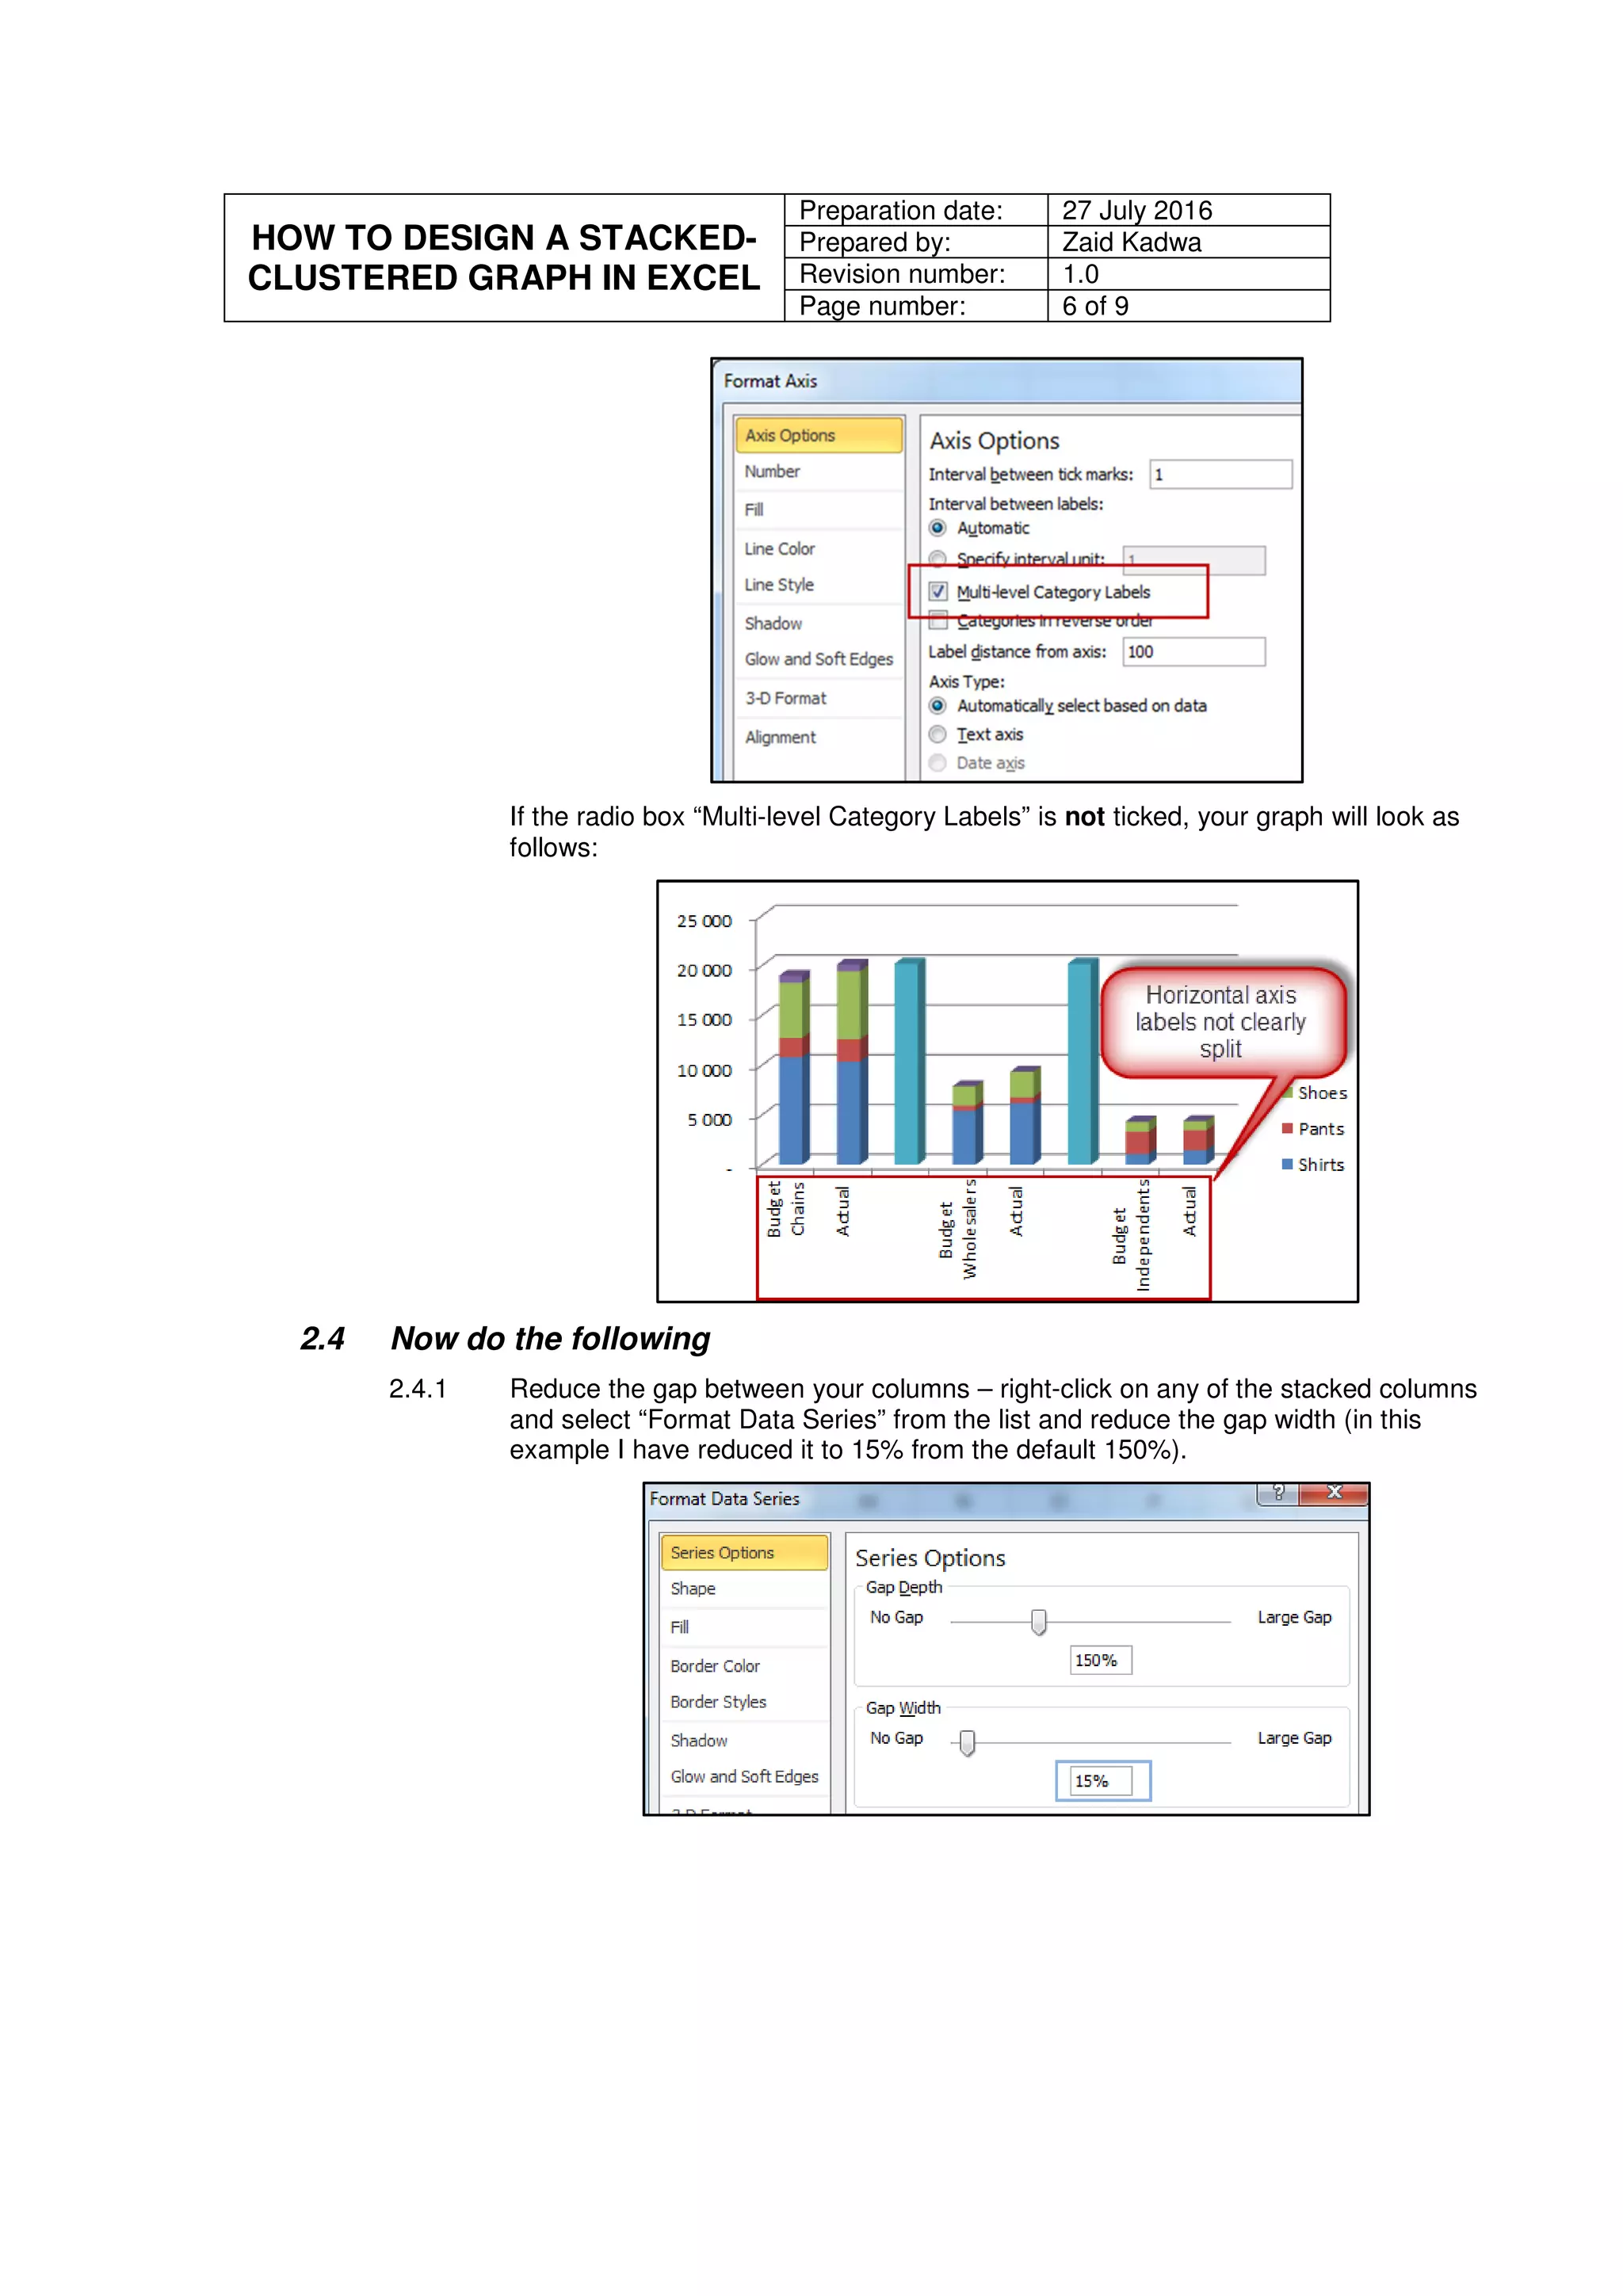
2.4.2 Make the “Fill” columns invisible – right-click on any of the “Fill” columns and select
“Format Data Series”:
2.4.2.1 In the “Fill” tab select the radio button “No fill”;
2.4.2.2 In the “Border Colour” tab select the radio button “No line”; and
2.4.2.3 In the “Shadow” tab under the item “Presets” ensure that the “No
shadow” option is selected.
Your graph should now look as follows:
2.4.3 Remove the “Fill” item from the legend – simply select “Fill” from the legend and hit
the [delete] key.
-
5 000
10 000
15 000
20 000
25 000
BudgetActual BudgetActual BudgetActual
Chains Wholesalers Independents
Fill
Hats
Shoes
Pants
Shirts
-
5 000
10 000
15 000
20 000
25 000
BudgetActual BudgetActual BudgetActual
Chains Wholesalers Independents
Fill
Hats
Shoes
Pants
Shirts](https://image.slidesharecdn.com/12e6e954-148b-477a-88e6-5c2c420f41d8-160826084022/75/20160727-How-to-Create-a-Stacked-Cluster-Graph-in-Excel-8-2048.jpg)