This document provides instructions for creating a line graph in Microsoft Excel 2007 with 7 steps:
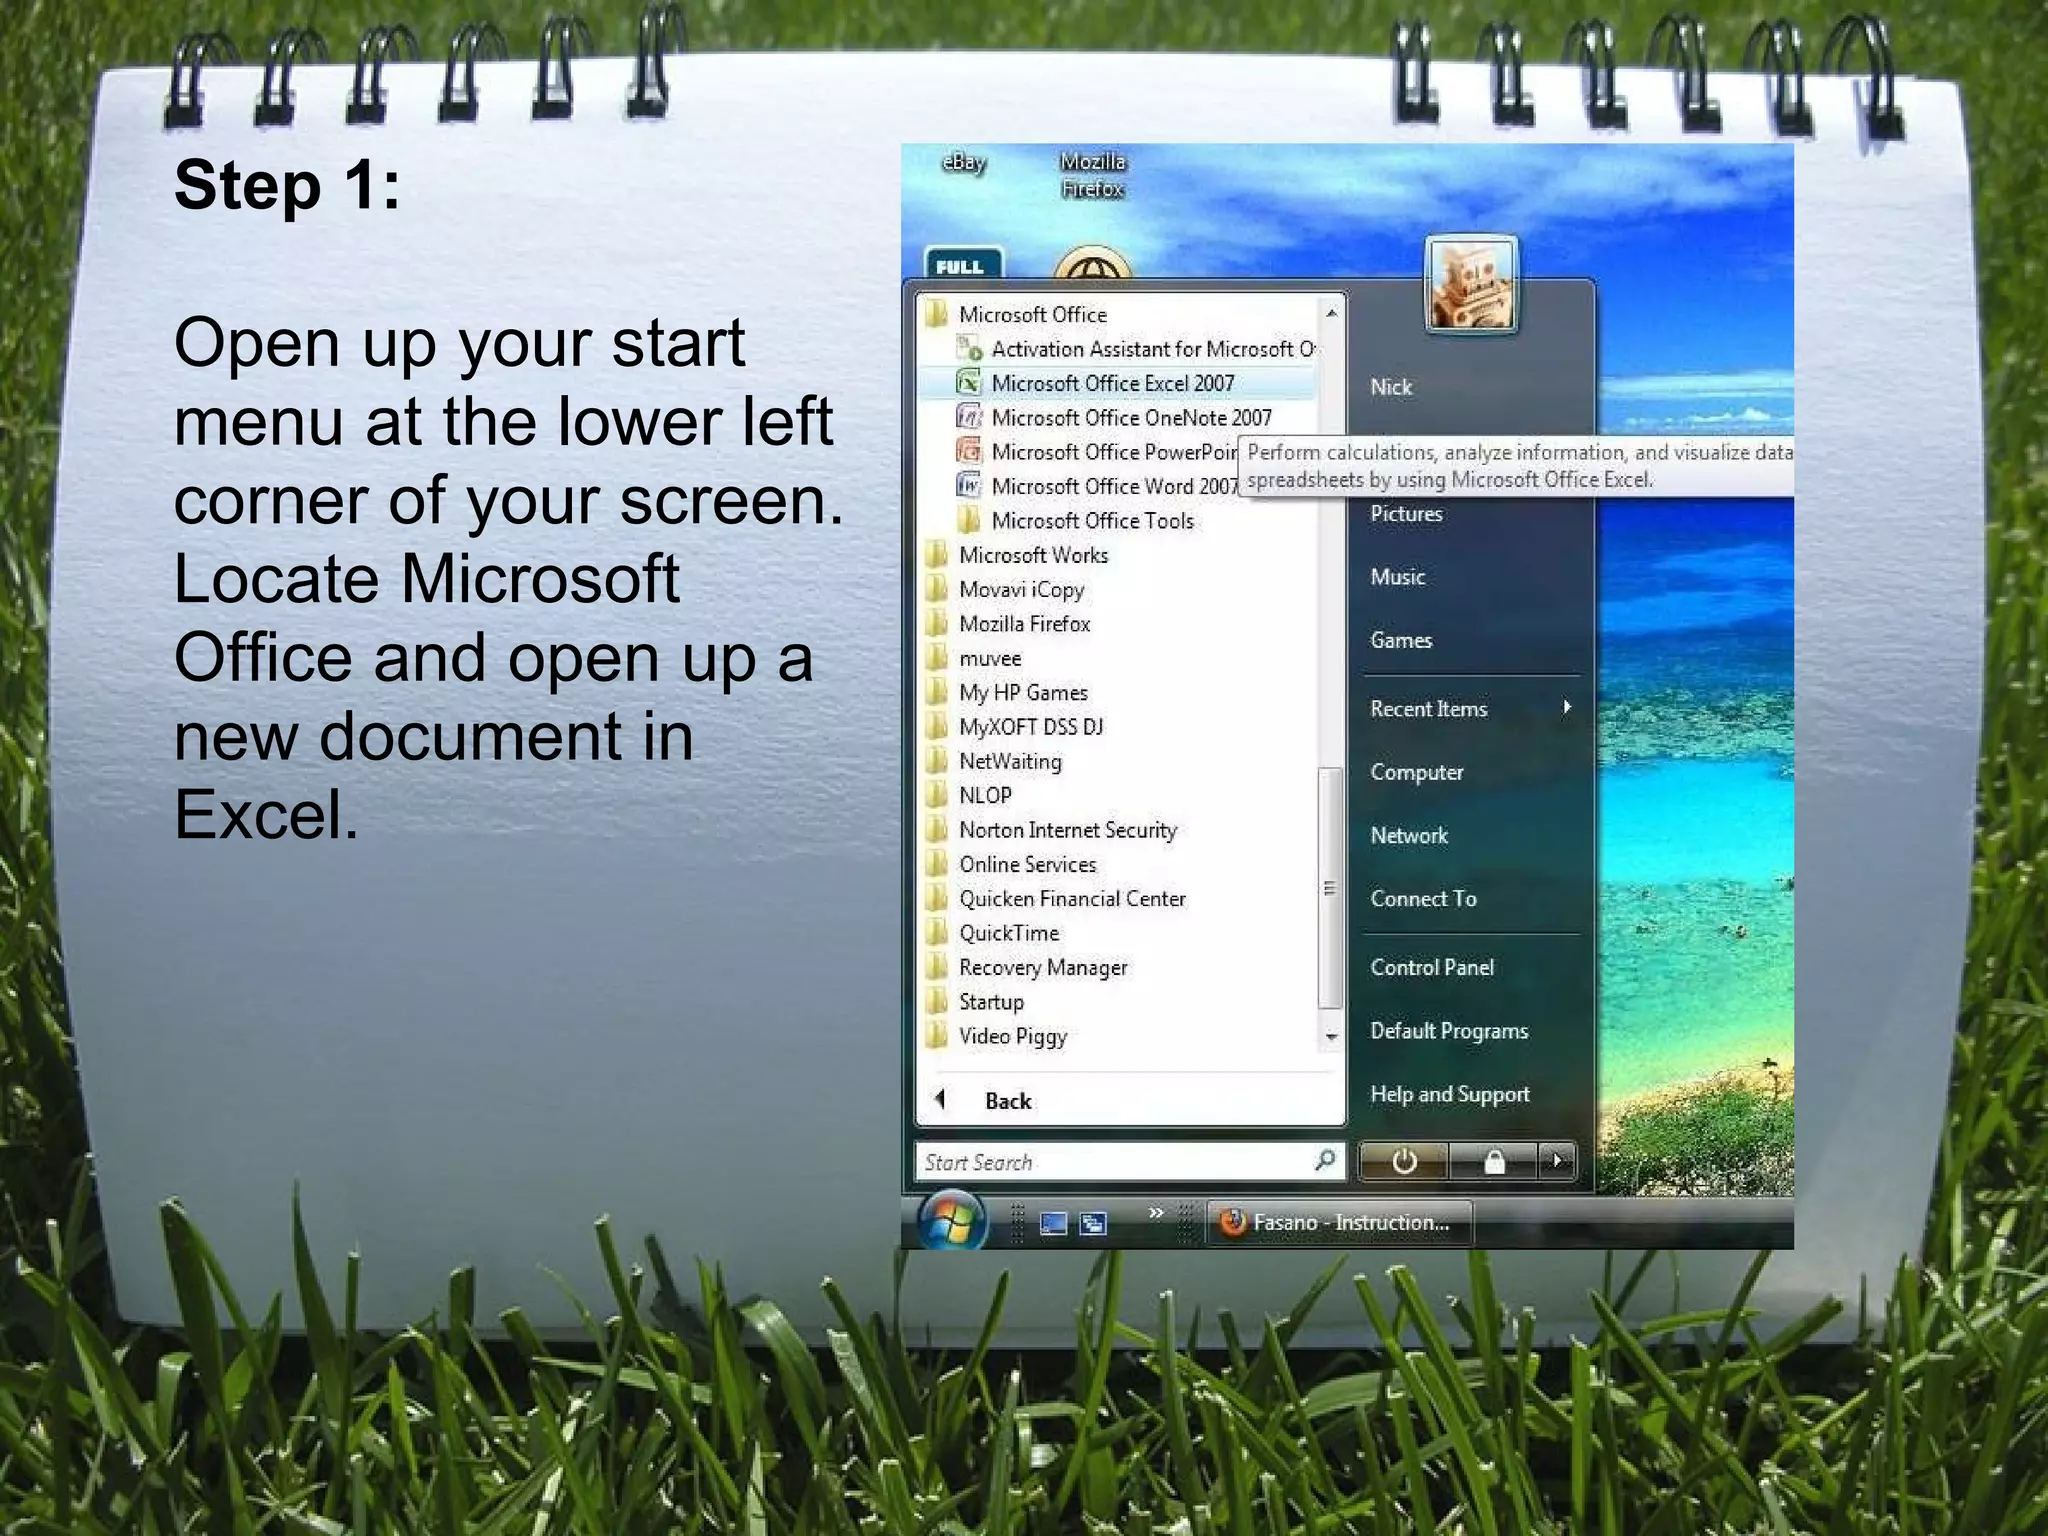
1) Open a new Excel document
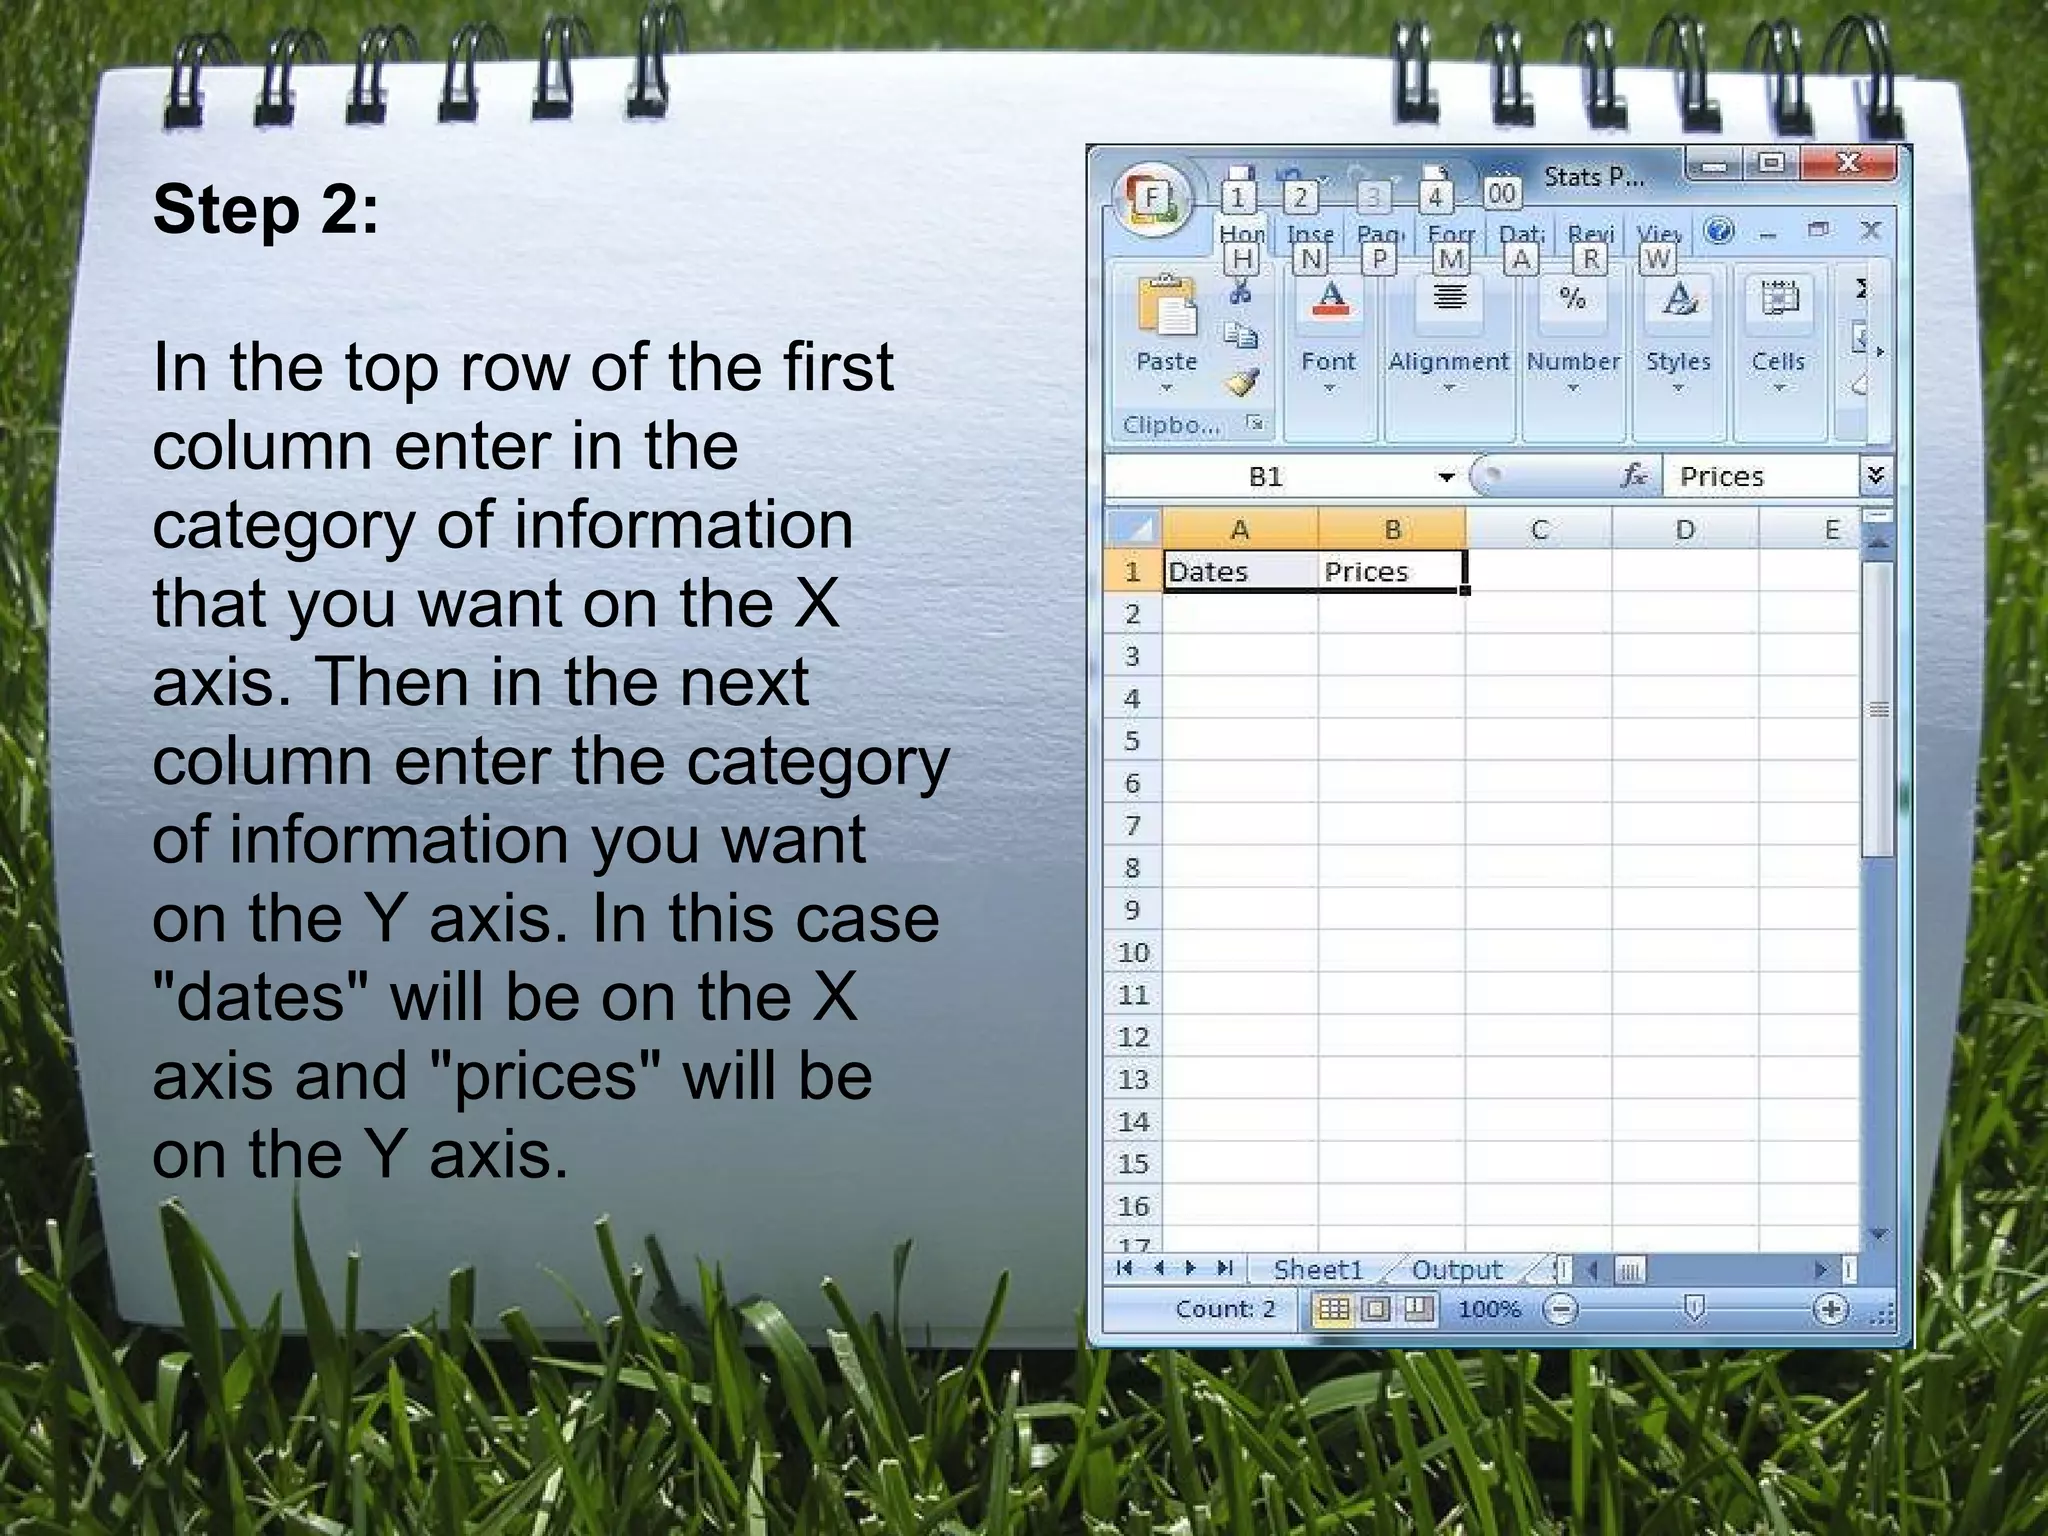
2) Enter category titles and data in columns
3) Enter matching data points under each category
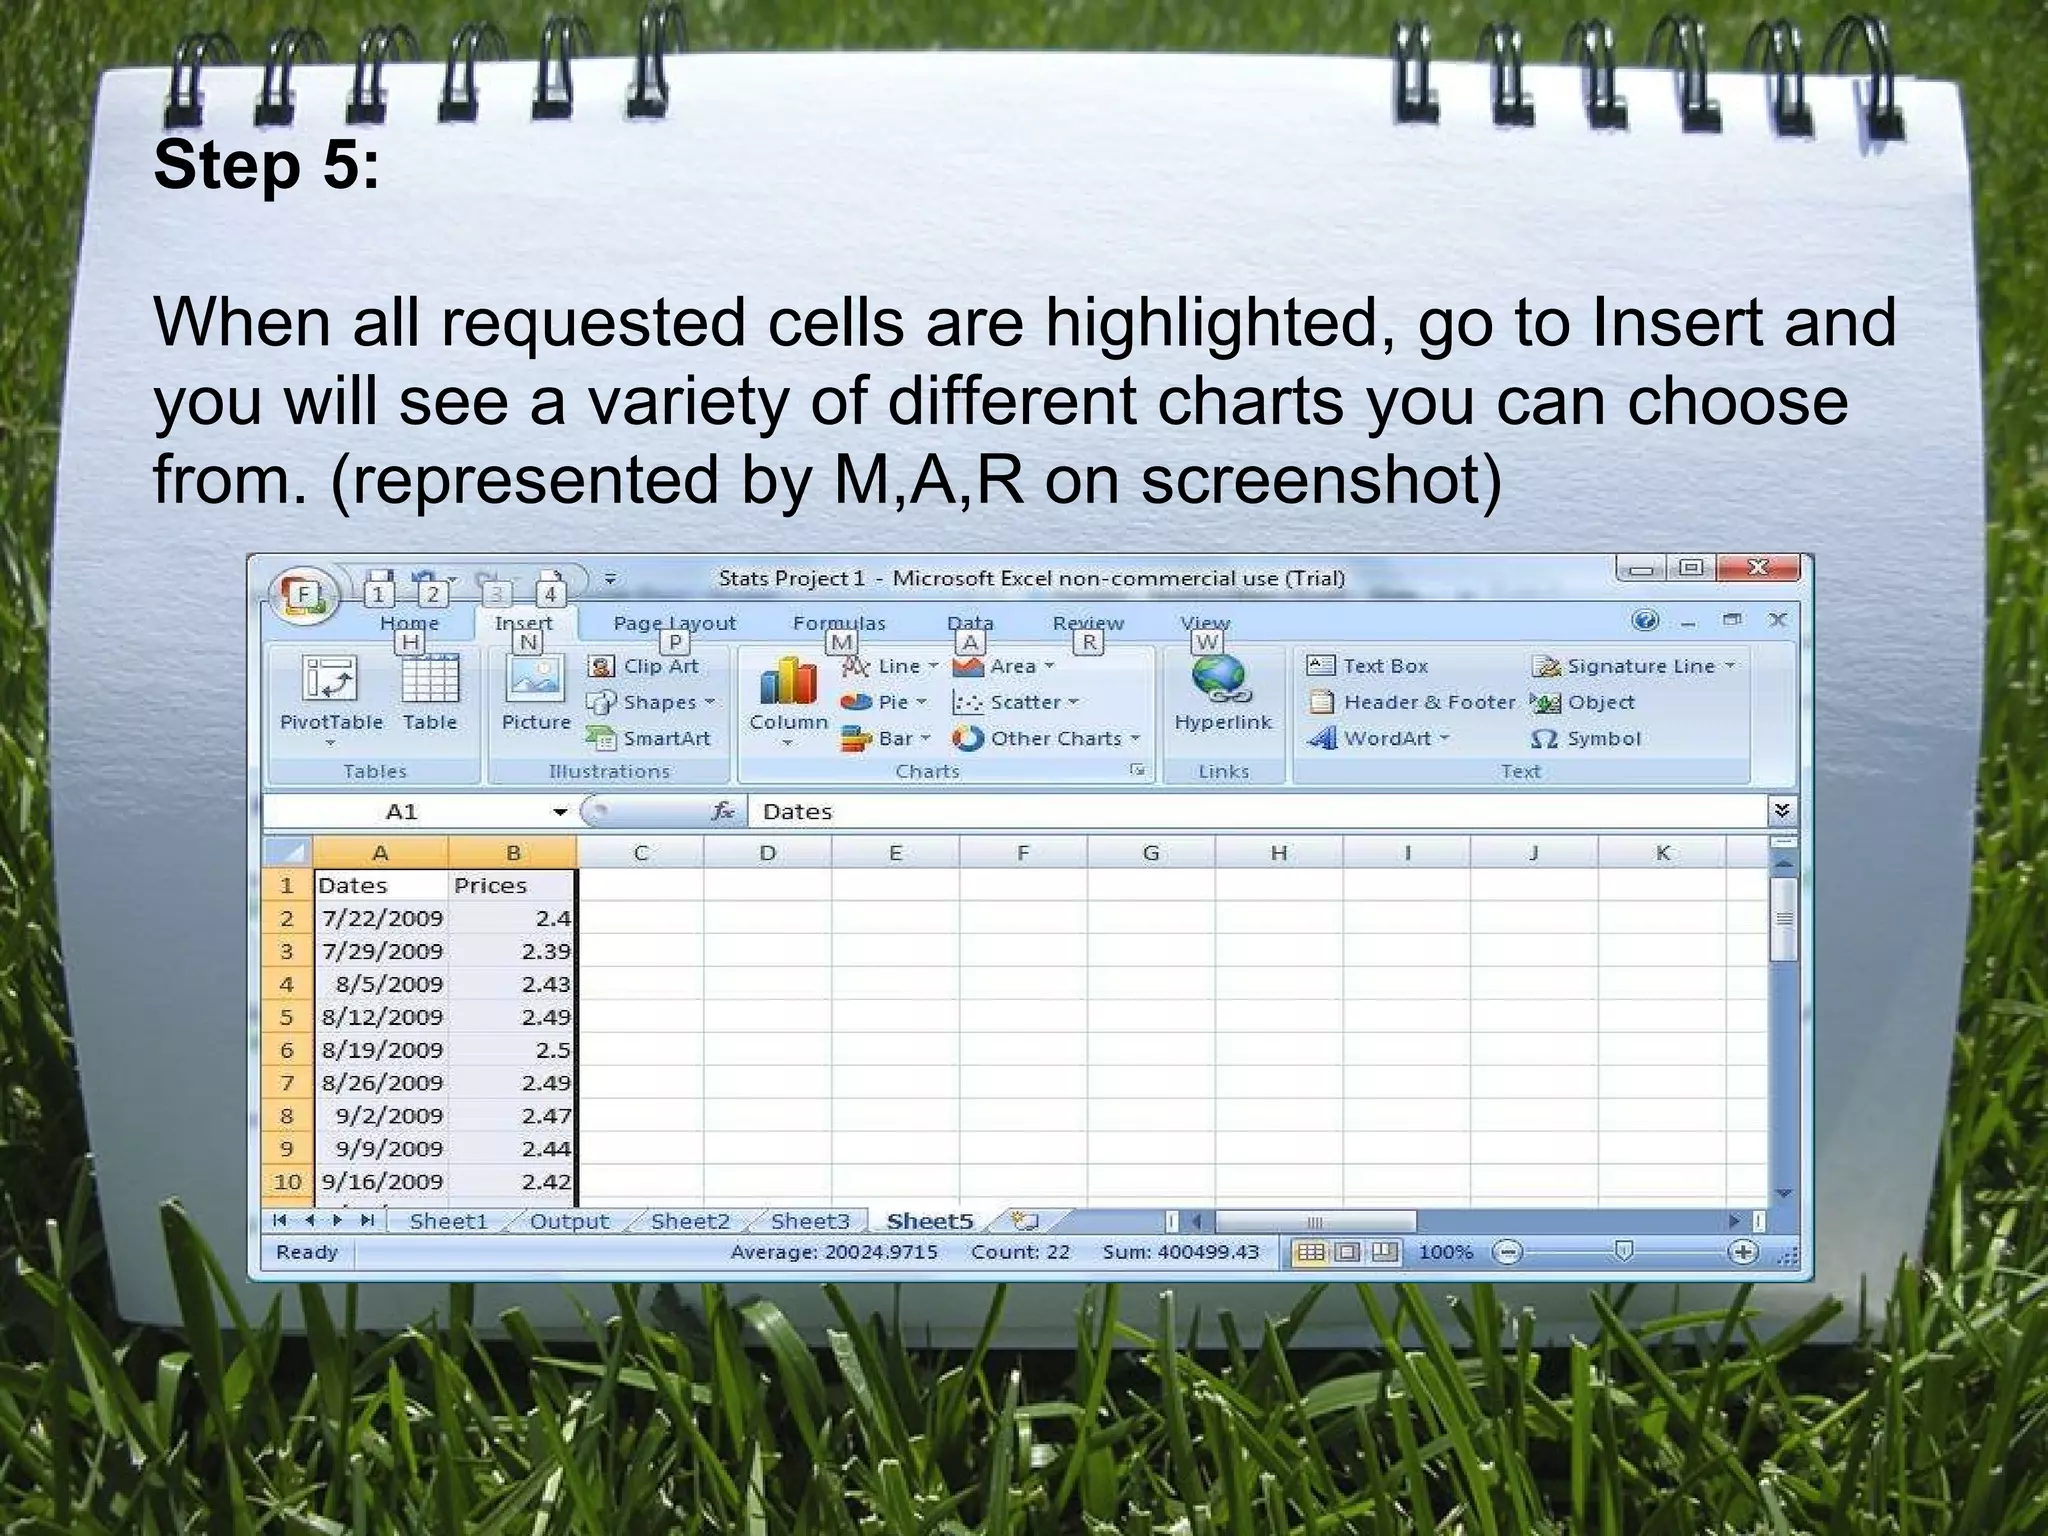
4) Highlight the cells with data
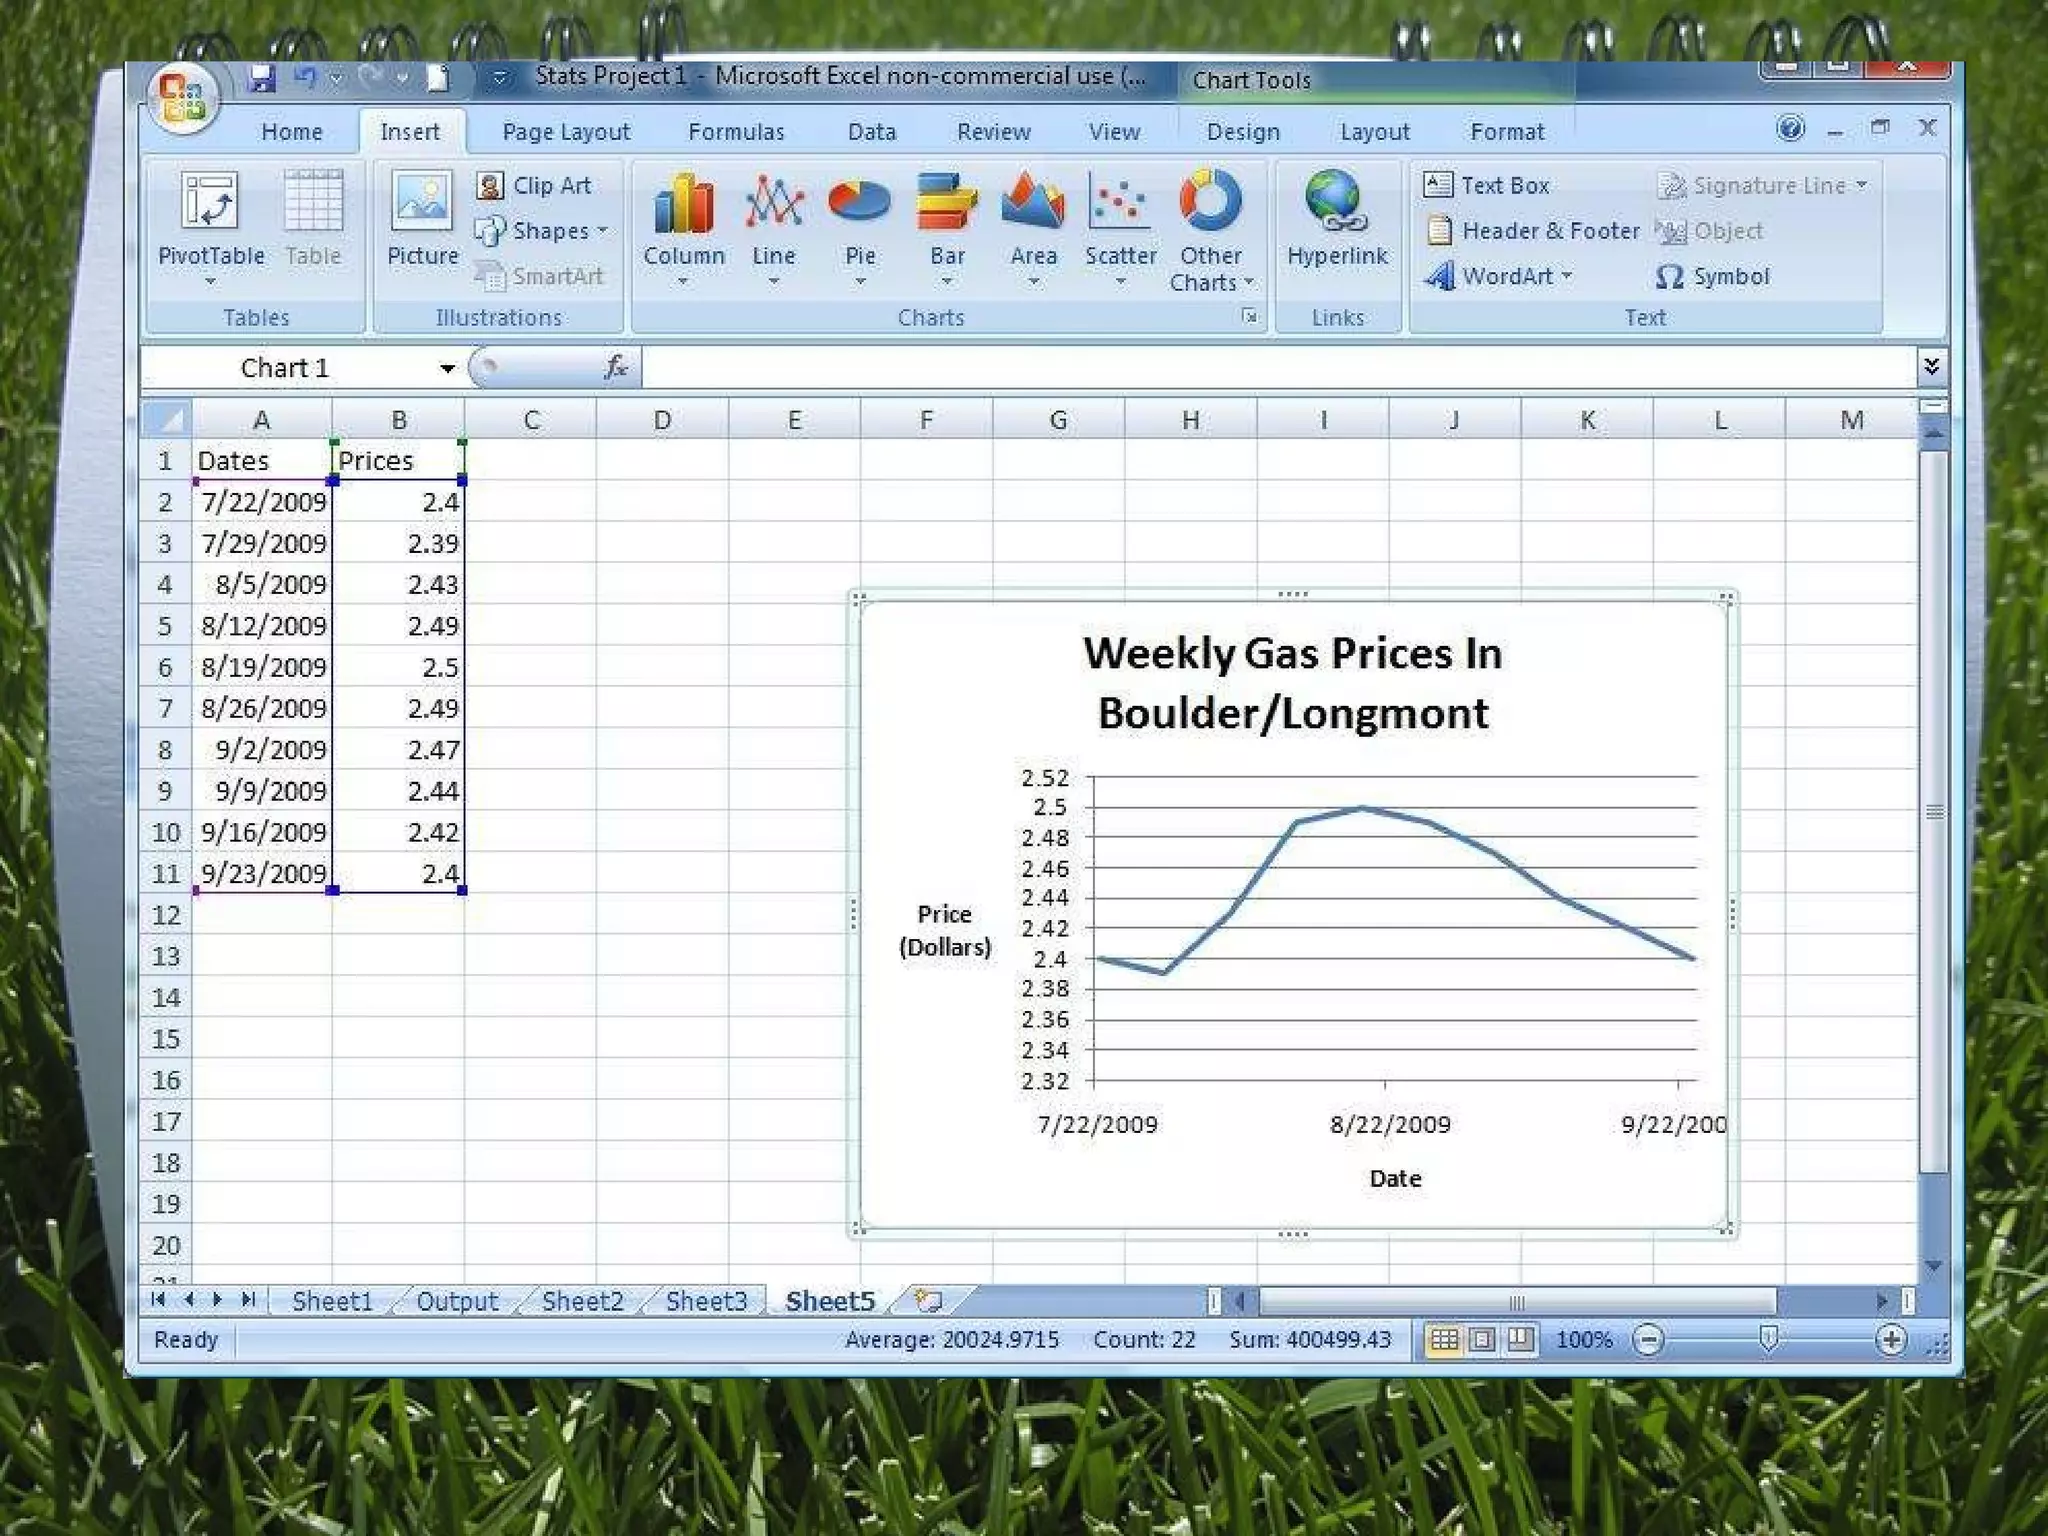
5) Insert a line graph from the options
6) Customize the graph titles and labels using the Chart Tools menu
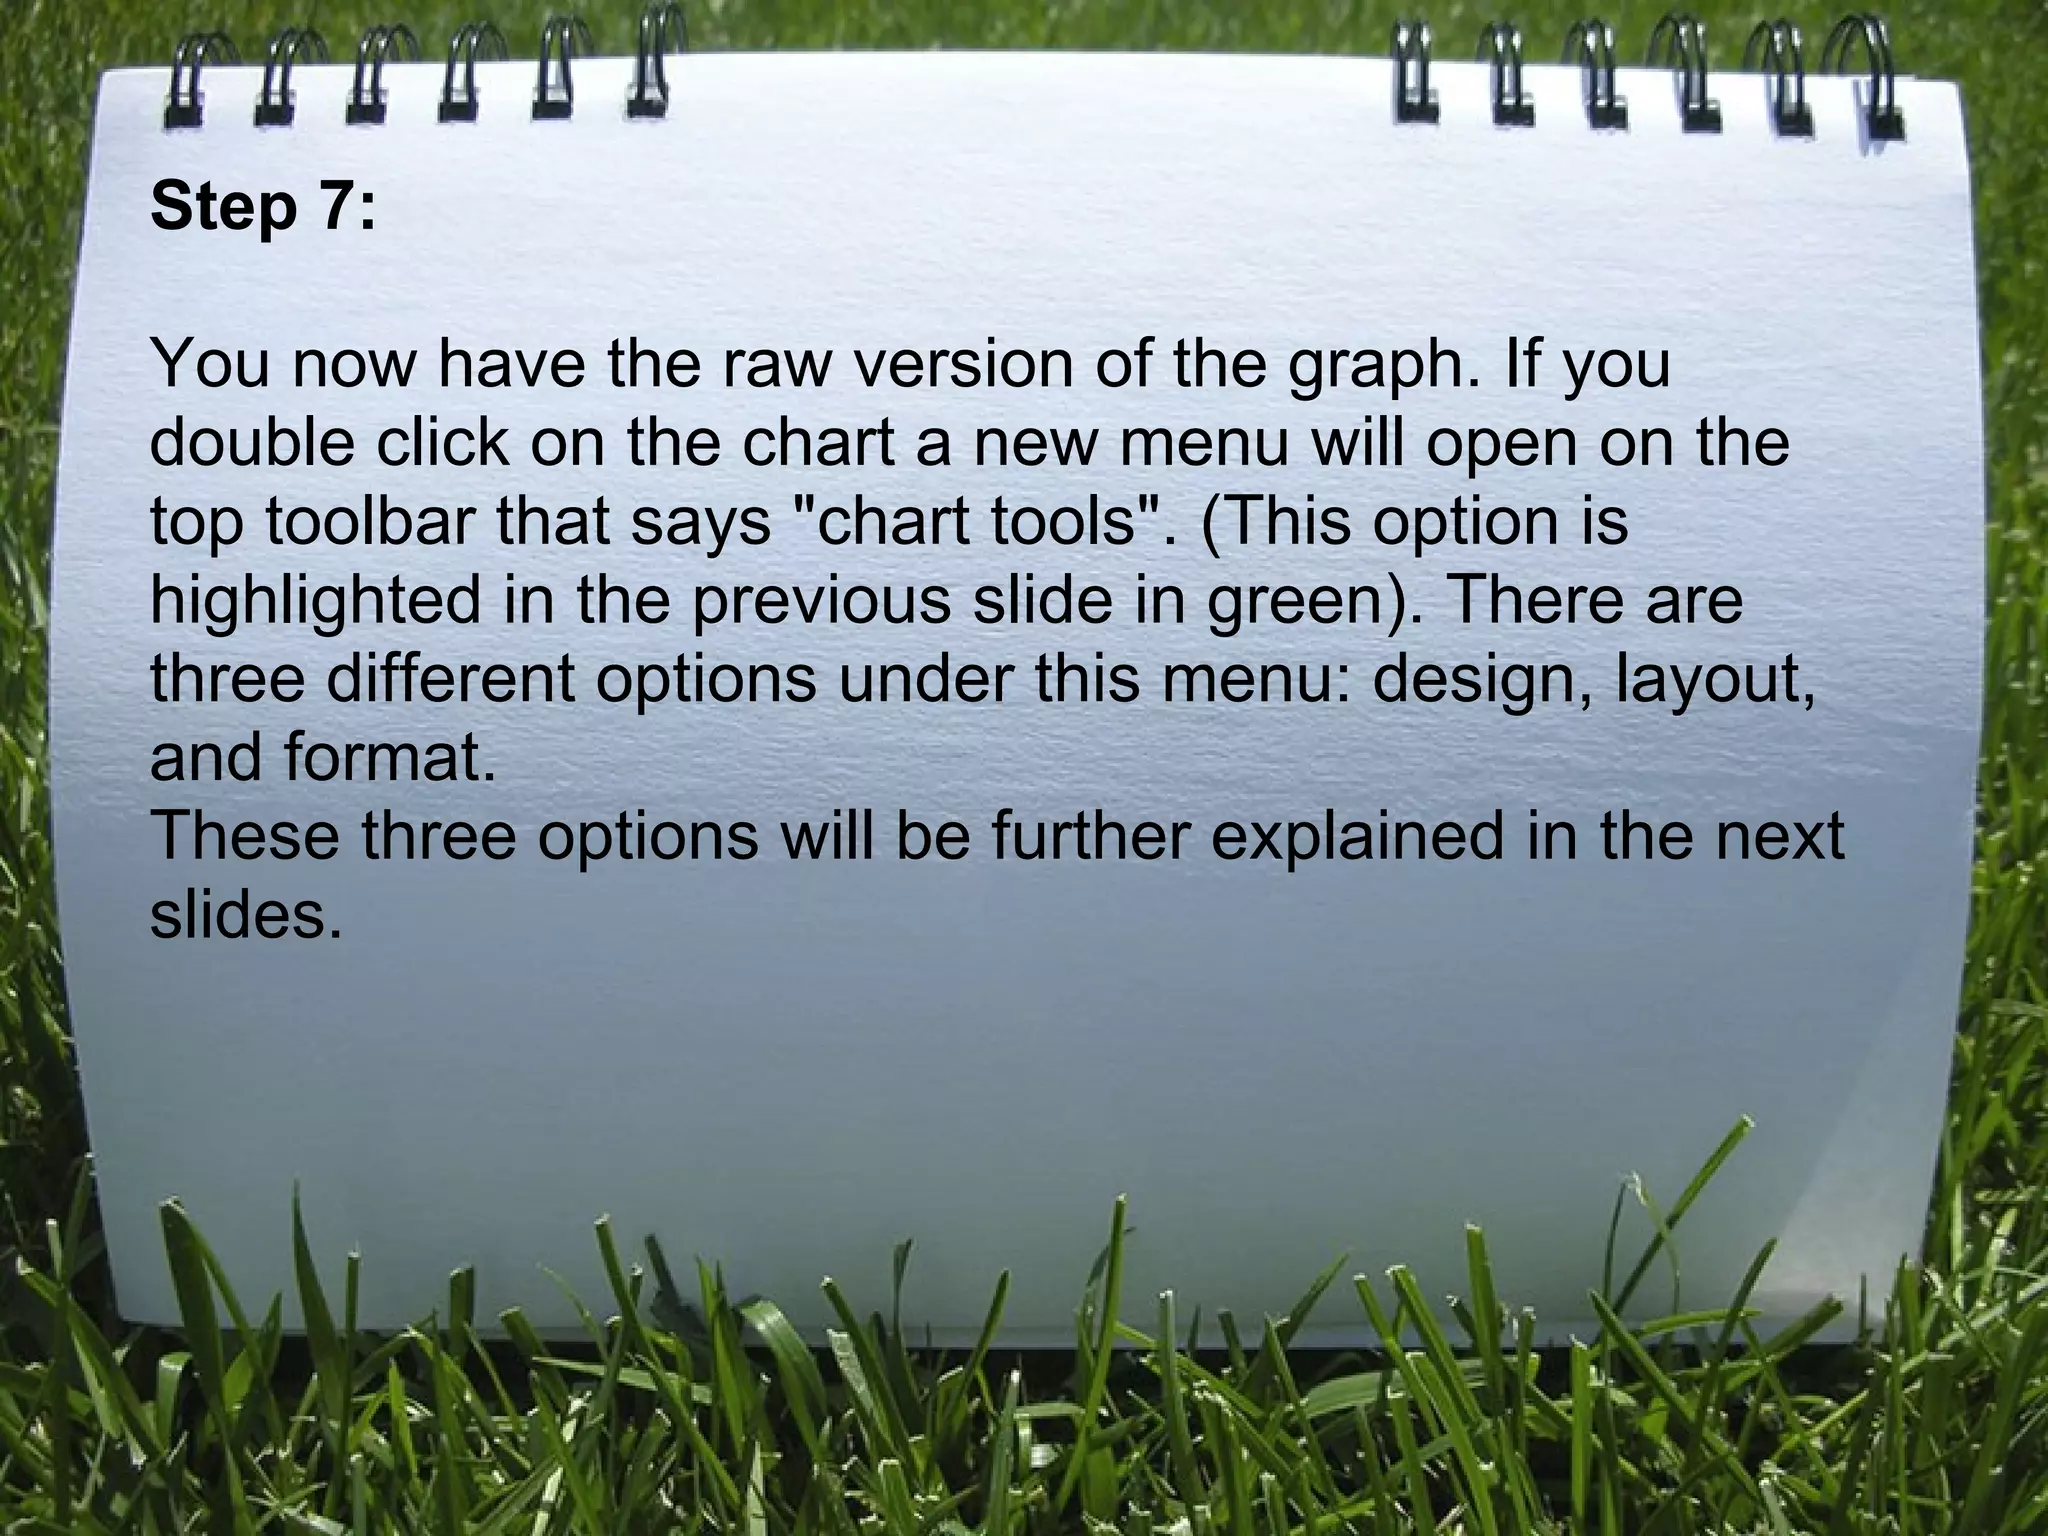
7) Finalize the graph layout, format text, and change the overall design


![Vibe Coding vs. Spec-Driven Development [Free Meetup]](https://cdn.slidesharecdn.com/ss_thumbnails/vibecodingvsspecdrivendevelopment-251209105622-43f455e7-thumbnail.jpg?width=640&height=640&fit=bounds)


