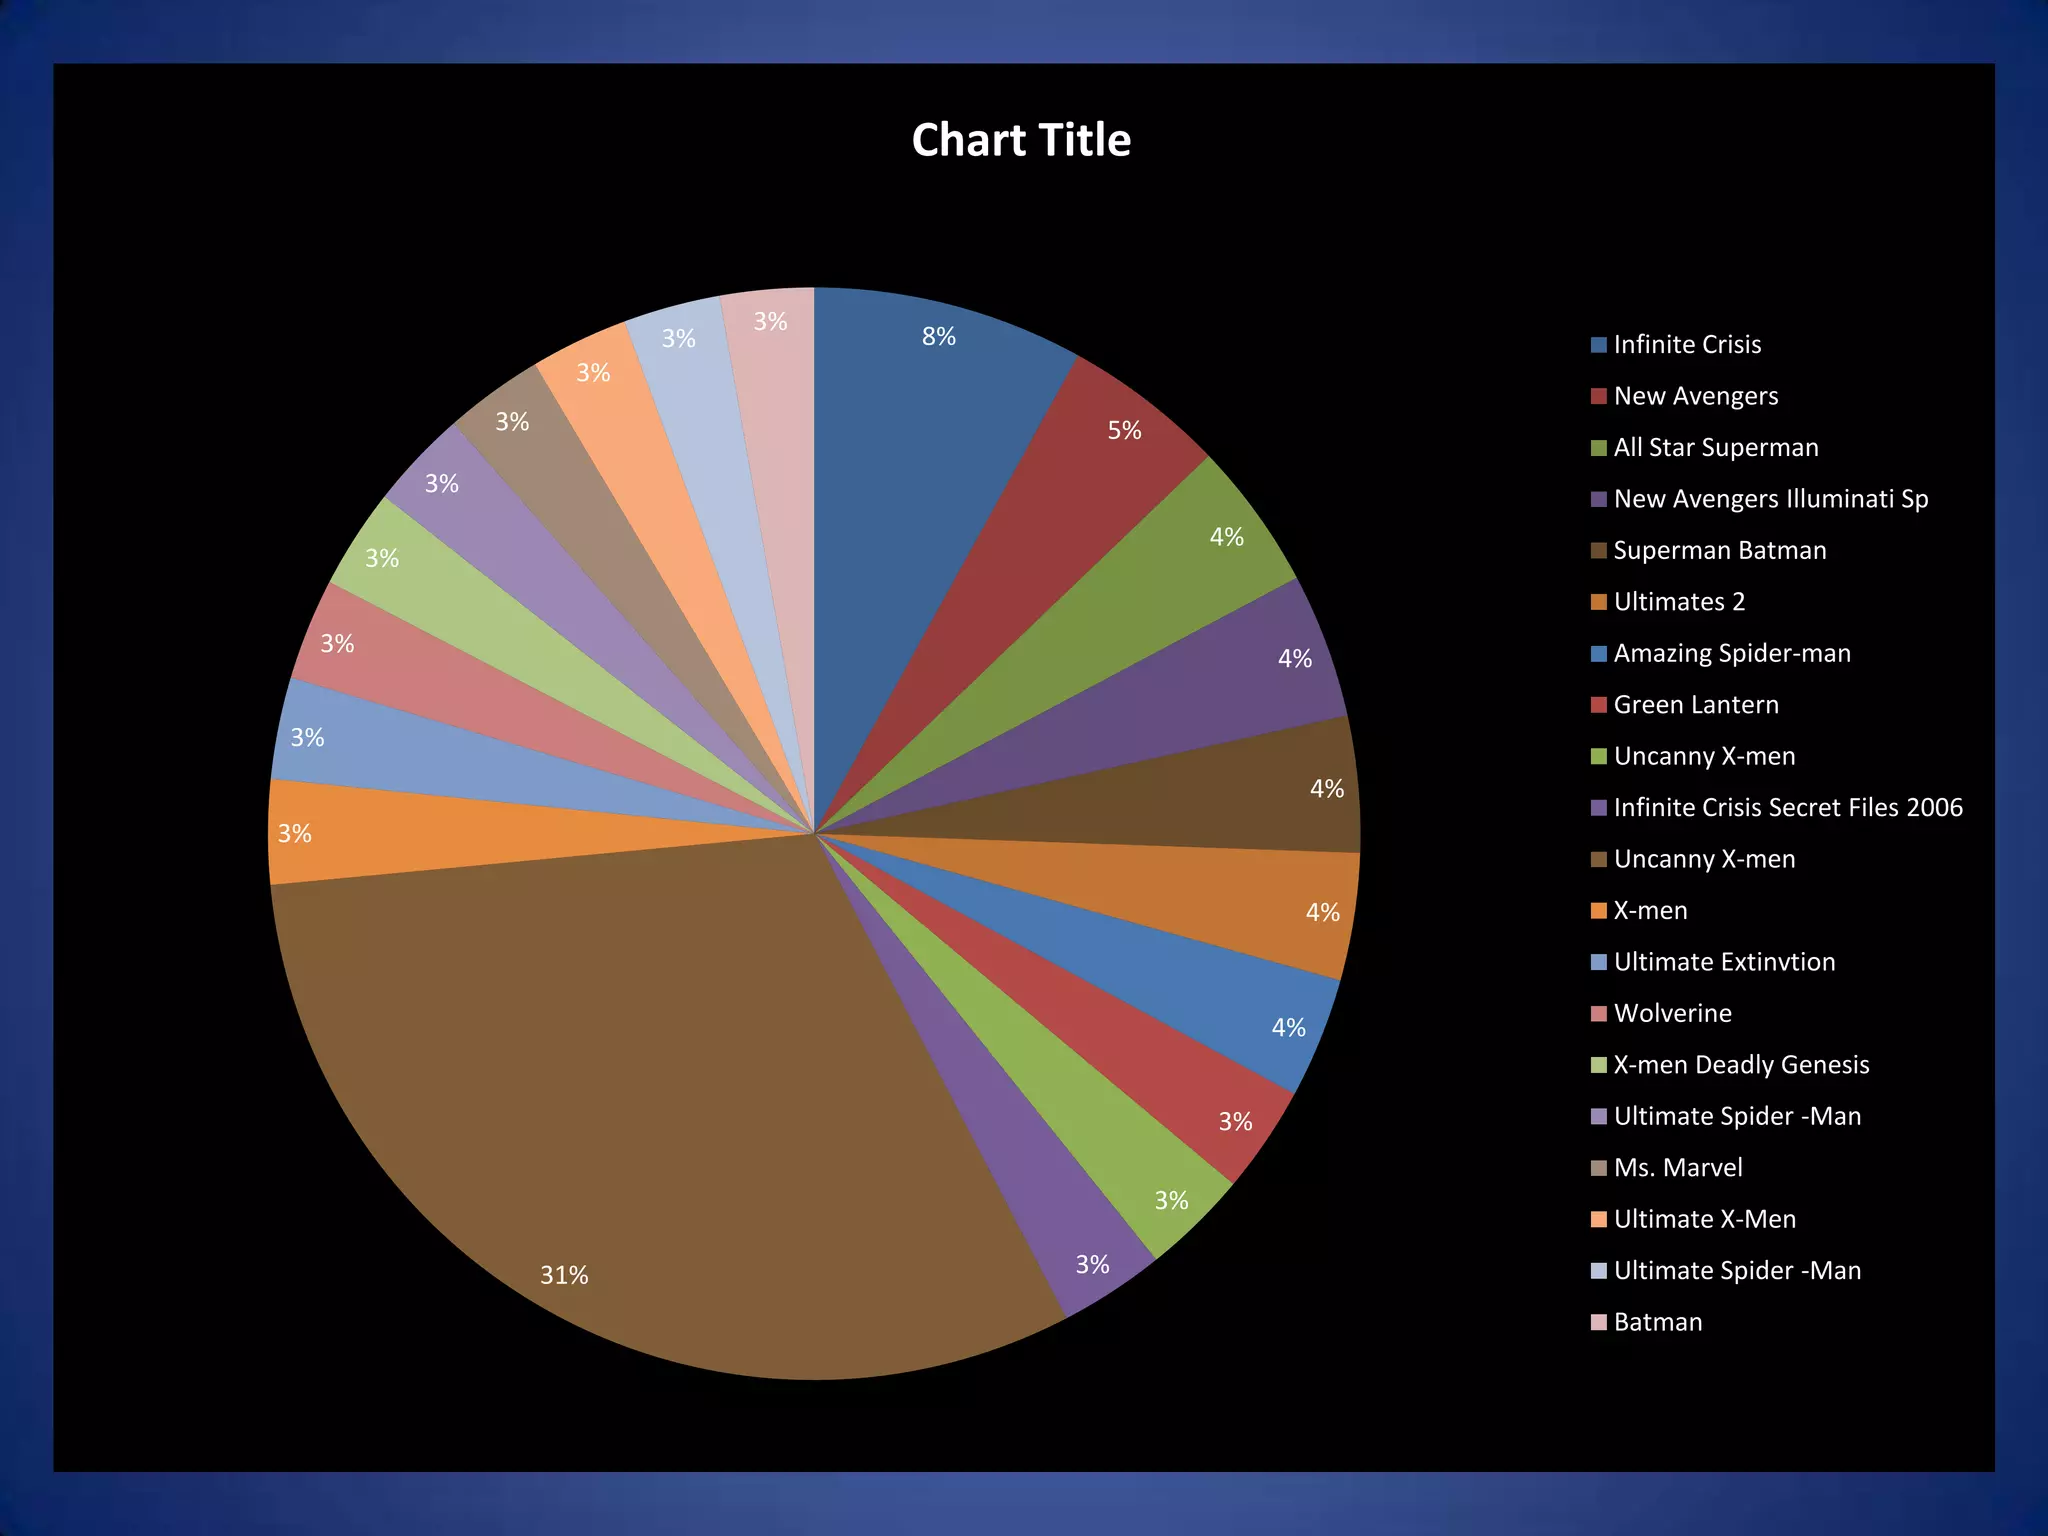
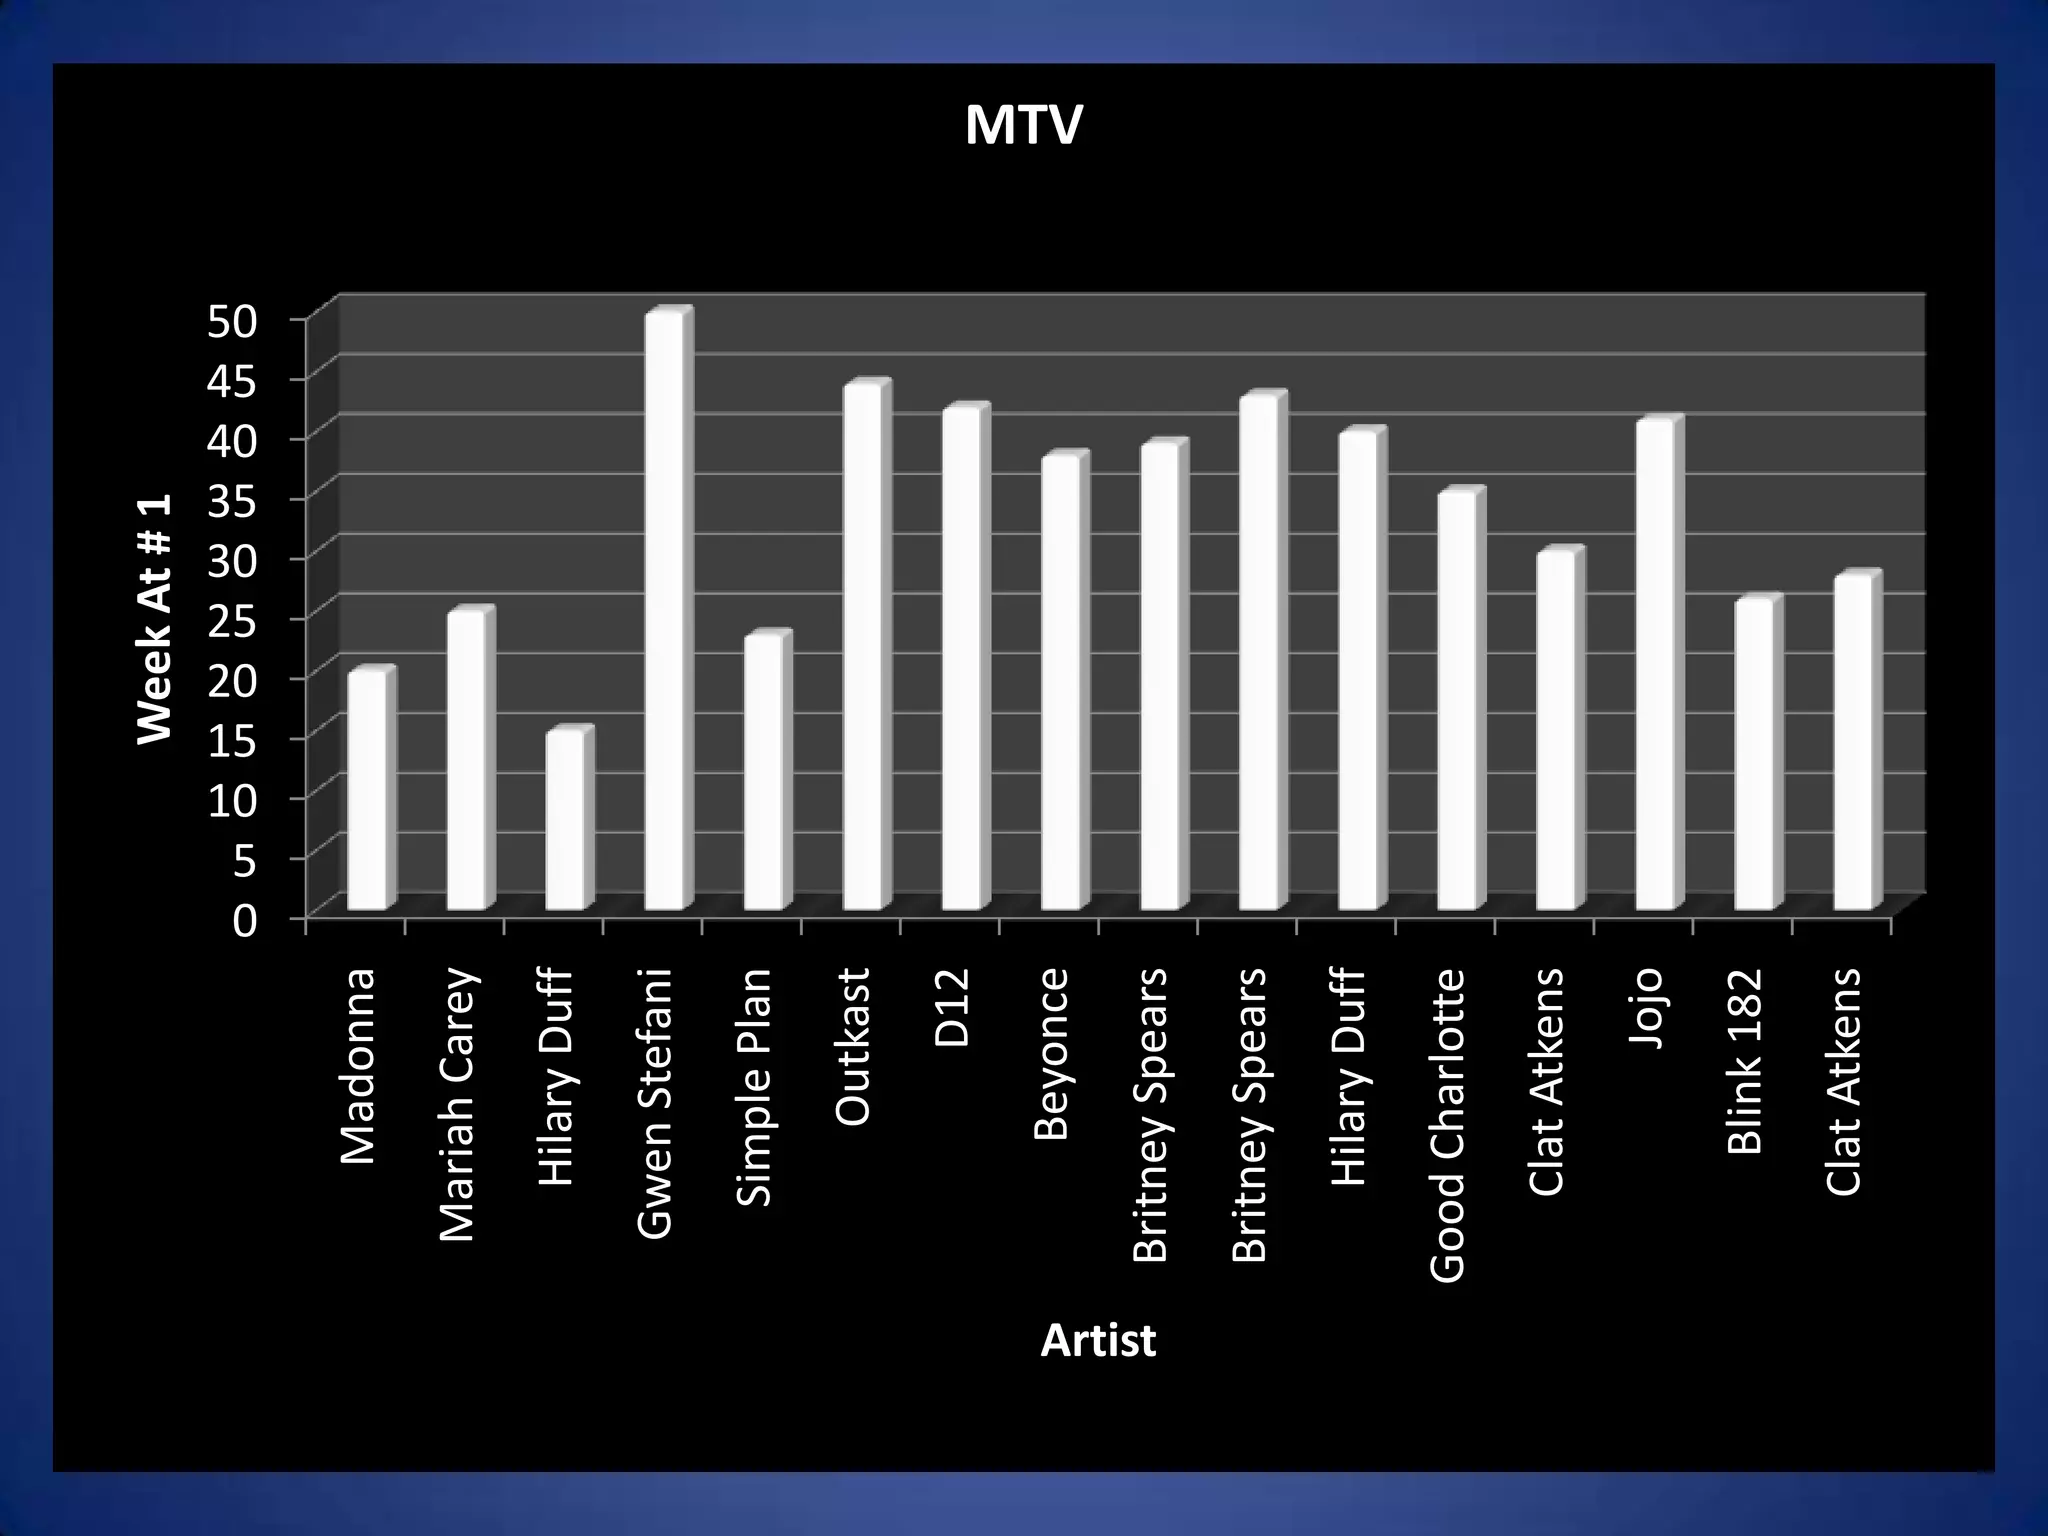
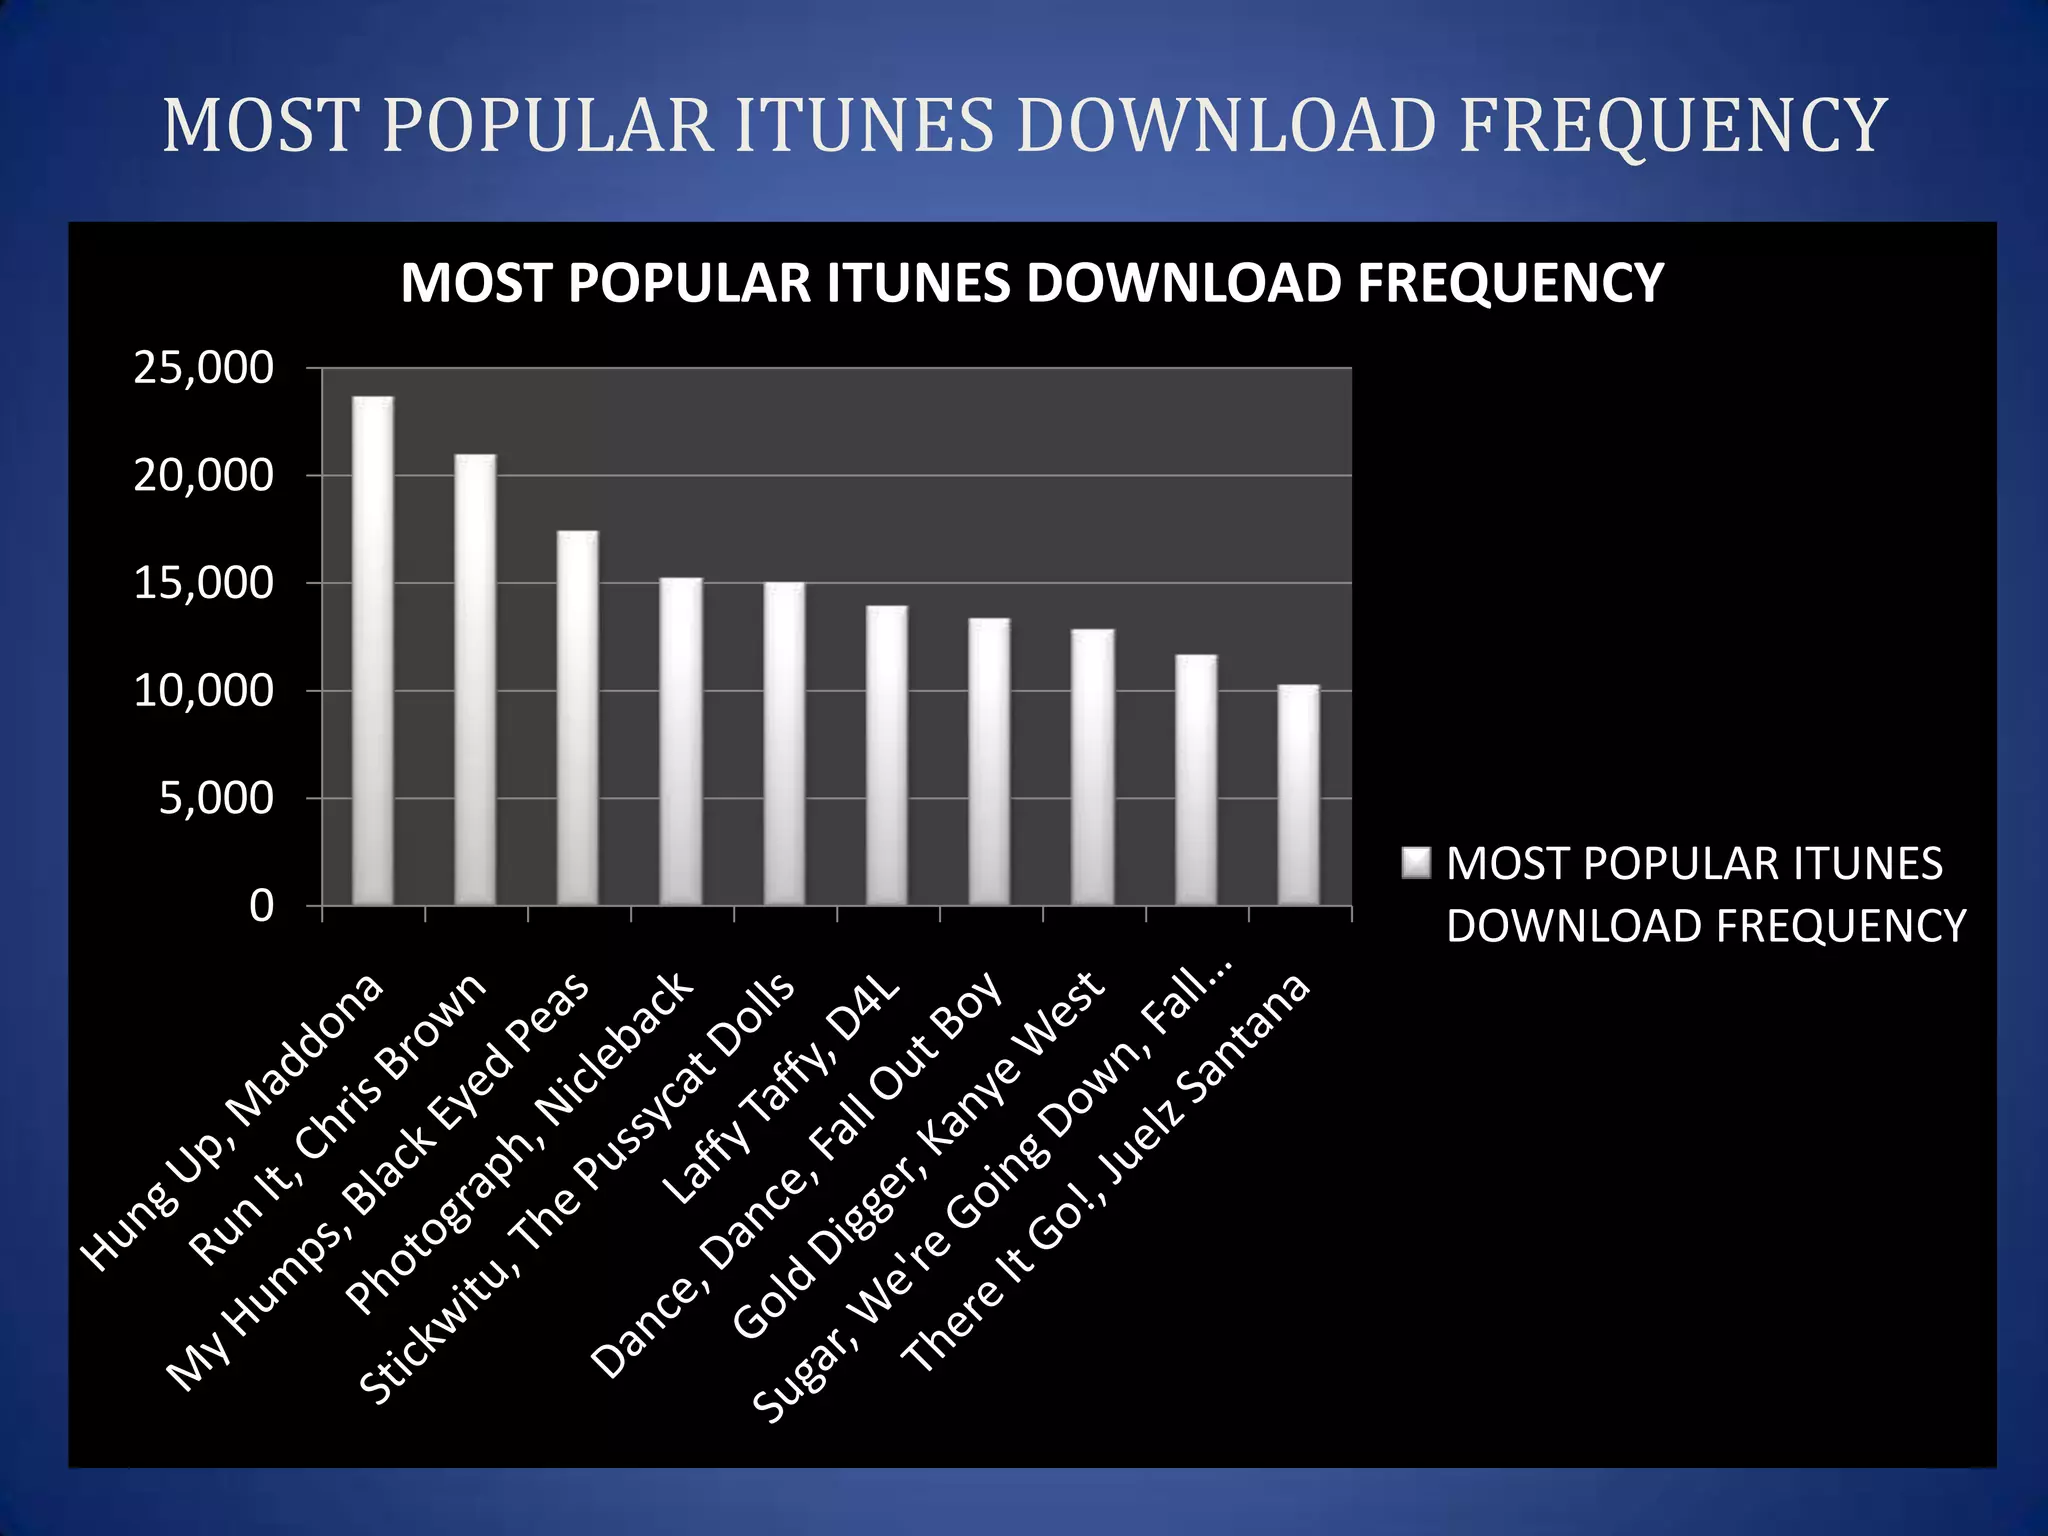
Choosing the Right Graph

      Excel Graphs and its many Uses.
Chart Title


                                     3%
                                3%        8%                                Infinite Crisis
                           3%
                                                                            New Avengers
                    3%                             5%
                                                                            All Star Superman
               3%
                                                                            New Avengers Illuminati Sp
                                                             4%             Superman Batman
          3%
                                                                            Ultimates 2
     3%                                                                     Amazing Spider-man
                                                                  4%
                                                                            Green Lantern
3%
                                                                            Uncanny X-men
                                                                       4%
                                                                            Infinite Crisis Secret Files 2006
3%
                                                                            Uncanny X-men
                                                                   4%       X-men
                                                                            Ultimate Extinvtion
                                                                            Wolverine
                                                                  4%
                                                                            X-men Deadly Genesis

                                                             3%             Ultimate Spider -Man
                                                                            Ms. Marvel
                                                        3%
                                                                            Ultimate X-Men
                         31%                      3%                        Ultimate Spider -Man
                                                                            Batman
Reason I Chose Graph
• I chose the pie graph for this data because it
  shows the percentages and the average of
  each comic book sale.
Week At # 1


                            0
                            5
                           10
                           15
                           20
                           30
                           35
                           40
                           45
                           50


                           25
              Madonna
          Mariah Carey
             Hilary Duff
          Gwen Stefani
            Simple Plan
                Outkast
                   D12
               Beyonce
                                         MTV


Artist
         Britney Spears
         Britney Spears
             Hilary Duff
         Good Charlotte
            Clat Atkens
                   Jojo
              Blink 182
            Clat Atkens
Reason I Chose Graph
• Chose the bar graph for the data is because it
  compares each other artist to its week at the
  top of number one each week .
MOST POPULAR ITUNES DOWNLOAD FREQUENCY
         MOST POPULAR ITUNES DOWNLOAD FREQUENCY
25,000

20,000

15,000

10,000

 5,000
                                        MOST POPULAR ITUNES
    0                                   DOWNLOAD FREQUENCY
Reason Chose Graph
• The reason I chose using a bar graph is to
  show how much sales the song sold in all.
History of the X Games # of People in Attendance
             History of the X Games # of People in Attendence
300000


250000


200000


150000                                            History of the X Games # of
                                                  People in Attendence
100000


50000


     0
         0     2         4         6         8
Reason Chose Graph
• I chose this graph because it is easy to show
  the history of the X-Games and the number of
  people that attended each year.
Definitions Of Graphs
• Bar Graph - Bar graphs are used for marking clear
  data which has learned values.

• Line Graph- Shows plot changes in data over time

• Pie Graph- to shows percentages in the data

• Scatter Plot- To show trends in data and plot large
  numbers in data points
Summary
All graphs are important in our lives as we get jobs and
            those jobs require using graphs.
Graphs are useful to us by helping us show data clearer
                and to make work easier.
 Different graphs are for different properties and we
have to read the data carefully to know which graph to
                          use.

Graph project

  • 1.
    Choosing the RightGraph Excel Graphs and its many Uses.
  • 2.
    Chart Title 3% 3% 8% Infinite Crisis 3% New Avengers 3% 5% All Star Superman 3% New Avengers Illuminati Sp 4% Superman Batman 3% Ultimates 2 3% Amazing Spider-man 4% Green Lantern 3% Uncanny X-men 4% Infinite Crisis Secret Files 2006 3% Uncanny X-men 4% X-men Ultimate Extinvtion Wolverine 4% X-men Deadly Genesis 3% Ultimate Spider -Man Ms. Marvel 3% Ultimate X-Men 31% 3% Ultimate Spider -Man Batman
  • 3.
    Reason I ChoseGraph • I chose the pie graph for this data because it shows the percentages and the average of each comic book sale.
  • 4.
    Week At #1 0 5 10 15 20 30 35 40 45 50 25 Madonna Mariah Carey Hilary Duff Gwen Stefani Simple Plan Outkast D12 Beyonce MTV Artist Britney Spears Britney Spears Hilary Duff Good Charlotte Clat Atkens Jojo Blink 182 Clat Atkens
  • 5.
    Reason I ChoseGraph • Chose the bar graph for the data is because it compares each other artist to its week at the top of number one each week .
  • 6.
    MOST POPULAR ITUNESDOWNLOAD FREQUENCY MOST POPULAR ITUNES DOWNLOAD FREQUENCY 25,000 20,000 15,000 10,000 5,000 MOST POPULAR ITUNES 0 DOWNLOAD FREQUENCY
  • 7.
    Reason Chose Graph •The reason I chose using a bar graph is to show how much sales the song sold in all.
  • 8.
    History of theX Games # of People in Attendance History of the X Games # of People in Attendence 300000 250000 200000 150000 History of the X Games # of People in Attendence 100000 50000 0 0 2 4 6 8
  • 9.
    Reason Chose Graph •I chose this graph because it is easy to show the history of the X-Games and the number of people that attended each year.
  • 10.
    Definitions Of Graphs •Bar Graph - Bar graphs are used for marking clear data which has learned values. • Line Graph- Shows plot changes in data over time • Pie Graph- to shows percentages in the data • Scatter Plot- To show trends in data and plot large numbers in data points
  • 11.
    Summary All graphs areimportant in our lives as we get jobs and those jobs require using graphs. Graphs are useful to us by helping us show data clearer and to make work easier. Different graphs are for different properties and we have to read the data carefully to know which graph to use.