SlideShare a Scribd company logo
1 of 14
Download to read offline
THE IMPACT OF DEBT CRISIS ON PERFORMANCE
OF FIRMS IN SLOVAKIA
Antonia FICOVA
PhD Candidate at Faculty of Economics and Business, Pan European
University, 85105 Bratislava, Slovakia, antoniaficova@hushmail.com,
+421 918 216 381
Juraj SIPKO
Assoc. Prof. at Faculty of Economics and Business, Pan European
University, 85105 Bratislava, Slovakia, juraj.sipko@gmail.com,
+421 2 6820 3615
Abstract
The paper explores impact of debt crisis on corporate firms with 3000-3999 employees in
Slovakia. First, we examine at 95 percent probability of following variables: profit (€),
working capital (million €), revenue (€), return on equity (%), return on assets (%), net
debt/ebitda, investment, cash (€), capital expenditure (€), assets (%). We found that 91.27
percent of the variance of debt ratio is being explained by changes in the variables x, model is
high significant. Second, we explore performance of firms in comparison between 2010 and
latest available data of 2013. Findings indicate an increase of assets. Conclusions pointed out
that if a firm want to increase their financial performance, it is necessary to make changes in
time.
Keywords
Debt Crisis, Performance, Firms, Corporate Finance
JEL classification
C12, C58, E20, F65
1 INTRODUCTION
Main causes of debt crisis are following factors: high structural debt before crisis,
exacerbated by ageing population in many european countries, recession causing sharp rising
in budget deficit, credit crunch causes losses for commercial banks. In short, eurozone
countries with debt problems are also generally uncompetitive with a higher inflation rate and
higher labour costs. This means there is less demand for their exports, higher current account
deficit and lower economic growth.
In context of corporate sector, we identified causes in as follows: existence of moral
hazard in the financial sectors, weak institutional frameworks, and those pursuing the
possibility of unstable (international) financial markets.
However, the culture of the company should reflect what the company is aiming to
achieve and which should be part of their mission statement. In sum, all companies are in
business to make money, in this light their approach may differ and is more likely to be
dictated by the market that they target. For example, in an airline business one may target
premium business class, low cost, or both. Depending on the targeted market segment, the
company should have operational objectives and goals that they should be working on
tirelessly to achieve. Since these goals are linked to the mission statement, the completion of
goals will move the company closer to their objectives.
Moreoever, when firms assess their risk culture, align their performance metrics with
business strategy and risk appetite, and link those metrics to compensation is as much art as
science, more to the point investment in data and systems continues to be a significant
challenge.
Survey conducted by Ernst and Young (2013), seventy-six firms across 36 countries
participated in their study, showed that the challenge is twofold, requiring both buy-in
throughout the organization and the tools to monitor and assess that buy-in. Fifty-nine percent
of survey respondents cited the balance between a sales-driven front-office culture and a risk-
focused culture as their top organizational challenge; 38% cited a lack of systems and data,
the second most frequent challenge raised. On the other hand, Chief Risk Officers noted that
without adequate risk data and systems, accountability for risk is undermined and can damage
the culture. More to the point, 43% of banks said they have achieved a strong culture, banks
are taking different approaches to assessing risk culture, more than 85% of North American
banks have programs to assess internal culture, and the figure is similar for Latin America. In
Europe and Asia-Pacific, 60% or more of banks have programs to assess internal risk culture.
In short, capital management is being rethought across the industry. With regulatory capital
now much higher than economic capital, 55% of respondents said they are aligning capital
allocation with regulatory capital. Eighty-three percent reported they have placed a greater
focus on managing capital by entities or geographies.
The fundamental background of debt crisis and impact on finance, firms, etc. is
examined in literature since 2007. More recent studies have drawn attention to the
relationships between on the one hand, the type of firm assets being financed, the risks of
different types of business and the role of taxes and bankruptcy costs and on the other hand
firm financing patterns.
Exempli gratia, Corsetti et al. (1998), for example, mention weak corporate
performance and risky financing patterns as important causal factors for the East Asian
financial crisis. Krugman (1999) argues that company balance sheet problems may have a role
in causing the East Asian financial crisis, independently of macro-economic or other
weaknesses, including a poor performance of the corporate sector itself. Claessens, S.,
Djankov, S., Nenova, T. (2000) showed that corporations’ financial and operating structures
relate to the institutional environments in which they operate. They suggest that the financing
patterns of the corporate sector across countries reflect countries’ institutional environments.
They pointed out the importance of constructing useful and operational measures of corporate
sector risk, at the micro level, in addition to monitoring sectoral and countrywide economic
risks. Their insights gained in this study can also be utilized in future models of corporate
behavior as regards the use of external financing.
Many of the more recent theoretical models of crises are rooted in problems associated
with the collateral that backs up corporate borrowing. Gertler, M., Gilchrist, S., Natalucci, F.
M. (2000) show that microeconomic rigidities can amplify corporate balance sheet channels
in an open economy framework. Mulder, Perrelli, and Rocha (2001) found that the corporate
indicators of leveraged financing, short-term debt to working capital and shareholders rights
help predict crises. Davis, E. P. and Stone, M. S. (2004) analyzed the impact of financial
criseson corporate financing and GDP in a range of countries. In other words, post-crisis GDP
contractions are mainly accounted for by declines in investment and inventory and are more
severe for emerging market countries. More to the point, post-crisis investment and inventory
declines are correlated with the corporate debt-equity ratio. They found that the average level
of corporate financing differs markedly between country groups, with emerging market
corporate sectors being more dependent on external finance and also more dependent on
banks.Their econometric analysis suggests that financial crises have a greater and more
consistently negative impact on corporate sectors in emerging markets than in industrial
countries, although even in the latter the impact is not negligible. Industrial countries benefit
from the existence of multiple channels of intermediation, in that bond issuance is shown to
pick up in the wake of banking crises. Duchin, R., Ozbas, O., Sensoy, B. A. (2009) presented
the effect of the recent financial crisis on corporate investment. In other words, the crisis
represents an unexplored negative shock to the supply of external finance for non-financial
firms. They found that corporate investment declines significantly following the onset of the
crisis, controlling for firm fixed effects and time-varying measures of investment
opportunities, moreoever corporate investment declines by 6.4% of its unconditional mean
following the onset of the crisis, specifically by 0.109% of assets relative to an unconditional
mean of 1.695% of assets (per quarter). However, their results are largely explained by
changing investment opportunities captured by Q and cash flow, on the other hand their
measure of cash reserves has an insignificantly positive effect on investment.
Trebesch, Ch. (2009) proposed a new empirical measure of cooperative versus
conflictual crisis resolution following sovereign default and debt distress. His findings
indicate that unilateral, aggressive sovereign debt policies lead to a strong decline in corporate
access to external finance (loans and bond issuance). He concluded that coercive government
actions towards external creditors can have strong signalling effects with negative spillovers
on domestic firms. Berger, A. N. - Bouwman, H.S. Ch. (2009) examined what does capital do
for banks around financial crises. They examined the effect of pre-crisis bank capital ratios on
banks’ ability to survive financial crises, and on their competitive positions, profitability, and
stock returns during and after such crises. Their evidence suggests that capital helps small
banks to survive banking and market crises, and helps medium and large banks to survive
banking crises. Moreover, the manner in which a bank exits when it does not survive a crisis
also depends on its pre-crisis capital ratio.
Brown, M., Lane, P. R. (2011) assessed the extent to which debt overhang poses a
constraint to economic activity in Emerging Europe. Flannery, M .J. - Hankins, K. W. (2013)
presented dynamic panel models that play a natural role in several important areas of
corporate finance, but the combination of fixed effects and lagged dependent variables
introduces serious econometric bias. In other words, no one has evaluated the methods'
performance with corporate finance data, in which the dependent variable may be clustered or
censored and independent variables may be missing, correlated with one another, or
endogenous. They found that the data's properties substantially affect the estimators'
performances. João, P., Coutinho dos Santos, João, M. (2014) examined the financial
characteristics of structured finance (SF), either project finance loans or asset securitization
bonds, and straight debt finance (SDF), corporate bonds. They found that project finance
loans have higher credit spreads (198.3 bps) than asset securitization bonds (148.9 bps) and
corporate bonds (157.6 bps) and that average credit spreads for asset securitization and
corporate bond issues do not differ significantly.
1.1 The Objectives
The research objectives of this paper are presented as follows: What is the impact of
debt crisis on the corporate finance of the firms with 3000-3999 employees in Slovakia? What
is dependency of working capital, investment, capital expenditure, cash, profit, revenue,
return on equity, return on assets, net debt/EBITDA, assets on debt ratio of observing firms on
the Slovak market? Is there an increase of performance of observed firms in comparison
between 2010 and data of 2013?
1.2 Data and Methodology
This paper describes the impact of debt crisis on firms with 3000-3999 employees in
Slovakia. First, we observe 42 variables during period of 2010-2013, =0,05. Second, we
examine performance of firms in comparison between 2010 and latest available data of 2013.
This has been done by illustrations and calculations by author by using economic software
Eviews, moreover by using available data from official websites of firms on Slovak market,
data used from Statistical Office of the Slovak Republic, financial data from FinStat. In
addition to this, we present the estimations by using Ordinary Least Squares (OLS),
correlation matrix, The ‘Student’ t-test distribution with (N−1) degrees of freedom, normality
test, the two-sample t-test for mean value.
1.3 Structure of the Study
This paper is organized as follows: Section 2 presents briefly facts about Slovakia´
growth, business confidence, why more indebted countries are expected to see their cost of
debt financing increasing. Ergo, the main contribution of this paper is contained in section 3
that provides examined hypotheses of observed variables, etc. Section 4 concludes the paper.
2 LITERATURE REVIEW
Slovakia does not have an external competitiveness problem, although the
repercussions of maintaining competitiveness with productivity increases in existing
enterprises and wage restraint for domestic demand are not taken into account, thereby
overestimating the underlying strength of export capacity presented by IMF (2012).
In this light, the Slovak economy has become strongly dependent on foreign demand,
especially from Germany and the euro area. In other words, business cycles in the industries
concerned are often more pronounced than in other industries, especially services. During the
past decade, Slovakia has performed a successful restructuring strategy. GDP Growth Rate in
Slovakia averaged 0.93% from 1997 until 2014, reaching an all time high of 9% in the fourth
quarter of 1998 and a record low of -7.60% in the first quarter of 2009 to 0.6% in Q1 2014
reported by the Statistical Office of the Slovak Republic. Moreoever, export industries have
received special attention. Foreign investments in the automotive and electronic sectors have
been the main source of the recent expansion. Main export partners are Euro Area members
with German, Czech Republic, France and Poland being the most important. However, the
biggest share of Slovakian imports are machinery and transport equipment, intermediate
manufactured goods, fuels and chemicals and main import partners are Germany, Czech
Republic, Russia and Hungary.
Slovakia recorded a trade surplus of 233 EUR million in august of 2014, on the other
hand, balance of trade in Slovakia decreased by 51.13 EUR million from 1993 until 2014.
Business Confidence in Slovakia increased to 5 in September of 2014 from 4.30 in August of
2014. Manufacturing Production in Slovakia increased 2.30 percent in August of 2014 over
the same month in the previous year. Industrial Production in Slovakia increased 2.70 percent
in August of 2014 over the same month in the previous year. Government Debt to GDP in
Slovakia is 55.40 percent of the country's Gross Domestic Product in 2013.
Nothwithstanding, financial systems presented by Davis, E. P. and Stone, M. S. (2004)
seem to go through stages of development in which corporate sources of financing are mainly:
(i) internal, (ii) banks due to information collection efficiencies, (iii) equity issuance for more
diversity, and (iv) bonds when information collection costs become sufficiently low.
If we look at flow data capture, the sources of financing for corporate sectors across
the country groups are in many cases over an extended time period. Moreover, the net
financing/GDP flows data gauge the change in the net financial position of the aggregate
corporate sector, which is equivalent to its net cash flow. Typically, corporations are net
borrowers because of large investment needs relative to revenue, so that they operate with
negative net financing. On the other hand, gross financing/GDP measures the overall level of
funding to the corporate sector on a gross basis according to the Davis, E. P. and Stone, M. S.
(2004).
Following on the observations of Nerlove (1967), Nickell (1981) established that OLS
estimates of the lagged dependent variable's coefficient in a dynamic panel model are biased
due to the correlation between the fixed effects and the lagged dependent variable. Yet
corporate finance studies include multiple independent variables, of which many exhibit
endogeneity and serial correlation.
However, the best strategy to cope with such debt crisis is to use the optimal
combination of policy ingredients that will minimize the undesirable effects on the economy.
In parallel, the government needs to be prepared for quick reactions to any new situation. In
this context, financial sector, creation of government deposit guarantees might be very useful,
together with the suspension of deposits convertibility, and the adoption of an effective
deposit insurance system.
In this regard, the financial contagion may induce a sectoral contagion: if liquidity
shortages persist, a systemic impact is likely to happen in non‐financial sectors. The recent
substantially increased number of liquidity interventions by central banks raise the uncertainty
of the final outcome of the debt crisis because we cannot know for sure whether we face a
problem of illiquidity or one of insolvency in the system.
However, more indebted countries are expected to see their cost of debt financing
increasing, since the financial system of countries hit by the crisis is rebalancing its portfolio
of assets into positions that are less risky. In this light, this has a negative impact and
developing countries because it could raise on debt valuation of emerging their cost of
indebtedness. In sum, better and careful monitoring over the internal financial system of the
firm, even if the system seems healthy and not affected by contagion. Prevention, rather than
curing, is the right policy in these times.
Corporate sector indicators are useful for assessing the potential impact of exchange
rate and interest rate changes on corporate sector balance sheets. The monitoring through the
two indicators of exposure could be complemented by indicators related to corporate leverage,
profitability, cash flow and financial structure.
Viewed in this light, there are at least two causal channels according to the Trebesch,
Ch. (2009) by which sovereign debt distress can affect private sector external borrowing in
emerging market countries. First, demand effects, default periods often coincide with output
losses and lower domestic demand, this can lead to a drop in production, investment and
profits, which may be further reinforced by banking sector stress. As a result, firms may
demand less credit. Second, the drop in corporate external credit may be attributable to supply
effects. In sum, sovereign defaults might worsen country risk perceptions as a whole, increase
risk premia on all new loans to domestic agents and thereby reduce private sector external
debt issuance.
3 HYPOTHESES
Based on data analyzed for the paper, we developed following hypotheses. Results are
demonstarted in this section.
3.1 Testing Hypothesis I.
At this point, we want to examine the dependence, moreover how changes in
following factors x: profit (€), working capital (million €), revenue (€), return on equity (%),
return on assets (%), net debt/ebitda, investment ((Capital expenditure/assets), cash (€),
capital expenditure (€), assets (%) may affected debt ratio of observing firms on the Slovak
market. In other words, we use data of 12 slovak firms with 3000-3999 employees during
period from 2010 till 2013, due to fact that it is period after debt crisis. In other words, we use
data from websites of firms on Slovak market, data used from Statistical Office of the Slovak
Republic, data from the Business register that is operated by the Ministry of Justice and
financial data from FinStat. The question is: How debt crisis affected corporate finance of
observed firms that are mentioned below.
We collected financial data of firms from following industries: Chemicals & Plastics
(Slovnaft, a.s.); Automotive industry (Kia Motors Slovakia s.r.o., Yazaki Wiring
Technologies Slovakia s.r.o.); Telecommunications (Slovak Telekom, a.s.); Metal production
and metallurgy (Železiarne Podbrezová a.s.); Retail sale (Lidl Slovenská republika, v.o.s.);
Engineering (INA Kysuce, spol. s r.o.); Law, Consulting, Accounting (IBM International
Services Centre s.r.o.), Mining (Hornonitrianske bane Prievidza, a.s.); Financial sektor
(Všeobecná úverová banka, a.s.; VÚB, a.s., Tatra banka, a.s., Slovenská sporiteľňa, a.s. SLSP,
a.s.). We use method of least squares by using economic software Eviews, N=42 at 95 percent
of probability, =0,05; see bellow.
1: Ordinary Least Squares (OLS) of Debt ratio
Dependent Variable: DEBT RATIO
Method: Least Squares
Sample: 1 42
Included observations: 42
Variable Coefficient Std. Error t-Statistic Prob.
PROFIT 0.039 0.046 0.842 0.406
WORKING CAPITAL -0.022 0.004 -5.231 0.000
REVENUE 0.000 0.002 0.195 0.846
RETURN ON EQUITY 0.690 0.113 6.096 0.000
RETURN ON ASSETS -2.122 0.713 -2.972 0.005
NET DEBT EBITDA 1.886 3.065 0.615 0.542
INVESTMENT -0.002 0.004 -0.654 0.517
CASH 0.010 0.005 1.978 0.056
CAPITAL EXPENDITURE 13.477 6.157 2.188 0.036
ASSETS 0.005 0.000 6.661 0.000
C 41.348 4.090 10.1086 0.000
R-squared 0.913 Mean dependent var 57.085
Adjusted R-squared 0.884 S.D. dependent var 25.323
S.E. of regression 8.609 Akaike info criterion 7.363
Sum squared resid 2297.627 Schwarz criterion 7.818
Log likelihood -143.636 Hannan-Quinn criter. 7.530
F-statistic 32.375 Durbin-Watson stat 1.595
Prob(F-statistic) 0.000
Source: Author´s estimation.
In short, we get following estimation equation of model:
Debt ratio = β0 + β1*profit - β2*working capital + β3*revenue + β4*return on equity –
β5*return on assets + β6* net debt ebitda – β7* investment + β8*cash+ β9*capital expenditure
β10* assets
And after substituted coefficients we get formula as follows:
Debt ratio = 41.349 + 0.039*profit - 0.022*working capital + 0.000*revenue + 0.690*return
on equity – 2.122*return on assets + 1.886* net deb/ebitda – 0.002* investment +
0.010*cash+ 13.477*capital expenditure + 0.005* assets
According to the results of OLS at 95% confidence level, which are presented in Table
1 above show, that coefficient of determination R2
= 0.913 indicates that 91.27% of the
variance of the endogenous variable (debt ratio) is being explained by changes in the variables
x, that shows changes in profit, working capital, investments, revenue, etc., in short that
means positive linear relationship. On the other hand, 8.74% of changes in the debt ratio of
the firms are affected by other variables that are not included in this model, for example rate
of economic growth of the country, inflation, government restrictions (higher taxe rate,
exchange rate, interest rate), etc.
The significance of the model, prob (F-statistic) is 0.000000<0.01; what is high
statistically significant (++). The parameter β is high statistically significant because the P-
value is 0.0000<0.01; (++). The parameter x2, x4, x5, x8, x9, x10 are high statistically significant
because of the P-value. For N = 42, k = 10, and significant level = 5%, the significant Durbin-
Watson statistic dL is 0.749, dU is 1.956. Since the Durbin-Watson d statistic, 4-1.595=2.405,
a value near 2 indicates non-autocorrelation in this model.
Viewed in this light, organizations do not have ability to borrow money as much as
they want in some cases. Many factors are involved which stops them to borrow but the main
factor is the growth of the company. Moreover, if the company growth is on the track their
debt level would be high and if the company growth level is not on track then their debt level
would be low. In sum, generally it can be concluded that when company increase their debt
level there should be positive impact on growth of the firm. As this paper found that company
return on equity, return on assets, total assets, profit is attached with debt portion of company
positively, so those companies having high leveraged company should decrease their debt
portion for increasing their assets to maintain the growth in market.
However, at this point we present illustrations of significant variables below.
Moreover, the data are displayed as a collection of points, each having the value of one
variable determining the position on the horizontal axis and the value of the other variable
determining the position on the vertical axis. If the pattern of dots slopes from lower left to
upper right, it suggests a positive correlation between the variables being studied, e. g. debt
ratio and return on equity, debt ratio and return on assets, debt ratio and assets. If the pattern
of dots slopes from upper left to lower right, it suggests a negative correlation, e.g . debt ratio
and working capital, debt ratio and cash, see below.
10
20
30
40
50
60
70
80
90
100
-40 0 40 80 120 160 200 240
PROFIT
Debtratio
10
20
30
40
50
60
70
80
90
100
0 400 800 1,200 1,600 2,000
Working Capital
Debtratio
10
20
30
40
50
60
70
80
90
100
-20 0 20 40 60 80 100
Return on equity
Debtratio
10
20
30
40
50
60
70
80
90
100
-4 0 4 8 12 16 20 24
Return on assets
Debtratio
10
20
30
40
50
60
70
80
90
100
0 200 400 600 800 1,000 1,400
CASH
Debtratio
10
20
30
40
50
60
70
80
90
100
-0.4 0.0 0.4 0.8 1.2 1.6 2.0 2.4
Capital expenditure
Debtratio
10
20
30
40
50
60
70
80
90
100
0 2,000 4,000 6,000 8,000 10,000 12,000
ASSETS
Debtratio
Source: Author´s estimation by using Eviews.
1: Simple Scatter Graphs of significant variables
3.2 Testing Hypothesis II.
The question is: Is means of performance of the firms in 2010 are the same as means
of performance of the firms in 2013 after debt crisis? At this section, we want to examine
whether performance is the same, or we see an increase of following variables: assets,
working capital, investment, capital expenditure, cash, profit, revenue, return on equity, return
on assets, debt ratio, net debt/EBITDA in comparison between 2010 (file Z) and latest
available data of 2013 (file Y).
At this point, we use Normal Quantile Plot - Test for Non-Normality, we formulate
hypothesis as follows:
H0: Data are normally distributed.
H1: Data are NOT normally distributed.
4: Test for Non-Normality
Sample Size
Critical Value Critical Value Critical Value
Using  = .01 Using  = .05 Using  = .10
File Z; 11 0.887 0.923 0.938
File Y; 11 0.887 0.923 0.938
Correlation
Coefficient r Conclusion Using
=0.01
Conclusion Using
=0.05
Conclusion
Using =0.100.945
0.973 Accept H0 Accept H0 Accept H0
Source: Author´s estimation.
As a computed r value is greater than the significance level =0.01, 0.05, 0.10 we
accept null hypothesis, it can be concluded that both files Z; Y are normally distributed.
Than, we use parametric test, method The ‘Student’ t-test distribution with (N−1)
degrees of freedom, mean test of correlation with a known constant by using the two-sample
t-test for mean value.
n
s
d
t
d
d
.

 (1)
Indicates significance at the 5 percent level, =0,05. We formulate our hypothesis as follows:
H0 : 021  mm
H1 : 021  mm
If we assume that the mean of values of performances in 2010 and assets in 2013 are equal,
that means that performance of the firms is the same, then the value will be 0d .
5: The two-sample t-test for mean value
Assets in
2010
file (Z)
Assets in
2013
file (Y)
Mean 249.731 331.750
Variance 118789.161 282435.484
Observations 10 10
Correlation 0.951
Difference 9
t stat -1.128
P(T<=t) (1) 0.144
t crit (1) 1.833
P(T<=t) (2) 0.288
t crit (2) 2.262
Source: Author´s estimation.
Results coming out from t-test depicted in Table 4:
-1.128< 1.833→ t < tc.
That leads to the conclusion that the difference between the hypothesized
performances of the firms mean is small enough to accept null hypothesis. In short, that
means this method showed that difference in observed files Z and Y are statistically
insignificant. In short, it is due to random selection of observed data in files. On the other
hand, we may say that difference of variables that are mentioned in the beginning of this
hypothesis, showed that during period 2010 and 2013 performance of the firms could be
caused through necessary changes after debt crisis that has an impact on financial markets due
the fact of implementing different strategies of the firms. In sum, because the differences are
random in the average of performances, i.e. greater than 0.05 (or 5 percent), it can be
concluded that there is no difference between the means.
Nonetheless, assets of firms decreased by 26.49 percent from 3 428, 129 milion € in
2010. On the other hand, investments of firms increased by 180.21 percent since 2010.
Revenue increased from 903.699 (milion €) to 1411.578 (milion €) in 2013.
7: Summary Statistics
Table reports summary statistics for the primary variables used in this paper since 2010-2013.
ASSETS
WORKING
CAPITAL
INVESTME
NT
CAPITAL
EXPENDIT
URE CASH PROFIT REVENUE
RETURN
ON
EQUITY
RETURN
ON
ASSETS DEBT RATIO
NET DEBT
EBITDA
Mean 2928.963 643.470 826.548 0.746 87.896 60.019 1209.200 16.445 4.414 57.085 -0.226
Median 1144.706 391.576 166.768 0.726 10.372 38.248 484.3491 9.400 2.400 50.100 -0.025
Maximum 11777.34 1667.070 4395.239 2.034 1575.000 230.857 7838.252 99.100 21.400 91.600 0.940
Minimum 44.659 5.748 -114.275 -0.010 0.000 -26.395 109.657 -1.900 -1.200 17.800 -1.780
Std. Dev. 4053.201 579.639 1432.271 0.701 259.818 68.354 1757.420 21.627 4.480 25.323 0.545
Skewness 1.309 0.421 1.671607 0.317 4.807 1.037 2.094 2.474 1.801 0.032 -0.802
Kurtosis 2.979 1.639 4.059 1.706 27.158 2.968 6.732 8.846 6.663 1.654 4.434
Jarque-Bera 12.007 4.480 21.524 3.630 1183.111 7.541 55.099 102.672 46.211 3.173 8.107
Probability 0.002 0.106 0.000 0.162 0.000 0.023 0.000 0.000 0.000 0.204 0.017
Sum 123016.4 27025.76 34715.02 31.336 3691.641 2520.812 50786.39 690.700 185.400 2397.600 -9.520
Sum Sq. Dev. 6.74E+08 13775272 84107433 20.163 2767738. 191567.2 1.27E+08 19176.94 823.051 26293.05 12.207
Observations 42 42 42 42 42 42 42 42 42 42 42
Source: Author´s estimation according to financial data of observed firms by using economic software Eviews.
8: Correlation Matrix
Panel B reports correlations among the variables.
ASSETS
WORKING
CAPITAL
INVESTME
NT
CAPITAL
EXPENDITURE CASH PROFIT REVENUE
RETURN
ON EQUITY
RETURN ON
ASSETS DEBT RATIO
NET DEBT
EBITDA
ASSETS 1
WORKING CAPITAL 0.537 1
INVESTMENT -0.141 0.355 1
CAPITAL
EXPENDITURE -0.495 -0.156 0.7611 1
CASH -0.092 0.183 0.262 0.149 1
PROFIT 0.776 0.547 0.069 -0.235 -0.014 1
REVENUE -0.073 0.388 0.933 0.673 0.231 0.203 1
RETURN ON EQUITY -0.129 -0.382 -0.177 0.254 -0.132 -0.055 -0.170 1
RETURN ON ASSETS -0.396 -0.395 -0.043 0.436 -0.079 -0.056 -0.019 0.742 1
DEBT RATIO 0.611 -0.125 -0.201 -0.109 -0.096 0.427 -0.168 0.494 0.063 1
NET DEBT EBITDA 0.124 -0.345 -0.242 -0.041 -0.232 0.087 -0.173 0.362 0.165 0.472 1
Source: Author´s estimation according to financial data of observed firms by using economic software Eviews.
Note: Correlation is a numerical representation of the relationship between two things. In short, 1.0 means perfect correlation, 0 to 1 means that the two variables tend to
increase or decrease together, -1 to 0 means that one variable increases as the other decreases. For example correlation between debt ratio and assets is 0.611, increase
together.
4 CONCLUSION
We identified that coefficient of determination is 0.913 indicates that 91.27% of the
variance of the endogenous variable (debt ratio) is being explained by changes in the variables
x, in short the significance of F is 0.000000<0.01; what is high statistically significant (++).
Then we explored performance of firms during period 2010 and 2013, what could by caused
by different strategy of each firm. We found that firm´s return on equity, return on assets, total
assets, profit is attached with debt portion of company positively, so those companies having
high leveraged company should decrease their debt portion for increasing their assets to
maintain the growth in market. In other words, if company debt ratio increases, there is
negative correlation on the growth of the company, more to the point on working capital,
investment, capital expenditure, revenue.
In sum, in this paper firm’s performance has been discussed with debt of the company,
on the other hand found that is very important factor towards company success but other
factors can also be checked in future with the firm’s debt capacity. For future research work
can be done on what specific portion of debt capacity should use by the companies to keep
firms on track.
In short, debt crisis may lead to a generalized systemic crisis through worsened
conditions for local credits and through a decline of the demand in the world real economy.
We suggest that, if a firm want to increase their financial performance, it is necessary to make
changes as follows: if we look at cash flow, extend payment terms (Purchasing), reduce
collection terms (credit), support customers with credit facilities (i.e. factoring) granting an
affordable prompt payment discount, outlining strategies for identifying / selling idle / non-
core assets (Finance Leadership), identification and disposal of obsolete inventories
(Controllership), operating results, reduce borrowing cost (Treasury), reduce finance
administrative expense (Finance Leadership), permanet review of gross margins (financial
planning), cost containment programs (tracking system). In other words, good planning and
production helps toward maximization of achieving ends with available resources. A costing
team helps firm to analyze costs, volumes, plan profits through fixation of selling prices
which are beneficial to both the buyer and the seller. A accounting team ensures that nothing
goes unaccounted and that things are accounted correctly. It also ensures that statutory norms
are maintained as required.
5 DISCUSSION
The question is: How to achieve growth after debt crisis? More to the point, faster
growth by implementing structural reforms and by improving the efficiency of public
expenditure. This should be an essential part of solution to the EU debt crisis because it
guarantees long term public finance sustainability. However, this is also a hard task because it
requires implementation of unpopular measures. It is important to notice here that after
implementing structural changes even the impact of austerity may be different in the long
term. In short, the unemployment does not have to rise or stay high if there is a flexible labor
market. People may simply get used to work for lower salaries just as they did for centuries
before. Also the social benefits do not have to rise. On the contrary they should be falling if
the public revenues decline. On the other hand, the privatization and reforms in Slovakia
played a major role in attracting foreign investors and generating rapid economic growth that
peaked at 10.5% of GDP in 2007. Over the period 2000-2010 Slovakia had 11 the highest
GDP growth in the EU. This example shows clearly that the structural measures help to
generate economic growth and reduce debt levels.
6 REFERENCES
1. BERGER, A. N., BOUWMAN, H.S. CH., 2009: Bank Capital, Survival, and
Performance around Financial Crises, Wharton Financial Institutions Center, and
Center – Tilburg University, Wharton Financial Institutions Center
2. BROWN, M. - LANE, P. R., 2011: Debt Overhang in Emerging Europe? World Bank
Policy Research Working Paper Series, Vol. , pp. -, 2011
3. CORSETTI, G., - PESENTI, P. - ROUBINI, N., 1998: What Causes the Asian
Currency and Financial Crises? A Macroeconomic Overview, New York University
4. DAVIS, E. P. - MARK, S., 2004: Corporate Financial Structure and Financial
Stability. IMF Working Paper, Vol. , pp. 1-49
5. DUCHIN, R. - OZBAS, O. - SENSOY, B. A., 2009: Costly External Finance,
Corporate Investment, and the Subprime Mortgage Credit Crisis, Journal of Financial
Economics (JFE), Forthcoming; Marshall School of Business Working Paper No.
MKT 01-09; Ross School of Business Paper No. 1121
6. ERNST AND YOUNG, 2013: Remaking financial services: risk management five
years after the crisis, A survey of major financial institutions, EYG No. EK0162,
1303-1045437 BOS, ED 0714
7. FINSTAT, available at: <http://www.finstat.sk˃
8. FLANNERY, M. J. – HANKINS, K. W., 2013: Estimating dynamic panel models in
corporate finance, Journal of Corporate Finance 19 (2013) 1–19
9. GERTLER, M., - GILCHRIST, S. - NATALUCCI, F. M., 2000: External Constraints
on Monetary Policy and the Financial Accelerator, NBER Working Paper No. 10128
(Cambridge, Massachusetts: National Bureau of Economic Research).
10. IGBAL, A. - HAMEED, I. - RAMZAN, N., 2012: The Impact of Debt Capacity on
Firm’s Growth, American Journal of Scientific Research, ISSN 1450-223X, Issue 59,
pp. 109-115
11. IMF, 2012: Slovak Republic: 2012 Article IV Consultation—Staff Report
12. JOÃO, P., COUTINHO DOS SANTOS, JOÃO, M., 2014: Corporate Financing
Choices after the 2007-2008 Financial Crisis
13. KRUGMAN, P., 1999: Balance Sheets, the Transfer Problem, and Financial Crises,
MIT
14. MULDER, CH. - PERRELLI, R. - ROCHA, M., 2001: The Role of Corporate, Legal,
and Macro Balance Sheet Indicators in Crisis Detection and Prevention
15. NENOVA, T. - CLAESSENS, S. - SIMEON D., 2000: Corporate Risk around the
World World, Bank Policy Research Working Paper No. 2271
16. NERLOVE, M., 1967: Experimental evidence on the estimation of dynamic economic
relations from a time series of cross sections, Econ. Stud. Quart. 18, 42–74.
17. NICKELL, S., 1981: Biases in dynamic models with fixed effects, Econometrica 49,
1417–1426.
18. STATISTICAL OFFICE OF THE SLOVAK REPUBLIC, available at
<http://slovak.statistics.sk˃
19. TREBESCH, CH., 2009: The Cost of Aggressive Sovereign Debt Policies: How Much
is the Private Sector Affected? IMF Working Papers, Vol., pp. 1-35

More Related Content

What's hot

Ivo pezzuto "Turning Globalization 4.0 Into a Real and Sustainable Success fo...
Ivo pezzuto "Turning Globalization 4.0 Into a Real and Sustainable Success fo...Ivo pezzuto "Turning Globalization 4.0 Into a Real and Sustainable Success fo...
Ivo pezzuto "Turning Globalization 4.0 Into a Real and Sustainable Success fo...Dr. Ivo Pezzuto
 
The Long-run Determinants of Inequality: What Can We Learn From Top Income Data?
The Long-run Determinants of Inequality: What Can We Learn From Top Income Data?The Long-run Determinants of Inequality: What Can We Learn From Top Income Data?
The Long-run Determinants of Inequality: What Can We Learn From Top Income Data?Stockholm Institute of Transition Economics
 
Bank income structure and risk: An empirical analysis of European banks
Bank income structure and risk: An empirical analysis of European banksBank income structure and risk: An empirical analysis of European banks
Bank income structure and risk: An empirical analysis of European banksPurwo Adi Wibowo
 
Banking deregulation
Banking deregulationBanking deregulation
Banking deregulationDino, llc
 
Proposed topic of the res an emperical analysis on interest rate risk managem...
Proposed topic of the res an emperical analysis on interest rate risk managem...Proposed topic of the res an emperical analysis on interest rate risk managem...
Proposed topic of the res an emperical analysis on interest rate risk managem...tesfatsion tefera
 
The Costs of Political In‡fluence: Firm-Level Evidence from Developing Countries
The Costs of Political In‡fluence: Firm-Level Evidence from Developing CountriesThe Costs of Political In‡fluence: Firm-Level Evidence from Developing Countries
The Costs of Political In‡fluence: Firm-Level Evidence from Developing CountriesStockholm Institute of Transition Economics
 
Aid Effectiveness in Times of Political Change: Lessons from the Post-Communi...
Aid Effectiveness in Times of Political Change: Lessons from the Post-Communi...Aid Effectiveness in Times of Political Change: Lessons from the Post-Communi...
Aid Effectiveness in Times of Political Change: Lessons from the Post-Communi...Stockholm Institute of Transition Economics
 
The relationship between net interest margin and return on assets of listed b...
The relationship between net interest margin and return on assets of listed b...The relationship between net interest margin and return on assets of listed b...
The relationship between net interest margin and return on assets of listed b...Alexander Decker
 
IMPLICATIONS OF M&AS FOR BANKING INDUSTRY. FROM CULTURAL FIT TO CULTURAL CLASHES
IMPLICATIONS OF M&AS FOR BANKING INDUSTRY. FROM CULTURAL FIT TO CULTURAL CLASHESIMPLICATIONS OF M&AS FOR BANKING INDUSTRY. FROM CULTURAL FIT TO CULTURAL CLASHES
IMPLICATIONS OF M&AS FOR BANKING INDUSTRY. FROM CULTURAL FIT TO CULTURAL CLASHESIulian Warter
 
03 14 brennan_merkl-davies_accounting_narratives_and_impression_management
03 14 brennan_merkl-davies_accounting_narratives_and_impression_management03 14 brennan_merkl-davies_accounting_narratives_and_impression_management
03 14 brennan_merkl-davies_accounting_narratives_and_impression_managementasianextractor
 
Doing business in Montenegro 2014 - The World Bank study
Doing business in Montenegro 2014 - The World Bank studyDoing business in Montenegro 2014 - The World Bank study
Doing business in Montenegro 2014 - The World Bank studyAnex Consultancy Montenegro
 
A first analysis and profiling of social enterprises in Sweden prepared by th...
A first analysis and profiling of social enterprises in Sweden prepared by th...A first analysis and profiling of social enterprises in Sweden prepared by th...
A first analysis and profiling of social enterprises in Sweden prepared by th...Stockholm Institute of Transition Economics
 
Tracking Variation in Systemic Risk-2 8-3
Tracking Variation in Systemic Risk-2 8-3Tracking Variation in Systemic Risk-2 8-3
Tracking Variation in Systemic Risk-2 8-3edward kane
 

What's hot (18)

Ivo pezzuto "Turning Globalization 4.0 Into a Real and Sustainable Success fo...
Ivo pezzuto "Turning Globalization 4.0 Into a Real and Sustainable Success fo...Ivo pezzuto "Turning Globalization 4.0 Into a Real and Sustainable Success fo...
Ivo pezzuto "Turning Globalization 4.0 Into a Real and Sustainable Success fo...
 
Political Influence in Transition Economies: Firm Level Evidence
Political Influence in Transition Economies: Firm Level EvidencePolitical Influence in Transition Economies: Firm Level Evidence
Political Influence in Transition Economies: Firm Level Evidence
 
The Long-run Determinants of Inequality: What Can We Learn From Top Income Data?
The Long-run Determinants of Inequality: What Can We Learn From Top Income Data?The Long-run Determinants of Inequality: What Can We Learn From Top Income Data?
The Long-run Determinants of Inequality: What Can We Learn From Top Income Data?
 
Bank income structure and risk: An empirical analysis of European banks
Bank income structure and risk: An empirical analysis of European banksBank income structure and risk: An empirical analysis of European banks
Bank income structure and risk: An empirical analysis of European banks
 
Theary
ThearyTheary
Theary
 
Banking deregulation
Banking deregulationBanking deregulation
Banking deregulation
 
Proposed topic of the res an emperical analysis on interest rate risk managem...
Proposed topic of the res an emperical analysis on interest rate risk managem...Proposed topic of the res an emperical analysis on interest rate risk managem...
Proposed topic of the res an emperical analysis on interest rate risk managem...
 
The Costs of Political In‡fluence: Firm-Level Evidence from Developing Countries
The Costs of Political In‡fluence: Firm-Level Evidence from Developing CountriesThe Costs of Political In‡fluence: Firm-Level Evidence from Developing Countries
The Costs of Political In‡fluence: Firm-Level Evidence from Developing Countries
 
Aid Effectiveness in Times of Political Change: Lessons from the Post-Communi...
Aid Effectiveness in Times of Political Change: Lessons from the Post-Communi...Aid Effectiveness in Times of Political Change: Lessons from the Post-Communi...
Aid Effectiveness in Times of Political Change: Lessons from the Post-Communi...
 
The Costs of Political Influence Firm-Level Evidence from Developing Countries
The Costs of Political Influence Firm-Level Evidence from Developing CountriesThe Costs of Political Influence Firm-Level Evidence from Developing Countries
The Costs of Political Influence Firm-Level Evidence from Developing Countries
 
Aid Effectiveness in Times of Political Change: Lessons from the Post-Communi...
Aid Effectiveness in Times of Political Change: Lessons from the Post-Communi...Aid Effectiveness in Times of Political Change: Lessons from the Post-Communi...
Aid Effectiveness in Times of Political Change: Lessons from the Post-Communi...
 
The relationship between net interest margin and return on assets of listed b...
The relationship between net interest margin and return on assets of listed b...The relationship between net interest margin and return on assets of listed b...
The relationship between net interest margin and return on assets of listed b...
 
IMPLICATIONS OF M&AS FOR BANKING INDUSTRY. FROM CULTURAL FIT TO CULTURAL CLASHES
IMPLICATIONS OF M&AS FOR BANKING INDUSTRY. FROM CULTURAL FIT TO CULTURAL CLASHESIMPLICATIONS OF M&AS FOR BANKING INDUSTRY. FROM CULTURAL FIT TO CULTURAL CLASHES
IMPLICATIONS OF M&AS FOR BANKING INDUSTRY. FROM CULTURAL FIT TO CULTURAL CLASHES
 
03 14 brennan_merkl-davies_accounting_narratives_and_impression_management
03 14 brennan_merkl-davies_accounting_narratives_and_impression_management03 14 brennan_merkl-davies_accounting_narratives_and_impression_management
03 14 brennan_merkl-davies_accounting_narratives_and_impression_management
 
Doing business in Montenegro 2014 - The World Bank study
Doing business in Montenegro 2014 - The World Bank studyDoing business in Montenegro 2014 - The World Bank study
Doing business in Montenegro 2014 - The World Bank study
 
Wp07 3
Wp07 3Wp07 3
Wp07 3
 
A first analysis and profiling of social enterprises in Sweden prepared by th...
A first analysis and profiling of social enterprises in Sweden prepared by th...A first analysis and profiling of social enterprises in Sweden prepared by th...
A first analysis and profiling of social enterprises in Sweden prepared by th...
 
Tracking Variation in Systemic Risk-2 8-3
Tracking Variation in Systemic Risk-2 8-3Tracking Variation in Systemic Risk-2 8-3
Tracking Variation in Systemic Risk-2 8-3
 

Similar to Mendel_University_Brno_Conference_2014

Impact of accounts receivable management on the profitability during the fina...
Impact of accounts receivable management on the profitability during the fina...Impact of accounts receivable management on the profitability during the fina...
Impact of accounts receivable management on the profitability during the fina...Instansi
 
Non-monetary effects Employee performance during Financial Crises in the Kurd...
Non-monetary effects Employee performance during Financial Crises in the Kurd...Non-monetary effects Employee performance during Financial Crises in the Kurd...
Non-monetary effects Employee performance during Financial Crises in the Kurd...AI Publications
 
International Journal of Business and Management Invention (IJBMI)
International Journal of Business and Management Invention (IJBMI)International Journal of Business and Management Invention (IJBMI)
International Journal of Business and Management Invention (IJBMI)inventionjournals
 
International Journal of Business and Management Invention (IJBMI)
International Journal of Business and Management Invention (IJBMI)International Journal of Business and Management Invention (IJBMI)
International Journal of Business and Management Invention (IJBMI)inventionjournals
 
Establishing the-effectiveness-of-market-ratios-in-predicting-financial-distr...
Establishing the-effectiveness-of-market-ratios-in-predicting-financial-distr...Establishing the-effectiveness-of-market-ratios-in-predicting-financial-distr...
Establishing the-effectiveness-of-market-ratios-in-predicting-financial-distr...oircjournals
 
Establishing the effectiveness of market ratios in predicting financial distr...
Establishing the effectiveness of market ratios in predicting financial distr...Establishing the effectiveness of market ratios in predicting financial distr...
Establishing the effectiveness of market ratios in predicting financial distr...oircjournals
 
Thesis financial sector distress
Thesis   financial sector distressThesis   financial sector distress
Thesis financial sector distressPreety Chandel
 
Profitability Determinants of Go-Public Bank in Indonesia: Empirical Evidenc...
	Profitability Determinants of Go-Public Bank in Indonesia: Empirical Evidenc...	Profitability Determinants of Go-Public Bank in Indonesia: Empirical Evidenc...
Profitability Determinants of Go-Public Bank in Indonesia: Empirical Evidenc...inventionjournals
 
Datashop Alchemy
Datashop  AlchemyDatashop  Alchemy
Datashop AlchemyInnovAccer
 
Sector Portfolios across the Crisis and Risk behaviour
Sector Portfolios across the Crisis and Risk behaviourSector Portfolios across the Crisis and Risk behaviour
Sector Portfolios across the Crisis and Risk behaviourSimone Guzzo
 
Financial crisis: Non-monetary factors influencing Employee performance at ba...
Financial crisis: Non-monetary factors influencing Employee performance at ba...Financial crisis: Non-monetary factors influencing Employee performance at ba...
Financial crisis: Non-monetary factors influencing Employee performance at ba...AI Publications
 
07. the determinants of capital structure
07. the determinants of capital structure07. the determinants of capital structure
07. the determinants of capital structurenguyenviet30
 
Systemic risk paper
Systemic risk paperSystemic risk paper
Systemic risk paperThejo Jose
 
1 The Impact of Government Intervention in Banks on Corp.docx
1 The Impact of Government Intervention in Banks on Corp.docx1 The Impact of Government Intervention in Banks on Corp.docx
1 The Impact of Government Intervention in Banks on Corp.docxdorishigh
 
Journal of Banking and Finance 71 (2016) 183–205 Contents .docx
Journal of Banking and Finance 71 (2016) 183–205 Contents .docxJournal of Banking and Finance 71 (2016) 183–205 Contents .docx
Journal of Banking and Finance 71 (2016) 183–205 Contents .docxcroysierkathey
 
Bankruptcy prediction final report by sanapathi kiran kumar
Bankruptcy prediction final report by sanapathi kiran kumarBankruptcy prediction final report by sanapathi kiran kumar
Bankruptcy prediction final report by sanapathi kiran kumarKiranKumarSanapathi1
 
Lobna bousl imi and basma majerbi
Lobna bousl imi and basma majerbiLobna bousl imi and basma majerbi
Lobna bousl imi and basma majerbiInformaEuropa
 

Similar to Mendel_University_Brno_Conference_2014 (20)

Impact of accounts receivable management on the profitability during the fina...
Impact of accounts receivable management on the profitability during the fina...Impact of accounts receivable management on the profitability during the fina...
Impact of accounts receivable management on the profitability during the fina...
 
Non-monetary effects Employee performance during Financial Crises in the Kurd...
Non-monetary effects Employee performance during Financial Crises in the Kurd...Non-monetary effects Employee performance during Financial Crises in the Kurd...
Non-monetary effects Employee performance during Financial Crises in the Kurd...
 
International Journal of Business and Management Invention (IJBMI)
International Journal of Business and Management Invention (IJBMI)International Journal of Business and Management Invention (IJBMI)
International Journal of Business and Management Invention (IJBMI)
 
International Journal of Business and Management Invention (IJBMI)
International Journal of Business and Management Invention (IJBMI)International Journal of Business and Management Invention (IJBMI)
International Journal of Business and Management Invention (IJBMI)
 
Establishing the-effectiveness-of-market-ratios-in-predicting-financial-distr...
Establishing the-effectiveness-of-market-ratios-in-predicting-financial-distr...Establishing the-effectiveness-of-market-ratios-in-predicting-financial-distr...
Establishing the-effectiveness-of-market-ratios-in-predicting-financial-distr...
 
Establishing the effectiveness of market ratios in predicting financial distr...
Establishing the effectiveness of market ratios in predicting financial distr...Establishing the effectiveness of market ratios in predicting financial distr...
Establishing the effectiveness of market ratios in predicting financial distr...
 
Thesis financial sector distress
Thesis   financial sector distressThesis   financial sector distress
Thesis financial sector distress
 
The Effects of Business Model on Bank’s Stability
The Effects of Business Model on Bank’s StabilityThe Effects of Business Model on Bank’s Stability
The Effects of Business Model on Bank’s Stability
 
Lemna wp 2015-14
Lemna wp 2015-14Lemna wp 2015-14
Lemna wp 2015-14
 
Profitability Determinants of Go-Public Bank in Indonesia: Empirical Evidenc...
	Profitability Determinants of Go-Public Bank in Indonesia: Empirical Evidenc...	Profitability Determinants of Go-Public Bank in Indonesia: Empirical Evidenc...
Profitability Determinants of Go-Public Bank in Indonesia: Empirical Evidenc...
 
Datashop Alchemy
Datashop  AlchemyDatashop  Alchemy
Datashop Alchemy
 
Sector Portfolios across the Crisis and Risk behaviour
Sector Portfolios across the Crisis and Risk behaviourSector Portfolios across the Crisis and Risk behaviour
Sector Portfolios across the Crisis and Risk behaviour
 
Financial crisis: Non-monetary factors influencing Employee performance at ba...
Financial crisis: Non-monetary factors influencing Employee performance at ba...Financial crisis: Non-monetary factors influencing Employee performance at ba...
Financial crisis: Non-monetary factors influencing Employee performance at ba...
 
07. the determinants of capital structure
07. the determinants of capital structure07. the determinants of capital structure
07. the determinants of capital structure
 
Systemic risk paper
Systemic risk paperSystemic risk paper
Systemic risk paper
 
1 The Impact of Government Intervention in Banks on Corp.docx
1 The Impact of Government Intervention in Banks on Corp.docx1 The Impact of Government Intervention in Banks on Corp.docx
1 The Impact of Government Intervention in Banks on Corp.docx
 
Journal of Banking and Finance 71 (2016) 183–205 Contents .docx
Journal of Banking and Finance 71 (2016) 183–205 Contents .docxJournal of Banking and Finance 71 (2016) 183–205 Contents .docx
Journal of Banking and Finance 71 (2016) 183–205 Contents .docx
 
Bankruptcy prediction final report by sanapathi kiran kumar
Bankruptcy prediction final report by sanapathi kiran kumarBankruptcy prediction final report by sanapathi kiran kumar
Bankruptcy prediction final report by sanapathi kiran kumar
 
IJSCH_SWFs
IJSCH_SWFsIJSCH_SWFs
IJSCH_SWFs
 
Lobna bousl imi and basma majerbi
Lobna bousl imi and basma majerbiLobna bousl imi and basma majerbi
Lobna bousl imi and basma majerbi
 

More from Miss. Antónia FICOVÁ, Engineer. (Not yet Dr.)

More from Miss. Antónia FICOVÁ, Engineer. (Not yet Dr.) (20)

Yandex.disk1
Yandex.disk1Yandex.disk1
Yandex.disk1
 
Yandex.disk 3
Yandex.disk 3Yandex.disk 3
Yandex.disk 3
 
My profile1
My profile1My profile1
My profile1
 
Image ban.ru news3
Image ban.ru   news3Image ban.ru   news3
Image ban.ru news3
 
Image ban.ru my albums1
Image ban.ru   my albums1Image ban.ru   my albums1
Image ban.ru my albums1
 
Hubi c ovh-antonia_ficova
Hubi c   ovh-antonia_ficovaHubi c   ovh-antonia_ficova
Hubi c ovh-antonia_ficova
 
History my drive - your swiss online storage4
History   my drive - your swiss online storage4History   my drive - your swiss online storage4
History my drive - your swiss online storage4
 
history internet banking_part_2
history internet banking_part_2history internet banking_part_2
history internet banking_part_2
 
Macikova
MacikovaMacikova
Macikova
 
Yasar 1
Yasar 1Yasar 1
Yasar 1
 
Sipko vii
Sipko viiSipko vii
Sipko vii
 
Phd 1
Phd 1Phd 1
Phd 1
 
Acreditation
AcreditationAcreditation
Acreditation
 
Academic senat ii
Academic senat iiAcademic senat ii
Academic senat ii
 
Zoznam zamestnancov uis
Zoznam zamestnancov uisZoznam zamestnancov uis
Zoznam zamestnancov uis
 
View recorded transactions
View recorded transactionsView recorded transactions
View recorded transactions
 
View recorded transactions ii
View recorded transactions iiView recorded transactions ii
View recorded transactions ii
 
Personal data check
Personal data checkPersonal data check
Personal data check
 
Personal administration
Personal administrationPersonal administration
Personal administration
 
Telephone directory ii.
Telephone directory ii.Telephone directory ii.
Telephone directory ii.
 

Mendel_University_Brno_Conference_2014

  • 1. THE IMPACT OF DEBT CRISIS ON PERFORMANCE OF FIRMS IN SLOVAKIA Antonia FICOVA PhD Candidate at Faculty of Economics and Business, Pan European University, 85105 Bratislava, Slovakia, antoniaficova@hushmail.com, +421 918 216 381 Juraj SIPKO Assoc. Prof. at Faculty of Economics and Business, Pan European University, 85105 Bratislava, Slovakia, juraj.sipko@gmail.com, +421 2 6820 3615 Abstract The paper explores impact of debt crisis on corporate firms with 3000-3999 employees in Slovakia. First, we examine at 95 percent probability of following variables: profit (€), working capital (million €), revenue (€), return on equity (%), return on assets (%), net debt/ebitda, investment, cash (€), capital expenditure (€), assets (%). We found that 91.27 percent of the variance of debt ratio is being explained by changes in the variables x, model is high significant. Second, we explore performance of firms in comparison between 2010 and latest available data of 2013. Findings indicate an increase of assets. Conclusions pointed out that if a firm want to increase their financial performance, it is necessary to make changes in time. Keywords Debt Crisis, Performance, Firms, Corporate Finance JEL classification C12, C58, E20, F65
  • 2. 1 INTRODUCTION Main causes of debt crisis are following factors: high structural debt before crisis, exacerbated by ageing population in many european countries, recession causing sharp rising in budget deficit, credit crunch causes losses for commercial banks. In short, eurozone countries with debt problems are also generally uncompetitive with a higher inflation rate and higher labour costs. This means there is less demand for their exports, higher current account deficit and lower economic growth. In context of corporate sector, we identified causes in as follows: existence of moral hazard in the financial sectors, weak institutional frameworks, and those pursuing the possibility of unstable (international) financial markets. However, the culture of the company should reflect what the company is aiming to achieve and which should be part of their mission statement. In sum, all companies are in business to make money, in this light their approach may differ and is more likely to be dictated by the market that they target. For example, in an airline business one may target premium business class, low cost, or both. Depending on the targeted market segment, the company should have operational objectives and goals that they should be working on tirelessly to achieve. Since these goals are linked to the mission statement, the completion of goals will move the company closer to their objectives. Moreoever, when firms assess their risk culture, align their performance metrics with business strategy and risk appetite, and link those metrics to compensation is as much art as science, more to the point investment in data and systems continues to be a significant challenge. Survey conducted by Ernst and Young (2013), seventy-six firms across 36 countries participated in their study, showed that the challenge is twofold, requiring both buy-in throughout the organization and the tools to monitor and assess that buy-in. Fifty-nine percent of survey respondents cited the balance between a sales-driven front-office culture and a risk- focused culture as their top organizational challenge; 38% cited a lack of systems and data, the second most frequent challenge raised. On the other hand, Chief Risk Officers noted that without adequate risk data and systems, accountability for risk is undermined and can damage the culture. More to the point, 43% of banks said they have achieved a strong culture, banks are taking different approaches to assessing risk culture, more than 85% of North American banks have programs to assess internal culture, and the figure is similar for Latin America. In Europe and Asia-Pacific, 60% or more of banks have programs to assess internal risk culture. In short, capital management is being rethought across the industry. With regulatory capital now much higher than economic capital, 55% of respondents said they are aligning capital allocation with regulatory capital. Eighty-three percent reported they have placed a greater focus on managing capital by entities or geographies. The fundamental background of debt crisis and impact on finance, firms, etc. is examined in literature since 2007. More recent studies have drawn attention to the relationships between on the one hand, the type of firm assets being financed, the risks of different types of business and the role of taxes and bankruptcy costs and on the other hand firm financing patterns. Exempli gratia, Corsetti et al. (1998), for example, mention weak corporate performance and risky financing patterns as important causal factors for the East Asian financial crisis. Krugman (1999) argues that company balance sheet problems may have a role in causing the East Asian financial crisis, independently of macro-economic or other weaknesses, including a poor performance of the corporate sector itself. Claessens, S., Djankov, S., Nenova, T. (2000) showed that corporations’ financial and operating structures relate to the institutional environments in which they operate. They suggest that the financing
  • 3. patterns of the corporate sector across countries reflect countries’ institutional environments. They pointed out the importance of constructing useful and operational measures of corporate sector risk, at the micro level, in addition to monitoring sectoral and countrywide economic risks. Their insights gained in this study can also be utilized in future models of corporate behavior as regards the use of external financing. Many of the more recent theoretical models of crises are rooted in problems associated with the collateral that backs up corporate borrowing. Gertler, M., Gilchrist, S., Natalucci, F. M. (2000) show that microeconomic rigidities can amplify corporate balance sheet channels in an open economy framework. Mulder, Perrelli, and Rocha (2001) found that the corporate indicators of leveraged financing, short-term debt to working capital and shareholders rights help predict crises. Davis, E. P. and Stone, M. S. (2004) analyzed the impact of financial criseson corporate financing and GDP in a range of countries. In other words, post-crisis GDP contractions are mainly accounted for by declines in investment and inventory and are more severe for emerging market countries. More to the point, post-crisis investment and inventory declines are correlated with the corporate debt-equity ratio. They found that the average level of corporate financing differs markedly between country groups, with emerging market corporate sectors being more dependent on external finance and also more dependent on banks.Their econometric analysis suggests that financial crises have a greater and more consistently negative impact on corporate sectors in emerging markets than in industrial countries, although even in the latter the impact is not negligible. Industrial countries benefit from the existence of multiple channels of intermediation, in that bond issuance is shown to pick up in the wake of banking crises. Duchin, R., Ozbas, O., Sensoy, B. A. (2009) presented the effect of the recent financial crisis on corporate investment. In other words, the crisis represents an unexplored negative shock to the supply of external finance for non-financial firms. They found that corporate investment declines significantly following the onset of the crisis, controlling for firm fixed effects and time-varying measures of investment opportunities, moreoever corporate investment declines by 6.4% of its unconditional mean following the onset of the crisis, specifically by 0.109% of assets relative to an unconditional mean of 1.695% of assets (per quarter). However, their results are largely explained by changing investment opportunities captured by Q and cash flow, on the other hand their measure of cash reserves has an insignificantly positive effect on investment. Trebesch, Ch. (2009) proposed a new empirical measure of cooperative versus conflictual crisis resolution following sovereign default and debt distress. His findings indicate that unilateral, aggressive sovereign debt policies lead to a strong decline in corporate access to external finance (loans and bond issuance). He concluded that coercive government actions towards external creditors can have strong signalling effects with negative spillovers on domestic firms. Berger, A. N. - Bouwman, H.S. Ch. (2009) examined what does capital do for banks around financial crises. They examined the effect of pre-crisis bank capital ratios on banks’ ability to survive financial crises, and on their competitive positions, profitability, and stock returns during and after such crises. Their evidence suggests that capital helps small banks to survive banking and market crises, and helps medium and large banks to survive banking crises. Moreover, the manner in which a bank exits when it does not survive a crisis also depends on its pre-crisis capital ratio. Brown, M., Lane, P. R. (2011) assessed the extent to which debt overhang poses a constraint to economic activity in Emerging Europe. Flannery, M .J. - Hankins, K. W. (2013) presented dynamic panel models that play a natural role in several important areas of corporate finance, but the combination of fixed effects and lagged dependent variables introduces serious econometric bias. In other words, no one has evaluated the methods' performance with corporate finance data, in which the dependent variable may be clustered or censored and independent variables may be missing, correlated with one another, or
  • 4. endogenous. They found that the data's properties substantially affect the estimators' performances. João, P., Coutinho dos Santos, João, M. (2014) examined the financial characteristics of structured finance (SF), either project finance loans or asset securitization bonds, and straight debt finance (SDF), corporate bonds. They found that project finance loans have higher credit spreads (198.3 bps) than asset securitization bonds (148.9 bps) and corporate bonds (157.6 bps) and that average credit spreads for asset securitization and corporate bond issues do not differ significantly. 1.1 The Objectives The research objectives of this paper are presented as follows: What is the impact of debt crisis on the corporate finance of the firms with 3000-3999 employees in Slovakia? What is dependency of working capital, investment, capital expenditure, cash, profit, revenue, return on equity, return on assets, net debt/EBITDA, assets on debt ratio of observing firms on the Slovak market? Is there an increase of performance of observed firms in comparison between 2010 and data of 2013? 1.2 Data and Methodology This paper describes the impact of debt crisis on firms with 3000-3999 employees in Slovakia. First, we observe 42 variables during period of 2010-2013, =0,05. Second, we examine performance of firms in comparison between 2010 and latest available data of 2013. This has been done by illustrations and calculations by author by using economic software Eviews, moreover by using available data from official websites of firms on Slovak market, data used from Statistical Office of the Slovak Republic, financial data from FinStat. In addition to this, we present the estimations by using Ordinary Least Squares (OLS), correlation matrix, The ‘Student’ t-test distribution with (N−1) degrees of freedom, normality test, the two-sample t-test for mean value. 1.3 Structure of the Study This paper is organized as follows: Section 2 presents briefly facts about Slovakia´ growth, business confidence, why more indebted countries are expected to see their cost of debt financing increasing. Ergo, the main contribution of this paper is contained in section 3 that provides examined hypotheses of observed variables, etc. Section 4 concludes the paper. 2 LITERATURE REVIEW Slovakia does not have an external competitiveness problem, although the repercussions of maintaining competitiveness with productivity increases in existing enterprises and wage restraint for domestic demand are not taken into account, thereby overestimating the underlying strength of export capacity presented by IMF (2012). In this light, the Slovak economy has become strongly dependent on foreign demand, especially from Germany and the euro area. In other words, business cycles in the industries concerned are often more pronounced than in other industries, especially services. During the past decade, Slovakia has performed a successful restructuring strategy. GDP Growth Rate in Slovakia averaged 0.93% from 1997 until 2014, reaching an all time high of 9% in the fourth quarter of 1998 and a record low of -7.60% in the first quarter of 2009 to 0.6% in Q1 2014 reported by the Statistical Office of the Slovak Republic. Moreoever, export industries have received special attention. Foreign investments in the automotive and electronic sectors have been the main source of the recent expansion. Main export partners are Euro Area members with German, Czech Republic, France and Poland being the most important. However, the biggest share of Slovakian imports are machinery and transport equipment, intermediate
  • 5. manufactured goods, fuels and chemicals and main import partners are Germany, Czech Republic, Russia and Hungary. Slovakia recorded a trade surplus of 233 EUR million in august of 2014, on the other hand, balance of trade in Slovakia decreased by 51.13 EUR million from 1993 until 2014. Business Confidence in Slovakia increased to 5 in September of 2014 from 4.30 in August of 2014. Manufacturing Production in Slovakia increased 2.30 percent in August of 2014 over the same month in the previous year. Industrial Production in Slovakia increased 2.70 percent in August of 2014 over the same month in the previous year. Government Debt to GDP in Slovakia is 55.40 percent of the country's Gross Domestic Product in 2013. Nothwithstanding, financial systems presented by Davis, E. P. and Stone, M. S. (2004) seem to go through stages of development in which corporate sources of financing are mainly: (i) internal, (ii) banks due to information collection efficiencies, (iii) equity issuance for more diversity, and (iv) bonds when information collection costs become sufficiently low. If we look at flow data capture, the sources of financing for corporate sectors across the country groups are in many cases over an extended time period. Moreover, the net financing/GDP flows data gauge the change in the net financial position of the aggregate corporate sector, which is equivalent to its net cash flow. Typically, corporations are net borrowers because of large investment needs relative to revenue, so that they operate with negative net financing. On the other hand, gross financing/GDP measures the overall level of funding to the corporate sector on a gross basis according to the Davis, E. P. and Stone, M. S. (2004). Following on the observations of Nerlove (1967), Nickell (1981) established that OLS estimates of the lagged dependent variable's coefficient in a dynamic panel model are biased due to the correlation between the fixed effects and the lagged dependent variable. Yet corporate finance studies include multiple independent variables, of which many exhibit endogeneity and serial correlation. However, the best strategy to cope with such debt crisis is to use the optimal combination of policy ingredients that will minimize the undesirable effects on the economy. In parallel, the government needs to be prepared for quick reactions to any new situation. In this context, financial sector, creation of government deposit guarantees might be very useful, together with the suspension of deposits convertibility, and the adoption of an effective deposit insurance system. In this regard, the financial contagion may induce a sectoral contagion: if liquidity shortages persist, a systemic impact is likely to happen in non‐financial sectors. The recent substantially increased number of liquidity interventions by central banks raise the uncertainty of the final outcome of the debt crisis because we cannot know for sure whether we face a problem of illiquidity or one of insolvency in the system. However, more indebted countries are expected to see their cost of debt financing increasing, since the financial system of countries hit by the crisis is rebalancing its portfolio of assets into positions that are less risky. In this light, this has a negative impact and developing countries because it could raise on debt valuation of emerging their cost of indebtedness. In sum, better and careful monitoring over the internal financial system of the firm, even if the system seems healthy and not affected by contagion. Prevention, rather than curing, is the right policy in these times. Corporate sector indicators are useful for assessing the potential impact of exchange rate and interest rate changes on corporate sector balance sheets. The monitoring through the two indicators of exposure could be complemented by indicators related to corporate leverage, profitability, cash flow and financial structure. Viewed in this light, there are at least two causal channels according to the Trebesch, Ch. (2009) by which sovereign debt distress can affect private sector external borrowing in
  • 6. emerging market countries. First, demand effects, default periods often coincide with output losses and lower domestic demand, this can lead to a drop in production, investment and profits, which may be further reinforced by banking sector stress. As a result, firms may demand less credit. Second, the drop in corporate external credit may be attributable to supply effects. In sum, sovereign defaults might worsen country risk perceptions as a whole, increase risk premia on all new loans to domestic agents and thereby reduce private sector external debt issuance. 3 HYPOTHESES Based on data analyzed for the paper, we developed following hypotheses. Results are demonstarted in this section. 3.1 Testing Hypothesis I. At this point, we want to examine the dependence, moreover how changes in following factors x: profit (€), working capital (million €), revenue (€), return on equity (%), return on assets (%), net debt/ebitda, investment ((Capital expenditure/assets), cash (€), capital expenditure (€), assets (%) may affected debt ratio of observing firms on the Slovak market. In other words, we use data of 12 slovak firms with 3000-3999 employees during period from 2010 till 2013, due to fact that it is period after debt crisis. In other words, we use data from websites of firms on Slovak market, data used from Statistical Office of the Slovak Republic, data from the Business register that is operated by the Ministry of Justice and financial data from FinStat. The question is: How debt crisis affected corporate finance of observed firms that are mentioned below. We collected financial data of firms from following industries: Chemicals & Plastics (Slovnaft, a.s.); Automotive industry (Kia Motors Slovakia s.r.o., Yazaki Wiring Technologies Slovakia s.r.o.); Telecommunications (Slovak Telekom, a.s.); Metal production and metallurgy (Železiarne Podbrezová a.s.); Retail sale (Lidl Slovenská republika, v.o.s.); Engineering (INA Kysuce, spol. s r.o.); Law, Consulting, Accounting (IBM International Services Centre s.r.o.), Mining (Hornonitrianske bane Prievidza, a.s.); Financial sektor (Všeobecná úverová banka, a.s.; VÚB, a.s., Tatra banka, a.s., Slovenská sporiteľňa, a.s. SLSP, a.s.). We use method of least squares by using economic software Eviews, N=42 at 95 percent of probability, =0,05; see bellow. 1: Ordinary Least Squares (OLS) of Debt ratio Dependent Variable: DEBT RATIO Method: Least Squares Sample: 1 42 Included observations: 42 Variable Coefficient Std. Error t-Statistic Prob. PROFIT 0.039 0.046 0.842 0.406 WORKING CAPITAL -0.022 0.004 -5.231 0.000 REVENUE 0.000 0.002 0.195 0.846 RETURN ON EQUITY 0.690 0.113 6.096 0.000 RETURN ON ASSETS -2.122 0.713 -2.972 0.005 NET DEBT EBITDA 1.886 3.065 0.615 0.542 INVESTMENT -0.002 0.004 -0.654 0.517 CASH 0.010 0.005 1.978 0.056 CAPITAL EXPENDITURE 13.477 6.157 2.188 0.036 ASSETS 0.005 0.000 6.661 0.000 C 41.348 4.090 10.1086 0.000
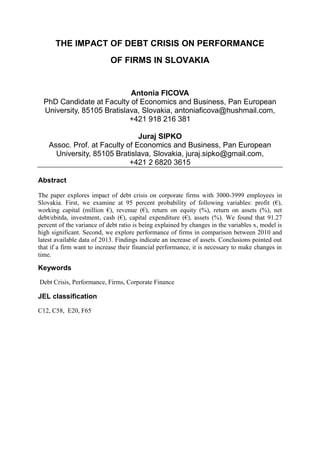
  • 7. R-squared 0.913 Mean dependent var 57.085 Adjusted R-squared 0.884 S.D. dependent var 25.323 S.E. of regression 8.609 Akaike info criterion 7.363 Sum squared resid 2297.627 Schwarz criterion 7.818 Log likelihood -143.636 Hannan-Quinn criter. 7.530 F-statistic 32.375 Durbin-Watson stat 1.595 Prob(F-statistic) 0.000 Source: Author´s estimation. In short, we get following estimation equation of model: Debt ratio = β0 + β1*profit - β2*working capital + β3*revenue + β4*return on equity – β5*return on assets + β6* net debt ebitda – β7* investment + β8*cash+ β9*capital expenditure β10* assets And after substituted coefficients we get formula as follows: Debt ratio = 41.349 + 0.039*profit - 0.022*working capital + 0.000*revenue + 0.690*return on equity – 2.122*return on assets + 1.886* net deb/ebitda – 0.002* investment + 0.010*cash+ 13.477*capital expenditure + 0.005* assets According to the results of OLS at 95% confidence level, which are presented in Table 1 above show, that coefficient of determination R2 = 0.913 indicates that 91.27% of the variance of the endogenous variable (debt ratio) is being explained by changes in the variables x, that shows changes in profit, working capital, investments, revenue, etc., in short that means positive linear relationship. On the other hand, 8.74% of changes in the debt ratio of the firms are affected by other variables that are not included in this model, for example rate of economic growth of the country, inflation, government restrictions (higher taxe rate, exchange rate, interest rate), etc. The significance of the model, prob (F-statistic) is 0.000000<0.01; what is high statistically significant (++). The parameter β is high statistically significant because the P- value is 0.0000<0.01; (++). The parameter x2, x4, x5, x8, x9, x10 are high statistically significant because of the P-value. For N = 42, k = 10, and significant level = 5%, the significant Durbin- Watson statistic dL is 0.749, dU is 1.956. Since the Durbin-Watson d statistic, 4-1.595=2.405, a value near 2 indicates non-autocorrelation in this model. Viewed in this light, organizations do not have ability to borrow money as much as they want in some cases. Many factors are involved which stops them to borrow but the main factor is the growth of the company. Moreover, if the company growth is on the track their debt level would be high and if the company growth level is not on track then their debt level would be low. In sum, generally it can be concluded that when company increase their debt level there should be positive impact on growth of the firm. As this paper found that company return on equity, return on assets, total assets, profit is attached with debt portion of company positively, so those companies having high leveraged company should decrease their debt portion for increasing their assets to maintain the growth in market. However, at this point we present illustrations of significant variables below. Moreover, the data are displayed as a collection of points, each having the value of one variable determining the position on the horizontal axis and the value of the other variable determining the position on the vertical axis. If the pattern of dots slopes from lower left to upper right, it suggests a positive correlation between the variables being studied, e. g. debt ratio and return on equity, debt ratio and return on assets, debt ratio and assets. If the pattern of dots slopes from upper left to lower right, it suggests a negative correlation, e.g . debt ratio and working capital, debt ratio and cash, see below.
  • 8. 10 20 30 40 50 60 70 80 90 100 -40 0 40 80 120 160 200 240 PROFIT Debtratio 10 20 30 40 50 60 70 80 90 100 0 400 800 1,200 1,600 2,000 Working Capital Debtratio 10 20 30 40 50 60 70 80 90 100 -20 0 20 40 60 80 100 Return on equity Debtratio 10 20 30 40 50 60 70 80 90 100 -4 0 4 8 12 16 20 24 Return on assets Debtratio 10 20 30 40 50 60 70 80 90 100 0 200 400 600 800 1,000 1,400 CASH Debtratio 10 20 30 40 50 60 70 80 90 100 -0.4 0.0 0.4 0.8 1.2 1.6 2.0 2.4 Capital expenditure Debtratio
  • 9. 10 20 30 40 50 60 70 80 90 100 0 2,000 4,000 6,000 8,000 10,000 12,000 ASSETS Debtratio Source: Author´s estimation by using Eviews. 1: Simple Scatter Graphs of significant variables 3.2 Testing Hypothesis II. The question is: Is means of performance of the firms in 2010 are the same as means of performance of the firms in 2013 after debt crisis? At this section, we want to examine whether performance is the same, or we see an increase of following variables: assets, working capital, investment, capital expenditure, cash, profit, revenue, return on equity, return on assets, debt ratio, net debt/EBITDA in comparison between 2010 (file Z) and latest available data of 2013 (file Y). At this point, we use Normal Quantile Plot - Test for Non-Normality, we formulate hypothesis as follows: H0: Data are normally distributed. H1: Data are NOT normally distributed. 4: Test for Non-Normality Sample Size Critical Value Critical Value Critical Value Using  = .01 Using  = .05 Using  = .10 File Z; 11 0.887 0.923 0.938 File Y; 11 0.887 0.923 0.938 Correlation Coefficient r Conclusion Using =0.01 Conclusion Using =0.05 Conclusion Using =0.100.945 0.973 Accept H0 Accept H0 Accept H0 Source: Author´s estimation. As a computed r value is greater than the significance level =0.01, 0.05, 0.10 we accept null hypothesis, it can be concluded that both files Z; Y are normally distributed. Than, we use parametric test, method The ‘Student’ t-test distribution with (N−1) degrees of freedom, mean test of correlation with a known constant by using the two-sample t-test for mean value. n s d t d d .   (1)
  • 10. Indicates significance at the 5 percent level, =0,05. We formulate our hypothesis as follows: H0 : 021  mm H1 : 021  mm If we assume that the mean of values of performances in 2010 and assets in 2013 are equal, that means that performance of the firms is the same, then the value will be 0d . 5: The two-sample t-test for mean value Assets in 2010 file (Z) Assets in 2013 file (Y) Mean 249.731 331.750 Variance 118789.161 282435.484 Observations 10 10 Correlation 0.951 Difference 9 t stat -1.128 P(T<=t) (1) 0.144 t crit (1) 1.833 P(T<=t) (2) 0.288 t crit (2) 2.262 Source: Author´s estimation. Results coming out from t-test depicted in Table 4: -1.128< 1.833→ t < tc. That leads to the conclusion that the difference between the hypothesized performances of the firms mean is small enough to accept null hypothesis. In short, that means this method showed that difference in observed files Z and Y are statistically insignificant. In short, it is due to random selection of observed data in files. On the other hand, we may say that difference of variables that are mentioned in the beginning of this hypothesis, showed that during period 2010 and 2013 performance of the firms could be caused through necessary changes after debt crisis that has an impact on financial markets due the fact of implementing different strategies of the firms. In sum, because the differences are random in the average of performances, i.e. greater than 0.05 (or 5 percent), it can be concluded that there is no difference between the means. Nonetheless, assets of firms decreased by 26.49 percent from 3 428, 129 milion € in 2010. On the other hand, investments of firms increased by 180.21 percent since 2010. Revenue increased from 903.699 (milion €) to 1411.578 (milion €) in 2013.
  • 11. 7: Summary Statistics Table reports summary statistics for the primary variables used in this paper since 2010-2013. ASSETS WORKING CAPITAL INVESTME NT CAPITAL EXPENDIT URE CASH PROFIT REVENUE RETURN ON EQUITY RETURN ON ASSETS DEBT RATIO NET DEBT EBITDA Mean 2928.963 643.470 826.548 0.746 87.896 60.019 1209.200 16.445 4.414 57.085 -0.226 Median 1144.706 391.576 166.768 0.726 10.372 38.248 484.3491 9.400 2.400 50.100 -0.025 Maximum 11777.34 1667.070 4395.239 2.034 1575.000 230.857 7838.252 99.100 21.400 91.600 0.940 Minimum 44.659 5.748 -114.275 -0.010 0.000 -26.395 109.657 -1.900 -1.200 17.800 -1.780 Std. Dev. 4053.201 579.639 1432.271 0.701 259.818 68.354 1757.420 21.627 4.480 25.323 0.545 Skewness 1.309 0.421 1.671607 0.317 4.807 1.037 2.094 2.474 1.801 0.032 -0.802 Kurtosis 2.979 1.639 4.059 1.706 27.158 2.968 6.732 8.846 6.663 1.654 4.434 Jarque-Bera 12.007 4.480 21.524 3.630 1183.111 7.541 55.099 102.672 46.211 3.173 8.107 Probability 0.002 0.106 0.000 0.162 0.000 0.023 0.000 0.000 0.000 0.204 0.017 Sum 123016.4 27025.76 34715.02 31.336 3691.641 2520.812 50786.39 690.700 185.400 2397.600 -9.520 Sum Sq. Dev. 6.74E+08 13775272 84107433 20.163 2767738. 191567.2 1.27E+08 19176.94 823.051 26293.05 12.207 Observations 42 42 42 42 42 42 42 42 42 42 42 Source: Author´s estimation according to financial data of observed firms by using economic software Eviews.
  • 12. 8: Correlation Matrix Panel B reports correlations among the variables. ASSETS WORKING CAPITAL INVESTME NT CAPITAL EXPENDITURE CASH PROFIT REVENUE RETURN ON EQUITY RETURN ON ASSETS DEBT RATIO NET DEBT EBITDA ASSETS 1 WORKING CAPITAL 0.537 1 INVESTMENT -0.141 0.355 1 CAPITAL EXPENDITURE -0.495 -0.156 0.7611 1 CASH -0.092 0.183 0.262 0.149 1 PROFIT 0.776 0.547 0.069 -0.235 -0.014 1 REVENUE -0.073 0.388 0.933 0.673 0.231 0.203 1 RETURN ON EQUITY -0.129 -0.382 -0.177 0.254 -0.132 -0.055 -0.170 1 RETURN ON ASSETS -0.396 -0.395 -0.043 0.436 -0.079 -0.056 -0.019 0.742 1 DEBT RATIO 0.611 -0.125 -0.201 -0.109 -0.096 0.427 -0.168 0.494 0.063 1 NET DEBT EBITDA 0.124 -0.345 -0.242 -0.041 -0.232 0.087 -0.173 0.362 0.165 0.472 1 Source: Author´s estimation according to financial data of observed firms by using economic software Eviews. Note: Correlation is a numerical representation of the relationship between two things. In short, 1.0 means perfect correlation, 0 to 1 means that the two variables tend to increase or decrease together, -1 to 0 means that one variable increases as the other decreases. For example correlation between debt ratio and assets is 0.611, increase together.
  • 13. 4 CONCLUSION We identified that coefficient of determination is 0.913 indicates that 91.27% of the variance of the endogenous variable (debt ratio) is being explained by changes in the variables x, in short the significance of F is 0.000000<0.01; what is high statistically significant (++). Then we explored performance of firms during period 2010 and 2013, what could by caused by different strategy of each firm. We found that firm´s return on equity, return on assets, total assets, profit is attached with debt portion of company positively, so those companies having high leveraged company should decrease their debt portion for increasing their assets to maintain the growth in market. In other words, if company debt ratio increases, there is negative correlation on the growth of the company, more to the point on working capital, investment, capital expenditure, revenue. In sum, in this paper firm’s performance has been discussed with debt of the company, on the other hand found that is very important factor towards company success but other factors can also be checked in future with the firm’s debt capacity. For future research work can be done on what specific portion of debt capacity should use by the companies to keep firms on track. In short, debt crisis may lead to a generalized systemic crisis through worsened conditions for local credits and through a decline of the demand in the world real economy. We suggest that, if a firm want to increase their financial performance, it is necessary to make changes as follows: if we look at cash flow, extend payment terms (Purchasing), reduce collection terms (credit), support customers with credit facilities (i.e. factoring) granting an affordable prompt payment discount, outlining strategies for identifying / selling idle / non- core assets (Finance Leadership), identification and disposal of obsolete inventories (Controllership), operating results, reduce borrowing cost (Treasury), reduce finance administrative expense (Finance Leadership), permanet review of gross margins (financial planning), cost containment programs (tracking system). In other words, good planning and production helps toward maximization of achieving ends with available resources. A costing team helps firm to analyze costs, volumes, plan profits through fixation of selling prices which are beneficial to both the buyer and the seller. A accounting team ensures that nothing goes unaccounted and that things are accounted correctly. It also ensures that statutory norms are maintained as required. 5 DISCUSSION The question is: How to achieve growth after debt crisis? More to the point, faster growth by implementing structural reforms and by improving the efficiency of public expenditure. This should be an essential part of solution to the EU debt crisis because it guarantees long term public finance sustainability. However, this is also a hard task because it requires implementation of unpopular measures. It is important to notice here that after implementing structural changes even the impact of austerity may be different in the long term. In short, the unemployment does not have to rise or stay high if there is a flexible labor market. People may simply get used to work for lower salaries just as they did for centuries before. Also the social benefits do not have to rise. On the contrary they should be falling if the public revenues decline. On the other hand, the privatization and reforms in Slovakia played a major role in attracting foreign investors and generating rapid economic growth that peaked at 10.5% of GDP in 2007. Over the period 2000-2010 Slovakia had 11 the highest GDP growth in the EU. This example shows clearly that the structural measures help to generate economic growth and reduce debt levels.
  • 14. 6 REFERENCES 1. BERGER, A. N., BOUWMAN, H.S. CH., 2009: Bank Capital, Survival, and Performance around Financial Crises, Wharton Financial Institutions Center, and Center – Tilburg University, Wharton Financial Institutions Center 2. BROWN, M. - LANE, P. R., 2011: Debt Overhang in Emerging Europe? World Bank Policy Research Working Paper Series, Vol. , pp. -, 2011 3. CORSETTI, G., - PESENTI, P. - ROUBINI, N., 1998: What Causes the Asian Currency and Financial Crises? A Macroeconomic Overview, New York University 4. DAVIS, E. P. - MARK, S., 2004: Corporate Financial Structure and Financial Stability. IMF Working Paper, Vol. , pp. 1-49 5. DUCHIN, R. - OZBAS, O. - SENSOY, B. A., 2009: Costly External Finance, Corporate Investment, and the Subprime Mortgage Credit Crisis, Journal of Financial Economics (JFE), Forthcoming; Marshall School of Business Working Paper No. MKT 01-09; Ross School of Business Paper No. 1121 6. ERNST AND YOUNG, 2013: Remaking financial services: risk management five years after the crisis, A survey of major financial institutions, EYG No. EK0162, 1303-1045437 BOS, ED 0714 7. FINSTAT, available at: <http://www.finstat.sk˃ 8. FLANNERY, M. J. – HANKINS, K. W., 2013: Estimating dynamic panel models in corporate finance, Journal of Corporate Finance 19 (2013) 1–19 9. GERTLER, M., - GILCHRIST, S. - NATALUCCI, F. M., 2000: External Constraints on Monetary Policy and the Financial Accelerator, NBER Working Paper No. 10128 (Cambridge, Massachusetts: National Bureau of Economic Research). 10. IGBAL, A. - HAMEED, I. - RAMZAN, N., 2012: The Impact of Debt Capacity on Firm’s Growth, American Journal of Scientific Research, ISSN 1450-223X, Issue 59, pp. 109-115 11. IMF, 2012: Slovak Republic: 2012 Article IV Consultation—Staff Report 12. JOÃO, P., COUTINHO DOS SANTOS, JOÃO, M., 2014: Corporate Financing Choices after the 2007-2008 Financial Crisis 13. KRUGMAN, P., 1999: Balance Sheets, the Transfer Problem, and Financial Crises, MIT 14. MULDER, CH. - PERRELLI, R. - ROCHA, M., 2001: The Role of Corporate, Legal, and Macro Balance Sheet Indicators in Crisis Detection and Prevention 15. NENOVA, T. - CLAESSENS, S. - SIMEON D., 2000: Corporate Risk around the World World, Bank Policy Research Working Paper No. 2271 16. NERLOVE, M., 1967: Experimental evidence on the estimation of dynamic economic relations from a time series of cross sections, Econ. Stud. Quart. 18, 42–74. 17. NICKELL, S., 1981: Biases in dynamic models with fixed effects, Econometrica 49, 1417–1426. 18. STATISTICAL OFFICE OF THE SLOVAK REPUBLIC, available at <http://slovak.statistics.sk˃ 19. TREBESCH, CH., 2009: The Cost of Aggressive Sovereign Debt Policies: How Much is the Private Sector Affected? IMF Working Papers, Vol., pp. 1-35