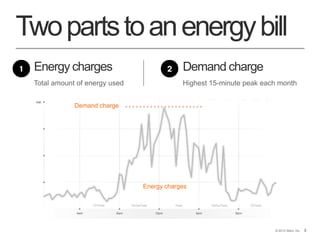
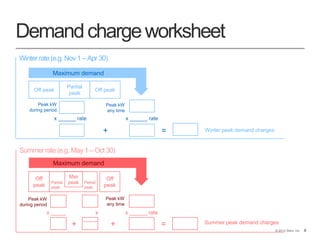
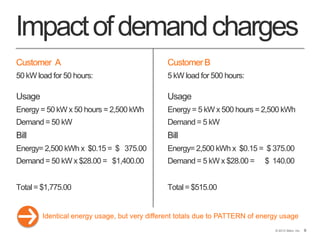
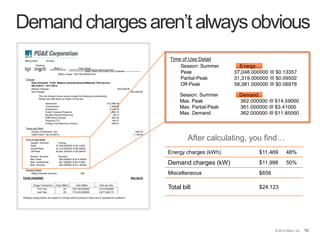
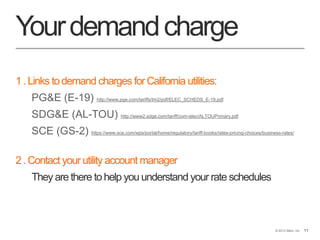
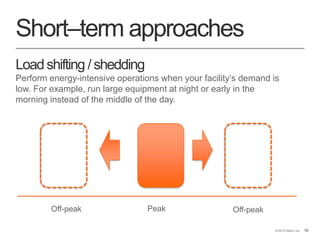
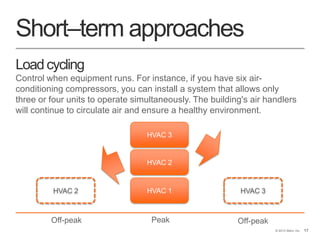
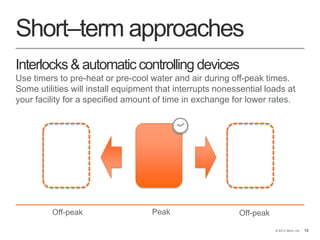
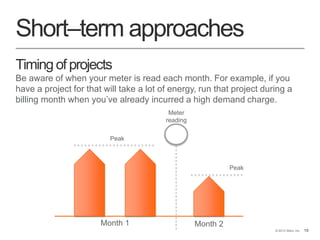
0© 2013 Stem, Inc. 0
Tacklingpeakdemandcharges
1© 2013 Stem, Inc. 1
Agenda
•Overview of peak demand charges
•Future trends in demand charges
•Traditional approaches
•A new approach
2© 2013 Stem, Inc. 2
Agenda
•Overview of peak demand charges
•Future trends in demand charges
•Traditional approaches
•A new approach
3© 2013 Stem, Inc. 3
Twopartstoanenergybill
Energy charges Demand charge
Total amount of energy used Highest 15-minute peak each month
Demand charge
Energy charges
4© 2013 Stem, Inc. 4
Whatisademandcharge?
•Monthly charge based on highest 15-min peak during that month
•Typically 30–70% of total electric bill
•Usually differs by season (typically higher in summer than winter)
5© 2013 Stem, Inc. 5
Whoissubjecttodemandcharges?
•Levied on certain commercial &industrial customers
Largebusinesses
…ontime-of-usebills
…withenergyusageexceedingacertainlevel(e.g.2000kWh/month)
•All states have demand charges, but at varying levels
6© 2013 Stem, Inc. 6
Whydodemandchargesexist?
• Covers utilities' fixed costs of providing a given level of power
• “Hottestday in July” scenariowhere utilities have to have enough capacity
on standbyto supplyALLcustomerswith heavy HVAC loads
• Used by utilities to reduce peak by making it desirable to:
• shiftelectricalusage from peak hours to non-peakhours
• reducepower usage during peak hours
• Levies higher costs on customers with spikier loads
• Passessavings on to other customerswith more consistentloads
7© 2013 Stem, Inc. 7
Howdemandchargesarecalculated
•Highestlevelofusageduringa15minuteperiodoutofanentirebillingcycle
•Thatusage,measuredinkW,isthenmultipliedbythedemandchargerate
Speedometer – highest
Odometer – accumulated
Auto Analogy
Analogous to demand charge
Analogous to energy charge
8© 2013 Stem, Inc. 8
Demandchargeworksheet
Winterrate (e.g. Nov1 – Apr 30)
Off peak
Partial
peak
Off peak
Peak kW
during period
x ______ rate
Winter peak demand charges
Peak kW
any time
x ______ rate
+ =
Maximum demand
Summerrate (e.g. May 1 – Oct 30)
Maximum demand
Off
peak
Off
peak
Peak kW
during period
Summer peak demand charges
Peak kW
any time
x ______ rate
+ =
Max
peak
x _____ x
_____
+
Partial
peak
Partial
peak
Instructions for each season:
1. Fill in boxes with peak kW for each peak period and
maximum demand for the month.
2. Fill in blanks with peak kW rates from utility.
3. Multiple 1 and 2 to get charges for each peak period.
4. Add up charges for total for the season.
1
2
3
4
9© 2013 Stem, Inc. 9
Impactofdemandcharges
Customer A
50 kW load for 50 hours:
Usage
Energy = 50 kW x 50 hours = 2,500 kWh
Demand = 50 kW
Bill
Energy= 2,500 kWh x $0.15 = $ 375.00
Demand = 50 kW x $28.00 = $1,400.00
Total= $1,775.00
Customer B
5 kW load for 500 hours:
Usage
Energy = 5 kW x 500 hours = 2,500 kWh
Demand = 5 kW
Bill
Energy= 2,500 kWh x $0.15 = $ 375.00
Demand = 5 kW x $28.00 = $ 140.00
Total= $515.00
Identical energy usage, but very different totals due to PATTERN of energy usage
10
Energy charges (kWh) $11,998 50%
Demand charges (kW) $10,802 45%
Miscellaneous $1,322
Total bill $24,123
Demand charges aren’t always obvious
After adding these up, you find…
Energy vs. Demand charges
… and realize the demand charges are
nearly 50% of your electricity bill
11© 2013 Stem, Inc. 11
Yourdemandcharge
1.Links todemand charges for California utilities:
PG&E (E-19) http://www.pge.com/tariffs/tm2/pdf/ELEC_SCHEDS_E-19.pdf
SDG&E (AL-TOU) http://www2.sdge.com/tariff/com-elec/ALTOUPrimary.pdf
SCE (GS-2) https://www.sce.com/wps/portal/home/regulatory/tariff-books/rates-pricing-choices/business-rates/
2.Contact your utility account manager
They are there tohelp you understand your rate schedules
12© 2013 Stem, Inc. 12
Agenda
•Overview of demand charges
•Future trends in demand charges
•Traditional approaches
•A new approach
13© 2013 Stem, Inc. 13
Expecteddemandchargeratechanges
Increase in
PG&E rates in
past 3 years
31%
Source: Tariff data for Pacific Gas and Electric, San Diego Gas and Electric, and Southern California Edison is publicly
available via utility websites
3-year growth rate (2010-2013) 31% 22% 9% 19.5%
Average Demand Charges in CA ($/kW)
$16.64
$18.74
$17.74 $17.88
$21.83
$22.92
$19.34
$21.36
$0.00
$5.00
$10.00
$15.00
$20.00
$25.00
PG&E E-19 SDG&E AL-TOU SCE GS-2 TOU Option B CA IOU average
2010
2013
14© 2013 Stem, Inc. 14
•Aging grid & peaker plants
•Proliferation of solar leading
togreater grid volatility
•Growth in electric vehicle
charging stations
•Climate change
Whythistrend?
15© 2013 Stem, Inc. 15
Agenda
•Overview of demand charges
•Future trends in demand charges
•Traditional approaches
•A new approach
16© 2013 Stem, Inc. 16
Short–term approaches
Loadshifting / shedding
Perform energy-intensive operations when your facility’s demand is
low. For example, run large equipment at night or early in the
morning instead of the middle of the day.
PeakOff-peak Off-peak
17© 2013 Stem, Inc. 17
Short–term approaches
Loadcycling
Control when equipment runs. For instance, if you have six air-
conditioning compressors, you can install a system that allows only
three or four units to operate simultaneously. The building's air handlers
will continue to circulate air and ensure a healthy environment.
HVAC 1 HVAC 3HVAC 2
PeakOff-peak Off-peak
HVAC 2
HVAC 3
18© 2013 Stem, Inc. 18
Short–term approaches
Interlocks & automatic controlling devices
Use timers to pre-heat or pre-cool water and air during off-peak times.
Some utilities will install equipment that interrupts nonessential loads at
your facility for a specified amount of time in exchange for lower rates.
PeakOff-peak Off-peak
19© 2013 Stem, Inc. 19
Short–term approaches
Timing of projects
Be aware of when your meter is read each month. For example, if you
have a project that will take a lot of energy, run that project during a
billing month when you’ve already incurred a high demand charge.
Month 1 Month 2
Meter
reading
Peak
Peak
20© 2013 Stem, Inc. 20
Long–term approaches
• Energy efficiency measures
• Updatinglighting
• Insulationreplacement
• Retro-commissioning equipment
21© 2013 Stem, Inc. 21
Long–term approaches
• Right-sizing equipment
• Air-conditioning systemsarethemostcommon over-
sizedequipment
• LightingretrofitsshouldbedonebeforeACunitsare
downsized
• modernlightingwillreducecoolingrequirements
22© 2013 Stem, Inc. 22
Long–term approaches
• Equipment upgrades
• Ensure equipment has motors that are the
right size for their corresponding pumps
• Newer, more efficient pump and motor
combinations may save on demand charges
23© 2013 Stem, Inc. 23
Agenda
•Overview of demand charges
•Future trends in demand charges
•Traditional approaches
•A new approach
24
• Reduce spikes without interfering with operations
• Work in parallel with other energy efficiency measures
• Require no behavioral changes or training
The ideal solution would …
25© 2013 Stem, Inc. 25
Combine battery storage and
big data analytics to reduce energy costs
Advanced storage solutions
26
How they work
• Predict building’s energy usage
• Charge on-site battery during off-peak
• Anticipate peak events and release stored energy
Max demand without storage
Max demand with storage
27
Results
Reduced demand charges: lower energy bills automatically
Reduced risk: eliminates the need to constantly monitor
energy usage
Future-proofing: allows businesses to hedge against future
energy price changes
Carbon savings: displaces peaker plant capacity by reducing
peak loads
28© 2013 Stem, Inc. 28
For more information on advanced storage
solutions to tackle peak demand charges, visit:
stem.com

Electricity peak demand charges overview

  • 1.
    0© 2013 Stem,Inc. 0 Tacklingpeakdemandcharges
  • 2.
    1© 2013 Stem,Inc. 1 Agenda •Overview of peak demand charges •Future trends in demand charges •Traditional approaches •A new approach
  • 3.
    2© 2013 Stem,Inc. 2 Agenda •Overview of peak demand charges •Future trends in demand charges •Traditional approaches •A new approach
  • 4.
    3© 2013 Stem,Inc. 3 Twopartstoanenergybill Energy charges Demand charge Total amount of energy used Highest 15-minute peak each month Demand charge Energy charges
  • 5.
    4© 2013 Stem,Inc. 4 Whatisademandcharge? •Monthly charge based on highest 15-min peak during that month •Typically 30–70% of total electric bill •Usually differs by season (typically higher in summer than winter)
  • 6.
    5© 2013 Stem,Inc. 5 Whoissubjecttodemandcharges? •Levied on certain commercial &industrial customers Largebusinesses …ontime-of-usebills …withenergyusageexceedingacertainlevel(e.g.2000kWh/month) •All states have demand charges, but at varying levels
  • 7.
    6© 2013 Stem,Inc. 6 Whydodemandchargesexist? • Covers utilities' fixed costs of providing a given level of power • “Hottestday in July” scenariowhere utilities have to have enough capacity on standbyto supplyALLcustomerswith heavy HVAC loads • Used by utilities to reduce peak by making it desirable to: • shiftelectricalusage from peak hours to non-peakhours • reducepower usage during peak hours • Levies higher costs on customers with spikier loads • Passessavings on to other customerswith more consistentloads
  • 8.
    7© 2013 Stem,Inc. 7 Howdemandchargesarecalculated •Highestlevelofusageduringa15minuteperiodoutofanentirebillingcycle •Thatusage,measuredinkW,isthenmultipliedbythedemandchargerate Speedometer – highest Odometer – accumulated Auto Analogy Analogous to demand charge Analogous to energy charge
  • 9.
    8© 2013 Stem,Inc. 8 Demandchargeworksheet Winterrate (e.g. Nov1 – Apr 30) Off peak Partial peak Off peak Peak kW during period x ______ rate Winter peak demand charges Peak kW any time x ______ rate + = Maximum demand Summerrate (e.g. May 1 – Oct 30) Maximum demand Off peak Off peak Peak kW during period Summer peak demand charges Peak kW any time x ______ rate + = Max peak x _____ x _____ + Partial peak Partial peak Instructions for each season: 1. Fill in boxes with peak kW for each peak period and maximum demand for the month. 2. Fill in blanks with peak kW rates from utility. 3. Multiple 1 and 2 to get charges for each peak period. 4. Add up charges for total for the season. 1 2 3 4
  • 10.
    9© 2013 Stem,Inc. 9 Impactofdemandcharges Customer A 50 kW load for 50 hours: Usage Energy = 50 kW x 50 hours = 2,500 kWh Demand = 50 kW Bill Energy= 2,500 kWh x $0.15 = $ 375.00 Demand = 50 kW x $28.00 = $1,400.00 Total= $1,775.00 Customer B 5 kW load for 500 hours: Usage Energy = 5 kW x 500 hours = 2,500 kWh Demand = 5 kW Bill Energy= 2,500 kWh x $0.15 = $ 375.00 Demand = 5 kW x $28.00 = $ 140.00 Total= $515.00 Identical energy usage, but very different totals due to PATTERN of energy usage
  • 11.
    10 Energy charges (kWh)$11,998 50% Demand charges (kW) $10,802 45% Miscellaneous $1,322 Total bill $24,123 Demand charges aren’t always obvious After adding these up, you find… Energy vs. Demand charges … and realize the demand charges are nearly 50% of your electricity bill
  • 12.
    11© 2013 Stem,Inc. 11 Yourdemandcharge 1.Links todemand charges for California utilities: PG&E (E-19) http://www.pge.com/tariffs/tm2/pdf/ELEC_SCHEDS_E-19.pdf SDG&E (AL-TOU) http://www2.sdge.com/tariff/com-elec/ALTOUPrimary.pdf SCE (GS-2) https://www.sce.com/wps/portal/home/regulatory/tariff-books/rates-pricing-choices/business-rates/ 2.Contact your utility account manager They are there tohelp you understand your rate schedules
  • 13.
    12© 2013 Stem,Inc. 12 Agenda •Overview of demand charges •Future trends in demand charges •Traditional approaches •A new approach
  • 14.
    13© 2013 Stem,Inc. 13 Expecteddemandchargeratechanges Increase in PG&E rates in past 3 years 31% Source: Tariff data for Pacific Gas and Electric, San Diego Gas and Electric, and Southern California Edison is publicly available via utility websites 3-year growth rate (2010-2013) 31% 22% 9% 19.5% Average Demand Charges in CA ($/kW) $16.64 $18.74 $17.74 $17.88 $21.83 $22.92 $19.34 $21.36 $0.00 $5.00 $10.00 $15.00 $20.00 $25.00 PG&E E-19 SDG&E AL-TOU SCE GS-2 TOU Option B CA IOU average 2010 2013
  • 15.
    14© 2013 Stem,Inc. 14 •Aging grid & peaker plants •Proliferation of solar leading togreater grid volatility •Growth in electric vehicle charging stations •Climate change Whythistrend?
  • 16.
    15© 2013 Stem,Inc. 15 Agenda •Overview of demand charges •Future trends in demand charges •Traditional approaches •A new approach
  • 17.
    16© 2013 Stem,Inc. 16 Short–term approaches Loadshifting / shedding Perform energy-intensive operations when your facility’s demand is low. For example, run large equipment at night or early in the morning instead of the middle of the day. PeakOff-peak Off-peak
  • 18.
    17© 2013 Stem,Inc. 17 Short–term approaches Loadcycling Control when equipment runs. For instance, if you have six air- conditioning compressors, you can install a system that allows only three or four units to operate simultaneously. The building's air handlers will continue to circulate air and ensure a healthy environment. HVAC 1 HVAC 3HVAC 2 PeakOff-peak Off-peak HVAC 2 HVAC 3
  • 19.
    18© 2013 Stem,Inc. 18 Short–term approaches Interlocks & automatic controlling devices Use timers to pre-heat or pre-cool water and air during off-peak times. Some utilities will install equipment that interrupts nonessential loads at your facility for a specified amount of time in exchange for lower rates. PeakOff-peak Off-peak
  • 20.
    19© 2013 Stem,Inc. 19 Short–term approaches Timing of projects Be aware of when your meter is read each month. For example, if you have a project that will take a lot of energy, run that project during a billing month when you’ve already incurred a high demand charge. Month 1 Month 2 Meter reading Peak Peak
  • 21.
    20© 2013 Stem,Inc. 20 Long–term approaches • Energy efficiency measures • Updatinglighting • Insulationreplacement • Retro-commissioning equipment
  • 22.
    21© 2013 Stem,Inc. 21 Long–term approaches • Right-sizing equipment • Air-conditioning systemsarethemostcommon over- sizedequipment • LightingretrofitsshouldbedonebeforeACunitsare downsized • modernlightingwillreducecoolingrequirements
  • 23.
    22© 2013 Stem,Inc. 22 Long–term approaches • Equipment upgrades • Ensure equipment has motors that are the right size for their corresponding pumps • Newer, more efficient pump and motor combinations may save on demand charges
  • 24.
    23© 2013 Stem,Inc. 23 Agenda •Overview of demand charges •Future trends in demand charges •Traditional approaches •A new approach
  • 25.
    24 • Reduce spikeswithout interfering with operations • Work in parallel with other energy efficiency measures • Require no behavioral changes or training The ideal solution would …
  • 26.
    25© 2013 Stem,Inc. 25 Combine battery storage and big data analytics to reduce energy costs Advanced storage solutions
  • 27.
    26 How they work •Predict building’s energy usage • Charge on-site battery during off-peak • Anticipate peak events and release stored energy Max demand without storage Max demand with storage
  • 28.
    27 Results Reduced demand charges:lower energy bills automatically Reduced risk: eliminates the need to constantly monitor energy usage Future-proofing: allows businesses to hedge against future energy price changes Carbon savings: displaces peaker plant capacity by reducing peak loads
  • 29.
    28© 2013 Stem,Inc. 28 For more information on advanced storage solutions to tackle peak demand charges, visit: stem.com