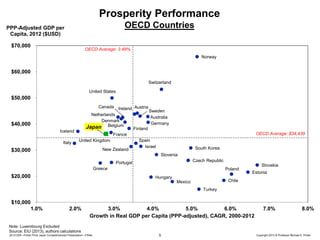
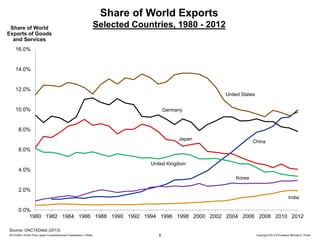
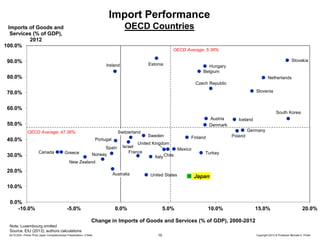
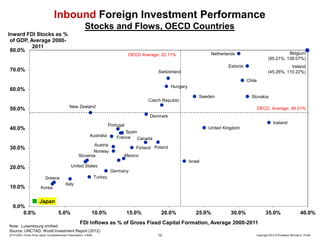
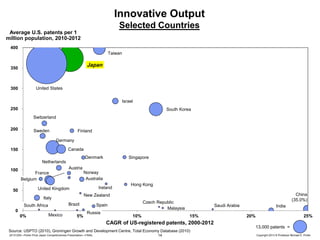
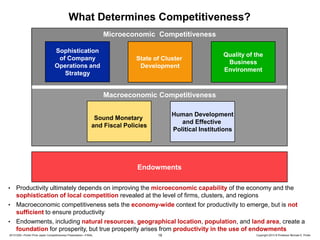
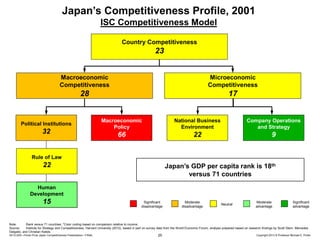
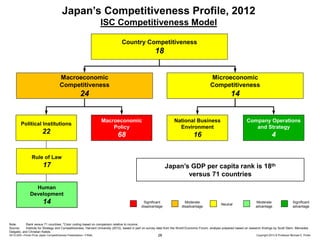
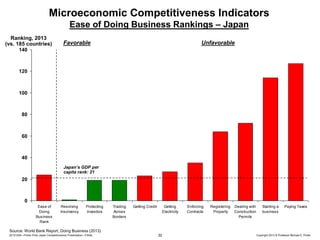
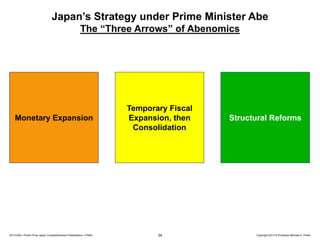
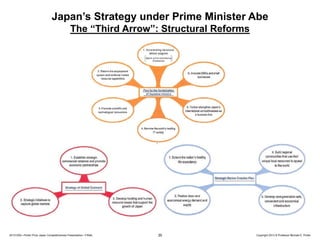
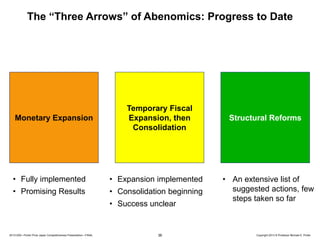
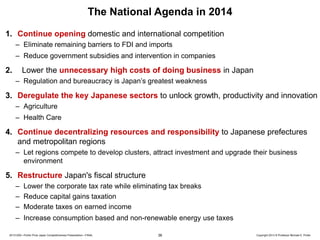
Can Japan Compete?
Revisited

Professor Michael E. Porter
Harvard Business School
Porter Prize Conference
Tokyo, Japan
December 5th, 2013
This presentation draws on ideas from Professor Porter’s articles and books, in particular, The Competitive Advantage of Nations (The Free Press, 1990), “Building the Microeconomic
Foundations of Competitiveness,” in The Global Competitiveness Report (World Economic Forum), “Clusters and the New Competitive Agenda for Companies and Governments” in On
Competition (Harvard Business School Press, 2008), “Creating Shared Value” (Harvard Business Review, Jan 2011), the Social Progress Index Report (Social Progress Imperative)
and ongoing related research. No part of this publication may be reproduced, stored in a retrieval system, or transmitted in any form or by any means - electronic, mechanical,
photocopying, recording, or otherwise - without the permission of Michael E. Porter. For further materials, see the website of the Institute for Strategy and Competitiveness
(www.isc.hbs.edu), FSG (www.fsg.org) and the Social Progress Imperative (www.socialprogressimperative.org).
Can Japan Compete?

• What is the state of Japanese
competitiveness in 2013? How
has Japan progressed since
2000?
• What is Japan’s strategic
agenda for 2014 and beyond?
• Is Abenomics sufficient?

20131205—Porter Prize Japan Competitiveness Presentation—FINAL

2

Copyright 2013 © Professor Michael E. Porter
Can Japan Compete?

1. Japan’s Economic Performance

2. Competitiveness and Economic Growth: The New Learning

3.

The Strategic Agenda for Japan in 2014

20131205—Porter Prize Japan Competitiveness Presentation—FINAL

3

Copyright 2013 © Professor Michael E. Porter
Japan’s Economic Performance
• Overall economic performance has been disappointing, reflecting a poor
macroeconomic environment and continuing microeconomic weaknesses

20131205—Porter Prize Japan Competitiveness Presentation—FINAL

4

Copyright 2013 © Professor Michael E. Porter
Prosperity Performance
OECD Countries

PPP-Adjusted GDP per
Capita, 2012 ($USD)

$70,000

OECD Average: 3.49%
Norway

$60,000
Switzerland
United States

$50,000

$40,000
Iceland
Italy

$30,000

Canada Ireland Austria
Sweden
Netherlands
Australia
Denmark
Germany
Japan Belgium
Finland
France
Spain
United Kingdom
Israel
New Zealand
Slovenia

OECD Average: $34,439
South Korea
Czech Republic

Portugal
Greece

$20,000

Poland
Hungary

Slovakia
Estonia

Chile

Mexico
Turkey

$10,000
1.0%

2.0%

3.0%
4.0%
5.0%
6.0%
Growth in Real GDP per Capita (PPP-adjusted), CAGR, 2000-2012

7.0%

8.0%

Note: Luxembourg Excluded
Source: EIU (2013), authors calculations
20131205—Porter Prize Japan Competitiveness Presentation—FINAL

5

Copyright 2013 © Professor Michael E. Porter
Japan’s Economic Performance
• Overall economic performance has been disappointing, reflecting a poor
macroeconomic environment and continuing microeconomic weaknesses
• While growth in productivity of existing workers remains in line with many
advanced OECD peers, Japan has suffered from declining workforce
participation

20131205—Porter Prize Japan Competitiveness Presentation—FINAL

6

Copyright 2013 © Professor Michael E. Porter
Japan’s Economic Performance
• Overall economic performance has been disappointing, reflecting a poor
macroeconomic environment and continuing microeconomic weaknesses
• While growth in productivity of existing workers remains in line with many
advanced OECD peers, Japan has suffered from declining workforce
participation
• Japan’s share of world export share has continued to gradually fall, in line with
advanced OECD countries besides Germany

20131205—Porter Prize Japan Competitiveness Presentation—FINAL

7

Copyright 2013 © Professor Michael E. Porter
Share of World Exports
Share of World
Exports of Goods
and Services

Selected Countries, 1980 - 2012

16.0%

14.0%

12.0%
United States

10.0%

Germany

8.0%
Japan

China

6.0%
United Kingdom

4.0%
Korea

2.0%
India

0.0%
1980 1982 1984 1986 1988 1990 1992 1994 1996 1998 2000 2002 2004 2006 2008 2010 2012
Source: UNCTADstat (2013)
20131205—Porter Prize Japan Competitiveness Presentation—FINAL

8

Copyright 2013 © Professor Michael E. Porter
Japan’s Economic Performance
• Overall economic performance has been disappointing, reflecting a poor
macroeconomic environment and continuing microeconomic weaknesses
• While growth in productivity of existing workers remains in line with many
advanced OECD peers, Japan has suffered from declining workforce
participation
• Japan’s share of world export share has continued to gradually fall, in line with
advanced OECD countries besides Germany

• Imports into the Japanese economy have grown, reflecting gradual opening

20131205—Porter Prize Japan Competitiveness Presentation—FINAL

9

Copyright 2013 © Professor Michael E. Porter
Import Performance
OECD Countries

Imports of Goods and
Services (% of GDP),
2012
100.0%

OECD Average: 5.38%

90.0%

Slovakia

Estonia

Ireland

Hungary
Belgium

80.0%

Netherlands
Czech Republic
Slovenia

70.0%
60.0%

South Korea
Austria
Denmark

50.0%
OECD Average: 47.36%

Switzerland

40.0%

Portugal

30.0%

Greece

Norway

Germany
Sweden

Poland

Finland

United Kingdom

Spain
Canada

Iceland

Israel
France

Mexico
Italy Chile

Turkey

New Zealand

20.0%

Australia

United States

Japan

10.0%
0.0%
-10.0%

-5.0%

0.0%

5.0%

10.0%

15.0%

20.0%

Change in Imports of Goods and Services (% of GDP), 2000-2012
Note: Luxembourg omitted
Source: EIU (2013), authors calculations
20131205—Porter Prize Japan Competitiveness Presentation—FINAL

10

Copyright 2013 © Professor Michael E. Porter
Japan’s Economic Performance
• Overall economic performance has been disappointing, reflecting a poor
macroeconomic environment and continuing microeconomic weaknesses
• While growth in productivity of existing workers remains in line with many
advanced OECD peers, Japan has suffered from declining workforce
participation
• Japan’s share of world export share has continued to gradually fall, in line with
advanced OECD countries besides Germany

• Imports into the Japanese economy have grown, reflecting gradual opening
• FDI inflows into the Japanese economy remain the lowest of any OECD country.
Outbound FDI has grown but lags all other advanced economies

20131205—Porter Prize Japan Competitiveness Presentation—FINAL

11

Copyright 2013 © Professor Michael E. Porter
Inbound Foreign Investment Performance
Stocks and Flows, OECD Countries
Inward FDI Stocks as %
of GDP, Average 20002011
80.0%

Belgium
(95.21%, 139.07%)

Netherlands

OECD Average: 22.71%

Estonia

70.0%

Ireland
(45.26%, 110.22%)

Switzerland
Chile
Hungary

60.0%

Czech Republic

Sweden

Slovakia

New Zealand

50.0%

OECD Average: 48.01%
Denmark
Iceland

Portugal

40.0%
Australia

Austria
Norway
Slovenia

30.0%

United Kingdom

Spain
France Canada
Finland Poland
Mexico
Israel

United States

20.0%

Germany
Turkey

Greece

10.0%

Korea

Italy

Japan
0.0%
0.0%

5.0%

10.0%

15.0%

20.0%

25.0%

30.0%

35.0%

40.0%

FDI Inflows as % of Gross Fixed Capital Formation, Average 2000-2011

Note: Luxembourg omitted
Source: UNCTAD, World Investment Report (2012)
20131205—Porter Prize Japan Competitiveness Presentation—FINAL

12

Copyright 2013 © Professor Michael E. Porter
Japan’s Economic Performance
• Overall economic performance has been disappointing, reflecting a poor
macroeconomic environment and continuing microeconomic weaknesses
• While growth in productivity of existing workers remains in line with many
advanced OECD peers, Japan has suffered from declining workforce
participation
• Japan’s share of world export share has continued to gradually fall, in line with
advanced OECD countries besides Germany

• Imports into the Japanese economy have grown, reflecting gradual opening
• FDI inflows into the Japanese economy remain the lowest of any OECD country.
Outbound FDI has grown but lags all other advanced economies

• Japan continues to be among the top innovators in the world, but some other
countries are more rapidly increasing R&D spending

20131205—Porter Prize Japan Competitiveness Presentation—FINAL

13

Copyright 2013 © Professor Michael E. Porter
Innovative Output
Selected Countries
Average U.S. patents per 1
million population, 2010-2012
400
Taiwan

Japan

350

United States

300

Israel
250

South Korea
Switzerland

200

Sweden

Finland
Germany
Canada

150

Denmark

Singapore

Netherlands
100

Austria
Norway
Australia

France
Belgium

Ireland

United Kingdom

50

Brazil

0
0%

Mexico

China
(35.0%)

New Zealand

Italy
South Africa

Hong Kong

5%

Czech Republic
Malaysia

Spain
Russia

10%

Saudi Arabia
15%

CAGR of US-registered patents, 2000-2012
Source: USPTO (2010), Groningen Growth and Development Centre, Total Economy Database (2010)
20131205—Porter Prize Japan Competitiveness Presentation—FINAL

14

India
20%

25%
13,000 patents =
Copyright 2013 © Professor Michael E. Porter
Can Japan Compete?

1. Japan’s Economic Performance

2. Competitiveness and Economic Growth: The New Learning

3.

The Strategic Agenda for Japan in 2014

20131205—Porter Prize Japan Competitiveness Presentation—FINAL

15

Copyright 2013 © Professor Michael E. Porter
Competitiveness and Economic Growth

A nation or region is competitive to the extent that firms operating there are able
to compete successfully in the regional and global economy while maintaining
or improving wages and living standards for the average citizen

• Competitiveness depends on the long-run productivity of a location as a
place to do business
- The productivity of existing firms and workers
- The ability to achieve high participation of citizens in the workforce
• Competitiveness is not:
- Low wages
- A weak currency
- Jobs per se

20131205—Porter Prize Japan Competitiveness Presentation—FINAL

16

Copyright 2013 © Professor Michael E. Porter
What Determines Competitiveness?

Endowments

•

Endowments, including natural resources, geographical location, population, and land area, create a
foundation for prosperity, but true prosperity arises from productivity in the use of endowments

20131205—Porter Prize Japan Competitiveness Presentation—FINAL

17

Copyright 2013 © Professor Michael E. Porter
What Determines Competitiveness?

Macroeconomic Competitiveness
Human Development
and Effective
Political Institutions

Sound Monetary
and Fiscal Policies

Endowments

•

Macroeconomic competitiveness sets the economy-wide context for productivity to emerge, but is not
sufficient to ensure productivity
• Endowments, including natural resources, geographical location, population, and land area, create a
foundation for prosperity, but true prosperity arises from productivity in the use of endowments
20131205—Porter Prize Japan Competitiveness Presentation—FINAL

18

Copyright 2013 © Professor Michael E. Porter
What Determines Competitiveness?
Microeconomic Competitiveness
Sophistication
of Company
Operations and
Strategy

State of Cluster
Development

Quality of the
Business
Environment

Macroeconomic Competitiveness
Human Development
and Effective
Political Institutions

Sound Monetary
and Fiscal Policies

Endowments
•

Productivity ultimately depends on improving the microeconomic capability of the economy and the
sophistication of local competition revealed at the level of firms, clusters, and regions
• Macroeconomic competitiveness sets the economy-wide context for productivity to emerge, but is not
sufficient to ensure productivity
• Endowments, including natural resources, geographical location, population, and land area, create a
foundation for prosperity, but true prosperity arises from productivity in the use of endowments
20131205—Porter Prize Japan Competitiveness Presentation—FINAL

19

Copyright 2013 © Professor Michael E. Porter
Improving the Quality of the Business Environment
Context for
Firm Strategy
and Rivalry

• Local rules and incentives that
encourage investment and productivity
Factor
(Input)
Conditions

– e.g. incentives for capital investments,
IP protection

• Sound corporate governance

Demand
Conditions

• Open and vigorous local competition
• Improving access to high quality
business inputs
–
–
–
–

Qualified human resources
Capital availability
Physical infrastructure
Scientific and technological
infrastructure
– Efficient regulatory system

− Openness to foreign competition
− Strict competition laws

• Sophisticated and demanding local
needs

Related and
Supporting
Industries

– e.g., Strict quality, safety, and
environmental standards

• Availability and quality of suppliers and
supporting industries

• Many things matter for competitiveness
• Successful economic development is a process of successive upgrading, in which the
business environment improves to enable increasingly sophisticated ways of competing
20131205—Porter Prize Japan Competitiveness Presentation—FINAL

20

Copyright 2013 © Professor Michael E. Porter
Developing Clusters: Tourism in Cairns, Australia
Public Relations &
Market Research
Services

Travel Agents

Tour Operators

Food
Suppliers

Attractions and
Activities

Hotels

Government Agencies
e.g., Australian Tourism
Commission,
Great Barrier Reef Authority

Local
Transportation

e.g., theme parks,
casinos, sports

Souvenirs,
Duty Free

Property
Services

Maintenance
Services

Local Retail,
Health Care, and
Other Services

Airlines,
Cruise Ships

Restaurants

Banks,
Foreign
Exchange

Educational Institutions

Industry Groups

e.g., James Cook University,
Cairns College of TAFE

e.g., Queensland Tourism
Industry Council

Sources: HBS student team research (2003) - Peter Tynan, Chai McConnell, Alexandra West, Jean Hayden
20131205—Porter Prize Japan Competitiveness Presentation—FINAL

21

Copyright 2013 © Professor Michael E. Porter
Prosperity of Japanese Prefectures
$45,000

Japan Real Growth Rate of GDP
per Capita: 2.75%

Tokyo ($ 62,195, 2.14 %)

Gross Domestic Product per Capita, 2010
(Current $US at PPP)

$40,000
Shiga
Aichi

Shizuoka

Osaka

$35,000

Japan GDP per Capita:
$34,758
Ishikawa

Hokkaido

Gumma

Okayama Niigata
Kagawa

Nagano

Gifu

Yamaguchi

Yamanashi

Fukuoka
Tokushima
Wakayama

Kyoto
Ehime
Akita

Hyogo Shimane
Iwate
Chiba

Mie

Ibaraki

Oita

Fukushima

Kanagawa
Tottori

Tochigi

Hiroshima

Miyagi

$30,000

Fukui

Toyama

Saga
Yamagata

Kumamoto

Kagoshima
Miyazaki
Nagasaki

Aomori

Kochi

$25,000

Saitama

Okinawa

Nara

$20,000
1.5%

2.0%

2.5%

3.0%

3.5%

4.0%

Real Growth Rate of GDP per capita, 2000-2010
Source: OECD iLibrary (2013)
20131205—Porter Prize Japan Competitiveness Presentation—FINAL

22

Copyright 2013 © Professor Michael E. Porter
The Role of Regions in Economic Development
• Many essential levers of competitiveness reside at the regional level
• Regions specialize in different sets of clusters

• Regions are a critical unit in competitiveness
• Each region needs its own distinctive strategy and action agenda
– Business environment improvement

– Cluster upgrading
– Improving institutional effectiveness

20131205—Porter Prize Japan Competitiveness Presentation—FINAL

23

Copyright 2013 © Professor Michael E. Porter
Geographic Influences on Competitiveness

Neighboring Countries

Nation

Regions and Cities

• Economic coordination and integration with neighboring countries is a major force of
productivity and competitiveness
20131205—Porter Prize Japan Competitiveness Presentation—FINAL

24

Copyright 2013 © Professor Michael E. Porter
Japan’s Competitiveness Profile, 2001
ISC Competitiveness Model
Country Competitiveness

23
Macroeconomic
Competitiveness

Microeconomic
Competitiveness

28

17

Political Institutions

32

Macroeconomic
Policy

National Business
Environment

Company Operations
and Strategy

66

22

9

Rule of Law

22

Japan’s GDP per capita rank is 18th
versus 71 countries

Human
Development

15

Significant
disadvantage

Moderate
disadvantage

Neutral

Moderate
advantage

Significant
advantage

Note:
Rank versus 71 countries; *Color coding based on comparison relative to income;
Source:
Institute for Strategy and Competitiveness, Harvard University (2012), based in part on survey data from the World Economic Forum; analysis prepared based on research findings by Scott Stern, Mercedes
Delgado, and Christian Ketels.
20131205—Porter Prize Japan Competitiveness Presentation—FINAL

25

Copyright 2013 © Professor Michael E. Porter
Can Japan Compete?
The Corporate Agenda in 2001
1. Shift the goal from growth to profitability
2. Create distinctive, long term strategies
3. Expand the focus of operational effectiveness to IT
4. Understand the role of industry structure
5. Reduce unrelated diversification

6. Update the Japanese organizational and governance model
7. Develop a stronger role for the private sector in economic
development

20131205—Porter Prize Japan Competitiveness Presentation—FINAL

26

Copyright 2013 © Professor Michael E. Porter
Can Japan Compete?
Government Agenda in 2001
1. Open up domestic competition and reduce government
intervention
2. Open trade and foreign investment
3. Modernize archaic and inefficient domestic sectors

4. Build a world class university system
5. Create new models of innovation and entrepreneurship

6. Encourage decentralization, regional specialization, and
cluster development
7. Create stronger corporate accountability

20131205—Porter Prize Japan Competitiveness Presentation—FINAL

27

Copyright 2013 © Professor Michael E. Porter
Japan’s Competitiveness Profile, 2012
ISC Competitiveness Model
Country Competitiveness

18
Macroeconomic
Competitiveness

Microeconomic
Competitiveness

24

14

Political Institutions

22

Macroeconomic
Policy

National Business
Environment

Company Operations
and Strategy

68

16

4

Rule of Law

17

Japan’s GDP per capita rank is 18th
versus 71 countries

Human
Development

14

Significant
disadvantage

Moderate
disadvantage

Neutral

Moderate
advantage

Significant
advantage

Note:
Rank versus 71 countries; *Color coding based on comparison relative to income;
Source:
Institute for Strategy and Competitiveness, Harvard University (2012), based in part on survey data from the World Economic Forum; analysis prepared based on research findings by Scott Stern, Mercedes
Delgado, and Christian Ketels.
20131205—Porter Prize Japan Competitiveness Presentation—FINAL

28

Copyright 2013 © Professor Michael E. Porter
Company Progress since 2001
1.

Shift the goal from growth to profitability
– More businesses are being divested due to inadequate profitability, but Japanese ROIC remains low

2.

Create distinctive, long term strategies
– The Porter Prize has recognized 41 companies with distinctive strategies since 2001
– Many companies have become more focused

3.

Expand the focus of operational effectiveness to IT
– The utilization of IT has increased substantially, improving productivity

4.

Understand the role of industry structure
– Industry attractiveness has become a larger factor in corporate choices

5.

Reduce unrelated diversification
– Many corporate portfolios have been pruned

6.

Update the Japanese organizational and governance model
– The number of executive board members has been reduced
– The number of companies with outside board members have substantially increased
– Cross shareholding has fallen

7.

Develop a stronger role for the private sector in economic development
– Business leaders are becoming more involved in national and regional economic development
– Shared value has become a major new thrust in Japanese corporations

20131205—Porter Prize Japan Competitiveness Presentation—FINAL

29

Copyright 2013 © Professor Michael E. Porter
Government Progress Since 2001
1.

Open up domestic competition and reduce government intervention
–
–
–

2.

Stricter anti-trust laws and enforcement has brought Japan closer to world standards
Government still prone to intervention and government solutions (e.g. electronics)
Targeting persists in “growth industries”

Open trade and foreign investment
–
–

3.

FTAs signed with many nations, with the TPP being discussed
FDI restrictions have been partially reduced, but barriers remain

Modernize archaic and inefficient domestic sectors
–
–
–

4.

Rules governing construction improved
Protection for small scale retailing reduced
Agriculture largely unchanged

Build a world class university system
–
–

5.

Some steps have been taken to raise university standards and accountability
Archaic rules still disadvantage students studying outside Japan

Create new models of innovation and entrepreneurship
–
–
–

6.

Rules for starting businesses have improved, though still not world class
IP protection strengthened
Access to public listing by newer companies has improved

Encourage decentralization, regional specialization, and cluster development
–
–

7.

Cluster initiatives have proliferated, but progress remains uneven
Only modest delegation of central government powers has occurred

Create stronger corporate accountability
–
–

At least one independent board member is recommended for TSE-listed companies
Few companies still have effective corporate governance

20131205—Porter Prize Japan Competitiveness Presentation—FINAL

30

Copyright 2013 © Professor Michael E. Porter
Trajectory of the Japanese Business Environment
Rank in 2012

Change in
Rank

16

+7

Supporting and Related
Industries and Clusters

4

0

Logistical Infrastructure

12

-4

Demand Conditions

16

+3

Capital Market Infrastructure

20

+7

Communications Infrastructure

21

0

Factor Conditions

21

+1

Context for Strategy and Rivalry

22

+7

Innovation Infrastructure

23

-2

Regulatory Infrastructure

38

-2

Overall Business Environment

Rank versus a
consistent
sample of 71
countries

Note:
Rank versus 71 countries
Source:
Institute for Strategy and Competitiveness, Harvard University (2012), based in part on survey data from the World Economic Forum; analysis prepared based on research findings by Scott Stern, Mercedes
Delgado, and Christian Ketels.
20131205—Porter Prize Japan Competitiveness Presentation—FINAL

31

Copyright 2013 © Professor Michael E. Porter
Microeconomic Competitiveness Indicators
Ease of Doing Business Rankings – Japan
Ranking, 2013
(vs. 185 countries)

Favorable

Unfavorable

140

120

100

80

60

40
Japan’s GDP per
capita rank: 21

20

0
Ease of
Doing
Business
Rank

Resolving
Insolvency

Protecting
Investors

Trading
Across
Borders

Getting Credit

Getting
Electricity

Enforcing
Contracts

Registering
Property

Dealing with
Construction
Permits

Starting a
business

Paying Taxes

Source: World Bank Report, Doing Business (2013)
20131205—Porter Prize Japan Competitiveness Presentation—FINAL

32

Copyright 2013 © Professor Michael E. Porter
Can Japan Compete?

1. Japan’s Economic Performance

2. Competitiveness and Economic Growth: The New Learning

3.

The Strategic Agenda for Japan in 2014

20131205—Porter Prize Japan Competitiveness Presentation—FINAL

33

Copyright 2013 © Professor Michael E. Porter
Japan’s Strategy under Prime Minister Abe
The “Three Arrows” of Abenomics

Monetary Expansion

20131205—Porter Prize Japan Competitiveness Presentation—FINAL

Temporary Fiscal
Expansion, then
Consolidation

34

Structural Reforms

Copyright 2013 © Professor Michael E. Porter
Japan’s Strategy under Prime Minister Abe
The “Third Arrow”: Structural Reforms

20131205—Porter Prize Japan Competitiveness Presentation—FINAL

35

Copyright 2013 © Professor Michael E. Porter
The “Three Arrows” of Abenomics: Progress to Date

Monetary Expansion

Temporary Fiscal
Expansion, then
Consolidation

• Fully implemented

• Expansion implemented

• Promising Results

• Consolidation beginning
• Success unclear

20131205—Porter Prize Japan Competitiveness Presentation—FINAL

36

Structural Reforms

• An extensive list of
suggested actions, few
steps taken so far

Copyright 2013 © Professor Michael E. Porter
The Japanese Corporate Agenda for 2014
1. Accelerate the shift to strategic thinking
2. Accelerate globalization, making greater use of M&A
3. Encourage fast track leadership development and mid career
recruiting to complement internal promotion
– Mobility of talent will dramatically improve Japanese company
performance

4. Simplify and streamline decision making while continuing to
improve accountability and governance
5. Evolve executive compensation practices to incentivize risk
taking
6.

Embrace shared value as the guiding principle for Japanese
business

20131205—Porter Prize Japan Competitiveness Presentation—FINAL

37

Copyright 2013 © Professor Michael E. Porter
The National Agenda in 2014
1. Continue opening domestic and international competition
– Eliminate remaining barriers to FDI and imports

– Reduce government subsidies and intervention in companies

2.

Lower the unnecessary high costs of doing business in Japan
– Regulation and bureaucracy is Japan’s greatest weakness

3. Deregulate the key Japanese sectors to unlock growth, productivity and innovation
– Agriculture
– Health Care

4. Continue decentralizing resources and responsibility to Japanese prefectures
and metropolitan regions
– Let regions compete to develop clusters, attract investment and upgrade their business
environment

5. Restructure Japan's fiscal structure
– Lower the corporate tax rate while eliminating tax breaks
– Reduce capital gains taxation
– Moderate taxes on earned income
– Increase consumption based and non-renewable energy use taxes
20131205—Porter Prize Japan Competitiveness Presentation—FINAL

38

Copyright 2013 © Professor Michael E. Porter
The National Agenda in 2014
6. Set a pragmatic long term energy strategy
– The cost of energy is a major competitiveness issue
– Transitional solutions and carbon taxes will be needed to bridge the present and the future
– Energy efficiency must become a national priority

7. Connect Japan to the rest of the world
– Raise language skills
– Support international education
– Welcome skilled immigration
– Embrace the internationalization of knowledge
– Encourage deeper globalization by Japanese companies
– Move from politics to building economic partnership with other Asian countries

8. Tap the talent and potential of Japanese citizens and enrich the nation’s
human resources
– Embrace and enable womens’ participation in the workforce
– Open up labor mobility
– Welcome skilled expatriates from abroad
– Encourage and support Japanese students studying abroad

– Raise the standards in Japanese universities and business schools

9. Deepen economic integration of Japan in the Asian region
20131205—Porter Prize Japan Competitiveness Presentation—FINAL

39

Copyright 2013 © Professor Michael E. Porter

2013 1205---can japan-compete_revisited---michael_porter

  • 1.
    Can Japan Compete? Revisited ProfessorMichael E. Porter Harvard Business School Porter Prize Conference Tokyo, Japan December 5th, 2013 This presentation draws on ideas from Professor Porter’s articles and books, in particular, The Competitive Advantage of Nations (The Free Press, 1990), “Building the Microeconomic Foundations of Competitiveness,” in The Global Competitiveness Report (World Economic Forum), “Clusters and the New Competitive Agenda for Companies and Governments” in On Competition (Harvard Business School Press, 2008), “Creating Shared Value” (Harvard Business Review, Jan 2011), the Social Progress Index Report (Social Progress Imperative) and ongoing related research. No part of this publication may be reproduced, stored in a retrieval system, or transmitted in any form or by any means - electronic, mechanical, photocopying, recording, or otherwise - without the permission of Michael E. Porter. For further materials, see the website of the Institute for Strategy and Competitiveness (www.isc.hbs.edu), FSG (www.fsg.org) and the Social Progress Imperative (www.socialprogressimperative.org).
  • 2.
    Can Japan Compete? •What is the state of Japanese competitiveness in 2013? How has Japan progressed since 2000? • What is Japan’s strategic agenda for 2014 and beyond? • Is Abenomics sufficient? 20131205—Porter Prize Japan Competitiveness Presentation—FINAL 2 Copyright 2013 © Professor Michael E. Porter
  • 3.
    Can Japan Compete? 1.Japan’s Economic Performance 2. Competitiveness and Economic Growth: The New Learning 3. The Strategic Agenda for Japan in 2014 20131205—Porter Prize Japan Competitiveness Presentation—FINAL 3 Copyright 2013 © Professor Michael E. Porter
  • 4.
    Japan’s Economic Performance •Overall economic performance has been disappointing, reflecting a poor macroeconomic environment and continuing microeconomic weaknesses 20131205—Porter Prize Japan Competitiveness Presentation—FINAL 4 Copyright 2013 © Professor Michael E. Porter
  • 5.
    Prosperity Performance OECD Countries PPP-AdjustedGDP per Capita, 2012 ($USD) $70,000 OECD Average: 3.49% Norway $60,000 Switzerland United States $50,000 $40,000 Iceland Italy $30,000 Canada Ireland Austria Sweden Netherlands Australia Denmark Germany Japan Belgium Finland France Spain United Kingdom Israel New Zealand Slovenia OECD Average: $34,439 South Korea Czech Republic Portugal Greece $20,000 Poland Hungary Slovakia Estonia Chile Mexico Turkey $10,000 1.0% 2.0% 3.0% 4.0% 5.0% 6.0% Growth in Real GDP per Capita (PPP-adjusted), CAGR, 2000-2012 7.0% 8.0% Note: Luxembourg Excluded Source: EIU (2013), authors calculations 20131205—Porter Prize Japan Competitiveness Presentation—FINAL 5 Copyright 2013 © Professor Michael E. Porter
  • 6.
    Japan’s Economic Performance •Overall economic performance has been disappointing, reflecting a poor macroeconomic environment and continuing microeconomic weaknesses • While growth in productivity of existing workers remains in line with many advanced OECD peers, Japan has suffered from declining workforce participation 20131205—Porter Prize Japan Competitiveness Presentation—FINAL 6 Copyright 2013 © Professor Michael E. Porter
  • 7.
    Japan’s Economic Performance •Overall economic performance has been disappointing, reflecting a poor macroeconomic environment and continuing microeconomic weaknesses • While growth in productivity of existing workers remains in line with many advanced OECD peers, Japan has suffered from declining workforce participation • Japan’s share of world export share has continued to gradually fall, in line with advanced OECD countries besides Germany 20131205—Porter Prize Japan Competitiveness Presentation—FINAL 7 Copyright 2013 © Professor Michael E. Porter
  • 8.
    Share of WorldExports Share of World Exports of Goods and Services Selected Countries, 1980 - 2012 16.0% 14.0% 12.0% United States 10.0% Germany 8.0% Japan China 6.0% United Kingdom 4.0% Korea 2.0% India 0.0% 1980 1982 1984 1986 1988 1990 1992 1994 1996 1998 2000 2002 2004 2006 2008 2010 2012 Source: UNCTADstat (2013) 20131205—Porter Prize Japan Competitiveness Presentation—FINAL 8 Copyright 2013 © Professor Michael E. Porter
  • 9.
    Japan’s Economic Performance •Overall economic performance has been disappointing, reflecting a poor macroeconomic environment and continuing microeconomic weaknesses • While growth in productivity of existing workers remains in line with many advanced OECD peers, Japan has suffered from declining workforce participation • Japan’s share of world export share has continued to gradually fall, in line with advanced OECD countries besides Germany • Imports into the Japanese economy have grown, reflecting gradual opening 20131205—Porter Prize Japan Competitiveness Presentation—FINAL 9 Copyright 2013 © Professor Michael E. Porter
  • 10.
    Import Performance OECD Countries Importsof Goods and Services (% of GDP), 2012 100.0% OECD Average: 5.38% 90.0% Slovakia Estonia Ireland Hungary Belgium 80.0% Netherlands Czech Republic Slovenia 70.0% 60.0% South Korea Austria Denmark 50.0% OECD Average: 47.36% Switzerland 40.0% Portugal 30.0% Greece Norway Germany Sweden Poland Finland United Kingdom Spain Canada Iceland Israel France Mexico Italy Chile Turkey New Zealand 20.0% Australia United States Japan 10.0% 0.0% -10.0% -5.0% 0.0% 5.0% 10.0% 15.0% 20.0% Change in Imports of Goods and Services (% of GDP), 2000-2012 Note: Luxembourg omitted Source: EIU (2013), authors calculations 20131205—Porter Prize Japan Competitiveness Presentation—FINAL 10 Copyright 2013 © Professor Michael E. Porter
  • 11.
    Japan’s Economic Performance •Overall economic performance has been disappointing, reflecting a poor macroeconomic environment and continuing microeconomic weaknesses • While growth in productivity of existing workers remains in line with many advanced OECD peers, Japan has suffered from declining workforce participation • Japan’s share of world export share has continued to gradually fall, in line with advanced OECD countries besides Germany • Imports into the Japanese economy have grown, reflecting gradual opening • FDI inflows into the Japanese economy remain the lowest of any OECD country. Outbound FDI has grown but lags all other advanced economies 20131205—Porter Prize Japan Competitiveness Presentation—FINAL 11 Copyright 2013 © Professor Michael E. Porter
  • 12.
    Inbound Foreign InvestmentPerformance Stocks and Flows, OECD Countries Inward FDI Stocks as % of GDP, Average 20002011 80.0% Belgium (95.21%, 139.07%) Netherlands OECD Average: 22.71% Estonia 70.0% Ireland (45.26%, 110.22%) Switzerland Chile Hungary 60.0% Czech Republic Sweden Slovakia New Zealand 50.0% OECD Average: 48.01% Denmark Iceland Portugal 40.0% Australia Austria Norway Slovenia 30.0% United Kingdom Spain France Canada Finland Poland Mexico Israel United States 20.0% Germany Turkey Greece 10.0% Korea Italy Japan 0.0% 0.0% 5.0% 10.0% 15.0% 20.0% 25.0% 30.0% 35.0% 40.0% FDI Inflows as % of Gross Fixed Capital Formation, Average 2000-2011 Note: Luxembourg omitted Source: UNCTAD, World Investment Report (2012) 20131205—Porter Prize Japan Competitiveness Presentation—FINAL 12 Copyright 2013 © Professor Michael E. Porter
  • 13.
    Japan’s Economic Performance •Overall economic performance has been disappointing, reflecting a poor macroeconomic environment and continuing microeconomic weaknesses • While growth in productivity of existing workers remains in line with many advanced OECD peers, Japan has suffered from declining workforce participation • Japan’s share of world export share has continued to gradually fall, in line with advanced OECD countries besides Germany • Imports into the Japanese economy have grown, reflecting gradual opening • FDI inflows into the Japanese economy remain the lowest of any OECD country. Outbound FDI has grown but lags all other advanced economies • Japan continues to be among the top innovators in the world, but some other countries are more rapidly increasing R&D spending 20131205—Porter Prize Japan Competitiveness Presentation—FINAL 13 Copyright 2013 © Professor Michael E. Porter
  • 14.
    Innovative Output Selected Countries AverageU.S. patents per 1 million population, 2010-2012 400 Taiwan Japan 350 United States 300 Israel 250 South Korea Switzerland 200 Sweden Finland Germany Canada 150 Denmark Singapore Netherlands 100 Austria Norway Australia France Belgium Ireland United Kingdom 50 Brazil 0 0% Mexico China (35.0%) New Zealand Italy South Africa Hong Kong 5% Czech Republic Malaysia Spain Russia 10% Saudi Arabia 15% CAGR of US-registered patents, 2000-2012 Source: USPTO (2010), Groningen Growth and Development Centre, Total Economy Database (2010) 20131205—Porter Prize Japan Competitiveness Presentation—FINAL 14 India 20% 25% 13,000 patents = Copyright 2013 © Professor Michael E. Porter
  • 15.
    Can Japan Compete? 1.Japan’s Economic Performance 2. Competitiveness and Economic Growth: The New Learning 3. The Strategic Agenda for Japan in 2014 20131205—Porter Prize Japan Competitiveness Presentation—FINAL 15 Copyright 2013 © Professor Michael E. Porter
  • 16.
    Competitiveness and EconomicGrowth A nation or region is competitive to the extent that firms operating there are able to compete successfully in the regional and global economy while maintaining or improving wages and living standards for the average citizen • Competitiveness depends on the long-run productivity of a location as a place to do business - The productivity of existing firms and workers - The ability to achieve high participation of citizens in the workforce • Competitiveness is not: - Low wages - A weak currency - Jobs per se 20131205—Porter Prize Japan Competitiveness Presentation—FINAL 16 Copyright 2013 © Professor Michael E. Porter
  • 17.
    What Determines Competitiveness? Endowments • Endowments,including natural resources, geographical location, population, and land area, create a foundation for prosperity, but true prosperity arises from productivity in the use of endowments 20131205—Porter Prize Japan Competitiveness Presentation—FINAL 17 Copyright 2013 © Professor Michael E. Porter
  • 18.
    What Determines Competitiveness? MacroeconomicCompetitiveness Human Development and Effective Political Institutions Sound Monetary and Fiscal Policies Endowments • Macroeconomic competitiveness sets the economy-wide context for productivity to emerge, but is not sufficient to ensure productivity • Endowments, including natural resources, geographical location, population, and land area, create a foundation for prosperity, but true prosperity arises from productivity in the use of endowments 20131205—Porter Prize Japan Competitiveness Presentation—FINAL 18 Copyright 2013 © Professor Michael E. Porter
  • 19.
    What Determines Competitiveness? MicroeconomicCompetitiveness Sophistication of Company Operations and Strategy State of Cluster Development Quality of the Business Environment Macroeconomic Competitiveness Human Development and Effective Political Institutions Sound Monetary and Fiscal Policies Endowments • Productivity ultimately depends on improving the microeconomic capability of the economy and the sophistication of local competition revealed at the level of firms, clusters, and regions • Macroeconomic competitiveness sets the economy-wide context for productivity to emerge, but is not sufficient to ensure productivity • Endowments, including natural resources, geographical location, population, and land area, create a foundation for prosperity, but true prosperity arises from productivity in the use of endowments 20131205—Porter Prize Japan Competitiveness Presentation—FINAL 19 Copyright 2013 © Professor Michael E. Porter
  • 20.
    Improving the Qualityof the Business Environment Context for Firm Strategy and Rivalry • Local rules and incentives that encourage investment and productivity Factor (Input) Conditions – e.g. incentives for capital investments, IP protection • Sound corporate governance Demand Conditions • Open and vigorous local competition • Improving access to high quality business inputs – – – – Qualified human resources Capital availability Physical infrastructure Scientific and technological infrastructure – Efficient regulatory system − Openness to foreign competition − Strict competition laws • Sophisticated and demanding local needs Related and Supporting Industries – e.g., Strict quality, safety, and environmental standards • Availability and quality of suppliers and supporting industries • Many things matter for competitiveness • Successful economic development is a process of successive upgrading, in which the business environment improves to enable increasingly sophisticated ways of competing 20131205—Porter Prize Japan Competitiveness Presentation—FINAL 20 Copyright 2013 © Professor Michael E. Porter
  • 21.
    Developing Clusters: Tourismin Cairns, Australia Public Relations & Market Research Services Travel Agents Tour Operators Food Suppliers Attractions and Activities Hotels Government Agencies e.g., Australian Tourism Commission, Great Barrier Reef Authority Local Transportation e.g., theme parks, casinos, sports Souvenirs, Duty Free Property Services Maintenance Services Local Retail, Health Care, and Other Services Airlines, Cruise Ships Restaurants Banks, Foreign Exchange Educational Institutions Industry Groups e.g., James Cook University, Cairns College of TAFE e.g., Queensland Tourism Industry Council Sources: HBS student team research (2003) - Peter Tynan, Chai McConnell, Alexandra West, Jean Hayden 20131205—Porter Prize Japan Competitiveness Presentation—FINAL 21 Copyright 2013 © Professor Michael E. Porter
  • 22.
    Prosperity of JapanesePrefectures $45,000 Japan Real Growth Rate of GDP per Capita: 2.75% Tokyo ($ 62,195, 2.14 %) Gross Domestic Product per Capita, 2010 (Current $US at PPP) $40,000 Shiga Aichi Shizuoka Osaka $35,000 Japan GDP per Capita: $34,758 Ishikawa Hokkaido Gumma Okayama Niigata Kagawa Nagano Gifu Yamaguchi Yamanashi Fukuoka Tokushima Wakayama Kyoto Ehime Akita Hyogo Shimane Iwate Chiba Mie Ibaraki Oita Fukushima Kanagawa Tottori Tochigi Hiroshima Miyagi $30,000 Fukui Toyama Saga Yamagata Kumamoto Kagoshima Miyazaki Nagasaki Aomori Kochi $25,000 Saitama Okinawa Nara $20,000 1.5% 2.0% 2.5% 3.0% 3.5% 4.0% Real Growth Rate of GDP per capita, 2000-2010 Source: OECD iLibrary (2013) 20131205—Porter Prize Japan Competitiveness Presentation—FINAL 22 Copyright 2013 © Professor Michael E. Porter
  • 23.
    The Role ofRegions in Economic Development • Many essential levers of competitiveness reside at the regional level • Regions specialize in different sets of clusters • Regions are a critical unit in competitiveness • Each region needs its own distinctive strategy and action agenda – Business environment improvement – Cluster upgrading – Improving institutional effectiveness 20131205—Porter Prize Japan Competitiveness Presentation—FINAL 23 Copyright 2013 © Professor Michael E. Porter
  • 24.
    Geographic Influences onCompetitiveness Neighboring Countries Nation Regions and Cities • Economic coordination and integration with neighboring countries is a major force of productivity and competitiveness 20131205—Porter Prize Japan Competitiveness Presentation—FINAL 24 Copyright 2013 © Professor Michael E. Porter
  • 25.
    Japan’s Competitiveness Profile,2001 ISC Competitiveness Model Country Competitiveness 23 Macroeconomic Competitiveness Microeconomic Competitiveness 28 17 Political Institutions 32 Macroeconomic Policy National Business Environment Company Operations and Strategy 66 22 9 Rule of Law 22 Japan’s GDP per capita rank is 18th versus 71 countries Human Development 15 Significant disadvantage Moderate disadvantage Neutral Moderate advantage Significant advantage Note: Rank versus 71 countries; *Color coding based on comparison relative to income; Source: Institute for Strategy and Competitiveness, Harvard University (2012), based in part on survey data from the World Economic Forum; analysis prepared based on research findings by Scott Stern, Mercedes Delgado, and Christian Ketels. 20131205—Porter Prize Japan Competitiveness Presentation—FINAL 25 Copyright 2013 © Professor Michael E. Porter
  • 26.
    Can Japan Compete? TheCorporate Agenda in 2001 1. Shift the goal from growth to profitability 2. Create distinctive, long term strategies 3. Expand the focus of operational effectiveness to IT 4. Understand the role of industry structure 5. Reduce unrelated diversification 6. Update the Japanese organizational and governance model 7. Develop a stronger role for the private sector in economic development 20131205—Porter Prize Japan Competitiveness Presentation—FINAL 26 Copyright 2013 © Professor Michael E. Porter
  • 27.
    Can Japan Compete? GovernmentAgenda in 2001 1. Open up domestic competition and reduce government intervention 2. Open trade and foreign investment 3. Modernize archaic and inefficient domestic sectors 4. Build a world class university system 5. Create new models of innovation and entrepreneurship 6. Encourage decentralization, regional specialization, and cluster development 7. Create stronger corporate accountability 20131205—Porter Prize Japan Competitiveness Presentation—FINAL 27 Copyright 2013 © Professor Michael E. Porter
  • 28.
    Japan’s Competitiveness Profile,2012 ISC Competitiveness Model Country Competitiveness 18 Macroeconomic Competitiveness Microeconomic Competitiveness 24 14 Political Institutions 22 Macroeconomic Policy National Business Environment Company Operations and Strategy 68 16 4 Rule of Law 17 Japan’s GDP per capita rank is 18th versus 71 countries Human Development 14 Significant disadvantage Moderate disadvantage Neutral Moderate advantage Significant advantage Note: Rank versus 71 countries; *Color coding based on comparison relative to income; Source: Institute for Strategy and Competitiveness, Harvard University (2012), based in part on survey data from the World Economic Forum; analysis prepared based on research findings by Scott Stern, Mercedes Delgado, and Christian Ketels. 20131205—Porter Prize Japan Competitiveness Presentation—FINAL 28 Copyright 2013 © Professor Michael E. Porter
  • 29.
    Company Progress since2001 1. Shift the goal from growth to profitability – More businesses are being divested due to inadequate profitability, but Japanese ROIC remains low 2. Create distinctive, long term strategies – The Porter Prize has recognized 41 companies with distinctive strategies since 2001 – Many companies have become more focused 3. Expand the focus of operational effectiveness to IT – The utilization of IT has increased substantially, improving productivity 4. Understand the role of industry structure – Industry attractiveness has become a larger factor in corporate choices 5. Reduce unrelated diversification – Many corporate portfolios have been pruned 6. Update the Japanese organizational and governance model – The number of executive board members has been reduced – The number of companies with outside board members have substantially increased – Cross shareholding has fallen 7. Develop a stronger role for the private sector in economic development – Business leaders are becoming more involved in national and regional economic development – Shared value has become a major new thrust in Japanese corporations 20131205—Porter Prize Japan Competitiveness Presentation—FINAL 29 Copyright 2013 © Professor Michael E. Porter
  • 30.
    Government Progress Since2001 1. Open up domestic competition and reduce government intervention – – – 2. Stricter anti-trust laws and enforcement has brought Japan closer to world standards Government still prone to intervention and government solutions (e.g. electronics) Targeting persists in “growth industries” Open trade and foreign investment – – 3. FTAs signed with many nations, with the TPP being discussed FDI restrictions have been partially reduced, but barriers remain Modernize archaic and inefficient domestic sectors – – – 4. Rules governing construction improved Protection for small scale retailing reduced Agriculture largely unchanged Build a world class university system – – 5. Some steps have been taken to raise university standards and accountability Archaic rules still disadvantage students studying outside Japan Create new models of innovation and entrepreneurship – – – 6. Rules for starting businesses have improved, though still not world class IP protection strengthened Access to public listing by newer companies has improved Encourage decentralization, regional specialization, and cluster development – – 7. Cluster initiatives have proliferated, but progress remains uneven Only modest delegation of central government powers has occurred Create stronger corporate accountability – – At least one independent board member is recommended for TSE-listed companies Few companies still have effective corporate governance 20131205—Porter Prize Japan Competitiveness Presentation—FINAL 30 Copyright 2013 © Professor Michael E. Porter
  • 31.
    Trajectory of theJapanese Business Environment Rank in 2012 Change in Rank 16 +7 Supporting and Related Industries and Clusters 4 0 Logistical Infrastructure 12 -4 Demand Conditions 16 +3 Capital Market Infrastructure 20 +7 Communications Infrastructure 21 0 Factor Conditions 21 +1 Context for Strategy and Rivalry 22 +7 Innovation Infrastructure 23 -2 Regulatory Infrastructure 38 -2 Overall Business Environment Rank versus a consistent sample of 71 countries Note: Rank versus 71 countries Source: Institute for Strategy and Competitiveness, Harvard University (2012), based in part on survey data from the World Economic Forum; analysis prepared based on research findings by Scott Stern, Mercedes Delgado, and Christian Ketels. 20131205—Porter Prize Japan Competitiveness Presentation—FINAL 31 Copyright 2013 © Professor Michael E. Porter
  • 32.
    Microeconomic Competitiveness Indicators Easeof Doing Business Rankings – Japan Ranking, 2013 (vs. 185 countries) Favorable Unfavorable 140 120 100 80 60 40 Japan’s GDP per capita rank: 21 20 0 Ease of Doing Business Rank Resolving Insolvency Protecting Investors Trading Across Borders Getting Credit Getting Electricity Enforcing Contracts Registering Property Dealing with Construction Permits Starting a business Paying Taxes Source: World Bank Report, Doing Business (2013) 20131205—Porter Prize Japan Competitiveness Presentation—FINAL 32 Copyright 2013 © Professor Michael E. Porter
  • 33.
    Can Japan Compete? 1.Japan’s Economic Performance 2. Competitiveness and Economic Growth: The New Learning 3. The Strategic Agenda for Japan in 2014 20131205—Porter Prize Japan Competitiveness Presentation—FINAL 33 Copyright 2013 © Professor Michael E. Porter
  • 34.
    Japan’s Strategy underPrime Minister Abe The “Three Arrows” of Abenomics Monetary Expansion 20131205—Porter Prize Japan Competitiveness Presentation—FINAL Temporary Fiscal Expansion, then Consolidation 34 Structural Reforms Copyright 2013 © Professor Michael E. Porter
  • 35.
    Japan’s Strategy underPrime Minister Abe The “Third Arrow”: Structural Reforms 20131205—Porter Prize Japan Competitiveness Presentation—FINAL 35 Copyright 2013 © Professor Michael E. Porter
  • 36.
    The “Three Arrows”of Abenomics: Progress to Date Monetary Expansion Temporary Fiscal Expansion, then Consolidation • Fully implemented • Expansion implemented • Promising Results • Consolidation beginning • Success unclear 20131205—Porter Prize Japan Competitiveness Presentation—FINAL 36 Structural Reforms • An extensive list of suggested actions, few steps taken so far Copyright 2013 © Professor Michael E. Porter
  • 37.
    The Japanese CorporateAgenda for 2014 1. Accelerate the shift to strategic thinking 2. Accelerate globalization, making greater use of M&A 3. Encourage fast track leadership development and mid career recruiting to complement internal promotion – Mobility of talent will dramatically improve Japanese company performance 4. Simplify and streamline decision making while continuing to improve accountability and governance 5. Evolve executive compensation practices to incentivize risk taking 6. Embrace shared value as the guiding principle for Japanese business 20131205—Porter Prize Japan Competitiveness Presentation—FINAL 37 Copyright 2013 © Professor Michael E. Porter
  • 38.
    The National Agendain 2014 1. Continue opening domestic and international competition – Eliminate remaining barriers to FDI and imports – Reduce government subsidies and intervention in companies 2. Lower the unnecessary high costs of doing business in Japan – Regulation and bureaucracy is Japan’s greatest weakness 3. Deregulate the key Japanese sectors to unlock growth, productivity and innovation – Agriculture – Health Care 4. Continue decentralizing resources and responsibility to Japanese prefectures and metropolitan regions – Let regions compete to develop clusters, attract investment and upgrade their business environment 5. Restructure Japan's fiscal structure – Lower the corporate tax rate while eliminating tax breaks – Reduce capital gains taxation – Moderate taxes on earned income – Increase consumption based and non-renewable energy use taxes 20131205—Porter Prize Japan Competitiveness Presentation—FINAL 38 Copyright 2013 © Professor Michael E. Porter
  • 39.
    The National Agendain 2014 6. Set a pragmatic long term energy strategy – The cost of energy is a major competitiveness issue – Transitional solutions and carbon taxes will be needed to bridge the present and the future – Energy efficiency must become a national priority 7. Connect Japan to the rest of the world – Raise language skills – Support international education – Welcome skilled immigration – Embrace the internationalization of knowledge – Encourage deeper globalization by Japanese companies – Move from politics to building economic partnership with other Asian countries 8. Tap the talent and potential of Japanese citizens and enrich the nation’s human resources – Embrace and enable womens’ participation in the workforce – Open up labor mobility – Welcome skilled expatriates from abroad – Encourage and support Japanese students studying abroad – Raise the standards in Japanese universities and business schools 9. Deepen economic integration of Japan in the Asian region 20131205—Porter Prize Japan Competitiveness Presentation—FINAL 39 Copyright 2013 © Professor Michael E. Porter