Download to read offline
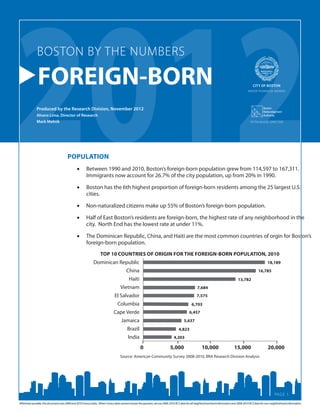

Between 1990 and 2010, Boston's foreign-born population grew from 114,597 to 167,311, now accounting for 26.7% of the city's population. Half of East Boston's residents are foreign-born, the highest rate of any neighborhood, while the North End has the lowest at under 11%. The top countries of origin for Boston's foreign-born residents are the Dominican Republic, China, and Haiti. Immigrants contribute economically through their spending, small businesses, and employment across various industries like healthcare and food services.


