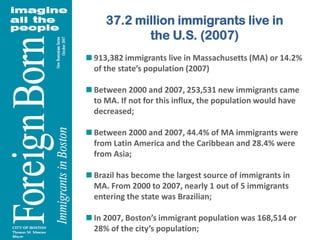
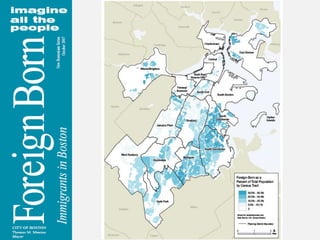
37.2 million immigrants live in the U.S. (2007)913,382 immigrants live in Massachusetts (MA) or 14.2% of the state’s population (2007)Between 2000 and 2007, 253,531 new immigrants came to MA. If not for this influx, the population would have decreased;Between 2000 and 2007, 44.4% of MA immigrants were from Latin America and the Caribbean and 28.4% were from Asia;Brazil has become the largest source of immigrants in MA. From 2000 to 2007, nearly 1 out of 5 immigrants entering the state was Brazilian;In 2007, Boston’s immigrant population was 168,514 or 28% of the city’s population;
Share of Foreign-Born in Boston, Mass., and U.S. (1850-2007)
Boston stands out as a point of entry for immigrants...Largest Cities in the United States-2006Source: 2006 American Community Survey, BRA Research Division Analysis
Race and Ethnicity in Boston (1980 to 2000)198019902006**2000 was the first year the Census compiled data on individuals who identified themselves as “multiracial”. Source:  Liming L., Perkins, G., Goetze, R., Vrabel, J., Lewis G., & Consalvo, R., (2001) Boston’s Population – 2000, Changes in Population, Race, Ethnicity in Boston and Boston’s Neighborhoods – 1980 to 2000.  Boston:   Boston Redevelopment Authority, 2006 American Community Survey, Boston Redevelopment Authority Research Division Analysis.
Top regions of Boston’s Foreign BornBoston’s foreign born population comes predominantly from the Americas (49%), Asia (24%), Europe (15%), and Africa (10%) and represents more than 100 different countries;Caribbeans make up almost 53% of all immigrants from the Americas.Note:  *Central America includes Mexico.  ** Other includes Northern America and OceaniaSource:   American Fact Finder, American Community Survey, 2005-2007, Brookings Institution Living Cities, BRA Research Division Analysis.
Boston’s Foreign Born Regions of Origin (1860 – 2006)1860 – 19001910 – 19601970 – 2006Source:  http://www.census.gov/population/www/documentation/twps0029/twps0029.html#data, 2000 American Community Survey, BRA Research Division Analysis
Year 2000Share of the Foreign-Born Population in Boston (2006)
Boston’s Caribbean, Central, and South American Leading Countries of Origin (2007)Source: American Fact Finder, American Community Survey, 2005-2007, BRA Research Division Analysis
Boston’s African, European, and Asian Leading Countries of Origin (2007)Source: American Fact Finder, American Community Survey, 2005-2007, BRA Research Division Analysis
Boston’s Most Common AncestriesIrish and Italian are the first and second leading ancestries. Their recorded numbers decreased between 1990 and 2007 by 33.4% and 30.7% respectively;Puerto Ricans are the third leading ancestry. Their reported numbers increased by 12.7%, between 1990 and 2007;People claiming Salvadoran ancestry grew over 3 ½ times between 1990 and 2007. Boston’s Ancestry, 1990 and 2007Note:  *American refers to people who identified their ancestry as "American", "United States", as a region such as "Southerner", or as a U.S. state such as "Texan“ (U.S. Census).Sources: U.S. Bureau of the Census, BRA Research Division Analysis.American Community Survey, 2005-2007, Public Use Microdata Sample, BRA Research Analysis .
6 leading languages spoken in Boston  65% of Boston residents speak only English and 35% speak a language other than English.Source: American Community Survey, 2005-2007, Public Use Microdata Sample, BRA Research Analysis.
All of Boston’s Neighborhoods Experienced Changes in the Foreign Born Population (1990 – 2000)All of Boston’s neighborhoods have experienced an increase in diversity.The neighborhoods that have experienced the most dramatic change are: XxxxXxxxxXxxxxXxxxxxxxxxxxSource:  Liming L., Perkins, G., Goetze, R., Vrabel, J., Lewis G., & Consalvo, R., (2001) Boston’s Population – 2000, Changes in Population, Race, Ethnicity in Boston and Boston’s Neighborhoods – 1980 to 2000.  Boston:   Boston Redevelopment Authority.
Per Person Impact on the Economy $23,321 in income spent in Massachusetts; $1,292 in total state income taxes paid; $4,614 in total federal income taxes paid; $365 in total state sales taxes paid;Every 5 immigrants supports one job in the state;Contribute $20,892 to Gross Regional Product (GRP).
IMMIGRATION SEEN THROUGH TRADITIONAL LENSINTEGRATION:Labor marketlanguage acquisitionHousingEducationetc…
IMMIGRATION SEEN THROUGHTRANSNATIONAL LENSRE-INTEGRATION:Labor marketlanguage acquisitionHousingEducationetc…INTEGRATION:Labor marketlanguage acquisitionHousingEducationetc…

Foreign Born in Boston

  • 2.
    37.2 million immigrantslive in the U.S. (2007)913,382 immigrants live in Massachusetts (MA) or 14.2% of the state’s population (2007)Between 2000 and 2007, 253,531 new immigrants came to MA. If not for this influx, the population would have decreased;Between 2000 and 2007, 44.4% of MA immigrants were from Latin America and the Caribbean and 28.4% were from Asia;Brazil has become the largest source of immigrants in MA. From 2000 to 2007, nearly 1 out of 5 immigrants entering the state was Brazilian;In 2007, Boston’s immigrant population was 168,514 or 28% of the city’s population;
  • 3.
    Share of Foreign-Bornin Boston, Mass., and U.S. (1850-2007)
  • 4.
    Boston stands outas a point of entry for immigrants...Largest Cities in the United States-2006Source: 2006 American Community Survey, BRA Research Division Analysis
  • 5.
    Race and Ethnicityin Boston (1980 to 2000)198019902006**2000 was the first year the Census compiled data on individuals who identified themselves as “multiracial”. Source: Liming L., Perkins, G., Goetze, R., Vrabel, J., Lewis G., & Consalvo, R., (2001) Boston’s Population – 2000, Changes in Population, Race, Ethnicity in Boston and Boston’s Neighborhoods – 1980 to 2000. Boston: Boston Redevelopment Authority, 2006 American Community Survey, Boston Redevelopment Authority Research Division Analysis.
  • 6.
    Top regions ofBoston’s Foreign BornBoston’s foreign born population comes predominantly from the Americas (49%), Asia (24%), Europe (15%), and Africa (10%) and represents more than 100 different countries;Caribbeans make up almost 53% of all immigrants from the Americas.Note: *Central America includes Mexico. ** Other includes Northern America and OceaniaSource: American Fact Finder, American Community Survey, 2005-2007, Brookings Institution Living Cities, BRA Research Division Analysis.
  • 7.
    Boston’s Foreign BornRegions of Origin (1860 – 2006)1860 – 19001910 – 19601970 – 2006Source: http://www.census.gov/population/www/documentation/twps0029/twps0029.html#data, 2000 American Community Survey, BRA Research Division Analysis
  • 8.
    Year 2000Share ofthe Foreign-Born Population in Boston (2006)
  • 9.
    Boston’s Caribbean, Central,and South American Leading Countries of Origin (2007)Source: American Fact Finder, American Community Survey, 2005-2007, BRA Research Division Analysis
  • 10.
    Boston’s African, European,and Asian Leading Countries of Origin (2007)Source: American Fact Finder, American Community Survey, 2005-2007, BRA Research Division Analysis
  • 11.
    Boston’s Most CommonAncestriesIrish and Italian are the first and second leading ancestries. Their recorded numbers decreased between 1990 and 2007 by 33.4% and 30.7% respectively;Puerto Ricans are the third leading ancestry. Their reported numbers increased by 12.7%, between 1990 and 2007;People claiming Salvadoran ancestry grew over 3 ½ times between 1990 and 2007. Boston’s Ancestry, 1990 and 2007Note: *American refers to people who identified their ancestry as "American", "United States", as a region such as "Southerner", or as a U.S. state such as "Texan“ (U.S. Census).Sources: U.S. Bureau of the Census, BRA Research Division Analysis.American Community Survey, 2005-2007, Public Use Microdata Sample, BRA Research Analysis .
  • 12.
    6 leading languagesspoken in Boston 65% of Boston residents speak only English and 35% speak a language other than English.Source: American Community Survey, 2005-2007, Public Use Microdata Sample, BRA Research Analysis.
  • 19.
    All of Boston’sNeighborhoods Experienced Changes in the Foreign Born Population (1990 – 2000)All of Boston’s neighborhoods have experienced an increase in diversity.The neighborhoods that have experienced the most dramatic change are: XxxxXxxxxXxxxxXxxxxxxxxxxxSource: Liming L., Perkins, G., Goetze, R., Vrabel, J., Lewis G., & Consalvo, R., (2001) Boston’s Population – 2000, Changes in Population, Race, Ethnicity in Boston and Boston’s Neighborhoods – 1980 to 2000. Boston: Boston Redevelopment Authority.
  • 23.
    Per Person Impacton the Economy $23,321 in income spent in Massachusetts; $1,292 in total state income taxes paid; $4,614 in total federal income taxes paid; $365 in total state sales taxes paid;Every 5 immigrants supports one job in the state;Contribute $20,892 to Gross Regional Product (GRP).
  • 24.
    IMMIGRATION SEEN THROUGHTRADITIONAL LENSINTEGRATION:Labor marketlanguage acquisitionHousingEducationetc…
  • 25.
    IMMIGRATION SEEN THROUGHTRANSNATIONALLENSRE-INTEGRATION:Labor marketlanguage acquisitionHousingEducationetc…INTEGRATION:Labor marketlanguage acquisitionHousingEducationetc…