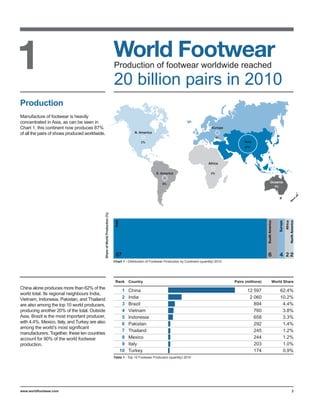
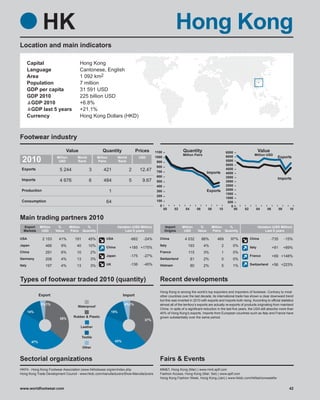
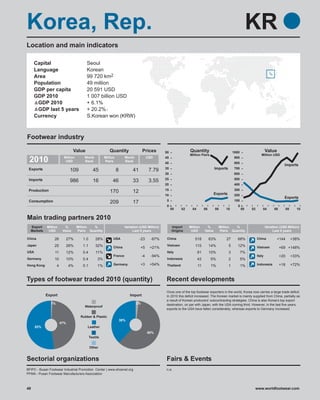
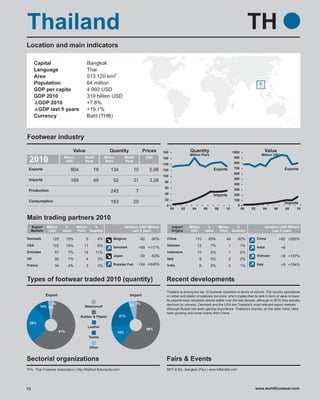
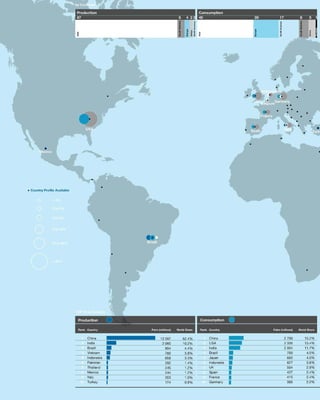
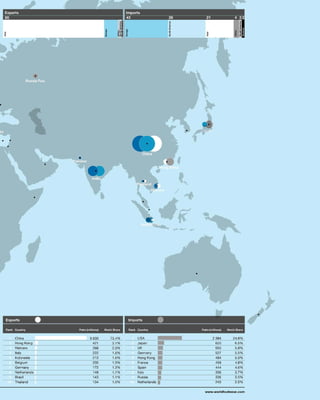
Production and trade of footwear is heavily concentrated in Asia. In 2010:
- Asia produced 87% of the world's footwear, led by China at 62%.
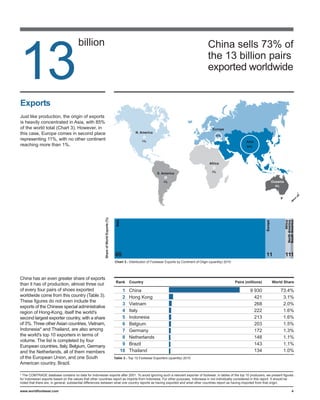
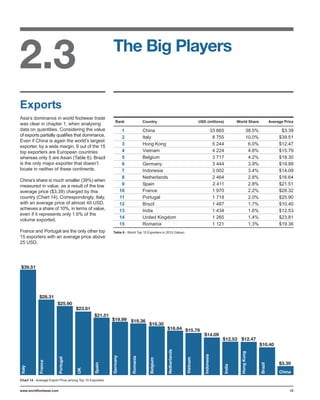
- Asia exported 85% of the world's footwear, with China responsible for 73%.
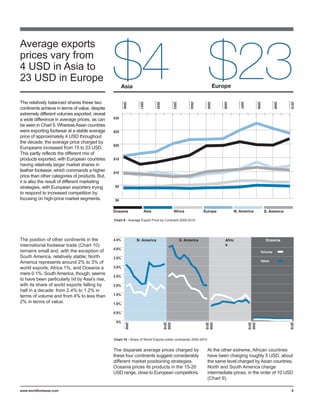
- The average export price from Asia was around $4, compared to $23 from Europe.