Downloaded 15 times
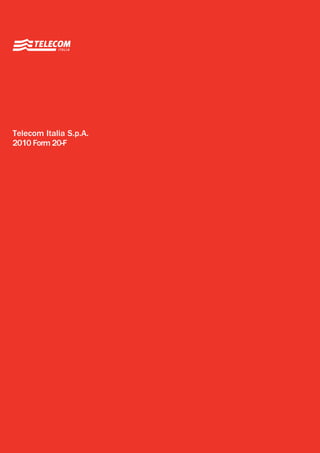

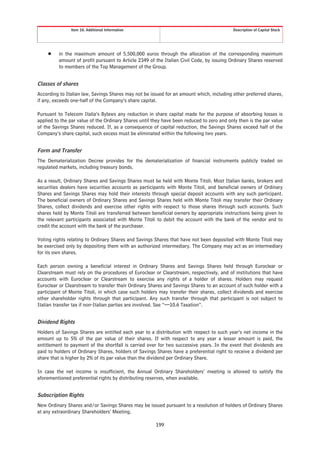
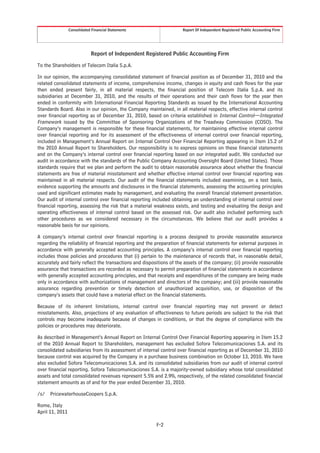
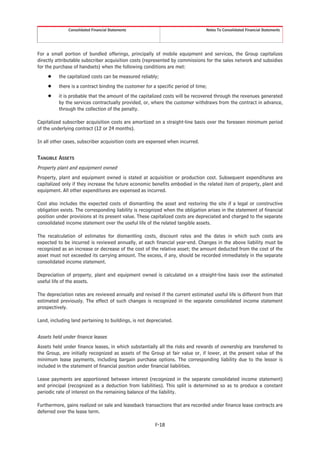
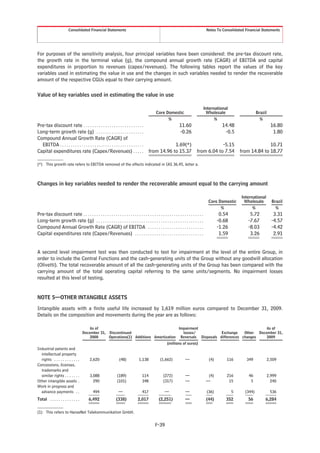
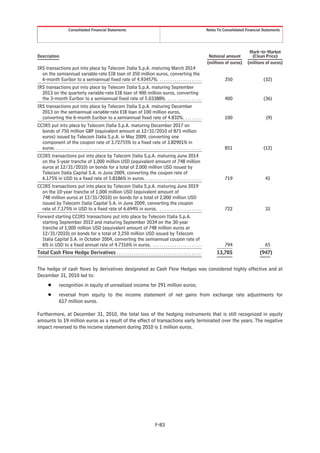
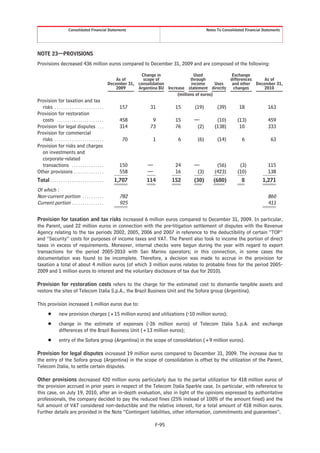
![Item 10. ADDITIONAL INFORMATION . . . . . . . . . . . . . . . . . . . . . . . . . . . . . . . . . . . . . . . . . . . . . . . . . . . . . . . . . . . . . . . . . . . 182
10.1 CORPORATE GOVERNANCE . . . . . . . . . . . . . . . . . . . . . . . . . . . . . . . . . . . . . . . . . . . . . . . . . . . . . . . . . . . . . . . . . . . . . . . 182
10.2 EXCHANGE CONTROLS AND OTHER LIMITATIONS AFFECTING SECURITY HOLDERS . . . . . . . . . . . . . . . 196
10.3 DESCRIPTION OF BYLAWS . . . . . . . . . . . . . . . . . . . . . . . . . . . . . . . . . . . . . . . . . . . . . . . . . . . . . . . . . . . . . . . . . . . . . . . . 197
10.4 DESCRIPTION OF CAPITAL STOCK . . . . . . . . . . . . . . . . . . . . . . . . . . . . . . . . . . . . . . . . . . . . . . . . . . . . . . . . . . . . . . . . 198
10.5 DESCRIPTION OF AMERICAN DEPOSITARY RECEIPTS . . . . . . . . . . . . . . . . . . . . . . . . . . . . . . . . . . . . . . . . . . . . . 203
10.6 TAXATION . . . . . . . . . . . . . . . . . . . . . . . . . . . . . . . . . . . . . . . . . . . . . . . . . . . . . . . . . . . . . . . . . . . . . . . . . . . . . . . . . . . . . . . . 211
10.7 DOCUMENTS ON DISPLAY . . . . . . . . . . . . . . . . . . . . . . . . . . . . . . . . . . . . . . . . . . . . . . . . . . . . . . . . . . . . . . . . . . . . . . . . 216
Item 11. QUANTITATIVE AND QUALITATIVE DISCLOSURES ABOUT MARKET RISKS . . . . . . . . . . . . . . . . . 217
Item 12. DESCRIPTION OF SECURITIES OTHER THAN EQUITY SECURITIES . . . . . . . . . . . . . . . . . . . . . . . . . . 218
Item 12A. DEBT SECURITIES . . . . . . . . . . . . . . . . . . . . . . . . . . . . . . . . . . . . . . . . . . . . . . . . . . . . . . . . . . . . . . . . . . . . . . . . . . . 218
Item 12B. WARRANTS AND RIGHTS . . . . . . . . . . . . . . . . . . . . . . . . . . . . . . . . . . . . . . . . . . . . . . . . . . . . . . . . . . . . . . . . . . . . 218
Item 12C. OTHER SECURITIES . . . . . . . . . . . . . . . . . . . . . . . . . . . . . . . . . . . . . . . . . . . . . . . . . . . . . . . . . . . . . . . . . . . . . . . . . . 218
Item 12D. AMERICAN DEPOSITARY SHARES . . . . . . . . . . . . . . . . . . . . . . . . . . . . . . . . . . . . . . . . . . . . . . . . . . . . . . . . . . . 218
PART II . . . . . . . . . . . . . . . . . . . . . . . . . . . . . . . . . . . . . . . . . . . . . . . . . . . . . . . . . . . . . . . . . . . . . . . . . . . . . . . . . . . . . . . . . . . . . . . . . . . . 221
Item 13. DEFAULTS, DIVIDEND ARREARAGES AND DELINQUENCIES . . . . . . . . . . . . . . . . . . . . . . . . . . . . . . . . . 221
Item 14. MATERIAL MODIFICATION TO THE RIGHTS OF SECURITY HOLDERS AND USE OF
PROCEEDS . . . . . . . . . . . . . . . . . . . . . . . . . . . . . . . . . . . . . . . . . . . . . . . . . . . . . . . . . . . . . . . . . . . . . . . . . . . . . . . . . . . . . . . . . . . . . . 222
Item 15. CONTROLS AND PROCEDURES . . . . . . . . . . . . . . . . . . . . . . . . . . . . . . . . . . . . . . . . . . . . . . . . . . . . . . . . . . . . . . . 223
15.1 DISCLOSURE CONTROLS AND PROCEDURES . . . . . . . . . . . . . . . . . . . . . . . . . . . . . . . . . . . . . . . . . . . . . . . . . . . . . . 223
15.2 MANAGEMENT’S ANNUAL REPORT OF INTERNAL CONTROL OVER FINANCIAL REPORTING . . . . . . . . . 223
15.3 FOCUS ON “MATERIAL WEAKNESS” AS REPORTED IN CONNECTION WITH THE PREPARATION OF
FINANCIAL STATEMENTS FOR THE YEAR ENDED DECEMBER 31, 2009 . . . . . . . . . . . . . . . . . . . . . . . . . . . . . . . 224
Item 16. [RESERVED] . . . . . . . . . . . . . . . . . . . . . . . . . . . . . . . . . . . . . . . . . . . . . . . . . . . . . . . . . . . . . . . . . . . . . . . . . . . . . . . . . . 226
Item 16A. AUDIT COMMITTEE FINANCIAL EXPERT . . . . . . . . . . . . . . . . . . . . . . . . . . . . . . . . . . . . . . . . . . . . . . . . . . . . 226
Item 16B. CODE OF ETHICS AND CONDUCT . . . . . . . . . . . . . . . . . . . . . . . . . . . . . . . . . . . . . . . . . . . . . . . . . . . . . . . . . . . 226
Item 16C. PRINCIPAL ACCOUNTANT FEES AND SERVICES . . . . . . . . . . . . . . . . . . . . . . . . . . . . . . . . . . . . . . . . . . . . 227
Item 16D. EXEMPTIONS FROM THE LISTING STANDARDS FOR AUDIT COMMITTEES . . . . . . . . . . . . . . . . 229
Item 16E. REPURCHASES OF EQUITY SECURITIES . . . . . . . . . . . . . . . . . . . . . . . . . . . . . . . . . . . . . . . . . . . . . . . . . . . . . 229
Item 16F. CHANGE IN REGISTRANT’S CERTIFYING ACCOUNTANT . . . . . . . . . . . . . . . . . . . . . . . . . . . . . . . . . . . 229
Item 16G. CORPORATE GOVERNANCE . . . . . . . . . . . . . . . . . . . . . . . . . . . . . . . . . . . . . . . . . . . . . . . . . . . . . . . . . . . . . . . . . 230
PART III . . . . . . . . . . . . . . . . . . . . . . . . . . . . . . . . . . . . . . . . . . . . . . . . . . . . . . . . . . . . . . . . . . . . . . . . . . . . . . . . . . . . . . . . . . . . . . . . . . . . 232
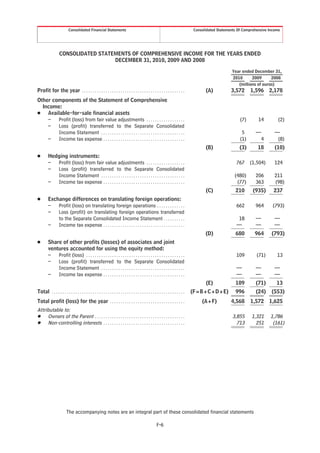
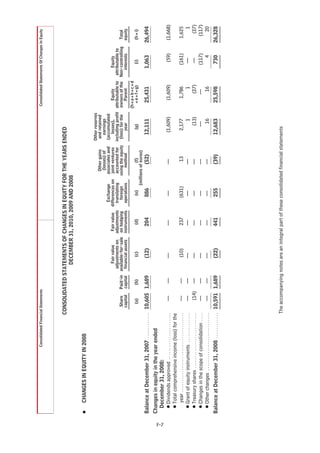
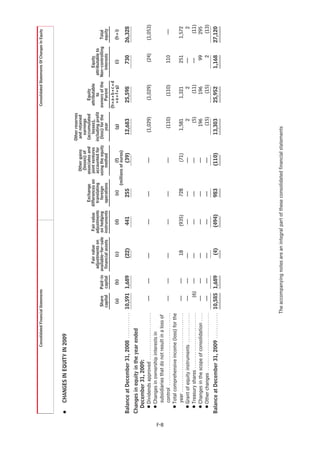
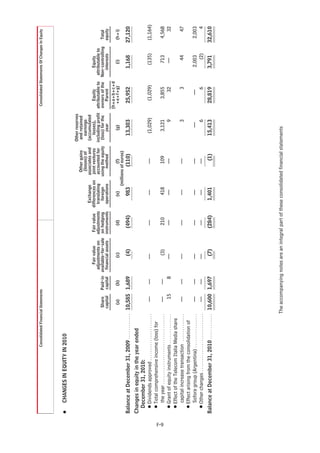
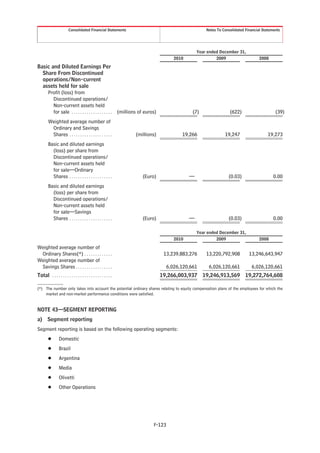
Item 17. FINANCIAL STATEMENTS . . . . . . . . . . . . . . . . . . . . . . . . . . . . . . . . . . . . . . . . . . . . . . . . . . . . . . . . . . . . . . . . . . . . . 232
Item 18. FINANCIAL STATEMENTS . . . . . . . . . . . . . . . . . . . . . . . . . . . . . . . . . . . . . . . . . . . . . . . . . . . . . . . . . . . . . . . . . . . . . 233
Item 19. FINANCIAL STATEMENTS AND EXHIBITS . . . . . . . . . . . . . . . . . . . . . . . . . . . . . . . . . . . . . . . . . . . . . . . . . . . . . 233
ii](https://image.slidesharecdn.com/form20f2010-110704104132-phpapp02/85/2010-Form-20-F-5-320.jpg)


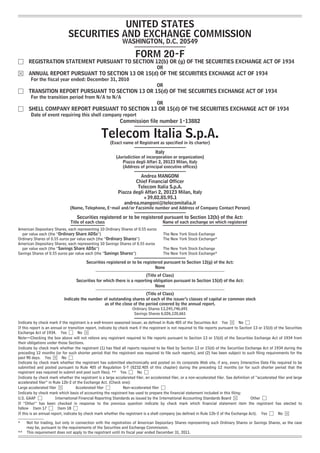
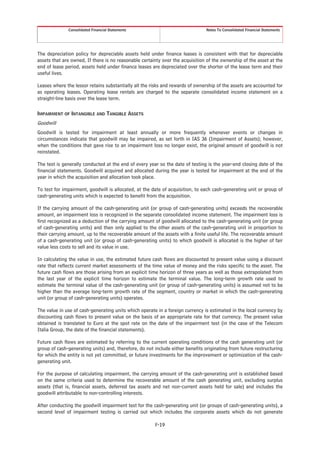
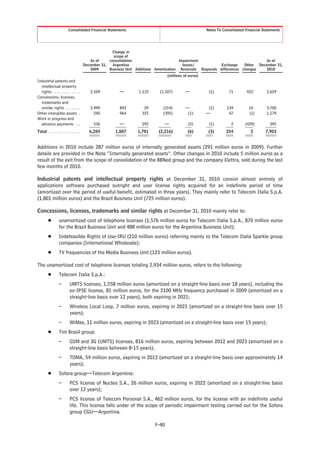
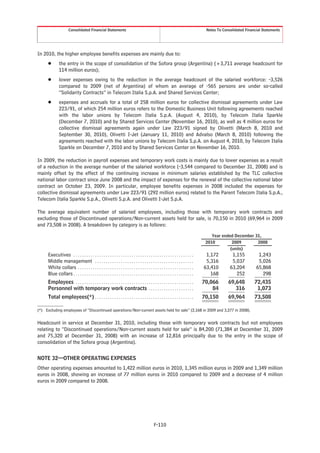
![Item 16A. Audit Committee Financial Expert
Item 16B. Code Of Ethics And Conduct
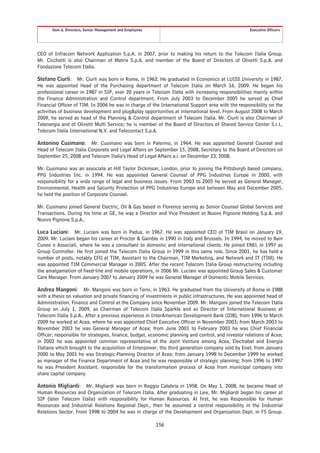
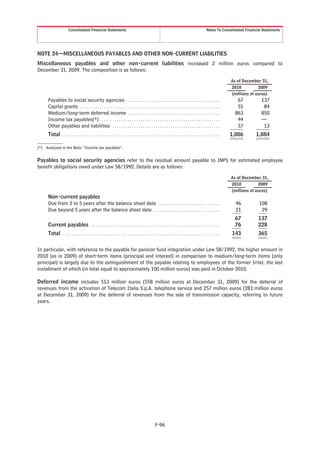
Item 16. [RESERVED]
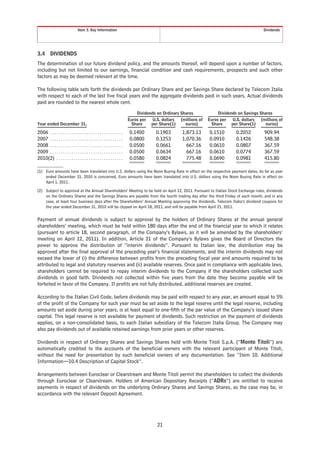
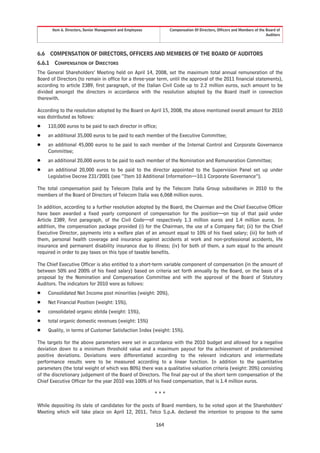
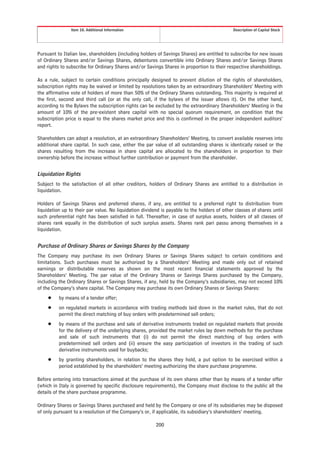
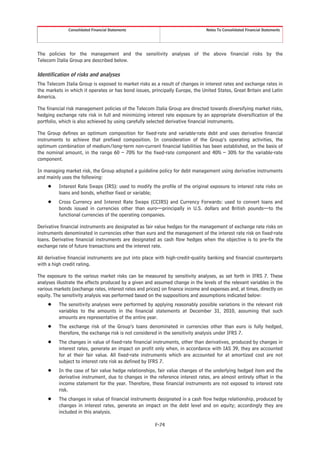
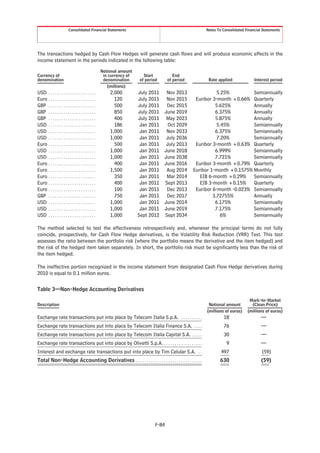
Item 16A. AUDIT COMMITTEE FINANCIAL EXPERT
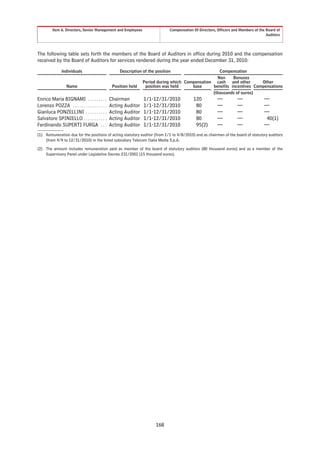
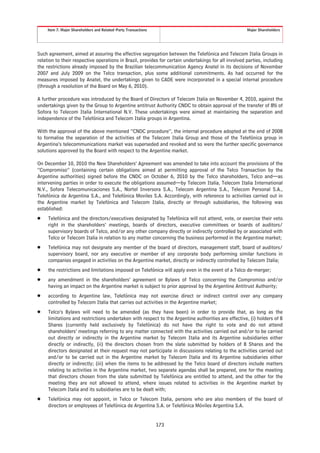
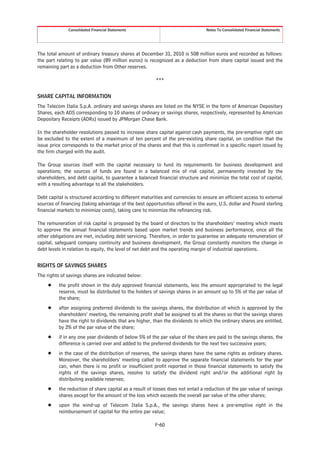
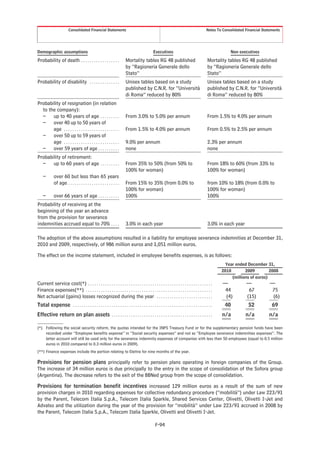
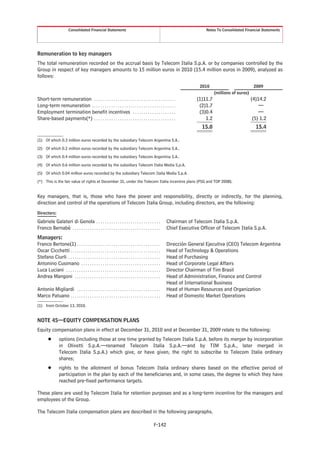
The Board of Auditors in office as of April 1, 2011 determined that each of its members is an “audit committee
financial expert” as defined in Item 16A of Form 20-F. For the names of the members of the Board of Auditors,
see “Item 6 Directors, Senior Management and Employees—6.3 Board of Auditors”.
Item 16B. CODE OF ETHICS AND CONDUCT
On March 23, 2004, Telecom Italia adopted its Code of Ethics and Conduct which applies—among the others—to
the Chairman, the Chief Executive Officer, the Chief Financial Officer, as well as to all the Group’s employees in
and outside Italy; the suppliers of the Company are required to accept and apply it, too. The Code of Ethics and
Conduct has subsequently been amended from time to time by the Board of Directors, which acted on the basis of
opinions by the Internal Controls and Corporate Governance Committee and the Board of Statutory Auditors, in
order to conform it to the developments in the applicable law and market regulations, taking into account national
and international best practices. The Code of Ethics and Conduct in force is available on Telecom Italia’s website
at www.telecomitalia.com. See also under “Item 16G. Corporate Governance—16.1.1 Differences in Telecom
Italia’s Corporate Governance and New York Stock Exchange Corporate Governance Practices” and “Item 10
Additional Information—10.1 Corporate Governance”.
226](https://image.slidesharecdn.com/form20f2010-110704104132-phpapp02/85/2010-Form-20-F-231-320.jpg)
![[THIS PAGE INTENTIONALLY LEFT BLANK]](https://image.slidesharecdn.com/form20f2010-110704104132-phpapp02/85/2010-Form-20-F-241-320.jpg)

![[THIS PAGE INTENTIONALLY LEFT BLANK]](https://image.slidesharecdn.com/form20f2010-110704104132-phpapp02/85/2010-Form-20-F-407-320.jpg)

![[THIS PAGE INTENTIONALLY LEFT BLANK]](https://image.slidesharecdn.com/form20f2010-110704104132-phpapp02/85/2010-Form-20-F-409-320.jpg)
![[THIS PAGE INTENTIONALLY LEFT BLANK]](https://image.slidesharecdn.com/form20f2010-110704104132-phpapp02/85/2010-Form-20-F-421-320.jpg)
![[THIS PAGE INTENTIONALLY LEFT BLANK]](https://image.slidesharecdn.com/form20f2010-110704104132-phpapp02/85/2010-Form-20-F-431-320.jpg)
![[THIS PAGE INTENTIONALLY LEFT BLANK]](https://image.slidesharecdn.com/form20f2010-110704104132-phpapp02/85/2010-Form-20-F-433-320.jpg)
![[THIS PAGE INTENTIONALLY LEFT BLANK]](https://image.slidesharecdn.com/form20f2010-110704104132-phpapp02/85/2010-Form-20-F-435-320.jpg)
![[THIS PAGE INTENTIONALLY LEFT BLANK]](https://image.slidesharecdn.com/form20f2010-110704104132-phpapp02/85/2010-Form-20-F-437-320.jpg)
![[THIS PAGE INTENTIONALLY LEFT BLANK]](https://image.slidesharecdn.com/form20f2010-110704104132-phpapp02/85/2010-Form-20-F-439-320.jpg)
![[THIS PAGE INTENTIONALLY LEFT BLANK]](https://image.slidesharecdn.com/form20f2010-110704104132-phpapp02/85/2010-Form-20-F-441-320.jpg)


The document is a Form 20-F registration statement filed by Telecom Italia S.p.A. with the U.S. Securities and Exchange Commission for the fiscal year ending December 31, 2010. It includes information on the company's registration details, securities, outstanding shares, and financial performance, as well as a comprehensive overview of its operations, management, and relevant financial disclosures. The document serves as an essential report for investors and regulators regarding Telecom Italia's compliance with U.S. securities laws.


