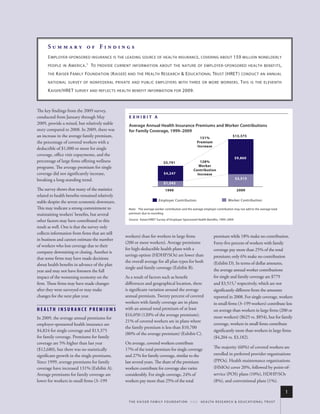
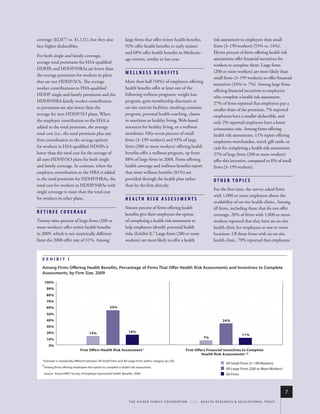
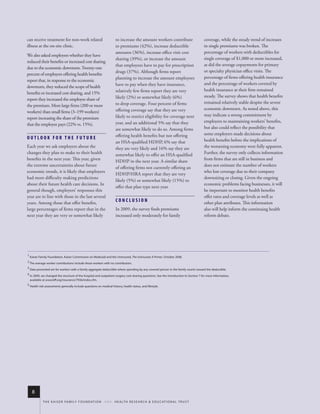
60%

                                                            $4,8 2 4
           T H E K A I S E R FA M I Ly F O u N D AT I O N
$ 13,375
                            - AND -
                   H E A LT H R E S E A R C H &
                   E D u C AT I O N A L T R u S T


           Employer
            Health
           Benefits
                        2009
                  Annual Survey


           2009         -a nd-
Primary Authors:


KAISER FAMILY FOUNDATION
Gary Claxton
Bianca DiJulio
Benjamin Finder
Janet Lundy

HEALTH RESEARCH & EDUCATIONAL TRUST
Megan McHugh
Awo Osei-Anto

NATIONAL OpINION RESEARCH CENTER
Heidi Whitmore
Jeremy pickreign
Jon Gabel


The Kaiser Family Foundation is a non-profit private operating foundation, based in Menlo Park,
California, dedicated to producing and communicating the best possible analysis and information
on health issues.

Founded in 1944, the Health Research & Educational Trust (HRET) is a private, not-for-profit
organization involved in research, education, and demonstration programs addressing health
management and policy issues. An affiliate of the American Hospital Association (AHA), HRET
collaborates with health care, government, academic, business, and community organizations across
the united States to conduct research and disseminate findings that shape the future of health care.
For more information about HRET, visit www.hret.org.

NORC, known since its founding in 1941 as the National Opinion Research Center, pursues objective
research that serves the public interest. NORC has offices on the university of Chicago campus and
in Chicago, Bethesda, MD, and Berkeley, CA, and a field staff that operates nationwide. NORC’s clients
include government agencies, educational institutions, foundations, other nonprofit organizations, and
private corporations. Its projects are interdisciplinary and are local, regional, national, and international
in scope.

Copyright © 2009 Henry J. Kaiser Family Foundation, Menlo Park, California, and Health Research &
Educational Trust, Chicago, Illinois. All rights reserved.

Printed in the united States of America.

ISBN: 978-0-87258-864-6

American Hospital Association/Health Research & Educational Trust Catalog Number 097520
t h e k a i s e r fa m i ly f o u n dat i o n
                  - AND -
         he alt h r e se arCh &
        eduC at i onal t rus t


   Employer
    Health
    Benefits
             2009
        Annual Survey


             -and-
T A b l e            o f            C o N T e N T s


lisT of exhibiTs                                                                                                                           v
summAry of fiNDiNgs                                                                                                                       1
survey DesigN AND meThoDs                                                                                                                 9
seCTioN 1

     Cost of Health Insurance                                                                                                           19
seCTioN 2

     Health Benefits Offer Rates                                                                                                        35
seCTioN 3

     Employee Coverage, Eligibility, and Participation                                                                                  47
seCTioN 4

     Types of Plans Offered                                                                                                             55
seCTioN 5

     Market Shares of Health Plans                                                                                                      61
seCTioN 6

     Worker and Employer Contributions for Premiums                                                                                     65
seCTioN 7

     Employee Cost Sharing                                                                                                              91
seCTioN 8

     High-Deductible Health Plans with Savings Option                                                                                123
seCTioN 9

     Prescription Drug Benefits                                                                                                      143
s e C T i o N 10

     Plan Funding                                                                                                                    155
s e C T i o N 11

     Retiree Health Benefits                                                                                                         163
s e C T i o N 12

     Wellness Programs and Health Risk Assessments                                                                                   169
s e C T i o N 13

     Employer and Health Plan Practices, and Employer Opinions                                                                       181

                                                                                                                                                       iii
                                t h e k a i s e r fa m i ly f o u n d at i o n - a n d - h e a lt h r e s e a r C h & e d u C at i o n a l t r u s t
l i s T            o f            e x h i b i T s


     survey DesigN AND meThoDs                                         exhibit 1.9                                                          30
                                                                              Distribution of Annual Premiums for Covered
exhibit m.1                                         15                        Workers with Single Coverage, 2009
     Selected Characteristics of Firms in the Survey
     Sample, 2009                                                      exhibit 1.10                                                         30
                                                                              Distribution of Annual Premiums for Covered
exhibit m.2                                         16                        Workers with Family Coverage, 2009
     Distribution of Employers, Workers,
     and Workers Covered by Health Benefits,                           exhibit 1.11                                                         31
     by Firm Size, 2009                                                       Average Annual Premiums for Single and Family
                                                                              Coverage, by Whether or Not Firm Offered the
exhibit m.3                                         17                        Same Plan Last Year and by Firm Size, 2009
     States by Region, 2009
                                                                       exhibit 1.12                                                         32
     Co s T o f h e A lT h i N s u r A N C e                                  Average Annual Premiums for Single and
                                                                              Family Coverage, 1999–2009
exhibit 1.1                                         22
     Average Monthly and Annual Premiums                               exhibit 1.13                                                         33
     for Covered Workers, Single and Family                                   Average Annual Premiums for Covered
     Coverage, by Plan Type, 2009                                             Workers with Family Coverage, by Firm Size,
                                                                              1999–2009
exhibit 1.2                                         23
     Average Monthly and Annual Premiums for                           exhibit 1.14                                                         33
     Covered Workers, by Plan Type and Firm Size,                             Average Annual Premiums for Covered
     2009                                                                     Workers with Family Coverage, by Firm Size,
                                                                              1999–2009
exhibit 1.3                                         24
     Average Monthly and Annual Premiums for                           exhibit 1.15                                                         34
     Covered Workers, by Plan Type and Region,                                Among Workers in Large Firms (200 or
     2009                                                                     More Workers), Average Health Insurance
                                                                              Premiums for Family Coverage, by Funding
exhibit 1.4                                         25                        Arrangement, 1999–2009
     Average Monthly and Annual Premiums for
     Covered Workers, by Plan Type and Industry,                              h e A lT h b e N e f i T s o f f e r r AT e s
     2009
                                                                       exhibit 2.1                                                          38
exhibit 1.5                                         27                        Percentage of Firms Offering Health Benefits,
     Average Annual Premiums for Covered                                      1999–2009
     Workers with Single Coverage, by Firm
     Characteristics, 2009                                             exhibit 2.2                                                          38
                                                                              Percentage of Firms Offering Health Benefits,
exhibit 1.6                                         28                        by Firm Size, 1999–2009
     Average Annual Premiums for Covered
     Workers with Family Coverage, by Firm                             exhibit 2.3                                                          39
     Characteristics, 2009                                                    Percentage of Firms Offering Health Benefits,
                                                                              by Firm Size, Region, and Industry, 2009
exhibit 1.7                                         29
     Distribution of Annual Premiums for Single                        exhibit 2.4                                                          40
     and Family Coverage Relative to the Average                              Percentage of Firms Offering Health Benefits,
     Annual Single or Family Premium, 2009                                    by Firm Characteristics, 2009

exhibit 1.8                                         29                 exhibit 2.5                                                          41
     Distribution of Premiums for Single and                                  Among Firms Offering Health Benefits,
     Family Coverage Relative to the Average                                  Percentage That Offer Health Benefits to
     Annual Single or Family Premium, 2009                                    Part-Time Workers, by Firm Size, 1999–2009


                                                                                                                                                                    v
                                             t h e k a i s e r fa m i ly f o u n d at i o n - a n d - h e a lt h r e s e a r C h & e d u C at i o n a l t r u s t
exhibit 2.6                                                          41                 exhibit 3.2                                            51
                   Among Firms Offering Health Benefits,                                                   Eligibility, Take-Up Rate, and Coverage in
                   Percentage That Offer Health Benefits to                                                Firms Offering Health Benefits, by Firm Size,
                   Temporary Workers, by Firm Size, 1999–2009                                              Region, and Industry, 2009

            exhibit 2.7                                                          42                 exhibit 3.3                                            52
                   Among Firms Offering Health Benefits,                                                   Among Workers in Firms Offering Health
                   Distribution of Whether Employers Offer                                                 Benefits, Percentage of Workers Eligible
                   Health Benefits to Unmarried Opposite-Sex                                               for Health Benefits Offered by Their Firm,
                   Domestic Partners, by Firm Size, Region,                                                by Firm Characteristics, 2009
                   and Industry, 2009
                                                                                                    exhibit 3.4                                            52
            exhibit 2.8                                                          43                        Among Workers in Firms Offering Health
                   Among Firms Offering Health Benefits,                                                   Benefits, Percentage of Eligible Workers Who
                   Distribution of Whether Employers Offer                                                 Take Up Health Benefits Offered by Their
                   Health Benefits to Unmarried Same-Sex                                                   Firm, by Firm Characteristics, 2009
                   Domestic Partners, by Firm Size, Region,
                   and Industry, 2009                                                               exhibit 3.5                                            53
                                                                                                           Among Workers in Firms Offering Health
            exhibit 2.9                                                          44                        Benefits, Percentage of Workers Covered
                   Among Small Firms (3–199 Workers)                                                       by Health Benefits Offered by Their Firm,
                   Not Offering Health Benefits, Reasons                                                   by Firm Characteristics, 2009
                   for Not Offering, 2009
                                                                                                    exhibit 3.6                                            53
            exhibit 2.10                                                         44                        Eligibility, Take-Up Rate, and Coverage
                   Among Small Firms (3–199 Workers) Not                                                   for Workers in Firms Offering Health Benefits,
                   Offering Health Benefits, Percentage That                                               by Firm Size, 1999–2009
                   Report The Following Activities Regarding
                   Health Benefits, by Firm Size, 2009                                              exhibit 3.7                                            54
                                                                                                           Percentage of Covered Workers in Firms with
            exhibit 2.11                                                         45                        a Waiting Period for Coverage and Average
                   Among Small Firms (3–199 Workers) Not                                                   Waiting Period in Months, by Firm Size,
                   Offering Health Benefits, Employer Beliefs                                              Region, and Industry, 2009
                   About Employees’ Preferences for Higher Wages
                   or Health Insurance Benefits, 2003–2009                                          exhibit 3.8                                            54
                                                                                                           Distribution of Covered Workers with the
            exhibit 2.12                                                         45                        Following Waiting Periods for Coverage, 2009
                   Among Small Firms (3–199 Workers) Not
                   Offering Benefits, Distribution of Firms by                                             Types of plANs offereD
                   the Amount They Believe They Could Afford
                   to Pay Monthly for Health Insurance                                              exhibit 4.1                                            57
                   Coverage for an Employee with Single                                                    Among Firms Offering Health Benefits,
                   Coverage, by Firm Size, 2009                                                            Percentage of Firms That Offer One, Two, or
                                                                                                           Three or More Plan Types, by Firm Size, 2009
            exhibit 2.13                                                         46
                   Among Small Firms (3–199 Workers) Not                                            exhibit 4.2                                            58
                   Offering Health Benefits, Distribution of                                               Among Firms Offering Health Benefits,
                   Firms by the Amount They Believe the Total                                              Percentage of Covered Workers in Firms
                   Monthly Cost of Health Insurance for One                                                Offering One, Two, or Three or More Plan
                   Employee with Single Coverage Would be if                                               Types, by Firm Size, 2009
                   They Offered the Benefit, by Firm Size, 2009
                                                                                                    exhibit 4.3                                            59
                                                                                                           Among Firms Offering Health Benefits,
                   e m p loy e e Co v e r Ag e ,                                                           Percentage of Firms That Offer the Following
                   e l i g i b i l i T y, A N D pA r T i C i pAT i o N                                     Plan Types, by Firm Size, 2009
            exhibit 3.1                                                          50                 exhibit 4.4                                            59
                   Percentage of All Workers Covered by Their                                              Among Firms Offering Health Benefits,
                   Employers’ Health Benefits, in Firms Both                                               Percentage of Covered Workers in Firms That
                   Offering and Not Offering Health Benefits,                                              Offer the Following Plan Types, by Firm Size,
                   by Firm Size, 1999–2009                                                                 2009


vi
     t h e k a i s e r fa m i ly f o u n d at i o n - a n d - h e a lt h r e s e a r C h & e d u C at i o n a l t r u s t
m A r k e T s h A r e s o f h e A lT h p l A N s                 exhibit 6.10                                                         77
                                                                             Average Annual Firm and Worker Premium
exhibit 5.1                                          63                      Contributions and Total Premiums for
     Distribution of Health Plan Enrollment for                              Covered Workers for Family Coverage,
     Covered Workers, by Plan Type, 1988–2009                                by Plan Type and Firm Size, 2009
exhibit 5.2                                          64               exhibit 6.11                                                         78
     Distribution of Health Plan Enrollment                                  Average Monthly and Annual Worker
     for Covered Workers, by Firm Size, Region,                              Premium Contributions Paid by Covered
     and Industry, 2009                                                      Workers for Single and Family Coverage,
                                                                             by Plan Type and Firm Size, 2009
     W o r k e r A N D e m p loy e r
     Co N T r i b u T i o N s f o r p r e m i u m s                   exhibit 6.12                                                         79
                                                                             Average Monthly and Annual Worker
exhibit 6.1                                          68                      Premium Contributions Paid by Covered
     Average Percentage of Premium Paid                                      Workers for Single and Family Coverage,
     by Covered Workers for Single and Family                                by Plan Type and Region, 2009
     Coverage, 1999–2009
                                                                      exhibit 6.13                                                         80
exhibit 6.2                                          69                      Average Monthly Worker Premium
     Average Monthly Worker Premium                                          Contributions Paid by Covered Workers
     Contributions Paid by Covered Workers                                   for Single and Family Coverage, by Plan Type,
     for Single and Family Coverage, 1999–2009                               1999–2009

exhibit 6.3                                          70               exhibit 6.14                                                         80
     Average Annual Worker and Employer                                      Distribution of Worker Premium
     Contributions to Premiums and Total                                     Contributions for Single and Family Coverage
     Premiums for Single Coverage, 1999–2009                                 Relative to the Average Annual Worker
                                                                             Premium Contribution, 2009
exhibit 6.4                                          71
     Average Annual Worker and Employer                               exhibit 6.15                                                         81
     Contributions to Premiums and Total                                     Distribution of Percentage of Premium Paid
     Premiums for Family Coverage, 1999–2009                                 by Covered Workers for Single and Family
                                                                             Coverage, 2001–2009
exhibit 6.5                                          72
     Average Annual Firm and Worker Premium                           exhibit 6.16                                                         82
     Contributions and Total Premiums for                                    Distribution of Percentage of Premium Paid
     Covered Workers for Single and Family                                   by Covered Workers for Single Coverage,
     Coverage, by Plan Type, 2009                                            by Firm Size, 2001–2009

exhibit 6.6                                          73               exhibit 6.17                                                         83
     Average Annual Worker Contributions                                     Distribution of Percentage of Premium Paid
     for Covered Workers with Single Coverage,                               by Covered Workers for Family Coverage,
     by Firm Size, 1999–2009                                                 by Firm Size, 2001–2009

exhibit 6.7                                          74               exhibit 6.18                                                         84
     Average Annual Worker Contributions                                     Average Percentage of Premium Paid
     for Covered Workers with Family Coverage,                               by Covered Workers for Single Coverage,
     by Firm Size, 1999–2009                                                 by Firm Characteristics, 2009

exhibit 6.8                                          75               exhibit 6.19                                                         85
     Average Annual Worker Premium                                           Average Percentage of Premium Paid
     Contributions Paid by Covered Workers                                   by Covered Workers for Family Coverage,
     for Single and Family Coverage, by Firm Size,                           by Firm Characteristics, 2009
     1999–2009
                                                                      exhibit 6.20                                                         86
exhibit 6.9                                          76                      Average Percentage of Premium Paid
     Average Annual Firm and Worker Premium                                  by Covered Workers for Single and Family
     Contributions and Total Premiums for                                    Coverage, by Plan Type and Firm Size, 2009
     Covered Workers for Single Coverage,
     by Plan Type and Firm Size, 2009


                                                                                                                                                                   vii
                                            t h e k a i s e r fa m i ly f o u n d at i o n - a n d - h e a lt h r e s e a r C h & e d u C at i o n a l t r u s t
exhibit 6.21                                                         87                 exhibit 7.9                                        103
                     Average Percentage of Premium Paid                                                      Among Covered Workers With a General
                     by Covered Workers for Single and Family                                                Annual Health Plan Deductible for Single
                     Coverage, by Plan Type, 1999–2009                                                       POS Coverage, Distribution of Deductibles,
                                                                                                             2006–2009
              exhibit 6.22                                                         88
                     Average Percentage of Premium Paid                                               exhibit 7.10                                       104
                     by Covered Workers for Single and Family                                                Distribution of Type of General Annual
                     Coverage, by Plan Type and Region, 2009                                                 Deductible for Covered Workers with Family
                                                                                                             Coverage, by Plan Type and Firm Size, 2009
              exhibit 6.23                                                         89
                     Average Percentage of Premium Paid by                                            exhibit 7.11                                       105
                     Covered Workers, by Plan Type and Industry,                                             Among Covered Workers with a General
                     2009                                                                                    Annual Health Plan Deductible, Average
                                                                                                             Deductibles for Family Coverage, by Deductible
                     e m p loy e e Co s T s h A r i N g                                                      Type, Plan Type, and Firm Size, 2009

              exhibit 7.1                                                          96                 exhibit 7.12                                       106
                     Percentage of Covered Workers With No                                                   Among Covered Workers with a General
                     General Annual Health Plan Deductible                                                   Annual Health Plan Deductible for Family
                     for Single and Family Coverage, by Plan Type                                            Coverage, Average Aggregate Deductible,
                     and Firm Size, 2009                                                                     by Plan Type, 2006–2009

              exhibit 7.2                                                          97                 exhibit 7.13                                       107
                     Among Covered Workers with No General                                                   Among Covered Workers with a General
                     Annual Health Plan Deductible for Single and                                            Annual Health Plan Deductible, Average
                     Family Coverage, Percentage Who Have the                                                Deductibles for Family Coverage, by Deductible
                     Following Types of Cost Sharing, by Plan                                                Type, Plan Type, and Firm Size, 2009
                     Type, 2009
                                                                                                      exhibit 7.14                                       108
              exhibit 7.3                                                          98                        Among Covered Workers With a Separate per
                     Among Covered Workers with a General                                                    Person General Annual Health Plan Deductible
                     Annual Health Plan Deductible for Single                                                for Family Coverage, Distribution of Maximum
                     Coverage, Average Deductible, by Plan Type                                              Number of Family Members Required to Meet
                     and Firm Size, 2009                                                                     the Deductible, by Plan Type, 2009

              exhibit 7.4                                                          99                 exhibit 7.15                                       109
                     Among Covered Workers with a General                                                    Among Covered Workers With an Aggregate
                     Annual Health Plan Deductible for Single                                                General Annual Health Plan Deductible for
                     Coverage, Average Deductible, by Plan Type                                              Family Coverage, Distribution of Aggregate
                     and Region, 2009                                                                        Deductibles, by Plan Type, 2006–2009

              exhibit 7.5                                                        100                  exhibit 7.16                                       110
                     Among Covered Workers with a General Annual                                             Among Covered Workers with a General
                     Health Plan Deductible for Single Coverage,                                             Annual Health Plan Deductible, Percentage
                     Average Deductible, by Plan Type, 2006–2009                                             with Coverage for the Following Services
                                                                                                             Without Having to First Meet the Deductible,
              exhibit 7.6                                                        101                         by Plan Type, 2009
                     Percentage of Covered Workers Enrolled in a
                     Plan with a High General Annual Deductible                                       exhibit 7.17                                       110
                     for Single Coverage, By Firm Size, 2009                                                 Distribution of Covered Workers With
                                                                                                             Separate Cost Sharing for a Hospital
              exhibit 7.7                                                        102                         Admission in Addition to Any General
                     Percentage of Covered Workers Enrolled                                                  Annual Deductible, by Plan Type, 2009
                     in a Plan with a General Annual Deductible
                     of $1,000 or More for Single Coverage,                                           exhibit 7.18                                       111
                     By Firm Size, 2006–2009                                                                 Distribution of Covered Workers With
                                                                                                             Separate Cost Sharing for an Outpatient
              exhibit 7.8                                                        103                         Surgery in Addition to Any General Annual
                     Among Covered Workers With a General Annual                                             Deductible, by Plan Type, 2009
                     Health Plan Deductible for Single PPO Coverage,
                     Distribution of Deductibles, 2006–2009

viii
       t h e k a i s e r fa m i ly f o u n d at i o n - a n d - h e a lt h r e s e a r C h & e d u C at i o n a l t r u s t
exhibit 7.19                                      112                  exhibit 7.30                                                       120
     Among Covered Workers With Separate                                      Among Covered Workers with an Aggregate
     Cost Sharing for a Hospital Admission or                                 Out-of-Pocket Maximum for Family
     Outpatient Surgery in Addition to Any                                    Coverage, Distribution of Out-of-Pocket
     General Annual Deductible, Average Cost                                  Maximums, by Plan Type, 2009
     Sharing, by Plan Type, 2009
                                                                       exhibit 7.31                                                       121
exhibit 7.20                                      113                         Among Covered Workers with a Separate per
     In Addition to Any Plan Deductible,                                      Person Out-of-Pocket Maximum for Family
     Percentage of Covered Workers With the                                   Coverage, Distribution of Out-of-Pocket
     Following Types of Cost Sharing for Physician                            Maximums, by Plan Type, 2009
     Office Visits, by Plan Type, 2009
                                                                       exhibit 7.32                                                       121
exhibit 7.21                                      113                         Among Covered Workers with a Separate per
     Among Covered Workers with Copayments                                    Person Out-of-Pocket Maximum for Family
     and/or Coinsurance for In-Network Physician                              Coverage, Distribution of Maximum Number
     Office Visits, Average Copayments and                                    of Family Members Required to Meet the
     Coinsurance, by Plan Type, 2009                                          Maximum, by Plan Type, 2009

exhibit 7.22                                      114
                                                                              h i g h - D e D u C T i b l e h e A lT h p l A N s
     Among Covered Workers With Copayments
     for a Physician Office Visit with a Primary                              W i T h s Av i N g s o p T i o N
     Care Physician, Distribution of Copayments,
                                                                       exhibit 8.1                                                        129
     by Plan Type, 2004–2009
                                                                              Among Firms Offering Health Benefits,
exhibit 7.23                                      115                         Percentage That Offer an HDHP/HRA and/
     Among Covered Workers With Copayments                                    or an HSA-Qualified HDHP, 2005–2009
     for a Physician Office Visit with a Specialty
                                                                       exhibit 8.2                                                        129
     Care Physician, Distribution of Copayments,
                                                                              Among Firms Offering Health Benefits,
     by Plan Type, 2006–2009
                                                                              Percentage That Offer an HDHP/SO, by Firm
exhibit 7.24                                      116                         Size, 2009
     Among Covered Workers in HMOs With
                                                                       exhibit 8.3                                                        130
     Copayments for a Physician Office Visit,
                                                                              Among Firms Offering Health Benefits,
     Distribution of Percentage of Workers with
                                                                              Percentage That Offer an HDHP/SO, by Firm
     Various Copayments, 1999–2009
                                                                              Size, 2005–2009
exhibit 7.25                                      116                  exhibit 8.4                                                        130
     Among Covered Workers With Coinsurance
                                                                              Percentage of Covered Workers Enrolled
     for Physician Office Visits, Distribution of
                                                                              in an HDHP/HRA or HSA-Qualified HDHP,
     Average Coinsurance Rates, by Plan Type, 2009
                                                                              2006–2009
exhibit 7.26                                      117                  exhibit 8.5                                                        131
     Percentage of Covered Workers Without an
                                                                              Percentage of Covered Workers Enrolled
     Annual Out-of-Pocket Maximum for Single
                                                                              in an HDHP/HRA or HSA-Qualified HDHP,
     and Family Coverage, by Plan Type, 2009
                                                                              by Firm Size, 2009
exhibit 7.27                                      117                  exhibit 8.6                                                        131
     Among Covered Workers with an Annual
                                                                              HDHP/HRA and HSA-Qualified HDHP
     Out-of-Pocket Maximum, Percentage Whose
                                                                              Features for Covered Workers, 2009
     Spending for Various Services Does Not Count
     Towards the Out-of-Pocket Maximum, 2009                           exhibit 8.7                                                        132
                                                                              HSA-Qualified HDHP Features for Covered
exhibit 7.28                                      118                         Workers, by Firm Size, 2009
     Among Covered Workers with an Out-of-Pocket
     Maximum for Single Coverage, Distribution of                      exhibit 8.8                                                        133
     Out-of-Pocket Maximums, by Plan Type, 2009                               Average Annual Premiums and Contributions
                                                                              to Savings Accounts For Covered Workers
exhibit 7.29                                      119                         in HDHP/HRAs or HSA-Qualified HDHPs,
     Distribution of Type of Out-of-Pocket
                                                                              Compared to All Non-HDHP/SO Plans, 2009
     Maximum for Covered Workers with Family
     Coverage, by Plan Type and Firm Size, 2009


                                                                                                                                                                    ix
                                             t h e k a i s e r fa m i ly f o u n d at i o n - a n d - h e a lt h r e s e a r C h & e d u C at i o n a l t r u s t
exhibit 8.9                                                        134                  exhibit 8.20                                         141
                  Distribution of Covered Workers with the                                                Among Firms Not Currently Offering an
                  Following General Annual Deductible                                                     HDHP/HRA or HSA-Qualified HDHP,
                  Amounts for Single Coverage, HSA-Qualified                                              Distribution of Firms Reporting the Likelihood
                  HDHPs and HDHP/HRAs, 2009                                                               of Offering an HDHP/HRA or HSA-Qualified
                                                                                                          HDHP in the Next Year, by Firm Size, 2009
           exhibit 8.10                                                       134
                  Among Covered Workers, Distribution of
                  Type of General Annual Deductible for Family
                                                                                                          presCripTioN Drug beNefiTs
                  Coverage, HDHP/HRAs and HSA-Qualified                                            exhibit 9.1                                          146
                  HDHPs, 2009                                                                             Distribution of Covered Workers Facing
                                                                                                          Different Cost-Sharing Formulas for
           exhibit 8.11                                                       135
                                                                                                          Prescription Drug Benefits, 2000–2009
                  Distribution of Covered Workers with the
                  Following Aggregate Family Deductible                                            exhibit 9.2                                          147
                  Amounts, HDHP/HRAs and HSA-Qualified                                                    Distribution of Covered Workers Facing
                  HDHPs, 2009                                                                             Different Cost-Sharing Formulas for
                                                                                                          Prescription Drug Benefits, by Plan Type, 2009
           exhibit 8.12                                                       135
                  Percentage of Covered Workers with Coverage                                      exhibit 9.3                                          148
                  for the Following Services Without Having to                                            Among Workers with Three, Four, or More
                  First Meet the Deductible, HDHP/HRAs and                                                Tiers of Cost Sharing, Distribution of Covered
                  HSA-Qualified HDHPs, by Benefit Type, 2009                                              Workers with the Following Types of Cost
                                                                                                          Sharing for Prescription Drugs, by Drug and
           exhibit 8.13                                                       136
                                                                                                          Plan Type, 2009
                  Percentage of Covered Workers in Partially or
                  Completely Self-Funded HDHP/HRAs and                                             exhibit 9.4                                          149
                  HSA-Qualified HDHPs, 2009                                                               Among Covered Workers with Three, Four,
                                                                                                          or More Tiers of Prescription Cost Sharing,
           exhibit 8.14                                                       136
                                                                                                          Average Copayments and Average
                  Distribution of Covered Workers with the
                                                                                                          Coinsurance, 2000–2009
                  Following Annual Employer Contributions to
                  their HRA or HSA, for Single Coverage, 2009                                      exhibit 9.5                                          150
                                                                                                          Among Workers with Two Tiers of Cost
           exhibit 8.15                                                       137
                                                                                                          Sharing for Prescription Drugs, Distribution
                  Distribution of Covered Workers with the
                                                                                                          of Covered Workers with the Following Types
                  Following Annual Employer Contributions to
                                                                                                          of Cost Sharing for Prescription Drugs,
                  their HRA or HSA, for Family Coverage, 2009
                                                                                                          by Drug and Plan Type, 2009
           exhibit 8.16                                                       137
                                                                                                   exhibit 9.6                                          151
                  Distribution of Firm Contributions to the
                                                                                                          Among Covered Workers with Two Tiers of
                  HRA for Single and Family Coverage Relative
                                                                                                          Prescription Cost Sharing, Average Copayments
                  to the Average Annual Firm Contribution
                                                                                                          and Average Coinsurance, 2000–2009
                  to the HRA, 2009
                                                                                                   exhibit 9.7                                          151
           exhibit 8.17                                                       138
                                                                                                          Among Workers with the Same Cost Sharing
                  Distribution of Firm Contributions to the
                                                                                                          Regardless of Type of Drug, Distribution
                  HSA for Single and Family Coverage Relative
                                                                                                          of Covered Workers with the Following Types
                  to the Average Annual Firm Contribution
                                                                                                          of Cost Sharing for Prescription Drugs,
                  to the HSA, 2009
                                                                                                          by Plan Type, 2009
           exhibit 8.18                                                       139
                                                                                                   exhibit 9.8                                          152
                  Distribution of Covered Workers in HDHP/
                                                                                                          Among Covered Workers with the Same Cost
                  HRAs and HSA-Qualified HDHPs With the
                                                                                                          Sharing Regardless of Type of Drug, Average
                  Following Types of Cost Sharing in Addition
                                                                                                          Copayments and Average Coinsurance,
                  to the General Annual Deductible, 2009
                                                                                                          2000–2009
           exhibit 8.19                                                       140
                                                                                                   exhibit 9.9                                          152
                  Among Firms Offering HDHP/SOs,
                                                                                                          Percentage of Covered Workers with Drug
                  Employer Opinions on Outcomes and
                                                                                                          Coverage Who Face a Separate Drug
                  Reasons for Offering HDHP/SOs, 2009
                                                                                                          Deductible, by Plan Type, 2005–2009


x
    t h e k a i s e r fa m i ly f o u n d at i o n - a n d - h e a lt h r e s e a r C h & e d u C at i o n a l t r u s t
exhibit 9.10                                         153                  exhibit 11.3                                                       167
     Percentage of Covered Workers with Drug                                     Among All Large Firms (200 or More Workers)
     Coverage with a Separate Annual Out-of-                                     Offering Health Benefits to Active Workers,
     Pocket Limit That Applies to Prescription                                   Percentage of Firms Offering Retiree Health
     Drugs, by Plan Type, 2007–2009                                              Benefits, by Firm Characteristics, 2009

                                                                          exhibit 11.4                                                       167
     plAN fuNDiNg                                                                Among All Large Firms (200 or More Workers)
exhibit 10.1                                         157                         Offering Health Benefits to Active Workers and
     Percentage of Covered Workers in Partially                                  Offering Retiree Coverage, Percentage of Firms
     or Completely Self-Funded Plans,                                            Offering Health Benefits to Early and Medicare-
     by Firm Size, 1999–2009                                                     Age Retirees, 1999–2009

exhibit 10.2                                         157                  exhibit 11.5                                                       168
     Percentage of Covered Workers in Partially                                  Among All Large Firms (200 or More
     or Completely Self-Funded Plans,                                            Workers) Offering Health Benefits to Active
     by Plan Type, 1999–2009                                                     Workers and Offering Retiree Coverage,
                                                                                 Percentage of Firms Offering Retiree Health
exhibit 10.3                                         158                         Benefits to Early and Medicare-Age Retirees,
     Percentage of Covered Workers in Partially                                  by Firm Size, Region, and Industry, 2009
     or Completely Self-Funded Plans, by Firm
     Size, Region, and Industry, 2009                                            WellNess progrAms
exhibit 10.4                                         159                         A N D h e A lT h r i s k A s s e s s m e N T s
     Percentage of Covered Workers in Partially
                                                                          exhibit 12.1                                                       173
     or Completely Self-Funded Plans,
                                                                                 Among Firms Offering Health Benefits,
     by Plan Type and Firm Size, 2009
                                                                                 Percentage Offering a Particular Wellness
exhibit 10.5                                         159                         Program to Their Employees, by Firm Size,
     Percentage of Covered Workers in Partially                                  Region, and Industry, 2009
     or Completely Self-Funded HMO Plans,
                                                                          exhibit 12.2                                                       174
     by Firm Size, 1999-2009
                                                                                 Among Firms Offering Health Benefits,
exhibit 10.6                                         160                         Percentage Offering a Particular Wellness
     Percentage of Covered Workers in Partially                                  Program to Their Employees, by Firm Size,
     or Completely Self-Funded PPO Plans,                                        Region, and Industry, 2009
     by Firm Size, 1999–2009
                                                                          exhibit 12.3                                                       175
exhibit 10.7                                         160                         Among Firms Offering Health Benefits, Percentage
     Percentage of Covered Workers in Partially                                  of Firms With the Following Features of Wellness
     or Completely Self-Funded POS Plans,                                        Benefits, by Firm Size and Region, 2009
     by Firm Size, 1999–2009
                                                                          exhibit 12.4                                                       176
exhibit 10.8                                         161                         Among Firms Offering Health and Wellness
     Percentage of Covered Workers in Partially                                  Benefits, Percentage of Firms That Offer
     or Completely Self-Funded HDHP/SOs,                                         Specific Incentives to Employees Who
     by Firm Size, 2006–2009                                                     Participate in Wellness Programs, by Firm
                                                                                 Size and Region, 2009
     r e T i r e e h e A lT h b e N e f i T s                             exhibit 12.5                                                       177
                                                                                 Among Firms Offering Health Benefits
exhibit 11.1                                         165                         and Wellness Programs, Percentage That Use
     Among All Large Firms (200 or More Workers)
                                                                                 Specific Methods to Identify Individuals and
     Offering Health Benefits to Active Workers,
                                                                                 Encourage Participation in Wellness Programs,
     Percentage of Firms Offering Retiree Health
                                                                                 by Firm Size, Region, and Industry, 2009
     Benefits, 1988-2009
                                                                          exhibit 12.6                                                       178
exhibit 11.2                                         166                         Among Firms Offering Health Benefits
     Among Firms Offering Health Benefits to
                                                                                 and Wellness Programs, Percentage of Firms
     Active Workers, Percentage of Firms Offering
                                                                                 Reporting the Following as the Firm’s Primary
     Retiree Health Benefits, by Firm Size, Region,
                                                                                 Reason for Offering Wellness Programs,
     and Industry, 2009
                                                                                 by Firm Size, 2009


                                                                                                                                                                       xi
                                                t h e k a i s e r fa m i ly f o u n d at i o n - a n d - h e a lt h r e s e a r C h & e d u C at i o n a l t r u s t
exhibit 12.7                                                        178                 exhibit 13.5                                         189
                      Among Firms Offering Health Benefits and                                                Among Firms Offering Health Benefits That
                      Wellness Programs, Percentage of Firms That                                             Shopped for a New Plan or Insurance Carrier,
                      Think Offering Wellness Programs is Effective                                           Percentage Reporting That They Changed
                      at Improving Health or Reducing Costs, 2009                                             Insurance Carrier and/or Health Plan Type in
                                                                                                              the Past Year, by Firm Size, 2009
              exhibit 12.8                                                        179
                      Among Firms Offering Health Benefits,                                           exhibit 13.6                                         190
                      Percentage of Firms That Offer Employees                                                Among Firms Offering Health Benefits,
                      Health Risk Assessments, Offer Incentives to                                            Percentage of Firms Reporting the Following
                      Complete Assessments, and Use Assessments                                               as the Most Important Factor in the Firm’s
                      to Increase Wellness Participation, by Firm                                             Decision to Choose a Particular Plan, in
                      Size and Region, 2009                                                                   Addition to Cost, by Firm Size, 2009

              exhibit 12.9                                                        180                 exhibit 13.7                                         191
                      Among Large Firms (200 or More Workers)                                                 Among Firms Offering Health Benefits,
                      Offering Financial Incentives for Health Risk                                           Percentage of Firms Reporting the Use
                      Assessments, Percentage of Firms That Offer                                             of the Following Contribution Approaches
                      the Following Incentives to Complete                                                    for Health Benefits, 2009
                      Assessments, by Firm Size and Region, 2009
                                                                                                      exhibit 13.8                                         192
              exhibit 12.10                                                       180                         Among Firms Offering Health Benefits,
                      Among Firms Offering Health Benefits                                                    Distribution of Firms Reporting the
                      and Health Risk Assessments, Distribution                                               Likelihood of Adopting the Following
                      of Firms Reporting the Following in Terms                                               Contribution Approaches for Health Benefits
                      of When Employees Must Take Health Risk                                                 in the Next Two Years, 2009
                      Assessments, by Firm Size, 2009
                                                                                                      exhibit 13.9                                         193
                                                                                                              Among Offering and Non-Offering Firms,
                      e m p loy e r A N D h e A lT h p l A N                                                  Percentage With the Following On-Site Health
                      p r AC T i C e s , A N D e m p loy e r o p i N i o N s                                  and Safety Programs, by Firm Size, Region,
                                                                                                              and Industry, 2009
              exhibit 13.1                                                        185
                      Among Both Firms Offering and Not                                               exhibit 13.10                                        194
                      Offering Health Benefits, Distribution                                                  Percentage of Firms with the Following
                      of Firms’ Opinions on the Effectiveness                                                 Utilization Management Provisions in their
                      of the Following Strategies to Contain Health                                           Largest Health Plan, By Firm Size, Region,
                      Insurance Costs, by Firm Size, 2009                                                     and Industry, 2009
              exhibit 13.2                                                        186                 exhibit 13.11                                        195
                      Among Firms Offering Health Benefits,                                                   Distribution of Covered Workers by
                      Distribution of Firms Reporting the                                                     Maximum Lifetime Benefit Payable to an
                      Likelihood of Making the Following Changes                                              Employee with Single Coverage, by Plan Type,
                      in the Next Year, by Firm Size, 2009                                                    2004–2009
              exhibit 13.3                                                        187                 exhibit 13.12                                        196
                      Among Firms Offering Health Benefits,                                                   Distribution of Covered Workers by
                      Percentage of Firms That Report They Made                                               Maximum Lifetime Benefit Payable to an
                      the Following Changes as a Result of the                                                Employee with Single Coverage, by Plan Type
                      Economic Downturn, by Firm Size and                                                     and Firm Size, 2009
                      Region, 2009

              exhibit 13.4                                                        188
                      Percentage of Firms Offering Health Benefits
                      That Shopped For a New Plan or Health
                      Insurance Carrier in the Past Year, by Firm
                      Size, 2009


xii
      t h e k a i s e r fa m i ly f o u n d at i o n - a n d - h e a lt h r e s e a r C h & e d u C at i o n a l t r u s t
Summary of Findings
      E mployer - sponsored insurance is the leading source of health insurance , covering about 159 million nonelderly
      people in   a merica . 1 to provide current information about the nature of employer - sponsored health benefits ,
      the   K aiser family foundation (K aiser ) and the h ealth r esearch & e ducational trust (hret ) conduct an annual
      national survey of nonfederal private and public employers with three or more worKers .                                              t his is the eleventh
      K aiser /hret survey and reflects health benefit information for 2009.


The key findings from the 2009 survey,
conducted from January through May                 Exhibit A
2009, provide a mixed, but relatively stable       Average Annual health insurance premiums and Worker Contributions
story compared to 2008. In 2009, there was         for family Coverage, 1999–2009
an increase in the average family premium,                                                                 131%
                                                                                                                                     $13,375
the percentage of covered workers with a                                                                 Premium
                                                                                                         Increase
deductible of $1,000 or more for single
coverage, office visit copayments, and the
                                                                                                                                      $9,860
percentage of large firms offering wellness                                   $5,791                      128%
programs. The average premium for single                                                                 Worker
                                                                                                      Contribution
coverage did not significantly increase,                                      $4,247                    Increase
breaking a long-standing trend.                                                                                                        $3,515
                                                                              $1,543
The survey shows that many of the statistics                                   1999                                                     2009
related to health benefits remained relatively
stable despite the severe economic downturn.                              Employer Contribution                                  Worker Contribution

This may indicate a strong commitment to           note: the average worker contribution and the average employer contribution may not add to the average total
maintaining workers’ benefits, but several         premium due to rounding.

other factors may have contributed to this         source: kaiser/hret survey of employer-sponsored health Benefits, 1999–2009.

result as well. One is that the survey only
collects information from firms that are still
                                                 workers) than for workers in large firms                             premium while 18% make no contribution.
in business and cannot estimate the number
                                                 (200 or more workers). Average premiums                              Forty-five percent of workers with family
of workers who lost coverage due to their
                                                 for high-deductible health plans with a                              coverage pay more than 25% of the total
company downsizing or closing. Another is
                                                 savings option (HDHP/SOs) are lower than                             premium; only 6% make no contribution
that some firms may have made decisions
                                                 the overall average for all plan types for both                      (Exhibit D). In terms of dollar amounts,
about health benefits in advance of the plan
                                                 single and family coverage (Exhibit B).                              the average annual worker contributions
year and may not have foreseen the full
impact of the worsening economy on the           As a result of factors such as benefit                               for single and family coverage are $779
firm. These firms may have made changes          differences and geographical location, there                         and $3,515,2 respectively, which are not
after they were surveyed or may make             is significant variation around the average                          significantly different from the amounts
changes for the next plan year.                  annual premium. Twenty percent of covered                            reported in 2008. For single coverage, workers
                                                 workers with family coverage are in plans                            in small firms (3–199 workers) contribute less
H E A LT H I N S U R A N C E P R E M I U M S     with an annual total premium of at least                             on average than workers in large firms (200 or
                                                 $16,050 (120% of the average premium);                               more workers) ($625 vs. $854), but for family
In 2009, the average annual premiums for
                                                 21% of covered workers are in plans where
employer-sponsored health insurance are                                                                               coverage, workers in small firms contribute
                                                 the family premium is less than $10,700
$4,824 for single coverage and $13,375                                                                                significantly more than workers in large firms
                                                 (80% of the average premium) (Exhibit C).
for family coverage. Premiums for family                                                                              ($4,204 vs. $3,182).
coverage are 5% higher than last year            On average, covered workers contribute
($12,680), but there was no statistically        17% of the total premium for single coverage                         The majority (60%) of covered workers are
significant growth in the single premiums.       and 27% for family coverage, similar to the                          enrolled in preferred provider organizations
Since 1999, average premiums for family          last several years. The share of the premium                         (PPOs). Health maintenance organizations
coverage have increased 131% (Exhibit A).        workers contribute for coverage also varies                          (HMOs) cover 20%, followed by point-of-
Average premiums for family coverage are         considerably. For single coverage, 24% of                            service (POS) plans (10%), HDHP/SOs
lower for workers in small firms (3–199          workers pay more than 25% of the total                               (8%), and conventional plans (1%).

                                                                                                                                                                          1
                                                   t h e k a i s e r fa m i ly f o u n d at i o n - a n d - h e a lt h r e s e a r C h & e d u C at i o n a l t r u s t
Exhibit b
   Average Annual employer and Worker premium Contributions and Total premiums for Covered Workers for single
   and family Coverage, by plan Type, 2009
         HMO
               Single $817                         $4,061                        $4,878

               Family                    $3,685                                                                     $9,785                                       $13,470

         PPO
               Single      $806                    $4,116                         $4,922

               Family                  $3,470                                                                      $10,249*                                        $13,719

         POS
               Single $741                        $4,093                         $4,835

               Family                       $4,146*                                                            $8,929*                                       $13,075


        HDHP/SO                $540*
           Single                          $3,446*                     $3,986*

               Family                $2,672*                                                  $8,411*                                       $11,083*

         ALL PLANS
             Single $779                           $4,045                        $4,824

               Family                    $3,515                                                                    $9,860                                      $13,375

                          $0                  $2,000                 $4,000                  $6,000              $8,000           $10,000       $12,000         $14,000

                                                                  Worker Contribution                              Employer Contribution

   * estimate is statistically different from all Plans estimate by coverage type (p<.05).

    source: kaiser/hret survey of employer-sponsored health Benefits, 2009.


EMPLOYEE COST SHARING                                                 $1,053 to $1,524 for family coverage.3 As                     to meet the deductible before prescription
                                                                      in recent years, for single coverage, workers                 drugs are covered.
Most covered workers face additional costs
                                                                      in small firms (3–199 workers) have higher
when they use health care services. Most                                                                                            The majority of workers also have to pay a
workers in PPOs (74%) and POS plans                                   deductibles than workers in large firms
                                                                                                                                    portion of the cost of physician office visits.
(62%) have a general annual deductible for                            (200 or more workers) for HMOs, PPOs,
                                                                                                                                    For example, 77% of covered workers pay
single coverage that must be met before all                           and HDHP/SOs. The percentage of covered
                                                                                                                                    a copayment (a fixed dollar amount) for a
or most services are payable by the plan. In                          workers in a plan with a deductible of at least
                                                                                                                                    visit, and 14% pay coinsurance (a percentage
contrast, only 16% of workers in HMOs                                 $1,000 for single coverage grew from 18% to
                                                                                                                                    of the charge). Covered workers in HMOs,
have a general annual deductible. Many                                22% in the past year and, among large firms,
                                                                                                                                    PPOs, and POS plans are more likely to
workers with no deductible have other                                 it increased from 9% to 13% (Exhibit E).
                                                                                                                                    face copayments, while covered workers
forms of cost sharing for office visits or other                      While there was no increase in the percentage
                                                                                                                                    in HDHP/SOs are more likely to have
services.                                                             of workers enrolled in HDHP/SOs in the
                                                                                                                                    coinsurance requirements or no cost sharing
                                                                      past year, the percentage of workers in plans
Among workers with a deductible, the                                                                                                after any deductibles are met. Covered
                                                                      with deductibles of at least $1,000 who do
average general annual deductible for single                                                                                        workers with a copayment pay an average of
                                                                      not have a savings option increased from
coverage is $634 for workers in PPOs, $699                                                                                          $20 for primary care and $28 for specialty
                                                                      10% to 13%.
for workers in HMOs, $1,061 for workers                                                                                             physicians for in-network office visits, both of
in POS plans, and $1,838 for workers in                               Most plans cover certain services before the                  which are higher than last year ($19 and $26).
HDHP/SOs (which by definition have high                               deductible is met. For example, in the most                   The percentage of workers with copayments
deductibles). Although only 16% of workers                            common plan type, PPOs, 88% of covered                        of $25 or $30 dollars for primary care
in HMOs have a general annual deductible,                             workers with a general annual deductible                      physician office visits increased from 12% in
from 2008 to 2009 the average annual                                  do not have to meet the deductible before                     2004 to 31% in 2009. For covered workers
deductible for these workers increased from                           preventive care is covered. Ninety-three                      with coinsurance, the average coinsurance is
$503 to $699 for single coverage and from                             percent of workers in PPOs do not have                        18% for primary care, similar to last year.


  2
           t h e k a i s e r fa m i ly f o u n d at i o n - a n d - h e a lt h r e s e a r C h & e d u C at i o n a l t r u s t
Exhibit C
   Distribution of premiums for single and family Coverage relative to the Average Annual single or family premium, 2009

                                             single Coverage                                                                       family Coverage
                                                                        Percent Covered                                                                       Percent Covered
               Premium range, dollar amount                             Workers in range                Premium range, dollar amount                          Workers in range


                less than $3,859                                                 23%                     less than $10,700                                            21%
                $3,859 to <$4,341                                                15%                     $10,700 to <$12,038                                          16%
                $4,341 to <$4,824                                                19%                     $12,038 to <$13,375                                          14%
                $4,824 to <$5,306                                                13%                     $13,375 to <$14,713                                          17%
                $5,306 to <$5,788                                                13%                     $14,713 to <$16,050                                          12%
                $5,788 or more                                                   18%                     $16,050 or more                                              20%

   note: the average annual premium is $4,824 for single coverage and $13,375 for family coverage. the premium distribution is relative to the average single or family premium.
   for example, $3,859 is 80% of the average single premium, $4,341 is 90% of the average single premium, $5,306 is 110% of the average single premium, and $5,788 is 120%
   of the average single premium. the same break points relative to the average are used for the distribution for family coverage.

   source: kaiser/hret survey of employer-sponsored health Benefits, 2009.


Almost all covered workers (98%) have                                  fourth tier, there is no statistical difference in                    average copayment is $85 and the average
prescription drug coverage, and the majority                           the percentage of workers with copayments                             coinsurance is 31%.
face cost sharing for their prescriptions.                             (41%) or coinsurance (29%). Among                                     Cost sharing for prescription drugs varies by
Over three-quarters (78%) of covered                                   workers with three- or four-tier plans, the                           plan type. Covered workers in HDHP/SOs
workers are in plans with three or more                                average copayments per prescription are $10                           are more likely than workers in other plan
levels or tiers of cost sharing that generally                         for first-tier drugs, often called generics; $27                      types to be in plans with no cost sharing
are based on the type or cost of the drug.                             for second-tier drugs, often called preferred;                        after the deductible is met or in plans where
Copayments are more common than                                        and $46 for third-tier drugs, often called                            the cost sharing is the same regardless of the
coinsurance for the first three tiers. For the                         nonpreferred. For fourth-tier drugs the                               type of drug.


   Exhibit D
   Distribution of the percentage of Total premium paid by Covered Workers for single and family Coverage, by firm size, 2009

       SINGLE COVERAGE*
                     All Small Firms                                  39%                                                        40%                                      19%              3%
                    (3–199 Workers)
                                                                                                                                                                                         1%
                   All Large Firms
                                                   8%                                                        67%                                                             24%
            (200 or More Workers)
                                                                                                                                                                                         1%
                           ALL FIRMS                      18%                                                   58%                                                          22%

       FAMILY COVERAGE*
                     All Small Firms               14%                           28%                                       28%                                         30%
                    (3–199 Workers)
                                                2%
                   All Large Firms                                                          58%                                                             36%                            4%
            (200 or More Workers)

                           ALL FIRMS            6%                                  48%                                                          33%                                12%


                                           0%            10%            20%            30%           40%           50%            60%            70%           80%            90%          100%

                                                 0%                                                                                    Greater than 25%, less than or equal to 50%
                                                 Greater than 0%, less than or equal to 25%                                            Greater than 50%

   * distributions for all small firms and all large firms are statistically different (p<.05).

    source: kaiser/hret survey of employer-sponsored health Benefits, 2009.


                                                                                                                                                                                                  3
                                                                          t h e k a i s e r fa m i ly f o u n d at i o n - a n d - h e a lt h r e s e a r C h & e d u C at i o n a l t r u s t
Most workers also face additional cost                              less than $1,500. However, not all spending                       AVAILABILIT Y OF EMPLOYER-
sharing for a hospital admission or an                              counts toward the out-of-pocket maximum.                          SPONSORED COVERAGE
outpatient surgery. For hospital admissions,                        For example, among workers in PPOs with
                                                                                                                                     Sixty percent of employers offer health
51% of covered workers have coinsurance,                            an out-of-pocket maximum, 75% are in
                                                                                                                                     benefits in 2009, which is not statistically
19% have a copayment, and 8% have                                   plans that do not count physician office
                                                                                                                                     different from the 63% reported last
both coinsurance and copayments. An                                 visit copayments, 34% are in plans that do
                                                                                                                                     year (Exhibit F). Less than half (46%) of
additional 5% have a per day (per diem)                             not count spending for the general annual
                                                                                                                                     firms with 3 to 9 workers offer coverage,
payment and 5% have a separate annual                               deductible, and 85% are in plans that do
                                                                                                                                     compared to 72% of firms with 10 to 24
hospital deductible, while 22% of covered                           not count prescription drug spending when
                                                                                                                                     workers, 87% of firms with 25 to 49
workers have no cost sharing for hospital                           determining if an enrollee has reached the
                                                                                                                                     workers, and over 95% of firms with 50
admissions. For hospital admissions, the                            out-of-pocket limit. Even in the absence of
                                                                    an out-of-pocket maximum, some workers                           or more workers. As we have seen in past
average coinsurance rate is 18%, the average
copayment is $234 per hospital admission,                           may face limited cost sharing. For example,                      years, the offer rate is higher for firms with
the average per diem charge is $179, and                            of the 41% of workers in HMOs with no                            at least some union workers, compared
the average separate hospital deductible is                         out-of-pocket maximum for single coverage,                       to firms with no union workers (97%
$862.4                                                              94% have no general annual deductible and                        vs. 57%). Firms with fewer lower-wage
                                                                    less than 1% have coinsurance for hospital                       workers (less than 35% of workers earn
Although covered workers are often                                                                                                   $23,000 or less annually) are also more
                                                                    admissions.
responsible for cost sharing when accessing                                                                                          likely to offer benefits compared to firms
health services, there is often a limit to                          Health plans may limit the benefit amount                        with more lower-wage employees (35%
the amount of cost sharing workers must                             payable to an employee, often known as                           or more earn $23,000 or less annually)
pay each year, generally referred to as an                          a lifetime maximum. Forty-one percent                            (64% vs. 39%). The offer rate represents
out-of-pocket maximum. Eighty-one                                   of covered workers are in a plan with no                         information on firms that are still in
percent of covered workers have an out-                             lifetime maximum benefit payable by the
                                                                                                                                     business and does not account for firms
of-pocket maximum, but such limits vary                             plan, while 16% have a lifetime maximum
                                                                                                                                     that have gone out of business due to the
considerably. For example, among covered                            between $1 and $2 million, and 43% have
                                                                                                                                     economic recession.
workers in plans that have an out-of-pocket                         a lifetime maximum of $2 million or more.
maximum for single coverage, 26% are                                The percentage of workers with a lifetime                        Even in firms that offer coverage, not all
in plans with an annual out-of-pocket                               maximum of $2 million or more has                                workers are covered. Some workers are
maximum of $3,000 or more, and 24% are                              increased from 32% of covered workers in                         not eligible to enroll as a result of waiting
in plans with an out-of-pocket maximum of                           2007, the last time the question was asked.                      periods or minimum work-hour rules.


  Exhibit E
  percentage of Covered Workers enrolled in a plan with a general Annual Deductible of $1,000 or more for single Coverage,
  by firm size, 2006–2009
            50%

                                                                                                                                                            40%
            40%
                                                                                                                       35%*

            30%

                                                                               21%*                                                                        22%*
            20%                                                                                                        18%*
                                     16%
                                                                              12%*                                                                         13%*
                                      10%
                                                                                                                        9%
            10%                                                                  8%
                                       6%

             0%
                                    2006                                      2007                                     2008                                 2009


                        All Small Firms (3–199 Workers)                                        All Large Firms (200 or More Workers)                                    All Firms

  * estimate is statistically different from estimate for the previous year shown (p<.05).

    note: these estimates include workers enrolled in hdhP/so and other plan types. Because we do not collect information on the attributes of conventional plans, to be conservative, we
    assumed that workers in conventional plans do not have a deductible of $1,000 or more. Because of the low enrollment in conventional plans, the impact of this assumption is minimal.

    source: kaiser/hret survey of employer-sponsored health Benefits, 2006–2009.


  4
          t h e k a i s e r fa m i ly f o u n d at i o n - a n d - h e a lt h r e s e a r C h & e d u C at i o n a l t r u s t
Others choose not to enroll, perhaps                                 H I G H - D E D U C T I B L E H E A LT H                              Account (HSA), referred to as “HSA-
because of the cost of coverage or their                             PLANS WITH SAVINGS OPTION                                             qualified HDHPs.”
ability to access coverage through a spouse.
                                                                     High-deductible health plans with a savings                           Twelve percent of firms offering health
Among firms that offer coverage, an average
                                                                     option include (1) health plans with a                                benefits offer an HDHP/SO in 2009, similar
of 79% of workers are eligible for the health
                                                                     deductible of at least $1,000 for single                              to last year. Although the HDHP/SO offer
benefits offered by their employer. Of those
eligible, 81% take up coverage, resulting                            coverage and $2,000 for family coverage                               rate remained steady among all firms, the
in 65% of workers in firms offering health                           offered with an Health Reimbursement                                  percentage of firms with 1,000 or more
benefits having coverage through their                               Arrangement (HRA), referred to as                                     workers offering an HDHP/SO increased
employer. Among both firms that offer and                            “HDHP/HRAs,” and (2) high-deductible                                  from 22% in 2008 to 28% in 2009. Firms
do not offer health benefits, 59% of workers                         health plans that meet the federal legal                              with 1,000 or more workers are more likely
are covered by health plans offered by their                         requirements to permit an enrollee to                                 to offer HDHP/SOs (28%) than firms
employer.                                                            establish and contribute to a Health Savings                          with 3 to 199 workers (11%) or 200 to 999


   Exhibit F
   percentage of firms offering health benefits, by firm size, 1999-2009

    FiRM SiZE                                     1999         2000          2001             2002      2003           2004         2005         2006          2007          2008          2009

       3–9 Workers                                56%           57%           58%             58%        55%           52%          47%           48%           45%          49%           46%

       10–24 Workers                              74%           80%           77%             70%*       76%           74%          72%           73%           76%          78%           72%

       25–99 Workers                              86%           91%           90%             86%        84%           87%          87%           87%           83%          90%*          87%

       50–199 Workers                             97%           97%           96%             95%        95%           92%          93%           92%           94%          94%           95%

    All Small Firms                               65%           68%          68%              66%       65%            63%          59%           60%          59%           62%           59%
      (3–199 Workers)
    All Large Firms                               99%           99%          99%              98%       98%            99%          98%           98%          99%           99%           98%
      (200 or More Workers)
    ALL FiRMS                                     66%           69%          68%              66%       66%            63%          60%           61%          60%           63%           60%
   * estimate is statistically different from estimate for the previous year shown (p<.05).

    note: as noted in the survey design and methods section, estimates presented in this exhibit are based on the sample of both firms that completed the entire survey and those that
    answered just one question about whether they offer health benefits.

    source: kaiser/hret survey of employer-sponsored health Benefits, 1999–2009.


   Exhibit G
   percentage of Covered Workers enrolled in an hDhp/hrA or hsA-Qualified hDhp, by firm size, 2009
            40%


            30%


            20%
                                                                                                                                               13%
            10%                                                                          9%                                                                              8%
                                                                                                                  6%                                         6%
                                3%           3%          3%                                          4%

              0%
                                       HDHP/HRA                                         HSA-Quali ed HDHP*                                             HDHP/SO*

                                                                                                                                             All Small Firms (3–199 Workers)
                                                                                                                                             All Large Firms (200 or More Workers)
   * estimates are statistically different between all small firms and all large firms within category (p<.05).
                                                                                                                                             All Firms
    source: kaiser/hret survey of employer-sponsored health Benefits, 2009.


                                                                                                                                                                                                  5
                                                                        t h e k a i s e r fa m i ly f o u n d at i o n - a n d - h e a lt h r e s e a r C h & e d u C at i o n a l t r u s t
workers (18%). Among firms offering health                           Deductibles vary considerably however; for                           annual firm contributions to HSAs are $688
benefits, 2% offer an HDHP/HRA and                                   example, 27% of workers enrolled in an                               for single coverage and $1,126 for family
10% offer an HSA-qualified HDHP; neither                             HSA-qualified HDHP                                                   coverage, and although these estimates
estimate represents a significant difference                         for single coverage have a deductible                                are lower than the estimates for 2008, the
from the percentages reported in 2008.                               between $1,150 and $1,499, while 10%                                 differences are not statistically significant.
                                                                     have a deductible of $3,000 or more.                                 It is important to note that not all firms
Enrollment of covered workers in
                                                                     The average aggregate annual deductible                              offering HSA-qualified HDHPs contribute
HDHP/SOs remained the same as in 2008                                for family coverage for HDHP/HRAs is                                 to the HSAs established by their workers.
(8%). Covered workers in small firms                                 $3,422 and $3,734 for HSA-qualified                                  For example, among firms offering an
(3–199 workers) are more likely to be                                HDHPs. Similar to the other plan types,                              HSA-qualified HDHP, 29% do not make
enrolled in an HDHP/SO than workers                                  many HDHP/SOs cover preventive                                       a contribution to the HSA for single or
in large firms (200 or more workers) (13%                            services before the deductible is met: 94%                           family coverage (covering 31% of workers
vs. 6%). Three percent of covered workers                            of workers in HDHP/HRAs and 90% of                                   in these plans). If workers with no employer
are enrolled in HDHP/HRAs and 6% are                                 workers in HSA-qualified HDHPs have                                  contribution to their HSA are excluded
enrolled in HSA-qualified HDHPs. Nine                                preventive care covered before having to                             from the calculation, the average employer
percent of workers in small firms (3–199                             meet the deductible.                                                 HSA contributions are $1,000 and $1,640
workers) are enrolled in HSA-qualified
                                                                     The distinguishing aspect of these high                              for single and family coverage, respectively.
HDHPs, compared to 4% of workers
                                                                     deductible plans is the savings feature                              Among workers with an employer
in large firms (200 or more workers)
                                                                     available to employees. Workers enrolled                             contribution to their HSA, workers in small
(Exhibit G).
                                                                     in an HDHP/HRA receive an average                                    firms (3–199 workers) on average receive
Annual deductibles for single coverage for                           annual contribution from their employer of                           higher contributions than workers in large
HDHP/HRAs and HSA-qualified HDHPs                                    $1,052 for single coverage and $2,073 for                            firms (200 or more workers) for both single
average $1,690 and $1,922, respectively.                             family coverage (Exhibit H). The average                             coverage ($1,319 vs. $619) and family


  Exhibit h
  Average Annual premiums and Contributions to savings Accounts for Covered Workers in hDhp/hrAs, or hsA-Qualified
  hDhps, Compared to All Non-hDhp/so plans, 2009

                                                                                                                                                          All Non-hDhP/SO
                                                                                           hDhP/hRA                      hSA-Qualified hDhP                     Plans§

                                                                                      single           family             single           family        single            family

      total Annual Premium                                                           $4,274*          $12,223*              $3,829*       $10,396*        $4,902          $13,591

        Worker Contribution to Premium                                                  $734            $3,067*                    438*     $2,453*         $801            $3,595

        firm Contribution to Premium                                                 $3,540*            $9,157              $3,391*         $7,943*       $4,101            $9,996

      Annual Firm Contribution to the hRA or hSA‡                                    $1,052             $2,073                $688          $1,126             na                na
      total Annual Firm Contribution (firm share of
                                                                                     $4,592*          $11,230*              $4,079          $9,070*       $4,101            $9,996
      Premium Plus firm Contribution to hra or hsa)
      total Annual Cost (total Premium Plus firm
                                                                                     $5,325*          $14,296               $4,517*       $11,523*        $4,902          $13,591
      Contribution to hra or hsa, if applicable)

  * estimate is statistically different from estimate for all non-hdhP/so Plans (p<.05).
  ‡ When those firms that do not contribute to the hsa (29% for single and family coverage) are excluded from the calculation, the average firm contribution to the hsa for covered workers
      is $1,000 for single coverage and $1,640 for family coverage. for hdhP/hras, we refer to the amount that the employer commits to make available to an hra as a contribution for ease
      of discussion. hras are notional accounts, and employers are not required to actually transfer funds until an employee incurs expenses. thus, employers may not expend the entire
      amount that they commit to make available to their employees through an hra. therefore, the employer contribution amounts to hras that we capture in the survey may exceed the
      amount that employers will actually spend.
  § in order to compare costs for hdhP/sos to all other plans that are not hdhP/sos, we created composite variables excluding hdhP/so data.

      na: not applicable.

      note: Values shown in the table may not equal the sum of their component parts. the averages presented in the table are aggregated at the firm level and then averaged,
      which is methodologically more appropriate than adding the averages. this is relevant for total annual Premium, total annual firm Contribution, and total annual Cost.

      source: kaiser/hret survey of employer-sponsored health Benefits, 2009.


  6
            t h e k a i s e r fa m i ly f o u n d at i o n - a n d - h e a lt h r e s e a r C h & e d u C at i o n a l t r u s t
coverage ($2,077 vs. $1,121), but they also                          large firms that offer retiree health benefits,                       risk assessment to employees than small
face higher deductibles.                                             92% offer health benefits to early retirees                           firms (3–199 workers) (55% vs. 14%).
                                                                     and 68% offer health benefits to Medicare-                            Eleven percent of firms offering health risk
For both single and family coverage,
                                                                     age retirees, similar to last year.                                   assessments offer financial incentives for
average total premiums for HSA-qualified
                                                                                                                                           workers to complete them. Large firms
HDHPs and HDHP/HRAs are lower than
                                                                     WELLNESS BENEFITS                                                     (200 or more workers) are more likely than
the average premiums for workers in plans
                                                                                                                                           small firms (3–199 workers) to offer financial
that are not HDHP/SOs. The average                                   More than half (58%) of employers offering
                                                                                                                                           incentives (34% vs. 7%). Among large firms
worker contributions to HSA-qualified                                health benefits offer at least one of the
                                                                                                                                           offering financial incentives to employees
HDHP single and family premiums and the                              following wellness programs: weight loss
                                                                                                                                           who complete a health risk assessment,
HDHP/HRA family worker contribution                                  program, gym membership discounts or
                                                                                                                                           27% of firms reported that employees pay a
to premiums are also lower than the                                  on-site exercise facilities, smoking cessation                        smaller share of the premium, 7% reported
average for non-HDHP/SO plans. When                                  program, personal health coaching, classes                            employees have a smaller deductible, and
the employer contribution to the HSA is                              in nutrition or healthy living, Web-based                             only 2% reported employees have a lower
added to the total premium, the average                              resources for healthy living, or a wellness                           coinsurance rate. Among firms offering
total cost (i.e., the total premium plus any                         newsletter. Fifty-seven percent of small                              health risk assessments, 11% report offering
firm contribution to the savings option)                             firms (3–199 workers) and 93% of large                                employees merchandise, travel, gift cards, or
for workers in HSA-qualified HDHPs is                                firms (200 or more workers) offering health                           cash for completing a health risk assessment;
lower than the total cost for the average of                         benefits offer a wellness program, up from                            27% of large firms (200 or more workers)
all non-HDHP/SO plans for both single                                88% of large firms in 2008. Firms offering                            offer this incentive, compared to 8% of small
and family coverage. In contrast, when the                           health coverage and wellness benefits report                          firms (3–199 workers).
employer contribution to the HRA is added                            that most wellness benefits (81%) are
to the total premium for HDHP/HRAs, the                              provided through the health plan rather                               OTHER TOPICS
total cost for workers in HDHP/HRAs with                             than by the firm directly.
                                                                                                                                           For the first time, the survey asked firms
single coverage is more than the total cost
                                                                                                                                           with 1,000 or more employees about the
for workers in other plans.                                          H E A LT H R I S K A S S E S S M E N T S
                                                                                                                                           availability of on-site health clinics. Among
                                                                     Sixteen percent of firms offering health                              all firms, including those that do not offer
RETIREE COVERAGE                                                     benefits give their employees the option                              coverage, 20% of firms with 1,000 or more
Twenty-nine percent of large firms (200 or                           of completing a health risk assessment to                             workers reported that they have an on-site
more workers) offer retiree health benefits                          help employees identify potential health                              health clinic for employees at one or more
in 2009, which is not statistically different                        risks (Exhibit I).5 Large firms (200 or more                          locations. Of those firms with an on-site
from the 2008 offer rate of 31%. Among                               workers) are more likely to offer a health                            health clinic, 79% reported that employees


   Exhibit i
   Among firms offering health benefits, percentage of firms That offer health risk Assessments and incentives to Complete
   Assessments, by firm size, 2009

    100%
      90%
      80%
      70%
      60%                                               55%
      50%
      40%                                                                                                                                         34%
      30%
      20%                               14%                            16%
                                                                                                                                                                 11%
      10%                                                                                                                          7%

        0%
                                 Firm O ers Health Risk Assessment *                                                 Firm O ers Financial Incentives to Complete
                                                                                                                             Health Risk Assessments * ‡
   * estimate is statistically different between all small firms and all large firms within category (p<.05).
                                                                                                                                                     All Small Firms (3–199 Workers)
   ‡ among firms offering employees the option to complete a health risk assessment.
                                                                                                                                                     All Large Firms (200 or More Workers)
    source: kaiser/hret survey of employer-sponsored health Benefits, 2009.                                                                          All Firms


                                                                                                                                                                                               7
                                                                        t h e k a i s e r fa m i ly f o u n d at i o n - a n d - h e a lt h r e s e a r C h & e d u C at i o n a l t r u s t
can receive treatment for non-work related                           to increase the amount workers contribute                        coverage, while the steady trend of increases
illness at the on-site clinic.                                       to premiums (42%), increase deductible                           in single premiums was broken. The
                                                                     amounts (36%), increase office visit cost                        percentage of workers with deductibles for
We also asked employers whether they have
                                                                     sharing (39%), or increase the amount                            single coverage of $1,000 or more increased,
reduced their benefits or increased cost sharing
                                                                     that employees have to pay for prescription                      as did the average copayments for primary
due to the economic downturn. Twenty-one
                                                                     drugs (37%). Although firms report                               or specialty physician office visits. The
percent of employers offering health benefits
                                                                     planning to increase the amount employees                        percentage of firms offering health insurance
report that, in response to the economic
                                                                     have to pay when they have insurance,                            and the percentage of workers covered by
downturn, they reduced the scope of health
                                                                     relatively few firms report they are very                        health insurance at their firm remained
benefits or increased cost sharing, and 15%
                                                                     likely (2%) or somewhat likely (6%)                              steady. The survey shows that health benefits
report they increased the employee share of
                                                                     to drop coverage. Four percent of firms                          remained relatively stable despite the severe
the premium. More large firms (200 or more
                                                                     offering coverage say that they are very                         economic downturn. As noted above, this
workers) than small firms (3–199 workers)
                                                                     likely to restrict eligibility for coverage next                 may indicate a strong commitment by
report increasing the share of the premium
                                                                     year, and an additional 5% say that they                         employers to maintaining workers’ benefits,
that the employee pays (22% vs. 15%).
                                                                     are somewhat likely to do so. Among firms                        but also could reflect the possibility that
                                                                     offering health benefits but not offering                        some employers made decisions about
OUTLOOK FOR THE FUTURE                                                                                                                health benefits before the implications of
                                                                     an HSA-qualified HDHP, 6% say that
Each year we ask employers about the                                 they are very likely and 16% say they are                        the worsening economy were fully apparent.
changes they plan to make to their health                            somewhat likely to offer an HSA-qualified                        Further, the survey only collects information
benefits in the next year. This year, given                          HDHP in the next year. A similar share                           from firms that are still in business and
the extreme uncertainties about future                                                                                                does not estimate the number of workers
                                                                     of offering firms not currently offering an
economic trends, it is likely that employers                                                                                          who lost coverage due to their company
                                                                     HDHP/HRA report that they are very
had more difficulty making predictions                                                                                                downsizing or closing. Given the ongoing
                                                                     likely (5%) or somewhat likely (15%) to
about their future health care decisions. In                                                                                          economic problems facing businesses, it will
                                                                     offer that plan type next year.
general though, employers’ responses this                                                                                             be important to monitor health benefits
year are in line with those in the last several                                                                                       offer rates and coverage levels as well as
years. Among those that offer benefits,                              CONCLUSION                                                       other plan attributes. This information
large percentages of firms report that in the                        In 2009, the survey finds premiums                               also will help inform the continuing health
next year they are very or somewhat likely                           increased only moderately for family                             reform debate.


__________________________________________________________________________________________________________________________________________________________
1 kaiser family foundation, kaiser Commission on medicaid and the uninsured, The Uninsured: A Primer, october 2008.
2 the average worker contributions include those workers with no contribution.

3 data presented are for workers with a family aggregate deductible where spending by any covered person in the family counts toward the deductible.

4 in 2009, we changed the structure of the hospital and outpatient surgery cost-sharing questions. see the introduction to section 7 for more information,
 available at www.kff.org/insurance/7936/index.cfm.
5 health risk assessments generally include questions on medical history, health status, and lifestyle.


   8
            t h e k a i s e r fa m i ly f o u n d at i o n - a n d - h e a lt h r e s e a r C h & e d u C at i o n a l t r u s t
60%

                                      $4,8 2 4
           Employer Health Benefits
$ 13,375
              2009 annual surVey


                Survey
                Design
                 and
                Methods


           2009
Survey Design and Methods
                                    Employer Health Benefits          2 0 0 9 A n n u a l s u r ve y


                                          Survey DeSign anD MethoDS


                                                 t he K aiser family f oundation and the h ealth r esearch & e ducational trust (K aiser /hret )
                                                 conduct this annual survey of employer - sponsored health benefits .                                          hret, a nonprofit research
                                                 organization , is an affiliate of the                      a merican h ospital a ssociation . t he K aiser family foundation
                                                 designs , analyzes , and conducts this survey in partnership with                                      hret, and also pays for the cost of
                                                 the survey.        hret subcontracts with researchers at n ational o pinion r esearch center (norc) at the
                                                 u niversity of c hicago, who worK with foundation and hret researchers in conducting the study.
                                                 K aiser /hret retained n ational r esearch , llc (nr), a washington , d.c.- based survey research firm ,
                                                 to conduct telephone interviews with human resource and benefits managers using the                                            K aiser /hret
                                                 survey instrument .             from J anuary to m ay 2009 nr completed full interviews with 2,054 firms .


                                                 survey TopiCs                                                                        ChANges To The 2009 survey

                                                 As in past years, Kaiser/HRET asked each                                             Each year we examine ways to improve the survey and
                                                 participating firm as many as 400 questions about                                    respond to changes in the health insurance market.
                                                 its largest health maintenance organization (HMO),                                   Throughout the past, many changes have been made
                                                 preferred provider organization (PPO), point-of-                                     in an attempt to ensure the survey reflects current
                                                 service (POS) plan, and high-deductible health                                       market trends, such as the introduction of questions on
                                                 plan with a savings option (HDHP/SO).1 In 2006,                                      emerging plan types. We also reexamine the questions
                                                 Kaiser/HRET began asking employers if they                                           asked and the analytic methods used to determine if
                                                 had a health plan that was an exclusive provider                                     there are ways to better and more accurately convey
                                                 organization (EPO). We treat EPOs and HMOs                                           the information obtained from respondents. In the
                                                 together as one plan type and report the information                                 fall of 2008, with guidance from experts in survey
                                                 under the banner of “HMO;” if an employer sponsors                                   methods and design from NORC, we reviewed the
                                                 both an HMO and an EPO, they are asked about the                                     methods used for the survey. As a result of this review,
                                                 attributes of the plan with the larger enrollment.                                   several important modifications were made to the 2009
                                                                                                                                      survey, including the sample design and questionnaire.
                                                 New topics in the 2009 survey include additional
                                                 questions on financial incentives for health risk                                    For the first time, this year we determined the sample
                                                 assessments, on-site health clinics, and firm responses                              requirements based on the universe of firms obtained
                                                 to the economic downturn. As in past years, this                                     from the U.S. Census rather than Dun and Bradstreet.
                                                 year’s survey included questions on the cost of health                               Prior to the 2009 survey, the sample requirements were
                                                 insurance, offer rates, coverage, eligibility, enrollment                            based on the total counts provided by Survey Sampling
                                                 patterns, premiums,2 employee cost sharing,                                          Incorporated (SSI) (which obtains data from Dun
                                                 prescription drug benefits, retiree health benefits, and                             and Bradstreet). Over the years, we have found the
                                                 employer opinions.                                                                   Dun and Bradstreet frequency counts to be volatile
                                                                                                                                      because of duplicate listings of firms, or firms that are


                                                          note:

                                                    1   hdhP/so includes high-deductible health plans offered with either a health reimbursement arrangement (hra) or a health
                                                        savings account (hsa). although hras can be offered along with a health plan that is not an hdhP, the survey collected
                                                        information only on hras that are offered along with hdhPs. for specific definitions of hdhPs, hras, and hsas, see the
                                                        introduction to section 8.
                                                    2   hdhP/so premium estimates do not include contributions made by the employer to health savings accounts or health
                                                        reimbursement arrangements.


                            10
                                 t h e k a i s e r fa m i ly f o u n d at i o n - a n d - h e a lt h r e s e a r C h & e d u C at i o n a l t r u s t
Survey Design and Methods
                                                                                                 Employer Health Benefits          2 0 0 9 An n u a l s u r ve y


no longer in business. These inaccuracies vary by firm                three or more workers. As in the past, the post-
size and industry. In 2003, we began using the more                   stratification is based on the most up-to-date Census
consistent and accurate counts provided by the Census                 data available (the 2006 update to the Census of U.S.
Bureau’s Statistics of U.S. Businesses and the Census                 Businesses was purchased during the survey field
of Governments as the basis for post-stratification,                  period) and the 2007 Census of Governments. The
although the sample was still drawn from a Dun and                    Census of Governments is conducted every five years,
Bradstreet list. In order to further address this concern             and this is the first year the data from the 2007 Census
at the time of sampling, we now also use Census data                  of Governments have been available for use.
as the basis for the sample. This change resulted in
                                                                      Each year, the survey asks firms for the percentage of
shifts in the sample of firms required in some size and
                                                                      their employees that earn less than a specified amount.
industry categories.
                                                                      This year, the income threshold increased from $22,000
This year, we also defined Education as a separate                    to $23,000 per year. This threshold is based on the
sampling category, rather than as a subgroup of the                   25th percentile of workers’ earnings as reported by the
Service category. In the past, Education firms were                   Bureau of Labor Statistics using data from the National
a disproportionately large share of Service firms.                    Compensation Survey (2007), the most current data
Education is controlled for during post-stratification,               available at the time of the survey design. The threshold
and adjusting the sampling frame to also control for                  was then adjusted to account for the change in workers’
Education allows for a more accurate representation of                earnings from 2007 to 2008, using the Bureau of Labor
both Education and Service industries.                                Statistics’ Employment Cost Index.

In past years, both private and government firms were                 Based on recommendations from cognitive researchers
sampled from the Dun and Bradstreet database. For                     at NORC and internal analysis of the survey instrument,
the 2009 sample, Government firms were sampled                        a number of questions were revised to improve the
in-house from the 2007 Census of Governments. This                    clarity and flow of the survey in order to minimize
change was made to eliminate the overlap of state                     survey burden. For example, in order to better capture
agencies that were frequently sampled from the Dun                    the prevalence of combinations of inpatient and
and Bradstreet database. Each year the survey attempts                outpatient surgery cost sharing, the survey was changed
to repeat interviews with respondents from past years                 to ask a series of yes or no questions. Previously, the
(see “Response Rate” section below), and in order to                  question asked respondents to select one response from a
maintain government firms that had completed the                      list of types of cost sharing, such as separate deductibles,
survey in the past (firms that have completed the survey              copayments, coinsurance, and per diem payments
in the past are known as panel firms), government firms               (for hospitalization only). We have also expanded the
from the 2008 survey were matched to the Census of                    number of questions for which respondents can provide
Governments to identify phone numbers. All panel                      either the number of workers or the percentage of
government firms were included in the sample (resulting               workers. Previously, after obtaining the total number of
in an oversample). In addition, the sample of private                 employees, the majority of questions asked about the
firms is screened for firms that are related to state/                percentage of workers with certain characteristics. Now,
local governments, and if these firms are identified in               for questions such as the percentage of workers making
the Census of Governments, they are reclassified as                   $23,000 a year or less or the enrollment of workers in
government firms and a private firm is randomly drawn                 each plan type, respondents are able to respond with
to replace the reclassified firm. These changes to the                either the number or the percentage of workers. Few
sample frame resulted in an expected slight reduction                 of these changes have had any noticeable impact on
in the overall response rate, since there were shifts in the          responses.
number of firms needed by size and industry.
                                                                      Minor weighting adjustments were also made and are
Therefore, the data used to determine the 2009                        discussed later in this chapter.
Employer Health Benefits sample frame include
                                                                      r e s p o N s e r AT e
the U.S. Census’ 2005 Statistics of U.S. Businesses
and the 2007 Census of Governments. At the time                       After determining the required sample from U.S.
of the sample design (December 2008), these data                      Census Bureau data, Kaiser/HRET drew its sample
represented the most current information on the                       from a Survey Sampling Incorporated list (based on an
number of public and private firms nationwide with                    original Dun and Bradstreet list) of the nation’s private


                                                                                                                                                                       11
                                                t h e k a i s e r fa m i ly f o u n d at i o n - a n d - h e a lt h r e s e a r C h & e d u C at i o n a l t r u s t
Survey Design and Methods
                                    Employer Health Benefits          2 0 0 9 A n n u a l s u r ve y


                                                 employers, and for the first time, the Census Bureau’s                               Exhibit M.2 displays the distribution of the nation’s
                                                 Census of Governments list of public employers                                       firms, workers, and covered workers (employees
                                                 with three or more workers. To increase precision,                                   receiving coverage from their employer). Among the
                                                 Kaiser/HRET stratified the sample by industry and                                    over three million firms nationally, approximately
                                                 the number of workers in the firm. Kaiser/HRET                                       59.5% are firms employing 3 to 9 workers; such firms
                                                 attempted to repeat interviews with prior years’ survey                              employ 8.3% of workers and 4.8% of workers covered
                                                 respondents (with at least ten employees) who also                                   by health insurance. In contrast, less than one percent
                                                 participated in either the 2007 or the 2008 survey, or                               of firms are firms employing 1,000 or more workers;
                                                 both. As a result, 1,491 firms in this year’s total sample                           these firms employ 46.8% of workers and 52.1%
                                                 of 2,054 firms participated in either the 2007, 2008, or                             of covered workers. Therefore, the smallest firms
                                                 both surveys.3 The overall response rate is 47%.                                     dominate any national statistics about what employers
                                                                                                                                      in general are doing. In contrast, firms with 1,000 or
                                                 The vast majority of questions are asked only of firms
                                                                                                                                      more workers are the most important employer group
                                                 that offer health benefits. A total of 1,874 responding
                                                                                                                                      in calculating statistics regarding covered workers,
                                                 firms indicated that they offered health benefits. The
                                                                                                                                      since they employ the largest percentage of the nation’s
                                                 overall response rate of firms that offer health benefits
                                                                                                                                      workforce.
                                                 is 48%.
                                                                                                                                      Throughout this report, we use the term “in-network”
                                                 From previous years’ experience, we have learned that
                                                                                                                                      to refer to services received from a preferred provider.
                                                 firms that decline to participate in the study are less
                                                                                                                                      Family coverage is defined as health coverage for a
                                                 likely to offer health benefits. Therefore, we asked one
                                                                                                                                      family of four.
                                                 question of all firms in the study with which we made
                                                 phone contact where the firm declined to participate.                                r o u N D i N g A N D i m p u TAT i o N
                                                 The question was, “Does your company offer a
                                                                                                                                      Some exhibits in the report do not sum to totals
                                                 health insurance program as a benefit to any of your
                                                                                                                                      due to rounding effects. In a few cases, numbers
                                                 employees?” A total of 3,188 firms responded to this
                                                                                                                                      from distribution exhibits may not add to equal
                                                 question (including 2,054 who responded to the full
                                                                                                                                      numbers referenced in the text due to rounding
                                                 survey and 1,134 who responded to this one question).
                                                                                                                                      effects. Although overall totals and totals for size and
                                                 Their responses are included in our estimates of the
                                                                                                                                      industry are statistically valid, some breakdowns may
                                                 percentage of firms offering health benefits.4 The
                                                                                                                                      not be available due to limited sample sizes. Where
                                                 response rate for this question is 73%.
                                                                                                                                      the unweighted sample size is fewer than 30, exhibits
                                                 f i r m s i z e C AT e g o r i e s A N D k e y D e f i N i T i o N s                 include the notation “NSD” (Not Sufficient Data).

                                                 Throughout the report, exhibits categorize data by size                              To control for item nonresponse bias, Kaiser/HRET
                                                 of firm, region, and industry. Firm size definitions are                             imputes values that are missing for most variables in
                                                 as follows: All Small, 3 to 199 workers; and All Large,                              the survey. In general, less than 5% of observations
                                                 200 or more workers. Occasionally, firm size categories                              are imputed for any given variable. All variables
                                                 will be broken into smaller groups. The All Small                                    are imputed following a hotdeck approach. This
                                                 group may be categorized by: 3 to 24 workers, and 25                                 imputation method does not rely on a normal
                                                 to 199 workers; or 3 to 9 workers, 10 to 24 workers, 25                              distribution assumption and replaces missing values with
                                                 to 49 workers, and 50 to 199 workers. The All Large                                  observed values from a firm with similar characteristics,
                                                 group may be categorized by: 200 to 999 workers,                                     in this case, size and industry. In 2009, there were three
                                                 1,000 to 4,999 workers, and 5,000 or more workers.                                   variables where the imputation rate exceeded 20% but
                                                 Exhibit M.1 shows selected characteristics of the survey                             was less than 30%. For these cases, the unimputed
                                                 sample. Exhibit M.3 identifies which states are in each                              variable was compared with the imputed variable and
                                                 region.                                                                              there is no statistically significant difference. There are


                                                           note:

                                                    3
                                                        in total, 185 firms participated in 2007 and 2009, 367 firms participated in 2008 and 2009, and 939 firms participated in 2007,
                                                        2008, and 2009.
                                                    4
                                                        estimates presented in exhibits 2.1, 2.2 and 2.3 are based on the sample of both firms that completed the entire survey and
                                                        those that answered just one question about whether they offer health benefits.


                            12
                                 t h e k a i s e r fa m i ly f o u n d at i o n - a n d - h e a lt h r e s e a r C h & e d u C at i o n a l t r u s t
Survey Design and Methods
                                                                                                       Employer Health Benefits          2 0 0 9 An n u a l s u r ve y


a few variables that Kaiser/HRET has decided should                         This year we created a new weight to correct for a very
not be imputed; these are typically variables where                         slight bias in our estimates of the take up rate. This
“don’t know” is considered a valid response option (for                     new weight reflects all workers in the firm who are
example, firms’ opinions about effectiveness of various                     eligible for health benefits. In the past, our estimates
strategies to control health insurance costs).                              were a function of all workers in the firm, whether they
W e i g h T i N g A N D s TAT i s T i C A l s i g N i f i C A N C e         were eligible for health benefits (and could thus take
                                                                            up) or not. Historical take-up estimates have likewise
Because Kaiser/HRET selects firms randomly, it
                                                                            been updated to reflect only those workers eligible for
is possible through the use of statistical weights to
extrapolate the results to national (as well as firm size,                  health benefits.
regional, and industry) averages. These weights allow                       We continue to ask firms whether or not they offer
Kaiser/HRET to present findings based on the number                         a conventional health plan and, if so, how many
of workers covered by health plans, the number of
                                                                            of their covered workers are enrolled in that plan
total workers, and the number of firms. In general,
                                                                            and whether it is self-funded or underwritten by an
findings in dollar amounts (such as premiums, worker
                                                                            insurer. However, due to the declining market share
contributions, and cost sharing) are weighted by
covered workers. Other estimates, such as the offer                         of conventional health plans, in 2006, we stopped
rate, are weighted by firms. Specific weights were                          asking respondents additional questions about the
created to analyze the HDHP/SO plans that are offered                       attributes of the conventional plans they offer. As of
with an HRA or that are HSA-qualified. These weights                        2009 our primary covered worker weight no longer
represent the proportion of employees enrolled in each                      includes those workers with conventional coverage.5
of these arrangements.                                                      Therefore, premium and cost-sharing levels are
Calculation of the weights follows a common                                 estimated among workers covered by an HMO, PPO,
approach. First, the basic weight is determined,                            POS plan, or HDHP/SO. Removing workers covered
followed by a nonresponse adjustment. As part of this                       by conventional health insurance from the covered
nonresponse adjustment, Kaiser/HRET conducted                               worker weight has little impact on the estimates
a small follow-up survey of those firms with 3 to 49                        reported for “All Plans,” such as the average single or
workers that refused to participate in the full survey.                     family premium. In cases where a firm offers only
We applied an additional nonresponse adjustment to                          conventional health plans, no information from that
the weight to reflect the findings of this survey.                          respondent is included in “All Plan” averages. The
Next, we trimmed the weights in order to reduce                             exception is for whether or not the plan is self-funded,
the influence of weight outliers. First, we identified                      for which we have information. For enrollment
common groups of observations. Within each group,                           statistics, we weight the statistics by all covered
we identified the median and the interquartile range of                     workers, including those in conventional insurance.
the weights and calculated the trimming cut point as the
median plus six times the interquartile range                               The survey contains a few questions on employee cost
(M + [6 * IQR]). Weight values larger than this cut                         sharing that are asked only of firms that indicate in a
point are trimmed to the cut point. In all instances, less                  previous question that they have a certain cost-sharing
than one percent of the weight values were trimmed.                         provision. For example, the copayment amount for
                                                                            prescription drugs is asked only of those that report
Finally, we applied a post-stratification adjustment.
                                                                            they have copayments for prescription drugs. Because
We used the U.S. Census Bureau’s 2006 Statistics
of U.S. Businesses as the basis for the stratification                      the composite variables (using data from across all
and the post-stratification adjustment for firms in                         plan types) are reflective of only those plans with the
the private sector, and we used the 2007 Census of                          provision, separate weights for the relevant variables
Governments as the basis for post-stratification for                        were created in order to account for the fact that not all
public sector firms.                                                        covered workers have such provisions.


         note:
  5   in 2009, 1% of covered workers are enrolled in a conventional plan.


                                                                                                                                                                             13
                                                      t h e k a i s e r fa m i ly f o u n d at i o n - a n d - h e a lt h r e s e a r C h & e d u C at i o n a l t r u s t
Survey Design and Methods
                                    Employer Health Benefits          2 0 0 9 A n n u a l s u r ve y


                                                 The data are analyzed with SUDAAN,6 which                                            h i s T o r i C A l D ATA
                                                 computes appropriate standard error estimates by                                     Data in this report focus primarily on findings
                                                 controlling for the complex design of the survey.7 All                               from surveys jointly authored by the Kaiser Family
                                                 statistical tests are performed at the .05 level, unless                             Foundation and the Health Research & Educational
                                                 otherwise noted. For figures with multiple years,                                    Trust, which have been conducted since 1999.
                                                 statistical tests are conducted for each year against                                Prior to 1999, the survey was conducted by the
                                                 the previous year shown, unless otherwise noted. No                                  Health Insurance Association of America (HIAA)
                                                 statistical tests are conducted for years prior to 1999.                             and KPMG using a similar survey instrument, but
                                                 Statistical tests for a given subgroup (firms with 25–49                             data are not available for all the intervening years.
                                                 workers, for instance) are tested against all other firm                             Following the survey’s introduction in 1987, the
                                                 sizes not included in that subgroup (all firm sizes NOT                              HIAA conducted the survey through 1990, but
                                                 including firms with 25–49 workers, in this example).                                some data are not available for analysis. KPMG
                                                 Tests are done similarly for region and industry; for                                conducted the survey from 1991–1998. However,
                                                 example, Northeast is compared to all firms NOT in                                   in 1991, 1992, 1994, and 1997, only larger firms
                                                 the Northeast (an aggregate of firms in the Midwest,                                 were sampled. In 1993, 1995, 1996, and 1998,
                                                 South, and West). However, statistical tests for estimates                           KPMG interviewed both large and small firms. In
                                                 compared across plan types (for example, average                                     1998, KPMG divested itself of its Compensation and
                                                 premiums in PPOs) are tested against the “All Plans”                                 Benefits Practice, and part of that divestiture included
                                                 estimate. In some cases, we also test plan-specific                                  donating the annual survey of health benefits to
                                                 estimates against similar estimates for other plan types                             HRET.
                                                 (for example, single and family premiums for HDHP/                                   This report uses historical data from the 1993, 1996,
                                                 SOs against single and family premiums for HMO,                                      and 1998 KPMG Surveys of Employer-Sponsored
                                                 PPO, and POS plans); these are noted specifically in the                             Health Benefits and the 1999–2008 Kaiser/HRET
                                                 text. The two types of statistical tests performed are the                           Survey of Employer-Sponsored Health Benefits.
                                                 t-test and the Pearson Chi-square test.                                              For a longer-term perspective, we also use the 1988
                                                 The small number of observations for some variables,                                 survey of the nation’s employers conducted by the
                                                 particularly variables specific to plans with Health                                 HIAA, on which the KPMG and Kaiser/HRET
                                                 Savings Accounts or Health Reimbursement                                             surveys are based. The survey designs for the three
                                                 Arrangements, resulted in large variability around the                               surveys are similar.
                                                 point estimates. These observations sometimes carry
                                                 large weights, primarily for small firms. The reader
                                                 should be cautioned that these influential weights may
                                                 result in large movements in point estimates from
                                                 year to year; however, often these movements are not
                                                 statistically significant.


                                                           note:

                                                    6
                                                        research triangle institute (2008). sudaan software for the statistical analysis of Correlated data, release 10.0, research
                                                        triangle Park, nC: research triangle institute.
                                                    7
                                                        a supplement with standard errors for select estimates can be found online at www.kff.org/insurance/7936/index.cfm.


                            14
                                 t h e k a i s e r fa m i ly f o u n d at i o n - a n d - h e a lt h r e s e a r C h & e d u C at i o n a l t r u s t
Survey Design and Methods
                                                                                                            Employer Health Benefits          2 0 0 9 An n u a l s u r ve y


e x h i B i t m .1

 s elec ted Charac teristics of firms in the sur vey sample, 2009


                                                                                                     sample distribution                    Percentage of total
                                                                     sample size
                                                                                                       after Weighting                     for Weighted sample

 firm size
   3–9 Workers                                                              117                               2,028,692                                  59.5%
   10–24 Workers                                                            220                                  797,632                                 23.4
   25–49 Workers                                                            182                                  283,338                                   8.3
   50–199 Workers                                                           287                                  213,310                                   6.3
   200–999 Workers                                                          467                                    60,973                                  1.8
   1,000–4,999 Workers                                                      481                                    17,125                                  0.5
   5,000 or more Workers                                                    300                                      8,175                                 0.2
 All firm sizes                                                          2,054                               3,409,245                                   100%

 regioN
  northeast                                                                410                                 667,059                                   19.6%
  midwest                                                                  607                                 787,094                                   23.1
  south                                                                    688                               1,162,742                                   34.1
  West                                                                     349                                 792,350                                   23.2
 All regioNs                                                             2,054                               3,409,245                                   100%

 iNDusTry
   agriculture/mining/Construction                                         118                                 424,586                                   12.5%
   manufacturing                                                           230                                 210,368                                    6.2
   transportation/Communications/utilities                                 114                                 128,897                                    3.8
   Wholesale                                                                99                                 195,346                                    5.7
   retail                                                                  157                                 432,820                                   12.7
   finance                                                                 136                                 238,426                                    7.0
   service                                                                 842                               1,453,808                                   42.6
   state/local Government                                                  151                                  50,587                                    1.5
   health Care                                                             207                                 274,408                                    8.0
 All iNDusTries                                                          2,054                               3,409,245                                   100%


                     source:

              kaiser/hret survey of employer-sponsored health Benefits, 2009.


                                                                                                                                                                                  15
                                                           t h e k a i s e r fa m i ly f o u n d at i o n - a n d - h e a lt h r e s e a r C h & e d u C at i o n a l t r u s t
Survey Design and Methods
                                    Employer Health Benefits          2 0 0 9 A n n u a l s u r ve y


                                    exhiBit m.2

                                     distr ibution of employers, Workers, and Wor kers Covered by health B enefits, by fir m size, 2009


                                          100%
                                                                          0.2%                    0.5%
                                                                                                  1.8%
                                                                          6.3%
                                           90%
                                                                          8.3%

                                           80%
                                                                                                                                   34.2%                    37.7%

                                                                         23.4%
                                           70%


                                           60%                                                                                     12.6%
                                                                                                                                                            14.4%
                                           50%
                                                                                                                                   13.5%
                                           40%                                                                                                              14.5%

                                                                                                                                   14.2%
                                           30%                           59.5%
                                                                                                                                                            14.4%
                                           20%                                                                                      7.6%
                                                                                                                                                            7.1%
                                                                                                                                    9.5%
                                           10%
                                                                                                                                                            7.1%
                                                                                                                                    8.3%
                                                                                                                                                            4.8%
                                             0%
                                                                       EMPLOYERS                                                  WORKERS               COVERED WORKERS


                                                          source:
                                                                                                                                                                5,000 OR MORE WORKERS
                                                    kaiser/hret survey of employer-sponsored health Benefits, 2009.
                                                                                                                                                                1,000 4,999 WORKERS

                                                  note: data are based on a special data request to the u.s. Census Bureau for their most recent                200 999 WORKERS
                                                  (2006) statistics of u.s. Businesses data on private sector firms. state and local government data            50 199 WORKERS
                                                  are from the Census Bureau’s 2007 Census of Governments.                                                      25 49 WORKERS
                                                                                                                                                                10 24 WORKERS
                                                                                                                                                                3 9 WORKERS


                            16
                                 t h e k a i s e r fa m i ly f o u n d at i o n - a n d - h e a lt h r e s e a r C h & e d u C at i o n a l t r u s t
Survey Design and Methods
                                                                                                            Employer Health Benefits          2 0 0 9 An n u a l s u r ve y


e x h i B i t m .3

 states by r egion, 2009


           Northeast                             midwest                                         south                                             West
          Connecticut                              illinois                                    alabama                                            alaska
              maine                               indiana                                      arkansas                                          arizona
        massachusetts                               iowa                                       delaware                                        California
       new hampshire                               kansas                             district of Columbia                                      Colorado
          new Jersey                             michigan                                        florida                                          hawaii
            new york                            minnesota                                       Georgia                                           idaho
         Pennsylvania                             missouri                                     kentucky                                         montana
         rhode island                            nebraska                                      louisiana                                         nevada
            Vermont                           north dakota                                     maryland                                      new mexico
                                                    ohio                                      mississippi                                        oregon
                                              south dakota                                 north Carolina                                          utah
                                                 Wisconsin                                    oklahoma                                       Washington
                                                                                          south Carolina                                       Wyoming
                                                                                              tennessee
                                                                                                  texas
                                                                                                Virginia
                                                                                            West Virginia


             source:

        u.s. department of Commerce, economics and statistics administration, u.s. Census Bureau,
        available at http://www.census.gov/geo/www/us_regdiv.pdf.


                                                                                                                                                                                  17
                                                           t h e k a i s e r fa m i ly f o u n d at i o n - a n d - h e a lt h r e s e a r C h & e d u C at i o n a l t r u s t
60%

                                      $4,8 2 4
           Employer Health Benefits
$ 13,375
              2009 annual surVey


                Cost of
                Health
               Insurance

                 section


                     1


           2009
section one
                                       Employer Health Benefits          2 0 0 9 A n n u a l s u r ve y


                           1                C o S t o f h e a lt h i n S u r a n C e
Cost of Health Insurance


                                                    T he    average annual premium for single coverage in                            2009     is   $4,824   and The average annual premium for

                                                    family coverage is            $13,375. T he           average family premium in                2009    is abouT   5%   higher Than in   2008. T he
                                                    average premium for single coverage is noT significanTly differenT from lasT year                                        ($4,704).

                                                    s maller     firms     (3–199      workers ) have a lower average family premium                           ($12,696)     Than larger firms   (200
                                                    or more workers )           ($13,704).


                                                    premium CosTs for siNgle                                                                       workers in firms with union employees compared
                                                    A N D fA m i ly C o v e r A g e                                                                to firms without any union employees.
                                                      The average cost of premiums for single coverage in                                       Covered workers in firms where 35% or more
                                                        2009 is $402 per month or $4,824 per year (Exhibit                                         of workers are age 26 or younger have lower
                                                        1.1). The average cost of premiums for family                                              average single and family premiums than covered
                                                        coverage is $1,115 per month or $13,375 per year                                           workers in firms with a lower percentage of
                                                        (Exhibit 1.1).                                                                             workers age 26 or younger (Exhibits 1.5 and 1.6).
                                                      The average premiums for covered workers in                                               Average family premiums are higher for covered
                                                        HDHP/SOs are lower for single and family                                                   workers in partially or fully self-funded plans
                                                        coverage than the overall average premiums for                                             than in fully insured plans ($13,588 vs. $13,092).
                                                        covered workers (Exhibit 1.1).                                                             This difference, however, largely reflects premium
                                                      The average premium for family coverage for                                                differences between large and small firms more
                                                        covered workers in small firms (3–199 workers) is                                          generally. Among large firms (200 or more
                                                        lower than the average premium for workers in large                                        workers), where most firms self-fund their
                                                        firms (200 or more workers) (Exhibit 1.2). The                                             health benefits, there is no significant difference
                                                        average single premiums are similar for covered                                            in family premiums for workers in firms that
                                                        workers in small and large firms.                                                          are self-funded and workers in firms that have
                                                                                                                                                   insured benefits (Exhibit 1.6).
                                                      Average single and family premiums for covered
                                                                                                                                            There is a great deal of variation above and below
                                                        workers in the Northeast are higher than the average
                                                        premiums for covered workers in other regions                                         the average premiums for both single and family
                                                        (Exhibit 1.3).                                                                        coverage.

                                                      Premiums also vary by plan funding and workforce                                          Eighteen percent of covered workers are
                                                        attributes.                                                                                employed by firms that have a single premium
                                                                                                                                                   that is at least 20% higher than the average
                                                           Covered workers in firms where less than 35% of                                        single premium of $4,824, while 23% of covered
                                                            workers earn $23,000 or less annually have higher                                      workers are in firms that have a single premium
                                                            average single premiums than covered workers in                                        that is less than 80% of than the average single
                                                            firms with a higher percentage of workers earning                                      premium (Exhibit 1.7 and 1.8).
                                                            $23,000 or less annually (Exhibit 1.5).
                                                                                                                                                  For family coverage, 20% of covered workers are
                                                           Average single and family premiums are higher                                          employed in a firm that has a family premium
                                                            for covered workers in firms with at least some                                        that is at least 20% higher than the average
                                                            union workers than for covered workers in firms                                        family premium of $13,375, while 21% of
                                                            with no union employees (Exhibit 1.5 and 1.6).                                         covered workers are in firms that have a family
                                                            However, when broken out by firm size, there is                                        premium that is less than 80% of the average
                                                            no longer a significant difference in premiums for                                     family premium (Exhibit 1.7 and 1.8).


                               20
                                    t h e k a i s e r fa m i ly f o u n d at i o n - a n d - h e a lt h r e s e a r C h  e d u C at i o n a l t r u s t
section one
                                                                                                     Employer Health Benefits          2 0 0 9 An n u a l s u r ve y


                                                                                                                                                                                1


                                                                                                                                                                                Cost of Health Insurance
 
  The survey asks employers to provide information                           For the second year in a row, the average annual
  about their largest plan of each plan type (i.e.,                            family premium for covered workers in small firms
  HMO, PPO, POS, HDHP/SO) that they offer.                                     (3–199 workers) is significantly lower than the
  We ask employers to tell us whether the plans that                           average annual family premium for covered workers
  they were reporting on were also offered last year.                          in large firms (200 or more workers). The average
  For firms that report that they offered the same plan                        family premiums for covered workers in small and
  last year, we are not able to say whether that plan                          large firms have been similar in most other earlier
  was their largest plan of that plan type last year. We                       years (Exhibit 1.13).
  also do not ask whether they modified the benefits
                                                                                  The average family premiums for covered workers
  within the plan between last year and this year.
                                                                                   in small and large firms have grown at similar
        Workers in firms offering a PPO plan that the                             rates between 2004 and 2009 (30% in small
         firm did not offer last year had lower premiums                           firms vs. 36% in large firms) and between 1999
         on average for single and family coverage than                            and 2009 (123% in small firms vs. 134% in large
         workers in firms that report offering the same                            firms) (Exhibit 1.14).
         PPO plan last year. Premiums for HMO show a
                                                                                  For large firms (200 or more workers), the
         similar pattern for single coverage (Exhibit 1.11).
                                                                                   average family premium for covered workers in
premium ChANges over Time                                                          firms that fully or partially self-fund has grown
                                                                                   at similar rates from 2004 to 2009 (37% in self-
 
  The average family premium in 2009 ($13,375) is
                                                                                   funded firms vs. 36% in fully insured firms)
  about 5% higher than the average family premium
                                                                                   and between 1999 and 2009 (132% in self-
  we reported last year ($12,680).1 The difference
                                                                                   funded firms vs. 140% in fully insured firms)
  in reported average single premiums for 2008
                                                                                   (Exhibit 1.15).
  and 2009 ($4,704 and $4,824) is not statistically
  significant.

        The $13,375 average annual family premium
         in 2009 is 34% higher than the average family
         premium in 2004 and 131% higher than the
         average family premium in 1999 (Exhibit 1.12).


         noTe:

 1    the difference between the 2008 and 2009 premium value for family coverage is statistically significant (p.05).


                                                                                                                                                                           21
                                                    t h e k a i s e r fa m i ly f o u n d at i o n - a n d - h e a lt h r e s e a r C h  e d u C at i o n a l t r u s t
section one
                                       Employer Health Benefits          2 0 0 9 A n n u a l s u r ve y


                                         e x h i B i t 1. 1

                                         average m onthly and annual Premiums for Covered Wor kers, single and family Coverage, by Plan
                           1             type, 2009
Cost of Health Insurance


                                                                                                                                            monthly        annual

                                        hmo
                                           single Coverage                                                                                       $406       $4,878
                                           family Coverage                                                                                    $1,123       $13,470

                                        ppo
                                           single Coverage                                                                                       $410       $4,922
                                           family Coverage                                                                                    $1,143       $13,719

                                        pos
                                         single Coverage                                                                                       $403         $4,835
                                         family Coverage                                                                                      $1,090       $13,075

                                        hDhp/so
                                           single Coverage                                                                                       $332*      $3,986*
                                           family Coverage                                                                                       $924*     $11,083*

                                        All plANs
                                         single Coverage                                                                                       $402         $4,824
                                         family Coverage                                                                                      $1,115       $13,375


                                                              source:

                                                       kaiser/hret survey of employer-sponsored health Benefits, 2009.

                                                    * estimate is statistically different from all Plans estimate (p.05).


                               22
                                    t h e k a i s e r fa m i ly f o u n d at i o n - a n d - h e a lt h r e s e a r C h  e d u C at i o n a l t r u s t
section one
                                                                                                              Employer Health Benefits          2 0 0 9 An n u a l s u r ve y


e x h i B i t 1.2

average m onthly and annual Premiums for Covered Wor kers, by Plan type and fir m size, 2009
                                                                                                                                                                                         1


                                                                                                                                                                                         Cost of Health Insurance
                                                                              monthly                                                        annual

                                                          single Coverage              family Coverage                single Coverage                family Coverage

hmo
  all small firms (3–199 Workers)                                 $378                         $1,021*                       $4,542                        $12,256*
  all large firms (200 or more Workers)                             417                         1,158*                         5,003                         13,893*
All firm sizes                                                    $406                        $1,123                        $4,878                        $13,470

ppo
  all small firms (3–199 Workers)                                 $412                        $1,116                         $4,948                        $13,392
  all large firms (200 or more Workers)                             409                         1,154                          4,913                         13,844
All firm sizes                                                    $410                        $1,143                        $4,922                        $13,719

pos
 all small firms (3–199 Workers)                                  $402                        $1,071                        $4,824                        $12,847
 all large firms (200 or more Workers)                             404                         1,120                         4,853                         13,439
All firm sizes                                                    $403                        $1,090                        $4,835                        $13,075

hDhp/so
  all small firms (3–199 Workers)                                 $323                           $855*                       $3,877                        $10,259*
 all large firms (200 or more Workers)                             341                            990*                       4,094                         11,885*
All firm sizes                                                    $332                           $924                       $3,986                        $11,083

All plANs
 all small firms (3–199 Workers)                                  $393                        $1,058*                       $4,717                        $12,696*
 all large firms (200 or more Workers)                             406                         1,142*                        4,876                         13,704*
All firm sizes                                                    $402                        $1,115                        $4,824                        $13,375


                    source:

            kaiser/hret survey of employer-sponsored health Benefits, 2009.

         * estimates are statistically different within plan type between all small firms and all large firms (p.05).


                                                                                                                                                                                    23
                                                             t h e k a i s e r fa m i ly f o u n d at i o n - a n d - h e a lt h r e s e a r C h  e d u C at i o n a l t r u s t
section one
                                       Employer Health Benefits          2 0 0 9 A n n u a l s u r ve y


                                         e x h i B i t 1. 3

                                         average m onthly and annual Premiums for Covered Wor kers, by Plan type and r egion, 2009
                           1
Cost of Health Insurance


                                                                                                                                    monthly                                     annual

                                                                                                              single Coverage                family Coverage      single Coverage   family Coverage

                                        hmo
                                           northeast                                                                    $422                         $1,166           $5,070             $13,987
                                           midwest                                                                        417                          1,174           5,008              14,086
                                           south                                                                          401                          1,125           4,816              13,502
                                           West                                                                           396                          1,070           4,758              12,843
                                        All regioNs                                                                     $406                        $1,123            $4,878             $13,470

                                        ppo
                                         northeast                                                                      $421                        $1,202*           $5,057             $14,420*
                                         midwest                                                                         420                         1,172             5,039              14,062
                                         south                                                                           395*                        1,109*            4,738*             13,311*
                                         West                                                                            419                         1,116             5,028              13,392
                                        All regioNs                                                                     $410                        $1,143            $4,922             $13,719

                                        pos
                                         northeast                                                                      $414                        $1,173            $4,963             $14,075
                                         midwest                                                                         385                         1,040             4,625              12,480
                                         south                                                                           417                         1,077             5,009              12,927
                                         West                                                                            384                         1,077             4,614              12,925
                                        All regioNs                                                                     $403                        $1,090            $4,835             $13,075

                                        hDhp/so
                                         northeast                                                                      $328                               $909       $3,941             $10,905
                                         midwest                                                                         321                                915        3,851              10,980
                                         south                                                                           347                                976        4,161              11,718
                                         West                                                                            333                                872        3,996              10,467
                                        All regioNs                                                                     $332                               $924       $3,986             $11,083

                                        All plANs
                                         northeast                                                                      $416*                       $1,174*           $4,989*            $14,084*
                                         midwest                                                                         403                         1,125             4,834              13,498
                                         south                                                                           395                         1,099             4,740              13,193
                                         West                                                                            401                         1,076             4,808              12,915
                                        All regioNs                                                                     $402                        $1,115            $4,824             $13,375


                                                              source:

                                                       kaiser/hret survey of employer-sponsored health Benefits, 2009.

                                                    * estimate is statistically different within plan type from estimate for all firms not in the indicated region (p.05).


                               24
                                    t h e k a i s e r fa m i ly f o u n d at i o n - a n d - h e a lt h r e s e a r C h  e d u C at i o n a l t r u s t
section one
                                                                                       Employer Health Benefits          2 0 0 9 An n u a l s u r ve y


e x h i B i t 1.4

average m onthly and annual Premiums for Covered Wor kers, by Plan type and i ndustr y, 2009
                                                                                                                                                                  1


                                                                                                                                                                  Cost of Health Insurance
                                                       monthly                                                        annual

                                    single Coverage             family Coverage                single Coverage                family Coverage

hmo
 agriculture/mining/Construction           nsd                            nsd                            nsd                           nsd
 manufacturing                             $359*                        $1,026*                        $4,311*                      $12,310*
 transportation/Communications/
                                             427                          1,132                          5,129                        13,582
   utilities
 Wholesale                                  nsd                           nsd                            nsd                          nsd
 retail                                     359*                         1,025                          4,310*                      12,302
 finance                                    373*                         1,103                          4,472*                      13,242
 service                                    425                          1,156                          5,105                       13,873
 state/local Government                     447*                         1,157                          5,365*                      13,880
 health Care                                440*                         1,219                          5,275*                      14,623
All iNDusTries                             $406                         $1,123                         $4,878                      $13,470

ppo
 agriculture/mining/Construction           $376                         $1,059*                        $4,510                       $12,706*
 manufacturing                              367*                         1,066*                         4,406*                       12,792*
 transportation/Communications/
                                             385                          1,091                          4,617                        13,096
   utilities
 Wholesale                                  391                          1,127                          4,687                       13,521
 retail                                     380*                         1,069*                         4,557*                      12,825*
 finance                                    422                          1,181                          5,064                       14,166
 service                                    422                          1,173                          5,064                       14,070
 state/local Government                     456*                         1,158                          5,469*                      13,891
 health Care                                477*                         1,297*                         5,720*                      15,563*
All iNDusTries                             $410                         $1,143                         $4,922                      $13,719

pos
 agriculture/mining/Construction           nsd                            nsd                            nsd                           nsd
 manufacturing                             $404                         $1,062                         $4,853                       $12,740
 transportation/Communications/
                                            nsd                             nsd                            nsd                            nsd
   utilities
 Wholesale                                  nsd                           nsd                            nsd                          nsd
 retail                                     nsd                           nsd                            nsd                          nsd
 finance                                    nsd                           nsd                            nsd                          nsd
 service                                    427                          1,098                          5,120                       13,179
 state/local Government                     nsd                           nsd                            nsd                          nsd
 health Care                                423                          1,127                          5,081                       13,523
All iNDusTries                             $403                         $1,090                         $4,835                      $13,075

                                                                                                                     Continued on next page


                                                                                                                                                             25
                                      t h e k a i s e r fa m i ly f o u n d at i o n - a n d - h e a lt h r e s e a r C h  e d u C at i o n a l t r u s t
section one
                                       Employer Health Benefits          2 0 0 9 A n n u a l s u r ve y


                                        e x h i B i t 1. 4         Continued from previous page

                                        average m onthly and annual Premiums for Covered Wor kers, by Plan type and i ndustr y, 2009
                           1
Cost of Health Insurance


                                                                                                                                    monthly                                      annual

                                                                                                              single Coverage                family Coverage       single Coverage   family Coverage

                                        hDhp/so
                                         agriculture/mining/Construction                                                nsd                                nsd           nsd                 nsd
                                         manufacturing                                                                  $292*                              $836*       $3,505*            $10,037*
                                         transportation/Communications/
                                                                                                                         nsd                               nsd           nsd                 nsd
                                           utilities
                                         Wholesale                                                                       nsd                            nsd              nsd                 nsd
                                         retail                                                                          nsd                            nsd              nsd                 nsd
                                         finance                                                                         321                             921            3,851              11,051
                                         service                                                                         351*                          1,005*           4,213*             12,060*
                                         state/local Government                                                          nsd                            nsd              nsd                 nsd
                                         health Care                                                                     374*                            990            4,484*             11,880
                                        All iNDusTries                                                                  $332                           $924            $3,986             $11,083

                                        All plANs
                                         agriculture/mining/Construction                                                $356*                        $1,035*           $4,266*            $12,417*
                                         manufacturing                                                                   361*                         1,037*            4,336*             12,441*
                                         transportation/Communications/
                                                                                                                          395                          1,102            4,740              13,228
                                           utilities
                                         Wholesale                                                                       375*                        1,080              4,505*             12,956
                                         retail                                                                          366*                        1,020*             4,393*             12,238*
                                         finance                                                                         401                         1,134              4,811              13,605
                                         service                                                                         417*                        1,146*             5,005*             13,753*
                                         state/local Government                                                          448*                        1,144              5,378*             13,732
                                         health Care                                                                     455*                        1,240*             5,464*             14,880*
                                        All iNDusTries                                                                  $402                        $1,115             $4,824             $13,375


                                                             source:

                                                       kaiser/hret survey of employer-sponsored health Benefits, 2009.

                                                    * estimate is statistically different within plan type from estimate for all firms not in the indicated industry (p.05).
                                                    nsd: not sufficient data.


                               26
                                    t h e k a i s e r fa m i ly f o u n d at i o n - a n d - h e a lt h r e s e a r C h  e d u C at i o n a l t r u s t
section one
                                                                                                               Employer Health Benefits          2 0 0 9 An n u a l s u r ve y


e x h i B i t 1.5

average annual Premiums for Covered Wor kers with single Coverage, by fir m Charac ter istics, 2009
                                                                                                                                                                                          1


                                                                                                                                                                                          Cost of Health Insurance
                                                                                                                        all large firms
                                                                                         all small firms
                                                                                                                         (200 or more                       all firms
                                                                                        (3–199 Workers)
                                                                                                                            Workers)

Wage level
 few Workers are lower-Wage (less than 35% earn                                                $4,799*                         $4,880                         $4,853*
  $23,000 a year or less)
 many Workers are lower-Wage (35% or more earn                                                 $4,264*                          $4,851                        $4,639*
   $23,000 a year or less)

unions
  firm has at least some union Workers                                                         $5,076                          $4,959                         $4,969*
  firm does not have any union Workers                                                         $4,685                          $4,802                         $4,748*

Age
 less than 35% of Workers are 26 years old or less                                             $4,776*                         $4,907*                        $4,864*
 35% or more Workers are 26 years old or less                                                  $4,034*                         $4,500*                        $4,342*

funding Arrangement
  fully insured                                                                                $4,690                          $4,992                         $4,796
  self-funded                                                                                  $4,869                          $4,842                         $4,845


                    source:

            kaiser/hret survey of employer-sponsored health Benefits, 2009.

         * estimates are statistically different from each other within firm size category (p.05).


                                                                                                                                                                                     27
                                                              t h e k a i s e r fa m i ly f o u n d at i o n - a n d - h e a lt h r e s e a r C h  e d u C at i o n a l t r u s t
section one
                                       Employer Health Benefits          2 0 0 9 A n n u a l s u r ve y


                                         e x h i B i t 1. 6

                                         average annual Premiums for Covered Workers with family Coverage, by firm Characteristics, 2009
                           1
Cost of Health Insurance


                                                                                                                                                                all large firms
                                                                                                                                              all small firms
                                                                                                                                                                 (200 or more     all firms
                                                                                                                                             (3–199 Workers)
                                                                                                                                                                    Workers)

                                        Wage level
                                         few Workers are lower-Wage (less than 35% earn                                                             $12,802        $13,734        $13,434
                                          $23,000 a year or less)
                                         many Workers are lower-Wage (35% or more earn                                                              $12,097        $13,509        $13,011
                                           $23,000 a year or less)

                                        unions
                                           firm has at least some union Workers                                                                     $13,434        $13,915        $13,878*
                                           firm does not have any union Workers                                                                     $12,630        $13,514        $13,110*

                                        Age
                                         less than 35% of Workers are 26 years old or less                                                          $12,879*       $13,754        $13,470*
                                         35% or more Workers are 26 years old or less                                                               $10,620*       $13,089        $12,248*

                                        funding Arrangement
                                           fully insured                                                                                            $12,661        $13,870        $13,092*
                                           self-funded                                                                                              $12,888        $13,655        $13,588*


                                                              source:

                                                       kaiser/hret survey of employer-sponsored health Benefits, 2009.

                                                    * estimates are statistically different from each other within firm size category (p.05).


                               28
                                    t h e k a i s e r fa m i ly f o u n d at i o n - a n d - h e a lt h r e s e a r C h  e d u C at i o n a l t r u s t
section one
                                                                                                              Employer Health Benefits          2 0 0 9 An n u a l s u r ve y


 e x h i B i t 1.7

 distr ibution of annual Premiums for single and family Coverage r elative to the average annual
 single or family Premium, 2009                                                                                                                                                          1


                                                                                                                                                                                         Cost of Health Insurance
Single Coverage                23%                     15%                       19%                      13%                 13%                     18%


                            $3,859                                                           $4,824                                              =$5,788


     Family Coverage               21%                    16%                     14%                     17%                   12%                      20%


                               $10,700                                                   $13,375                                                    =$16,050


                                LESS THAN 80% OF AVERAGE                              AVERAGE TO 110% OF AVERAGE
                                80% TO LESS THAN 90% OF AVERAGE                       GREATER THAN 110% OF AVERAGE TO 120% OF AVERAGE
                                90% TO LESS THAN AVERAGE                              GREATER THAN 120% OF AVERAGE


                     source:

             kaiser/hret survey of employer-sponsored health Benefits, 2009.


 e x h i B i t 1.8

 distr ibution of Premiums for single and family Coverage r elative to the average annual single or
 family Premium, 2009


                          single Coverage                                                                          family Coverage
       Premium range,                        Percent Covered                               Premium range,                                  Percent Covered
        dollar amount                        Workers in range                               dollar amount                                  Workers in range
       less than $3,859                              23%                                  less than $10,700                                           21%
      $3,859 to $4,341                              15%                                $10,700 to $12,038                                           16%
      $4,341 to $4,824                              19%                                $12,038 to $13,375                                           14%
      $4,824 to $5,306                              13%                                $13,375 to $14,713                                           17%
      $5,306 to $5,788                              13%                                $14,713 to $16,050                                           12%
        $5,788 or more                               18%                                    $16,050 or more                                           20%


                     source:

             kaiser/hret survey of employer-sponsored health Benefits, 2009.

          note: the average premium is $4,824 for single coverage and $13,375 for family coverage. the premium distribution is
          relative to the average single or family premium. for example, $3,859 is 80% of the average single premium, $4,341 is
          90% of the average single premium, $5,306 is 110% of the average single premium, and $5,788 is 120% of the average
          single premium. the same break points relative to the average are used for the distribution for family coverage.


                                                                                                                                                                                    29
                                                             t h e k a i s e r fa m i ly f o u n d at i o n - a n d - h e a lt h r e s e a r C h  e d u C at i o n a l t r u s t
section one
                                       Employer Health Benefits          2 0 0 9 A n n u a l s u r ve y


                                        e x h i B i t 1. 9

                                        distr ibution of annual Premiums for Covered Wor kers with single Coverage, 2009
                           1
Cost of Health Insurance


                                                Percent of Covered Workers:
                                          50%
                                                                                                                         Average: $4,824

                                          40%

                                                                                                                                  34%

                                          30%

                                                                                                                                                     24%
                                                                                                               22%
                                          20%


                                                                                                                                                              10%
                                          10%

                                                                                             5%
                                                                                                                                                                         3%       2%
                                                       1%                 1%
                                           0%
                                                    LESS THAN            $1,000            $2,000             $3,000             $4,000             $5,000   $6,000    $7,000     $8,000
                                                      $1,000             $1,999            $2,999             $3,999             $4,999             $5,999   $6,999    $7,999    OR MORE


                                                             source:

                                                        kaiser/hret survey of employer-sponsored health Benefits, 2009.


                                       e x h i B i t 1. 10

                                        distr ibution of annual Premiums for Covered Wor kers with family Coverage, 2009


                                                Percent of Covered Workers:
                                         50%


                                                                                                                        Average: $13,375
                                         40%


                                         30%


                                                                                                               22%                22%                21%
                                         20%


                                                                                                                                                              12%
                                                                                             10%
                                         10%

                                                                           4%                                                                                            5%       4%
                                                        1%
                                          0%
                                                    LESS THAN            $6,000            $8,000             $10,000           $12,000            $14,000   $16,000   $18,000   $20,000
                                                      $6,000             $7,999            $9,999             $11,999           $13,999            $15,999   $17,999   $19,999   OR MORE


                                                             source:

                                                       kaiser/hret survey of employer-sponsored health Benefits, 2009.


                               30
                                    t h e k a i s e r fa m i ly f o u n d at i o n - a n d - h e a lt h r e s e a r C h  e d u C at i o n a l t r u s t
section one
                                                                                                                Employer Health Benefits          2 0 0 9 An n u a l s u r ve y


e x h i B i t 1.1 1

 average annual Premiums for single and family Coverage, by Whether or not fir m o ffered the
 same Plan last year and by firm size, 2009                                                                                                                                                1


                                                                                                                                                                                           Cost of Health Insurance
                                                                                               offered                                       did not offer
                                                                                          same Plan last year                              same Plan last year

 hmo
  single Coverage
     all small firms (3–199 Workers)                                                                  $4,615                                            nsd
     all large firms (200 or more Workers)                                                             5,021                                          $4,573
    All firm sizes, single*                                                                           $4,929                                          $4,393
  family Coverage
     all small firms (3–199 Workers)                                                               $12,054                                             nsd
     all large firms (200 or more Workers)                                                          13,926                                          $13,092
    All firm sizes, family                                                                         $13,531                                          $12,907

 ppo
  single Coverage
     all small firms (3–199 Workers)*                                                                 $5,126                                          $3,921
     all large firms (200 or more Workers)                                                             4,901                                           5,227
    All firm sizes, single*                                                                           $4,958                                          $4,424
  family Coverage
     all small firms (3–199 Workers)*                                                              $13,764                                          $11,258
     all large firms (200 or more Workers)                                                          13,804                                           14,919
    All firm sizes, family*                                                                        $13,794                                          $12,671

 pos
  single Coverage
     all small firms (3–199 Workers)                                                                  $4,912                                              nsd
     all large firms (200 or more Workers)                                                             4,862                                              nsd
    All firm sizes, single                                                                            $4,891                                              NsD
  family Coverage
     all small firms (3–199 Workers)                                                               $13,188                                                nsd
     all large firms (200 or more Workers)                                                          13,389                                                nsd
    All firm sizes, family                                                                         $13,270                                                NsD

 hDhp/so
  single Coverage
     all small firms (3–199 Workers)                                                                  $3,727                                          $4,223
     all large firms (200 or more Workers)                                                             4,089                                           4,122
    All firm sizes, single                                                                            $3,928                                          $4,190
  family Coverage
     all small firms (3–199 Workers)*                                                               $9,714                                          $11,588
     all large firms (200 or more Workers)                                                          11,880                                           11,915
    All firm sizes, family                                                                         $10,917                                          $11,695

                      source:

              kaiser/hret survey of employer-sponsored health Benefits, 2009.


           * estimates are statistically different between firms that offered the same plan last year and those that did not offer the same plan last
             year within the indicated size category (p.05).
           note: We asked employers to tell us whether the plans that they were reporting on also were offered last year. if they offered the same
           plan last year, we do not ask whether they modified the benefits within the plan between last year and this year.
                                                                                                                                                                                      31
                                                               t h e k a i s e r fa m i ly f o u n d at i o n - a n d - h e a lt h r e s e a r C h  e d u C at i o n a l t r u s t
section one
                                       Employer Health Benefits          2 0 0 9 A n n u a l s u r ve y


                                       e x h i B i t 1. 12

                                        average annual Premiums for single and family Coverage, 1999–2009
                           1
Cost of Health Insurance


                                                                         $2,196
                                        1999
                                                                                                                 $5,791
                                                                            $2,471*
                                        2000
                                                                                                                        $6,438*
                                                                               $2,689*
                                        2001
                                                                                                                               $7,061*
                                                                                   $3,083*
                                        2002
                                                                                                                                         $8,003*
                                                                                       $3,383*
                                        2003
                                                                                                                                                     $9,068*
                                                                                          $3,695*
                                        2004
                                                                                                                                                              $9,950*
                                                                                             $4,024*
                                        2005
                                                                                                                                                                     $10,880*
                                                                                                 $4,242*
                                        2006
                                                                                                                                                                        $11,480*
                                                                                                  $4,479*
                                        2007
                                                                                                                                                                             $12,106*
                                                                                                     $4,704*
                                        2008
                                                                                                                                                                                  $12,680*

                                        2009
                                                                                                      $4,824
                                                                                                                                                                                      $13,375*

                                               $0                 $2,000                $4,000                $6,000                $8,000                 $10,000      $12,000         $14,000         $16,000


                                                             source:
                                                                                                                                                                                             SINGLE COVERAGE
                                                       kaiser/hret survey of employer-sponsored health Benefits, 1999–2009.                                                                  FAMILY COVERAGE


                                                    * estimate is statistically different from estimate for the previous year shown (p.05).


                               32
                                    t h e k a i s e r fa m i ly f o u n d at i o n - a n d - h e a lt h r e s e a r C h  e d u C at i o n a l t r u s t
section one
                                                                                                                 Employer Health Benefits          2 0 0 9 An n u a l s u r ve y


e x h i B i t 1.1 3

average annual Premiums for Covered Wor kers with family Coverage, by fir m size, 1999–2009
                                                                                                                                                                                            1


                                                                                                                                                                                            Cost of Health Insurance
                                                           all small firms (3–199 Workers)                            all large firms (200 or more Workers)
                       1999                                                   $5,683                                                          $5,845
                       2000                                                   $6,521                                                          $6,395
                       2001                                                   $6,959                                                          $7,113
                       2002*                                                  $7,781                                                          $8,109
                       2003                                                   $8,946                                                          $9,127
                       2004                                                   $9,737                                                         $10,046
                       2005*                                                 $10,587                                                         $11,025
                       2006                                                  $11,306                                                         $11,575
                       2007                                                  $11,835                                                         $12,233
                       2008*                                                 $12,091                                                         $12,973
                       2009*                                                 $12,696                                                         $13,704

                      source:

             kaiser/hret survey of employer-sponsored health Benefits, 1999–2009.

           * estimate is statistically different between all small firms and all large firms within year (p.05).


e x h i B i t 1.1 4

average annual Premiums for Covered Wor kers with family Coverage, by fir m size, 1999–2009


$16,000


                                                                                                                                                                  $13,704*
$14,000
                                                                                                                                                  $12,973*
                                                                                                                                  $12,233*
                                                                                                                  $11,575*
$12,000
                                                                                                  $11,025*                                                         $12,696
                                                                                                                                                   $12,091
                                                                                  $10,046*                                        $11,835
                                                                                                                  $11,306*
$10,000
                                                                   $9,127*                        $10,587*
                                                      $8,109*                      $9,737*
  $8,000                                $7,113*                    $8,946*
                          $6,395*                    $7,781*
             $5,845
  $6,000
                                       $6,959*
                         $6,521*
            $5,683
  $4,000


  $2,000


      $0
               1999          2000          2001         2002          2003            2004            2005            2006           2007            2008            2009


                      source:
                                                                                                                                                   ALL SMALL FIRMS
                                                                                                                                                   3 199 WORKERS
             kaiser/hret survey of employer-sponsored health Benefits, 1999–2009.
                                                                                                                                                   ALL LARGE FIRMS
                                                                                                                                                   200 OR MORE WORKERS
           * estimate is statistically different from estimate for the previous year shown (p.05).


                                                                                                                                                                                       33
                                                                t h e k a i s e r fa m i ly f o u n d at i o n - a n d - h e a lt h r e s e a r C h  e d u C at i o n a l t r u s t
section one
                                       Employer Health Benefits          2 0 0 9 A n n u a l s u r ve y


                                       e x h i B i t 1. 15

                                        among Wor kers in large fir ms (200 or m ore Workers), average health i nsurance Premiums for
                           1            family Coverage, by funding arrangement, 1999–2009
Cost of Health Insurance


                                                   funding arrangement                                                     fully insured                        self-funded

                                                                 1999                                                            $5,769                           $5,896
                                                                 2000                                                            $6,315*                          $6,430*
                                                                 2001                                                            $7,169*                          $7,086*
                                                                 2002                                                            $7,950*                          $8,192*
                                                                 2003                                                            $9,070*                          $9,149*
                                                                 2004                                                          $10,217*                           $9,984*
                                                                 2005                                                          $10,870*                          $11,077*
                                                                 2006                                                          $11,222                           $11,673*
                                                                 2007                                                          $11,968*                          $12,315*
                                                                 2008                                                          $13,029*                          $12,956*
                                                                 2009                                                          $13,870*                          $13,655*


                                                             source:

                                                       kaiser/hret survey of employer-sponsored health Benefits, 1999–2009.

                                                   * estimate is statistically different from estimate for the previous year shown (p.05).
                                                   note: for definitions of self-funded and fully insured Plans, see the introduction to section 10. due to a
                                                   change in the survey questionnaire, funding status was not asked of firms with conventional plans in 2006.
                                                   therefore, conventional plan funding status is not included in this exhibit for 2006.


                               34
                                    t h e k a i s e r fa m i ly f o u n d at i o n - a n d - h e a lt h r e s e a r C h  e d u C at i o n a l t r u s t
60%

                                      $4,8 2 4
           Employer Health Benefits
$ 13,375
              2009 annual surVey


               Health
              Benefits
             Offer Rates

                 section


                     2


           2009
Employer Health Benefits          2 0 0 9 A n n u a l s u r ve y


                                              h e a lt h B e n e f i t S o f f e r r at e S
  section two


                                                   T he    percenTage of firms offering healTh benefiTs in                                 2009       is noT significanTly differenT from The

                                                   percenTage in         2008. n early           all large firms          (200     or more workers ) offer healTh benefiTs ; small firms

                                                   (3–199 workers ) are significanTly less likely To do so.

                          2                        T he offer raTe represenTs informaTion on firms ThaT are sTill in business and does noT accounT for firms
                                                   ThaT have gone ouT of business due To The economic recession .
Health Benefits Offer Rates


                                                     In 2009, sixty percent of firms offer health benefits,                                   Firms with fewer part-time workers (less than
                                                       which is not statistically different from the 63%                                         35% of employees work part-time) are also
                                                       reported in 2008 (Exhibit 2.1).                                                           significantly more likely to offer coverage to their
                                                                                                                                                 workers than firms with many part-time workers.
                                                          Ninety-eight percent of large firms (200 or
                                                                                                                                                 Among firms with fewer part-time workers, 67%
                                                           more workers) offer health benefits in 2009, not
                                                                                                                                                 offer health insurance, compared to 32% of firms
                                                           statistically different from 2008 (Exhibit 2.2).
                                                                                                                                                 with a higher percentage of part-time workers
                                                           In contrast, only 59% of small firms (3–199
                                                                                                                                                 (Exhibit 2.4).
                                                           workers) offer health benefits in 2009, also not
                                                           statistically different from the 62% reported in                                     Firms that employ at least some union workers
                                                           2008.                                                                                 are much more likely than firms without
                                                                                                                                                 union workers to offer health benefits to their
                                                          Between 1999 and 2009, the offer rate for large
                                                                                                                                                 employees. Ninety-seven percent of firms
                                                           firms (200 or more workers) has not dropped
                                                                                                                                                 with some union workers offer health benefits,
                                                           below 98%. Among small firms (3–199
                                                                                                                                                 compared to 57% of firms that do not have
                                                           workers), the offer rate has varied from a high of
                                                                                                                                                 union employees (Exhibit 2.4).
                                                           68% in 2000 to 59% in 2005, 2007 and 2009.
                                                           These variations are driven primarily by changes                                Among firms offering health benefits, relatively
                                                           in the percentages of the smallest firms (3–9                                     few offer benefits to their part-time and temporary
                                                           workers) offering health benefits.                                                workers.
                                                     Offer rates vary across different types of firms.                                        In 2009, 31% of all firms that offer health
                                                                                                                                                 benefits offer them to part-time workers (Exhibit
                                                          The smallest firms are least likely to offer health
                                                                                                                                                 2.5). Firms with 200 or more workers are
                                                           insurance. Only 46% of firms with 3 to 9
                                                                                                                                                 more likely to offer health benefits to part-time
                                                           workers offer coverage, compared to 72% of
                                                                                                                                                 employees than firms with 3 to 199 workers
                                                           firms with 10 to 24 workers, 87% of firms with
                                                                                                                                                 (48% vs. 30%).
                                                           25 to 49 workers (Exhibit 2.3), and over 95% of
                                                           firms with 50 or more employees.                                                     A very small percentage (3%) of firms offering
                                                                                                                                                 health benefits offer them to temporary workers
                                                          Firms with fewer lower-wage workers (less than
                                                                                                                                                 (Exhibit 2.6).
                                                           35% of workers earn $23,000 or less annually)
                                                           are significantly more likely to offer health                                 D o m e s T i C pA r T N e r b e N e f i T s
                                                           insurance than firms with many lower-wage
                                                                                                                                           As in the past, we asked firms if they offer health
                                                           workers (35% or more of workers earn $23,000
                                                                                                                                             benefits to opposite-sex or same-sex domestic
                                                           or less annually). Sixty-four percent of firms with
                                                                                                                                             partners. However, for the 2008 and 2009 surveys,
                                                           fewer lower-wage workers offer health benefits,
                                                                                                                                             we changed the response options because during
                                                           compared with only 39% of firms with many
                                                                                                                                             early tests of the 2008 survey, several firms noted
                                                           lower-wage workers (Exhibit 2.4).
                                                                                                                                             that they had not encountered the issue, indicating


                              36
                                   t h e k a i s e r fa m i ly f o u n d at i o n - a n d - h e a lt h r e s e a r C h  e d u C at i o n a l t r u s t
Employer Health Benefits          2 0 0 9 An n u a l s u r ve y


                                                                                                                                                                                 section two
   that the responses of “yes,” “no,” and “don’t know”                       Despite a slowing of health insurance cost growth in
   were insufficient. Therefore, last year we added the                        recent years, the cost of health insurance remains the
   response option “not applicable/not encountered” to                         primary reason cited by firms for not offering health
   better capture the number of firms that report not                          benefits.1
   having a policy on the issue.
                                                                                  Among small firms (3–199 workers) not offering                                              2
         In response to the question asking firms if they                         health benefits, 62% cite high cost as “the most


                                                                                                                                                                               Health Benefits Offer Rates
          offer health benefits to unmarried opposite-sex                          important reason” for not doing so. Other factors
          partners, 31% of firms report offering health                            frequently cited by firms as the most important
          benefits to unmarried opposite-sex domestic                              reason for not offering coverage include: firm
          partners. An additional 36% of firms report that                         is too small (9%) and employees are covered
          they have not encountered the issue or that the                          elsewhere (11%) (Exhibit 2.9).
          question was not applicable, with 37% of small
                                                                             Many non-offering firms have either offered health
          firms (3–199 workers) more likely to report this
                                                                               benefits in the past five years, or shopped for
          compared to 6% of large firms (200 or more
                                                                               coverage recently.
          workers) (Exhibit 2.7).
                                                                                  Eighteen percent of non-offering small firms
         In response to the question asking firms if they
                                                                                   (3–199 workers) have offered health benefits in
          offer health benefits to unmarried same-sex
                                                                                   the past five years, while 33% have shopped for
          domestic partners, 21% of firms offer health
                                                                                   coverage in the past 12 months (Exhibit 2.10).
          benefits to unmarried same-sex domestic partners.
          An additional 44% of firms report that they have                   Four-fifths of small firms (3–199 workers) not
          not encountered the issue or that the question                       offering health benefits believe that employees would
          was not applicable, with 46% of small firms                          rather receive an additional $2 per hour in the form
          (3–199 workers) and 6% of large firms (200                           of higher wages (approximately the cost of health
          or more workers) reporting that they have not                        insurance for single coverage) than health insurance
          encountered the issue or that the question was not                   (Exhibit 2.11).
          applicable (Exhibit 2.8).
                                                                             Small firms (3–199 workers) not offering health
         Firms in the West are more likely (41%) and firms                    insurance gave a variety of estimates regarding the
          in the South are less likely (6%) to offer health                    amount they believe the firm could afford to pay
          benefits to unmarried same-sex domestic partners                     for health insurance coverage for an employee with
          than firms in other regions.                                         single coverage. Thirty percent reported that they
                                                                               could pay less than $100 per month; 11% reported
f i r m s N o T o f f e r i N g h e A lT h b e N e f i T s
                                                                               that they could pay $300 or more per month
 The survey asks firms that do not offer health                              (Exhibit 2.12).
   benefits if they have offered insurance or shopped
                                                                             Forty percent of small (3–199 workers) non-offering
   for insurance in the recent past, about their most
                                                                               firms believe the total cost of health insurance for
   important reasons for not offering, and if they think
                                                                               one employee would cost $400 or more per month.
   employees would prefer an additional $2 per hour
                                                                               The average monthly cost of single coverage in 2009
   as wages or health insurance. Because such a small
                                                                               is $402, with wide variation around the average
   percentage of large firms (200 or more workers)
                                                                               (Exhibit 2.13).
   report not offering health benefits, we present the
   information for employers with 3 to 199 workers,
   41% of which do not offer health benefits.


          noTe:

  1   in 2009, the question asking non-offering firms their most important reason for not offering health benefits was changed
      from a question with multiple response categories to an open-ended question.


                                                                                                                                                                          37
                                                   t h e k a i s e r fa m i ly f o u n d at i o n - a n d - h e a lt h r e s e a r C h  e d u C at i o n a l t r u s t
Employer Health Benefits          2 0 0 9 A n n u a l s u r ve y


                                       e x h i B i t 2. 1

                                       Percentage of firms o ffering health B enefits, 1999–2009*
  section two


                                       100%


                                        90%


                                        80%

                                                                     69%             68%
                          2
                                        70%          66%                                             66%             66%
                                                                                                                                     63%                                         63%
                                                                                                                                                    60%          61%    60%                60%
                                        60%
Health Benefits Offer Rates


                                        50%


                                        40%


                                        30%


                                        20%


                                        10%


                                          0%
                                                     1999            2000            2001            2002            2003           2004            2005         2006   2007     2008      2009


                                                            source:

                                                      kaiser/hret survey of employer-sponsored health Benefits, 1999–2009.

                                                   * tests found no statistical difference from estimate for the previous year shown (p.05).
                                                   note: as noted in the survey design and methods section, estimates presented in this exhibit are based on the sample of both firms that
                                                   completed the entire survey and those that answered just one question about whether they offer health benefits.


                                       e x h i B i t 2. 2

                                         Percentage of firms o ffering health B enefits, by fir m size, 1999–2009


                                     firm size                                      1999         2000          2001         2002          2003            2004   2005   2006   2007     2008      2009

                                          3–9 Workers                               56%          57%           58%          58%            55%            52%    47%    48%    45%      49%       46%
                                          10–24 Workers                             74           80            77           70*            76             74     72     73     76       78        72
                                          25–49 Workers                             86           91            90           86             84             87     87     87     83       90*       87
                                          50–199 Workers                            97           97            96           95             95             92     93     92     94       94        95
                                        All small firms                             65%          68%           68%          66%            65%            63%    59%    60%    59%      62%       59%
                                         (3–199 Workers)
                                        All large firms                             99%          99%           99%          98%            98%            99%    98%    98%    99%      99%       98%
                                         (200 or more Workers)

                                     All firms                                      66%          69%           68%          66%            66%            63%    60%    61%    60%      63%       60%

                                                            source:

                                                      kaiser/hret survey of employer-sponsored health Benefits, 1999 –2009.

                                                   * estimate is statistically different from estimate for the previous year shown (p.05).
                                                   note: as noted in the survey design and methods section, estimates presented in this exhibit are based on the sample of both firms that
                                                   completed the entire survey and those that answered just one question about whether they offer health benefits.

                              38
                                   t h e k a i s e r fa m i ly f o u n d at i o n - a n d - h e a lt h r e s e a r C h  e d u C at i o n a l t r u s t
Employer Health Benefits          2 0 0 9 An n u a l s u r ve y


e x h i B i t 2.3

Percentage of firms o ffering health Benefits, by fir m size, r egion, and i ndustr y, 2009


                                                                                                                                                                                             section two
                                                                                                                      Percentage of firms offering
                                                                                                                            health Benefits

firm size
  3–9 Workers                                                                                                                            46%*
  10–24 Workers                                                                                                                          72*
  25–49 Workers                                                                                                                          87*                                               2
  50–199 Workers                                                                                                                         95*


                                                                                                                                                                                           Health Benefits Offer Rates
  200–999 Workers                                                                                                                        98*
  1,000–4,999 Workers                                                                                                                    99*
  5,000 or more Workers                                                                                                                 100*
All small firms (3–199 Workers)                                                                                                          59%*
All large firms (200 or more Workers)                                                                                                    98%*

regioN
 northeast                                                                                                                                68%
 midwest                                                                                                                                  63
 south                                                                                                                                    53*
 West                                                                                                                                     61

iNDusTry
  agriculture/mining/Construction                                                                                                         66%
  manufacturing                                                                                                                           80*
  transportation/Communications/utilities                                                                                                 74
  Wholesale                                                                                                                               74
  retail                                                                                                                                  53
  finance                                                                                                                                 56
  service                                                                                                                                 56
  state/local Government                                                                                                                  63
  health Care                                                                                                                             53

All firms                                                                                                                                 60%


                    source:

            kaiser/hret survey of employer-sponsored health Benefits, 2009

         * estimate is statistically different from estimate for all other firms not in the indicated size, region, or industry category (p.05).
         note: as noted in the survey design and methods section, estimates presented in this exhibit are based on the sample of both
         firms that completed the entire survey and those that answered just one question about whether they offer health benefits.


                                                                                                                                                                                      39
                                                               t h e k a i s e r fa m i ly f o u n d at i o n - a n d - h e a lt h r e s e a r C h  e d u C at i o n a l t r u s t
Employer Health Benefits          2 0 0 9 A n n u a l s u r ve y


                                       e x h i B i t 2. 4

                                       Percentage of firms o ffering health B enefits, by fir m Charac ter istics, 2009
  section two


                                                                    WAGE LEVEL*
                                                  FEW WORKERS ARE LOWER WAGE
                                      LESS THAN 35% EARN $23,000 A YEAR OR LESS
                                                                                                                                                                        64%
                                         MANY WORKERS ARE LOWER WAGE 35% OR                                                                      39%
                                              MORE EARN $23,000 A YEAR OR LESS

                                                               PART TIME WORKERS*
                                                        FEW WORKERS ARE PART TIME                                                                                            67%
                                                    LESS THAN 35% WORK PART TIME
                          2                            MANY WORKERS ARE PART TIME                                                       32%
                                                      35% OR MORE WORK PART TIME
Health Benefits Offer Rates


                                                                                  UNIONS*
                                          FIRM HAS AT LEAST SOME UNION WORKERS                                                                                                                 97%

                                         FIRM DOES NOT HAVE ANY UNION WORKERS                                                                                    57%

                                                                                AGE
                                                          LESS THAN 35% OF WORKERS
                                                            ARE 26 YEARS OLD OR LESS
                                                                                                                                                                       61%
                                                              35% OR MORE WORKERS
                                                            ARE 26 YEARS OLD OR LESS
                                                                                                                                                          45%

                                                                                            0%           10%         20%          30%          40%         50%   60%         70%   80%   90%   100%


                                                            source:

                                                      kaiser/hret survey of employer-sponsored health Benefits, 2009.

                                                  * estimates are statistically different from each other within category (p.05).


                              40
                                   t h e k a i s e r fa m i ly f o u n d at i o n - a n d - h e a lt h r e s e a r C h  e d u C at i o n a l t r u s t
Employer Health Benefits          2 0 0 9 An n u a l s u r ve y


e x h i B i t 2.5

 among fir ms o ffering health Benefits, Percentage that o ffer health B enefits to Par t-time
 Wor kers, by firm size, 1999–2009*


                                                                                                                                                                                             section two
firm size                            1999        2000       2001         2002          2003          2004         2005          2006         2007          2008          2009

   3–24 Workers                       19%        21%         17%          21%          24%           20%           27%          30%           23%          22%           31%
   25–199 Workers                     26         25          31           29           29            29            29           28            26           30            27
   200–999 Workers                    36         33          42           43           38            41            33           40            37           40            44
   1,000–4,999 Workers                53         48          55           60           57            50            46           55            54           53            55
   5,000 or more Workers              61         52          60           58           57            59            61           63            63           67            60
                                                                                                                                                                                           2


                                                                                                                                                                                           Health Benefits Offer Rates
All firms                            21%         23%        21%          24%           26%           23%          28%           31%           24%          25%           31%


                    source:

             kaiser/hret survey of employer-sponsored health Benefits, 1999–2009.

          * tests found no statistical difference from estimate for the previous year shown (p.05).


e x h i B i t 2.6

 among fir ms o ffering health Benefits, Percentage that o ffer health B enefits to temporar y
 Wor kers, by firm size, 1999–2009


firm size                            1999        2000       2001         2002          2003          2004         2005          2006         2007          2008          2009

   3–24 Workers                        5%          2%         4%            3%           1%            4%            2%          3%             2%            3%           4%
   25–199 Workers                      3           7          3             4            3             3             5           4              4             3            3
   200–999 Workers                     3           8          6             5            9             8             5           5              7             4            4
   1,000–4,999 Workers                 6           8          9             8            7             6             5           9              9             7            7
   5,000 or more Workers               8           9          7             7           10             7             9          11              6*            8            9

All firms                              4%          4%         4%            3%           2%            4%           3%            3%            2%            3%           3%


                    source:

             kaiser/hret survey of employer-sponsored health Benefits, 1999-2009.

          * estimate is statistically different from estimate for the previous year shown (p.05).


                                                                                                                                                                                      41
                                                               t h e k a i s e r fa m i ly f o u n d at i o n - a n d - h e a lt h r e s e a r C h  e d u C at i o n a l t r u s t
Employer Health Benefits          2 0 0 9 A n n u a l s u r ve y


                                       e x h i B i t 2. 7

                                       among firms o ffering health Benefits, distr ibution of Whether employers o ffer health B enefits to
                                       unmar r ied opposite -sex d omestic Par tners, by fir m size, r egion, and i ndustr y, 2009
  section two


                                                                                                                                                                                   not encountered/
                                                                                                                                        yes                  no
                                                                                                                                                                                    not applicable

                                       firm size
                                         3–24 Workers                                                                                  30%                  29%*                         41%*
                          2              25–49 Workers                                                                                 35                   37                           29
                                         50–199 Workers                                                                                26                   56*                          18*
Health Benefits Offer Rates


                                         200–999 Workers                                                                               33                   59*                           8*
                                         1,000–4,999 Workers                                                                           36                   63*                           1*
                                         5,000 or more Workers                                                                         46*                  54*                          1*
                                       All small firms (3–199 Workers)                                                                 30%                  33%*                         37%*
                                       All large firms (200 or more Workers)                                                           35%                  59%*                          6%*

                                       regioN
                                        northeast                                                                                      45%                  29%                          26%
                                        midwest                                                                                        19                   38                           43
                                        south                                                                                          20                   37                           44
                                        West                                                                                           42                   31                           28

                                       iNDusTry
                                         agriculture/mining/Construction                                                               22%                  23%                          55%*
                                         manufacturing                                                                                 24                   30                           46
                                         transportation/Communications/utilities                                                       40                   38                           22
                                         Wholesale                                                                                     56                   18*                          26
                                         retail                                                                                        46                   42                           12*
                                         finance                                                                                       12*                  75*                          13*
                                         service                                                                                       30                   31                           39
                                         state/local Government                                                                        62                   33                            5*
                                         health Care                                                                                   14*                  40                           46

                                       All firms                                                                                       31%                  34%                          36%


                                                             source:

                                                       kaiser/hret survey of employer-sponsored health Benefits, 2009.


                                                   * estimate is statistically different from estimate for all firms not in the indicated size, region, or industry category (p.05).
                                                   note: in 2008, we changed the response options because during early tests of the survey, several firms noted that they had not
                                                   encountered the issue, indicating that the responses of “yes,”“no,” and “don’t know” were insufficient. therefore, for the 2008 and
                                                   2009 surveys we included the response option “not applicable/not encountered” to better capture the number of firms that report not
                                                   having a policy on the issue. this response is distinguished from firms that report “no” since those firms have a set policy on the issue.


                              42
                                   t h e k a i s e r fa m i ly f o u n d at i o n - a n d - h e a lt h r e s e a r C h  e d u C at i o n a l t r u s t
Employer Health Benefits          2 0 0 9 An n u a l s u r ve y


e x h i B i t 2.8

among fir ms o ffering health Benefits, distr ibution of Whether employers o ffer health B enefits to
unmar r ied same -s ex d omestic Par tners, by fir m size, r egion, and i ndustr y, 2009


                                                                                                                                                                                              section two
                                                                                                                                                    not encountered/
                                                                                      yes                                  no
                                                                                                                                                     not applicable

firm size
  3–24 Workers                                                                       20%                                 30%*                                 51%*
  25–49 Workers                                                                      24                                  39                                   37                            2
  50–199 Workers                                                                     20                                  58*                                  22*


                                                                                                                                                                                            Health Benefits Offer Rates
  200–999 Workers                                                                    33*                                 59*                                   8*
  1,000–4,999 Workers                                                                36*                                 62*                                   1*
  5,000 or more Workers                                                              56*                                 44                                    1*
All small firms (3–199 Workers)                                                      20%*                                34%*                                 46%*
All large firms (200 or more Workers)                                                36%*                                58%*                                  6%*

regioN
 northeast                                                                           25%                                  38%                                 37%
 midwest                                                                             15                                   40                                  45
 south                                                                                6*                                  35                                  59*
 West                                                                                41*                                  27                                  32

iNDusTry
  agriculture/mining/Construction                                                    8%*                                  31%                                 61%
  manufacturing                                                                      17                                   32                                  51
  transportation/Communications/utilities                                            13                                   45                                  41
  Wholesale                                                                           7*                                  34                                  59
  retail                                                                             45                                   42                                  13*
  finance                                                                            12                                   75*                                 13*
  service                                                                            24                                   30                                  46
  state/local Government                                                             58                                   34                                   9*
  health Care                                                                        11                                   19*                                 70*

All firms                                                                            21%                                 35%                                  44%


                    source:

             kaiser/hret survey of employer-sponsored health Benefits, 2009.


          * estimate is statistically different from estimate for all firms not in the indicated size, region, or industry category (p.05).
          note: in 2008, we changed the response options because during early tests of the survey, several firms noted that they had not
          encountered the issue, indicating that the responses of “yes,”“no,” and “don’t know” were insufficient. therefore, for the 2008 and
          2009 surveys we included the response option “not applicable/not encountered” to better capture the number of firms that report not
          having a policy on the issue. this response is distinguished from firms that report “no” since those firms have a set policy on the issue.


                                                                                                                                                                                       43
                                                                t h e k a i s e r fa m i ly f o u n d at i o n - a n d - h e a lt h r e s e a r C h  e d u C at i o n a l t r u s t
Employer Health Benefits          2 0 0 9 A n n u a l s u r ve y


                                       e x h i B i t 2. 9

                                       among small firms (3–199 Workers) not o ffer ing health B enefits, r easons for not o ffer ing, 2009
  section two


                                                                                                                                                                                  most important reason

                                          Cost of health insurance is too high                                                                                                                 62%
                                          the firm is too small                                                                                                                                  9
                                          employees are generally covered under another plan                                                                                                     11
                          2               employee turnover is too great                                                                                                                         7
                                          other                                                                                                                                                10
Health Benefits Offer Rates


                                          don’t know                                                                                                                                              1


                                                            source:

                                                      kaiser/hret survey of employer-sponsored health Benefits, 2009.


                                      e x h i B i t 2. 10

                                       among small firms (3–199 Workers) not o ffer ing health B enefits, Percentage that repor t the
                                       following ac tivities r egarding health B enefits, by fir m size, 2009*


                                       100%


                                         80%


                                         60%


                                         40%
                                                                                                                                                      33%                                33%
                                                                                                                                                                       28%
                                                                                       23%
                                         20%                      18%                                       18%


                                          0%
                                                                        OFFERED HEALTH INSURANCE                                                          SHOPPED FOR HEALTH INSURANCE
                                                                        WITHIN THE PAST FIVE YEARS                                                            WITHIN THE PAST YEAR


                                                            source:
                                                                                                                                                                                3 24 WORKERS
                                                      kaiser/hret survey of employer-sponsored health Benefits, 2009.                                                           25 199 WORKERS

                                                                                                                                                                                ALL SMALL FIRMS 3 199 WORKERS
                                                   * tests found no differences between size categories (p.05).


                              44
                                   t h e k a i s e r fa m i ly f o u n d at i o n - a n d - h e a lt h r e s e a r C h  e d u C at i o n a l t r u s t
Employer Health Benefits          2 0 0 9 An n u a l s u r ve y


e x h i B i t 2.1 1

 among small firms (3–199 Workers) not o ffer ing health B enefits, employer B eliefs about
 employees’ Preferences for h igher Wages or health i nsurance B enefits, 2003–2009


                                                                                                                                                                                                   section two
 2003                                                            72%                                                                            19%                       9%

 2005                                                          71%                                                                                    26%                      4%

 2007                                                          71%                                                                                23%                        6%
                                                                                                                                                                                                 2
                                                                           84%                                                                                 12%             4%


                                                                                                                                                                                                 Health Benefits Offer Rates
 2008*


 2009                                                                    80%                                                                             13%                7%

         0%                10%           20%           30%              40%               50%               60%              70%               80%              90%               100%


                      source:
                                                                                                                                                     EMPLOYEES WOULD PREFER
                                                                                                                                                     HIGHER WAGES
                kaiser/hret survey of employer-sponsored health Benefits, 2003–2009.
                                                                                                                                                     EMPLOYEES WOULD PREFER
                                                                                                                                                     HEALTH INSURANCE
              * distribution is statistically different from distribution for the previous year shown (p.05).
                                                                                                                                                     DON’T KNOW
              note: the question asks firms whether they believe employees would rather receive an additional
              $2 per hour (approximately the cost of health insurance for single coverage) in the form of higher
              wages or health insurance.


e x h i B i t 2.1 2

 among small firms (3–199 Workers) not o ffer ing B enefits, distr ibution of fir ms by the amount
 they B elieve they Could afford to Pay m onthly for health i nsurance Coverage for an employee
 with single Coverage, by firm size, 2009*


  3 24 WORKERS                           30%                                17%                    11%            7%       4%                         31%


25 199 WORKERS                             33%                                                  33%                           6%        6%                    22%


ALL SMALL FIRMS
3 199 WORKERS
                                          30%                                 18%                     11%           7%       4%                         31%

                      0%           10%           20%           30%             40%              50%             60%             70%             80%              90%            100%


                      source:
                                                                                                                                                     LESS THAN $100 PER MONTH
                kaiser/hret survey of employer-sponsored health Benefits, 2009.                                                                      $100 $199 PER MONTH

                                                                                                                                                     $200 $299 PER MONTH
              * tests found no statistical difference between distributions for firms with 3–24 Workers and                                          $300 $399 PER MONTH
                25–199 Workers (p.05).
                                                                                                                                                     $400 OR MORE PER MONTH

                                                                                                                                                     DON‘T KNOW


                                                                                                                                                                                            45
                                                                     t h e k a i s e r fa m i ly f o u n d at i o n - a n d - h e a lt h r e s e a r C h  e d u C at i o n a l t r u s t
Employer Health Benefits          2 0 0 9 A n n u a l s u r ve y


                                      e x h i B i t 2. 13

                                       among small firms (3–199 Workers) not o ffer ing health B enefits, distr ibution of fir ms by the
                                       amount they Believe the total m onthly Cost of health i nsurance for one employee with single
                                       Coverage Would be if they o ffered the B enefit, by fir m size, 2009*
  section two


                                                              2%
                                         3 24 WORKERS            3%          15%                    12%                                         40%                               28%

                                                             1%
                          2           25 199 WORKERS                    15%                    14%                       18%                                    30%                  21%
Health Benefits Offer Rates


                                                              2%
                                      ALL SMALL FIRMS
                                      3 199 WORKERS
                                                                 3%           15%                   12%                                       40%                                 28%


                                                            0%             10%             20%              30%             40%             50%           60%         70%   80%         90%         100%


                                                            source:
                                                                                                                                                                              LESS THAN $100 PER MONTH
                                                      kaiser/hret survey of employer-sponsored health Benefits, 2009.
                                                                                                                                                                              $100 $199 PER MONTH

                                                                                                                                                                              $200 $299 PER MONTH
                                                   * tests found no statistical difference between distributions for firms with 3–24 Workers and
                                                     25–199 Workers (p.05).                                                                                                  $300 $399 PER MONTH

                                                                                                                                                                              $400 OR MORE PER MONTH

                                                                                                                                                                              DON‘T KNOW


                              46
                                   t h e k a i s e r fa m i ly f o u n d at i o n - a n d - h e a lt h r e s e a r C h  e d u C at i o n a l t r u s t
60%

                                      $4,8 2 4
           Employer Health Benefits
$ 13,375
              2009 annual surVey


              Employee
              Coverage,
           Eligibility, and
            Participation

                 section


                     3


           2009
Employer Health Benefits          2 0 0 9 A n n u a l s u r ve y


                                                                     e M p l o y e e C o v e r a g e , e l i g i B i l i t y, a n D p a r t i C i p a t i o n


                                                                             e mployers        are The principal source of healTh insurance in The                                  u niTed s TaTes ,   providing healTh benefiTs

                                                                             for abouT        159    million nonelderly people in a merica . 1                        m osT     workers are offered healTh coverage aT

                                                                             work , and The vasT majoriTy of workers who are offered coverage Take iT .                                           workers     may noT be covered

                                                                             by Their own employer for several reasons : Their employer may noT offer coverage , They may be ineligible

                                                                             for benefiTs offered by Their firm , They may choose To elecT coverage Through Their spouse’s employer, or
    section three


                                                                             They may refuse an offer of coverage from Their firm .


                                                                               Among firms offering health benefits, 65% percent                                        Among workers in firms offering health benefits,
                                                                                 of workers are covered by health benefits through                                         those in firms with fewer lower-wage workers
                                                                                 their own employer (Exhibit 3.2). This percentage                                         (fewer than 35% of workers earn $23,000 or
                                                    3                            is reduced to 59% when considering all workers,                                           less annually) are more likely to be covered by
                                                                                 regardless of whether they are in a firm offering                                         their own firm than workers in firms with many
Employee Coverage, Eligibility, and Participation


                                                                                 health benefits or not (Exhibit 3.1).                                                     lower-wage workers (35% or more of workers earn
                                                                                                                                                                           $23,000 or less annually). Sixty-nine percent of
                                                                               The rate of coverage varies by certain firm
                                                                                                                                                                           workers in firms with fewer lower-wage workers
                                                                                 characteristics.
                                                                                                                                                                           are covered by their own employer, compared to
                                                                                    There is significant variation in the coverage rate                                   46% of workers in lower-wage firms (Exhibit 3.5).
                                                                                     by industry among workers in firms offering
                                                                                                                                                                     Not all employees are eligible for the health benefits
                                                                                     health benefits. For example, forty-three percent
                                                                                                                                                                       offered by their firm, and not all eligible employees
                                                                                     of workers in retail firms are covered by health
                                                                                                                                                                       who are offered health coverage take up the offer of
                                                                                     benefits offered by their firm, compared to 78%
                                                                                                                                                                       coverage. The share of workers covered in a firm is
                                                                                     of workers in state and local government, 78% of
                                                                                                                                                                       a product of both the percentage of workers who
                                                                                     workers in the transportation/communications/
                                                                                                                                                                       are eligible for the firm’s health insurance and the
                                                                                     utilities industry category, and 79% of workers in
                                                                                                                                                                       percentage who choose to “take up” (i.e., elect to
                                                                                     the manufacturing industry (Exhibit 3.2).
                                                                                                                                                                       participate in) the benefit.
                                                                                    Among workers in firms offering health benefits,
                                                                                                                                                                          Seventy-nine percent of workers in firms offering
                                                                                     those in firms with relatively few part-time
                                                                                                                                                                           health benefits are eligible for the coverage
                                                                                     workers (fewer than 35% of workers are part-
                                                                                                                                                                           offered by their employer in 2009, similar to the
                                                                                     time) are much more likely to be covered by their
                                                                                                                                                                           percentage (80%) reported last year (Exhibit 3.6).
                                                                                     own firm than workers in firms with a greater
                                                                                     percentage of part-time workers. Seventy-one                                         Eligibility varies considerably by wage level.
                                                                                     percent of workers in firms with relatively few                                       Employees in firms with a lower proportion of
                                                                                     part-time workers are covered by their own                                            lower-wage workers (fewer than 35% of workers
                                                                                     employer, compared to 33% in firms with higher                                        earn $23,000 or less annually) are more likely to
                                                                                     percentages of part-time workers (Exhibit 3.5).                                       be eligible for health benefits than are employees
                                                                                                                                                                           in firms with a higher proportion of lower-
                                                                                                                                                                           wage workers (where 35% or more of workers
                                                                                                                                                                           earn $23,000 or less annually) (83% vs. 65%)
                                                                                                                                                                           (Exhibit 3.3).


                                                                                         noTe:

                                                                                     1
                                                                                         kaiser family foundation, kaiser Commission on medicaid and the uninsured, the uninsured: a Primer, october 2008.


                                                        48
                                                             t h e k a i s e r fa m i ly f o u n d at i o n - a n d - h e a lt h r e s e a r C h  e d u C at i o n a l t r u s t
Employer Health Benefits         2 0 0 9 An n u a l s u r ve y


       Employees who are offered coverage through                        Seventy-four percent of covered workers face a
        their employer generally elect to take up coverage.                 waiting period before coverage is available. Covered
        Eighty-one percent of eligible workers take up                      workers in small firms (3–199 workers) are more
        coverage when it is offered to them, similar to the                 likely to face a waiting period than workers in large
        82% reported last year (Exhibit 3.6).2                              firms (200 or more workers) (80% vs. 70%). In
                                                                            addition, covered workers in the Northeast are less
       The likelihood of a worker accepting a firm’s offer


                                                                                                                                                                                section three
                                                                            likely (64%) and covered workers in the West are
        of coverage also varies by firm wage level. Eligible
                                                                            more likely (81%) than workers in other regions
        employees in firms with a lower proportion of
                                                                            to face a waiting period. Covered workers in retail
        lower-wage workers are more likely to take up
                                                                            (93%), wholesale (88%), and healthcare (87%)
        coverage (83%) than eligible employees in firms
                                                                            firms are much more likely than workers in other
        with a higher proportion of lower-wage workers
                                                                            industries to face a waiting period (Exhibit 3.7).
        (35% or more of workers earn $23,000 or less
        annually) (70%) (Exhibit 3.4).                                         The average waiting period among covered
                                                                                workers who face a waiting period is 2.2 months
                                                                                                                                                                             3
                                                                                (Exhibit 3.7). Twenty-nine percent of covered


                                                                                                                                                                             Employee Coverage, Eligibility, and Participation
                                                                                workers face a waiting period of 3 months or
                                                                                more (Exhibit 3.8).


        noTe:

2   in 2009, kaiser/hret began weighting the percentage of workers that take up coverage by the number of workers eligible for
    coverage. the historical take up estimates have also been updated. see the survey design and methods section for more
    information.


                                                                                                                                                                        49
                                                 t h e k a i s e r fa m i ly f o u n d at i o n - a n d - h e a lt h r e s e a r C h  e d u C at i o n a l t r u s t
Employer Health Benefits          2 0 0 9 A n n u a l s u r ve y


                                                                 e x h i B i t 3. 1

                                                                 Percentage of all Workers Covered by their employers’ health B enefits, in fir ms B oth o ffer ing and
                                                                 not o ffering health Benefits, by firm size, 1999–2009*


                                                               firm size                                                          1999       2000       2001        2002        2003   2004   2005   2006   2007   2008   2009

                                                                   3–24 Workers                                                   50%        50%        49%         45%         44%    43%    41%    45%    42%    43%    39%
                                                                   25–49 Workers                                                  56         63         62          57          59     56     55     55     51     57     54
                                                                   50–199 Workers                                                 61         62         67          64          61     56     59     62     59     60     59
                                                                   200–999 Workers                                                69         69         71          69          68     69     65     66     65     67     63
                                                                   1,000–4,999 Workers                                            68         68         69          70          69     68     69     68     69     69     67
    section three


                                                                   5,000 or more Workers                                          64         66         69          68          68     67     66     60     63     64     65
                                                               All small firms (3–199 Workers)                                    55%        57%        58%         54%         53%    50%    50%    53%    50%    52%    49%
                                                               All large firms (200 or more Workers)                              66%        67%        69%         69%         68%    68%    66%    63%    65%    66%    65%

                                                              All firms                                                           62%        63%        65%         63%         62%    61%    60%    59%    59%    60%    59%


                                                    3                              source:
Employee Coverage, Eligibility, and Participation


                                                                              kaiser/hret survey of employer-sponsored health Benefits, 1999–2009.

                                                                           * tests found no statistical difference from estimate for the previous year shown (p.05).


                                                        50
                                                             t h e k a i s e r fa m i ly f o u n d at i o n - a n d - h e a lt h r e s e a r C h  e d u C at i o n a l t r u s t
Employer Health Benefits          2 0 0 9 An n u a l s u r ve y


e x h i B i t 3.2

eligibilit y, take -up r ate, and Coverage in firms o ffering health Benefits, by firm size, region, and
i ndustr y, 2009


                                                                              Percentage                           Percentage
                                                                                                                                                       Percentage
                                                                          of Workers eligible                  of eligible Workers
                                                                                                                                                   of Workers Covered
                                                                          for health Benefits                    Who Participate
                                                                                                                                                   by their employers’
                                                                           offered By their                    in their employers’
                                                                                                                                                     health Benefits
                                                                               employer                        Plan (take-up rate)

firm size


                                                                                                                                                                                             section three
  3–24 Workers                                                                         83%                                 79%                                 66%
  25–49 Workers                                                                        84                                  78                                  65
  50–199 Workers                                                                       78                                  79                                  61
  200–999 Workers                                                                      77                                  83                                  64
  1,000–4,999 Workers                                                                  80                                  83*                                 67
  5,000 or more Workers                                                                79                                  82                                  65
All small firms (3–199 Workers)                                                        81%                                 79%*                                64%
All large firms (200 or more Workers)                                                  79%                                 82%*                                65%
                                                                                                                                                                                             3


                                                                                                                                                                                             Employee Coverage, Eligibility, and Participation
regioN
 northeast                                                                             78%                                 80%                                  62%
 midwest                                                                               77                                  80                                   62
 south                                                                                 82*                                 82                                   67*
 West                                                                                  79                                  82                                   64

iNDusTry
  agriculture/mining/Construction                                                      80%                                 82%                                  65%
  manufacturing                                                                        93*                                 84*                                  79*
  transportation/Communications/utilities                                              89*                                 88*                                  78*
  Wholesale                                                                            86*                                 81                                   70
  retail                                                                               58*                                 74*                                  43*
  finance                                                                              86*                                 81                                   70
  service                                                                              76*                                 78*                                  60*
  state/local Government                                                               87*                                 90*                                  78*
  health Care                                                                          80                                  83                                   66

All firms                                                                              79%                                 81%                                 65%


                    source:

             kaiser/hret survey of employer-sponsored health Benefits, 2009.


          * estimate for eligibility, take-up rate, or coverage is statistically different from all other firms not in the indicated size,
            region, or industry category (p.05).
          note: in 2009, kaiser/hret began weighting the percentage of workers that take up coverage by the number of
          workers eligible for coverage. see the survey design and methods section for more information.


                                                                                                                                                                                        51
                                                                 t h e k a i s e r fa m i ly f o u n d at i o n - a n d - h e a lt h r e s e a r C h  e d u C at i o n a l t r u s t
Employer Health Benefits          2 0 0 9 A n n u a l s u r ve y


                                                                 e x h i B i t 3. 3

                                                                 among Wor kers in fir ms o ffer ing health Benefits, Percentage of Workers eligible for health
                                                                 B enefits o ffered by their firm, by firm Charac ter istics, 2009


                                                                                                WAGE LEVEL*
                                                                             FEW WORKERS ARE LOWER WAGE                                                                                                               83%
                                                                 LESS THAN 35% EARN $23,000 A YEAR OR LESS
                                                                           MANY WORKERS ARE LOWER WAGE                                                                                            65%
                                                                   35% OR MORE EARN $23,000 A YEAR OR LESS
                                                                                           PART TIME WORKERS*
                                                                                   FEW WORKERS ARE PART TIME                                                                                                               86%
                                                                               LESS THAN 35% WORK PART TIME
                                                                                  MANY WORKERS ARE PART TIME                                                                        47%
                                                                                 35% OR MORE WORK PART TIME
    section three


                                                                                                            UNIONS
                                                                     FIRM HAS AT LEAST SOME UNION WORKERS                                                                                                       79%
                                                                    FIRM DOES NOT HAVE ANY UNION WORKERS                                                                                                         80%
                                                                                                                 AGE*
                                                                                      LESS THAN 35% OF WORKERS                                                                                                        83%
                                                                                        ARE 26 YEARS OLD OR LESS
                                                                                         35% OR MORE WORKERS                                                                              54%
                                                                                       ARE 26 YEARS OLD OR LESS


                                                    3                                                                   0%         10%          20%          30%          40%       50%    60%     70%         80%         90%    100%
Employee Coverage, Eligibility, and Participation


                                                                                      source:

                                                                                kaiser/hret survey of employer-sponsored health Benefits, 2009.


                                                                             * estimates are statistically different from each other within category (p.05).


                                                                 e x h i B i t 3. 4

                                                                 among Workers in firms o ffering health B enefits, Percentage of eligible Wor kers Who take up
                                                                 health B enefits o ffered by their firm, by fir m Charac ter istics, 2009


                                                                                                WAGE LEVEL*
                                                                             FEW WORKERS ARE LOWER WAGE                                                                                                               83%
                                                                 LESS THAN 35% EARN $23,000 A YEAR OR LESS
                                                                           MANY WORKERS ARE LOWER WAGE                                                                                                   70%
                                                                   35% OR MORE EARN $23,000 A YEAR OR LESS
                                                                                           PART TIME WORKERS*
                                                                                   FEW WORKERS ARE PART TIME                                                                                                          83%
                                                                               LESS THAN 35% WORK PART TIME
                                                                                  MANY WORKERS ARE PART TIME                                                                                         69%
                                                                                 35% OR MORE WORK PART TIME
                                                                                                             UNIONS*
                                                                     FIRM HAS AT LEAST SOME UNION WORKERS                                                                                                              84%
                                                                    FIRM DOES NOT HAVE ANY UNION WORKERS                                                                                                             80%
                                                                                                             AGE*
                                                                                      LESS THAN 35% OF WORKERS                                                                                                        83%
                                                                                        ARE 26 YEARS OLD OR LESS
                                                                                         35% OR MORE WORKERS
                                                                                       ARE 26 YEARS OLD OR LESS
                                                                                                                                                                                                    68%
                                                                                                                        0%          10%          20%          30%          40%      50%     60%    70%         80%          90%   100%


                                                                                      source:

                                                                                kaiser/hret survey of employer-sponsored health Benefits, 2009.


                                                                             * estimates are statistically different from each other within category (p.05).
                                                                             note: in 2009, kaiser/hret began weighting the percentage of workers that take up coverage by the number
                                                                             of workers eligible for coverage. see the survey design and methods section for more information.


                                                        52
                                                             t h e k a i s e r fa m i ly f o u n d at i o n - a n d - h e a lt h r e s e a r C h  e d u C at i o n a l t r u s t
Employer Health Benefits          2 0 0 9 An n u a l s u r ve y


e x h i B i t 3.5

 among Wor kers in fir ms o ffer ing health Benefits, Percentage of Workers Covered by health
 B enefits o ffered by their firm, by firm Charac ter istics, 2009


                               WAGE LEVEL*
            FEW WORKERS ARE LOWER WAGE                                                                                                 69%
LESS THAN 35% EARN $23,000 A YEAR OR LESS
          MANY WORKERS ARE LOWER WAGE
  35% OR MORE EARN $23,000 A YEAR OR LESS
                                                                                                          46%
                        PART TIME WORKERS*
                FEW WORKERS ARE PART TIME
            LESS THAN 35% WORK PART TIME
                                                                                                                                           71%
               MANY WORKERS ARE PART TIME                                                33%
              35% OR MORE WORK PART TIME
                                      UNIONS


                                                                                                                                                                                           section three
   FIRM HAS AT LEAST SOME UNION WORKERS                                                                                             67%
   FIRM DOES NOT HAVE ANY UNION WORKERS                                                                                          64%
                                           AGE*
                    LESS THAN 35% OF WORKERS                                                                                           69%
                      ARE 26 YEARS OLD OR LESS
                       35% OR MORE WORKERS                                                    37%
                     ARE 26 YEARS OLD OR LESS

                                                  0%     10%         20%          30%         40%          50%          60%          70%          80%          90%         100%
                                                                                                                                                                                           3


                                                                                                                                                                                           Employee Coverage, Eligibility, and Participation
                    source:

             kaiser/hret survey of employer-sponsored health Benefits, 2009.


          * estimates are statistically different from each other within category (p.05).


e x h i B i t 3.6

 eligibilit y, take -up r ate, and Coverage for Wor kers in fir ms o ffer ing health B enefits, by fir m size,
 1999–2009


                                                         1999 2000 2001 2002 2003 2004 2005 2006 2007 2008 2009

percentage eligible
   all small firms (3–199 Workers)                       81%       82%         85% 82%* 84%                      80%        81%         83%        80%         81%        81%
   all large firms (200 or more Workers)                 78        80          82  80   80                       81         79          76         78          79         79
All firms                                                79%       81%         83% 81%* 81%                      80%        80%         78%        79%         80%        79%

percentage of eligible that Take up
   all small firms (3–199 Workers)                       83%       83%         83% 82%                81%        80%        81%         81%        80%         80%        79%
   all large firms (200 or more Workers)                 86        84          85  86                 85         84         85          84         84          84         82
All firms                                                85%       84%         84% 85%                84%        83%        83%         83%        82%         82%        81%

percentage Covered
   all small firms (3–199 Workers)                       67%       68%         71% 67%                68%        64%        65%         67%        64%         65%        64%
   all large firms (200 or more Workers)                 66        67          69  69                 68         68         67          63         65          66         65
All firms                                                66%       68%         70% 68%                68%        67%        66%         65%        65%         65%        65%


                    source:

             kaiser/hret survey of employer-sponsored health Benefits, 1999–2009.

          * estimate is statistically different from estimate for the previous year shown (p.05).
          note: in 2009, kaiser/hret began weighting the percentage of workers that take up coverage by the number of workers eligible for
          coverage. the historical take up estimates have also been updated. see the survey design and methods section for more information.


                                                                                                                                                                                      53
                                                               t h e k a i s e r fa m i ly f o u n d at i o n - a n d - h e a lt h r e s e a r C h  e d u C at i o n a l t r u s t
Employer Health Benefits          2 0 0 9 A n n u a l s u r ve y


                                                                 e x h i B i t 3. 7

                                                                 Percentage of Covered Wor kers in firms with a Waiting Period for Coverage and average Waiting
                                                                 Per iod in m onths, by firm size, region, and i ndustr y, 2009


                                                                                                                                                                                               among Covered Workers
                                                                                                                                               Percentage of Covered Workers
                                                                                                                                                                                            with a Waiting Period, average
                                                                                                                                                in firms with Waiting Period
                                                                                                                                                                                               Waiting Period (months)
                                                                 firm size
                                                                   all small firms (3–199 Workers)                                                                    80%*                                     2.5*
                                                                   all large firms (200 or more Workers)                                                              70*                                      2.0*
    section three


                                                                 regioN
                                                                  northeast                                                                                           64%*                                     2.1
                                                                  midwest                                                                                             74                                       1.8*
                                                                  south                                                                                               74                                       2.1
                                                                  West                                                                                                81*                                      2.7*

                                                                 iNDusTry
                                                    3              agriculture/mining/Construction                                                                    81%                                      2.9
                                                                   manufacturing                                                                                      67                                       2.3
Employee Coverage, Eligibility, and Participation


                                                                   transportation/Communications/utilities                                                            62                                       1.8*
                                                                   Wholesale                                                                                          88*                                      2.1
                                                                   retail                                                                                             93*                                      2.8*
                                                                   finance                                                                                            64                                       2.1
                                                                   service                                                                                            71                                       2.1
                                                                   state/local Government                                                                             69                                       1.7*
                                                                   health Care                                                                                        87*                                      1.9*

                                                                 All firms                                                                                            74%                                      2.2

                                                                                      source:

                                                                                kaiser/hret survey of employer-sponsored health Benefits, 2009.


                                                                             * estimate is statistically different from estimate for all other firms not in the indicated size, region, or industry category (p.05).


                                                                     e x h i B i t 3. 8

                                                                     distr ibution of Covered Workers with the following Waiting Per iods for Coverage, 2009


                                                                        ALL SMALL FIRMS
                                                                        3−199 WORKERS *                      20%                                 26%                         10%                      37%                        7%

                                                                         ALL LARGE FIRMS
                                                                             200 OR MORE                               30%                                                 36%                  12%                  16%         6%
                                                                               WORKERS *


                                                                                 ALL FIRMS                        26%                                            33%                      12%                  23%               6%

                                                                                               0%             10%             20%             30%            40%             50%    60%         70%          80%         90%       100%


                                                                                      source:
                                                                                                                                                                                                NO WAITING            2 MONTHS
                                                                                kaiser/hret survey of employer-sponsored health Benefits, 2009.                                                 PERIOD
                                                                                                                                                                                                                      3 MONTHS
                                                                                                                                                                                                1 MONTH
                                                                                                                                                                                                                      4 OR MORE MONTHS
                                                                             * distributions are statistically different between all large firms and all small firms (p.05).

                                                        54
                                                             t h e k a i s e r fa m i ly f o u n d at i o n - a n d - h e a lt h r e s e a r C h  e d u C at i o n a l t r u s t
60%

                                      $4,8 2 4
           Employer Health Benefits
$ 13,375
              2009 annual surVey


                Types of
                 Plans
                Offered

                 section


                     4


           2009
Employer Health Benefits          2 0 0 8 A n n u a l s u r ve y


                                      typeS of planS offereD


                                              m osT    firms ThaT offer healTh benefiTs offer only one Type of healTh plan                                  (86%) (s ee TexT b ox ). l arger
                                              firms are more likely To offer more Than one Type of healTh plan .                                     e mployers   are mosT likely To offer

                                              Their workers a          ppo or pos plan and are leasT likely To offer a convenTional plan .


                                                Eighty-six percent of firms offering health benefits                               About four in five (80%) covered workers in firms
                                                  offer only one type of health plan. Large firms (200                                 offering health benefits work in a firm that offers one
                                                  or more workers) are more likely to offer more than                                  or more PPOs, 44% work in firms that offer one or
                                                  one plan type than small firms (3–199 workers):                                      more HMOs, 28% work in firms that offer one or
                                                  45% of large firms do so, compared to 13% of small                                   more HDHP/SOs, 19% work in firms that offer one
                                                  firms (Exhibit 4.1).                                                                 or more POS plans, and 5% work in firms that offer
                                                                                                                                       one or more conventional plans (Exhibit 4.4).
                                                Just over half (53%) of covered workers are
                                                  employed in a firm that offers more than one health
 section four


                                                  plan type. Sixty-eight percent of covered workers                                    The survey asks firms how many plans of each given
                                                  in large firms (200 or more workers) are employed                                    type they offer. However, we do not know if each
                                                  by a firm that offers more than one plan type;                                       plan type is offered to all covered workers at the
                                                  the comparable percentage for covered workers                                        firm. For example, some workers might be offered
                                                  employed in small firms (3–199 workers) is 23%                                       one type of plan at one location, while workers at
                                                  (Exhibit 4.2).                                                                       another location are offered a different type of plan.

                   4
Types of Plans Offered


                         56
                              t h e k a i s e r fa m i ly f o u n d at i o n - a n d - h e a lt h r e s e a r C h  e d u C at i o n a l t r u s t
Employer Health Benefits          2 0 0 9 An n u a l s u r ve y


e x h i B i t 4.1

among fir ms o ffering health Benefits, Percentage that o ffer one, two, or three or m ore Plan
types, by fir m size, 2009 ‡


                    1%                                                                                                                                        1%
 100%
                                             5%
                                                                                                                                 9%
                    12%                                               14%                                                                                    13%
   90%
                                                                                                   29%
   80%
                                            34%
                                                                                                                                36%
   70%
                                                                      39%

   60%


   50%                                                                                             43%
                    87%                                                                                                                                      86%
   40%


                                                                                                                                                                                              section four
   30%
                                            61%

                                                                      47%                                                       55%
   20%

                                                                                                   28%
   10%


    0%                                                                                                                                                                                       4
             ALL SMALL FIRMS               200 999                 1,000 4,999                5,000 OR MORE             ALL LARGE FIRMS                    ALL FIRMS
             3 199 WORKERS *              WORKERS*                  WORKERS*                    WORKERS*             200 OR MORE WORKERS *


                                                                                                                                                                                             Types of Plans Offered
                    source:
                                                                                                                                                THREE OR MORE PLAN TYPES
             kaiser/hret survey of employer-sponsored health Benefits, 2009.                                                                    TWO PLAN TYPES

                                                                                                                                                ONE PLAN TYPE
          * distribution is statistically different from distribution for all other firms not in the indicated size
            category (p.05).
          ‡ although firms may offer more than one of each plan type, the survey asks how many are offered
            among the following types: conventional, hmo, PPo, Pos, and hdhP/so.
          note: the survey asks firms how many plans of each given type they offer. however, we do not
          know if each plan type is offered to all covered workers at the firm. for example, some workers
          might be offered one type of plan at one location, while at another location they are offered a
          different type of plan.


                                                                                                                                                                                        57
                                                                 t h e k a i s e r fa m i ly f o u n d at i o n - a n d - h e a lt h r e s e a r C h  e d u C at i o n a l t r u s t
Employer Health Benefits          2 0 0 9 A n n u a l s u r ve y


                                  e x h i B i t 4. 2

                                  among firms o ffering health Benefits, Percentage of Covered Wor kers in fir ms o ffer ing one, two,
                                  or three or m ore Plan types, by firm size, 2009 ‡


                                                         2%
                                    100%
                                                                                      7%
                                                                                                                  16%
                                     90%                                                                                                                                             19%
                                                        20%
                                                                                                                                                                28%
                                                                                                                                               40%
                                     80%
                                                                                     37%
                                     70%
                                                                                                                  41%
                                                                                                                                                                                     33%
                                     60%

                                                                                                                                                                40%
                                     50%


                                     40%                                                                                                       41%
                                                        77%
 section four


                                     30%                                             56%
                                                                                                                                                                                     47%
                                                                                                                  43%
                                     20%
                                                                                                                                                                32%
                                     10%                                                                                                       20%


                   4                   0%
                                                 ALL SMALL FIRMS                   200 999                    1,000 4,999                5,000 OR MORE      ALL LARGE FIRMS        ALL FIRMS
                                                 3 199 WORKERS *                  WORKERS*                     WORKERS                     WORKERS*      200 OR MORE WORKERS *
Types of Plans Offered


                                                       source:
                                                                                                                                                                            THREE OR MORE PLAN TYPES
                                                 kaiser/hret survey of employer-sponsored health Benefits, 2009.                                                            TWO PLAN TYPES

                                                                                                                                                                            ONE PLAN TYPE
                                              * distribution is statistically different from distribution for all other firms not in the indicated size
                                                category (p.05).
                                              ‡ although firms may offer more than one of each plan type, the survey asks how many are
                                                offered among the following types: conventional, hmo, PPo, Pos, and hdhP/so.
                                              note: the survey asks firms how many plans of each given type they offer. however, we do not
                                              know if each plan type is offered to all covered workers at the firm. for example, some workers
                                              might be offered one type of plan at one location, while at another location they are offered a
                                              different type of plan.


                         58
                              t h e k a i s e r fa m i ly f o u n d at i o n - a n d - h e a lt h r e s e a r C h  e d u C at i o n a l t r u s t
Employer Health Benefits          2 0 0 9 An n u a l s u r ve y


e x h i B i t 4.3

among fir ms o ffering health Benefits, Percentage of fir ms that o ffer the following Plan types, by
fir m size, 2009


                                                          Conventional                   hmo                       PPo                      Pos                 hdhP/so

firm sizes
  200–999 Workers                                                  2%                    28%*                      79%*                    18%*                     18%*
  1,000–4,999 Workers                                              4                     38*                       88*                     13*                      24*
  5,000 or more Workers                                            7                     57*                       93*                     16*                      35*
All small firms (3–199 Workers)                                    4%                    19%*                      42%*                    37%*                     11%*
All large firms (200 or more Workers)                              3%                    33%*                      82%*                    16%*                     21%*

All firms                                                          4%                    19%                      44%                      36%                      12%


                    source:

             kaiser/hret survey of employer-sponsored health Benefits, 2009.


                                                                                                                                                                                             section four
          * estimate is statistically different within plan type from estimate for all other firms not in the indicated size category (p.05).
          note: the survey asks firms how many plans of each given type they offer. however, we do not know if each plan type is offered to all
          covered workers at the firm. for example, some workers might be offered one type of plan at one location, while workers at another
          location are offered a different type of plan.


e x h i B i t 4.4                                                                                                                                                                           4
among fir ms o ffering health Benefits, Percentage of Covered Wor kers in fir ms that o ffer the


                                                                                                                                                                                            Types of Plans Offered
following Plan types, by firm size, 2009


                                                          Conventional                   hmo                       PPo                      Pos                 hdhP/so

firm sizes
  200–999 Workers                                                  2%                    32%*                     84%                       15%                     18%*
  1,000–4,999 Workers                                              4                     42                       89*                       11*                     27
  5,000 or more Workers                                            7                     71*                      93*                       19                      41*
All small firms (3–199 Workers)                                    3%                    20%*                     59%*                      23%*                    20%*
All large firms (200 or more Workers)                              6%                    56%*                     90%*                      17%*                    33%*

All firms                                                          5%                    44%                      80%                      19%                      28%


                    source:

             kaiser/hret survey of employer-sponsored health Benefits, 2009.

          * estimate is statistically different within plan type from estimate for all other firms not in the indicated size category (p.05).
          note: the survey asks firms how many plans of each given type they offer. however, we do not know if each plan type is offered
          to all covered workers at the firm. for example, some workers might be offered one type of plan at one location, while workers
          at another location are offered a different type of plan.


                                                                                                                                                                                       59
                                                                t h e k a i s e r fa m i ly f o u n d at i o n - a n d - h e a lt h r e s e a r C h  e d u C at i o n a l t r u s t
60%

                                      $4,8 2 4
           Employer Health Benefits
$ 13,375
              2009 annual surVey


              Market
             Shares of
            Health Plans

                 section


                     5


           2009
Employer Health Benefits          2 0 0 9 A n n u a l s u r ve y


                                                M a r k e t S h a r e S o f h e a lt h p l a n S


                                                     e nrollmenT remains highesT in ppo s , wiTh 3 in 5 covered workers enrolled in This plan Type , followed by
                                                     hmo s , pos plans , hdhp/so s , and convenTional plans .


                                                       Sixty percent of covered workers are enrolled in                                         Enrollment in HDHP/SOs is highest among
                                                         PPOs, followed by HMOs (20%), POS plans                                                   workers in the Midwest (14%), and lowest among
                                                         (10%), HDHP/SOs (8%), and conventional plans                                              workers in the Northeast (5%) (Exhibit 5.2).
                                                         (1%). The distribution of health plan enrollment in
                                                                                                                                             Enrollment in HDHP/SOs held steady at 8% of
                                                         2009 did not change from last year (Exhibit 5.1).
                                                                                                                                               covered workers in 2009 (Exhibit 5.1).
                                                      
Market Shares of Health Plans


                                                         Plan enrollment patterns differ across regions.
                                                                                                                                                  Enrollment in HDHP/SOs is higher among
                                                             Compared to other regions, HMO enrollment                                            workers in small firms (3–199 workers) than
                                                              continues to be significantly higher in the West                                     large firms (200 or more workers) (13% vs. 6%)
                                                              (31%) and significantly lower in the Midwest                                         (Exhibit 5.2).
                                                              (10%) (Exhibit 5.2).
                                                                                                                                                  HDHP/SO enrollment is lower among workers
                                                             As in 2008, workers in the Midwest (66%) and                                         in agriculture/mining/construction firms (5%)
                                                              South (64%) are more likely to be enrolled in                                        and transportation/communications/utilities
                                                              PPO plans than workers in other regions; workers                                     firms (4%) than among workers in other
                                                              in the West (48%) are less likely to be enrolled in                                  industries (Exhibit 5.2).
                                                              a PPO (Exhibit 5.2).
                                5
  section five


                                    62
                                         t h e k a i s e r fa m i ly f o u n d at i o n - a n d - h e a lt h r e s e a r C h  e d u C at i o n a l t r u s t
Employer Health Benefits          2 0 0 9 An n u a l s u r ve y


e x h i B i t 5.1

distr ibution of health Plan enrollment for Covered Wor kers, by Plan type, 1988–2009


1988                                                             73%                                                                       16%                     11%

1993                                      46%                                                  21%                                        26%                         7%

1996                        27%                                           31%                                              28%                                  14%

1999            10%                         28%                                                  39%                                                    24%

2000*         8%                         29%                                                    42%                                                       21%

2001*         7%                    24%                                                    46%                                                           23%

2002*    4%                      27%                                                            52%                                                           18%


                                                                                                                                                                                             Market Shares of Health Plans
2003         5%                 24%                                                                54%                                                      17%

2004         5%                    25%                                                               55%                                                        15%

2005*    3%                 21%                                                            61%                                                                  15%

2006     3%               20%                                                            60%                                                              13%            4%

2007     3%                 21%                                                       57%                                                               13%             5%

2008*    2%               20%                                                        58%                                                           12%                8%

         1%             20%                                                          60%                                                            10%               8%
                                                                                                                                                                                             5
2009

        0%                            20%                           40%                               60%                                 80%                               100%


                                                                                                                                                                                                 section five
                    source:
                                                                                                                                                            CONVENTIONAL

                kaiser/hret survey of employer-sponsored health Benefits, 1999–2008; kPmG survey of employer-                                               HMO
                sponsored health Benefits, 1993, 1996; the health insurance association of america (hiaa), 1988.                                            PPO

                                                                                                                                                            POS
             * distribution is statistically different from the previous year shown (p.05). no statistical tests were                                      HDHP/SO
               conducted for years prior to 1999. no statistical tests are conducted between 2005 and 2006 due to
               the addition of hdhP/so as a new plan type in 2006.
             note: information was not obtained for Pos plans in 1988. a portion of the change in plan type
             enrollment for 2005 is likely attributable to incorporating more recent Census Bureau estimates
             of the number of state and local government workers and removing federal workers from the weights.
             see the survey design and methods section from the 2005 kaiser/hret survey of employer-sponsored
             health Benefits for additional information.


                                                                                                                                                                                        63
                                                                 t h e k a i s e r fa m i ly f o u n d at i o n - a n d - h e a lt h r e s e a r C h  e d u C at i o n a l t r u s t
Employer Health Benefits          2 0 0 9 A n n u a l s u r ve y


                                             e x h i B i t 5. 2

                                             distribution of health Plan enrollment for Covered Workers, by firm size, region, and industr y, 2009


                                                                                                                 Conventional                   hmo             PPo               Pos    hdhP/so

                                             firm size
                                               3–24 Workers                                                              3%                      16%            43%*              30%*     9%
                                               25–49 Workers                                                             2                       20             45*               17      16*
                                               50–199 Workers                                                            2                       15*            57                12      14*
                                               200–999 Workers                                                           1*                      19             63                10       7
                                               1,000–4,999 Workers                                                       1                       18             67*                5*      8
                                               5,000 or more Workers                                                     1                       25*            64*                5*      5*
                                             All small firms (3–199 Workers)                                             2%                      16%*           49%*              19%*    13%*
                                             All large firms (200 or more Workers)                                       1%                      22%*           65%*               6%*     6%*
Market Shares of Health Plans


                                             regioN
                                              northeast                                                                  1%                      24%            58%               11%      5%*
                                              midwest                                                                    2                       10*            66*                9      14*
                                              south                                                                      1                       18             64*               10       7
                                              West                                                                       2                       31*            48*               11       8

                                             iNDusTry
                                               agriculture/mining/Construction                                          1%                       17%            55%               23%*     5%*
                                               manufacturing                                                           1*                       19             64                 7*      9
                                               transportation/Communications/                                           2                        22             67                 5*      4*
                                5                utilities
                                               Wholesale                                                               1*                       11*            64                14      11
                                               retail                                                                   1                        17             56                15      11
  section five


                                               finance                                                                  1                        20             59                 8      12
                                               service                                                                  2                        20             58                11       9
                                               state/local Government                                                   2                        26             59                 6*      7
                                               health Care                                                              1                        23             59                 8       8

                                             All firms                                                                   1%                      20%            60%               10%      8%


                                                                  source:

                                                            kaiser/hret survey of employer-sponsored health Benefits, 2009.

                                                         * estimate is statistically different within plan type from estimate for all other firms not in the indicated size, region,
                                                           or industry category (p.05).


                                    64
                                         t h e k a i s e r fa m i ly f o u n d at i o n - a n d - h e a lt h r e s e a r C h  e d u C at i o n a l t r u s t
60%

                                      $4,8 2 4
           Employer Health Benefits
$ 13,375
              2009 annual surVey


            Worker and
             Employer
           Contributions
           for Premiums

                 section


                     6


           2009
Employer Health Benefits          2 0 0 9 A n n u a l s u r ve y


                                                               Wo r k e r a n D e M p loy e r Co n t r i B u t i o n S f o r p r e M i uM S


                                                                      p remium        conTribuTions by covered workers averaged                                17%     for single coverage and    27%    for family

                                                                      coverage , similar To The percenTages reporTed in                           2008     for boTh single and family coverage . 1      T he average
                                                                      monThly worker conTribuTions are                       $65 for single coverage and $293 for family coverage .


                                                                         In 2009, covered workers on average contribute                                           From 2008 to 2009, the average annual worker
                                                                          17% of the premium for single coverage and 27%                                            contribution for covered workers in large firms
                                                                          of the premium for family coverage (Exhibit 6.1).                                         (200 or more workers) increased significantly
                                                                          These percentages have remained stable over the last                                      from $769 to $854 for workers with single
                                                                          several years.                                                                            coverage (Exhibit 6.6). The average annual
                                                                                                                                                                    worker contribution remained stable from 2008
                                                                      
Worker and Employer Contributions for Premiums


                                                                          The average monthly worker contributions for                                              to 2009 for covered workers with single and
                                                                          single and family coverage were similar to the                                            family coverage in small firms (3–199 workers)
                                                                          amounts reported in 2008.                                                                 (Exhibits 6.6 and 6.7).
                                                                                 The average monthly worker contributions of                                  There is a great deal of variation above and below
                                                                                  $65 for single coverage and $293 for family                                   the average worker contribution to premiums for
                                                                                  coverage are statistically unchanged from                                     both single and family coverage.
                                                                                  the $60 and $280 reported in 2008 (Exhibit
                                                                                  6.2). However, since 1999, the average worker                                    Thirty-seven percent of covered workers
                                                                                  contribution has more than doubled for both                                       contribute annually at least $935 (120% of
                                                                                  single and family coverage. Annually, the average                                 the average worker contribution) for single
                                                                                  worker contribution is $779 for single coverage                                   coverage, while 41% of covered workers have
                                                                                  and $3,515 for family coverage (Exhibit 6.5).                                     an annual worker contribution of less than
                                                                                                                                                                    $623 (80% of the average worker contribution)
                                                                                 Workers enrolled in HDHP/SOs contribute a                                         (Exhibit 6.14).
                                                                                  lower amount annually than the overall average
                                                                                  worker contribution for both single ($540                                        For family coverage, 28% of covered workers
                                                                                  compared to $779) and family coverage ($2,672                                     contribute annually at least $4,218 (120% of
                                             6                                    compared to $3,515). Workers enrolled in POS                                      the average worker contribution), while 43%
                                                                                  plans contribute a larger amount annually ($4,146)                                of covered workers have an annual worker
                                                                                  than the overall average worker contribution for                                  contribution of less than $2,812 (80% of the
section six


                                                                                  family coverage ($3,515) (Exhibit 6.5).                                           average worker contribution) (Exhibit 6.14).

                                                                         Workers in small firms (3–199 workers) contribute                                    The majority of covered workers are employed by
                                                                          an annual amount of $625 for single coverage,                                         a firm that contributes at least half of the premium
                                                                          which is significantly less than the $854 contributed                                 (Exhibit 6.15).
                                                                          by workers in large firms (200 or more workers)
                                                                          (Exhibit 6.9). In contrast, workers in small firms                                       Eighteen percent of workers with single coverage
                                                                          with family coverage contribute significantly more                                        and 6% of workers with family coverage work
                                                                          annually than workers with family coverage in large                                       for a firm that pays 100% of the premium
                                                                          firms ($4,204 vs. $3,182) (Exhibit 6.10).                                                 (Exhibit 6.15).


                                                                                  noTe:

                                                                              1   estimates for premiums, worker contributions to premiums, and employer contributions to premiums presented in
                                                                                  section 6 do not include contributions made by the employer to health savings accounts or health reimbursement
                                                                                  arrangements. see section 8 for estimates of employer contributions to hsas and hras.


                                                 66
                                                      t h e k a i s e r fa m i ly f o u n d at i o n - a n d - h e a lt h r e s e a r C h  e d u C at i o n a l t r u s t
Employer Health Benefits          2 0 0 9 An n u a l s u r ve y


           Covered workers in small firms (3–199 workers)                            Workers with family coverage in firms that are
            are more likely to work for a firm that pays                               partially or completely self-funded contribute a
            100% of the premium than workers in large                                  significantly lower percentage of the premium
            firms (200 or more workers). In small firms,                               than those in firms that are fully insured (23%
            39% of covered workers have an employer                                    vs. 33%) (Exhibit 6.19).2 Among large firms
            that pays the full premium for single coverage,                            (200 or more workers) the difference between
            compared to 8% of covered workers in large                                 contributions for workers in self-insured plans
            firms (Exhibit 6.16). For family coverage, 14%                             compared to workers in fully insured plans is
            percent of covered workers in small firms have an                          23% compared to 27%.
            employer that pays the full premium for family
            coverage, compared to 2% of covered workers in                            For family coverage, workers in firms with
            large firms (Exhibit 6.17).                                                a higher proportion of lower-wage workers
                                                                                       (35% or more earn $23,000 or less annually)


                                                                                                                                                                                   Worker and Employer Contributions for Premiums
           Thirty percent of covered workers in small firms                           contribute a greater percentage of the premium
            (3–199 workers) work in a firm where they must                             than those in firms with a lower proportion
            contribute more than 50% of the premium for                                of lower-wage workers (fewer than 35% earn
            family coverage, compared to 4% of covered                                 $23,000 or less annually) (35% vs. 26%)
            workers in large firms (Exhibit 6.17).                                     (Exhibit 6.19).

       The percentage of the premium paid by covered                                 Workers with family coverage in firms that
        workers varies by several firm characteristics.                                have at least some union workers contribute a
                                                                                       significantly lower percentage of the premium
           For single coverage, workers in firms that are                             than those in firms without any union workers
            partially or completely self-funded contribute                             (21% vs. 30%) (Exhibit 6.19).
            a greater percentage of the premium than those
            in firms that are fully insured (18% vs. 15%)                             Workers with family coverage in firms that
            (Exhibit 6.18). This difference, however, largely                          employ a younger workforce (35% or more
            reflects differences in worker contributions                               workers are 26 years old or less) contribute a
            between small and large firms for single coverage                          significantly higher percentage of the premium
            more generally.                                                            than those in firms that employ an older
                                                                                       workforce (less than 35% of the workers are 26                                              6
                                                                                       years old or less) (33% vs. 27%) (Exhibit 6.19).


                                                                                                                                                                                         section six


        noTe:

    2   for definitions of self-funded and fully insured plans, see the introduction to section 10.


                                                                                                                                                                              67
                                                       t h e k a i s e r fa m i ly f o u n d at i o n - a n d - h e a lt h r e s e a r C h  e d u C at i o n a l t r u s t
Employer Health Benefits          2 0 0 9 A n n u a l s u r ve y


                                                          e x h i B i t 6. 1

                                                          average Percentage of Premium Paid by Covered Workers for single and family Coverage, 1999–2009*


                                                         50%


                                                         45%


                                                         40%


                                                         35%


                                                         30%                                                         28%                              28%                            28%
                                                                    27%                                                               27%                                     27%           27%          27%
                                                                                    26%              26%                                                               26%
                                                         25%


                                                         20%


                                                         15%
                                                                                                                     16%              16%             16%              16%    16%    16%    16%          17%
Worker and Employer Contributions for Premiums


                                                                    14%             14%              14%
                                                         10%


                                                          5%


                                                          0%
                                                                     1999             2000            2001            2002            2003             2004            2005   2006   2007   2008         2009


                                                                               source:
                                                                                                                                                                                                   FAMILY COVERAGE
                                                                         kaiser/hret survey of employer-sponsored health Benefits, 1999–2009.
                                                                                                                                                                                                   SINGLE COVERAGE

                                                                     *tests found no statistical difference from estimate for previous year shown (p.05).


                                             6
section six


                                                 68
                                                      t h e k a i s e r fa m i ly f o u n d at i o n - a n d - h e a lt h r e s e a r C h  e d u C at i o n a l t r u s t
Employer Health Benefits          2 0 0 9 An n u a l s u r ve y


e x h i B i t 6.2

average m onthly Worker Premium Contributions Paid by Covered Wor kers for single and family
Coverage, 1999–2009


$500


$450


$400


$350

                                                                                                                                                                 $293
$300                                                                                                                            $273*            $280
                                                                                                                $248*
$250                                                                            $222*            $226
                                                                $201*
$200                                              $178*
                                    $149*
           $129        $135


                                                                                                                                                                                          Worker and Employer Contributions for Premiums
$150


$100
                                                                                                                  $52            $58*             $60             $65
                                                   $39*           $42             $47             $51
 $50        $27         $28           $30

  $0
            1999         2000         2001          2002          2003            2004            2005            2006            2007            2008            2009


                    source:
                                                                                                                                                         FAMILY COVERAGE
            kaiser/hret survey of employer-sponsored health Benefits, 1999–2009.
                                                                                                                                                         SINGLE COVERAGE

         * estimate is statistically different from estimate for the previous year shown (p.05).


                                                                                                                                                                                          6


                                                                                                                                                                                                section six


                                                                                                                                                                                     69
                                                              t h e k a i s e r fa m i ly f o u n d at i o n - a n d - h e a lt h r e s e a r C h  e d u C at i o n a l t r u s t
Employer Health Benefits          2 0 0 9 A n n u a l s u r ve y


                                                          e x h i B i t 6. 3

                                                          average annual Worker and employer Contr ibutions to Premiums and total Premiums for single
                                                          Coverage, 1999–2009


                                                         1999        $318                                $1,878                                 $2,196

                                                         2000        $334                                   $2,137*                                      $2,471*

                                                         2001        $355                                       $2,334*                                          $2,689*

                                                         2002         $466*                                                $2,617*                                              $3,083*

                                                         2003         $508                                                     $2,875*                                               $3,383*

                                                         2004          $558                                                           $3,136*                                                 $3,695*

                                                         2005          $610                                                                  $3,413*                                                 $4,024*

                                                         2006          $627                                                                     $3,615*                                                     $4,242*
Worker and Employer Contributions for Premiums


                                                         2007           $694*                                                                          $3,785                                                     $4,479*

                                                         2008            $721                                                                              $3,983                                                       $4,704*

                                                         2009            $779                                                                                 $4,045                                                        $4,824

                                                                $0             $500             $1,000            $1,500           $2,000            $2,500            $3,000        $3,500      $4,000        $4,500       $5,000


                                                                               source:
                                                                                                                                                                                                          WORKER CONTRIBUTION
                                                                         kaiser/hret survey of employer-sponsored health Benefits, 1999–2009.                                                             EMPLOYER CONTRIBUTION


                                                                      * estimate is statistically different from estimate for the previous year shown (p.05).


                                             6
section six


                                                 70
                                                      t h e k a i s e r fa m i ly f o u n d at i o n - a n d - h e a lt h r e s e a r C h  e d u C at i o n a l t r u s t
Employer Health Benefits          2 0 0 9 An n u a l s u r ve y


 e x h i B i t 6.4

 average annual Worker and employer Contr ibutions to Premiums and total Premiums for family
 Coverage, 1999–2009


1999        $1,543                        $4,247                       $5,791

2000        $1,619                           $4,819*                           $6,438*

2001        $1,787*                              $5,269*                               $7,061*

2002         $2,137*                                    $5,866*                                    $8,003*

2003          $2,412*                                          $6,657*                                          $9,068*

2004            $2,661*                                               $7,289*                                              $9,950*

2005             $2,713                                                      $8,167*                                                   $10,880*

                 $2,973*                                                          $8,508*                                                     $11,480*


                                                                                                                                                                                             Worker and Employer Contributions for Premiums
2006


2007                 $3,281*                                                            $8,824                                                        $12,106*

2008                 $3,354                                                                 $9,325*                                                           $12,680*

2009                 $3,515                                                                      $9,860*                                                              $13,375*

       $0                $2,000                $4,000               $6,000                    $8,000                  $10,000                   $12,000                  $14,000


                     source:
                                                                                                                                                 WORKER CONTRIBUTION
              kaiser/hret survey of employer-sponsored health Benefits, 1999–2009.                                                               EMPLOYER CONTRIBUTION


            * estimate is statistically different from estimate for the previous year shown (p.05).


                                                                                                                                                                                             6


                                                                                                                                                                                                   section six


                                                                                                                                                                                        71
                                                                 t h e k a i s e r fa m i ly f o u n d at i o n - a n d - h e a lt h r e s e a r C h  e d u C at i o n a l t r u s t
Employer Health Benefits          2 0 0 9 A n n u a l s u r ve y


                                                          e x h i B i t 6. 5

                                                          average annual firm and Worker Premium Contr ibutions and total Premiums for Covered Workers
                                                          for single and family Coverage, by Plan type, 2009


                                                          HMO
                                                                    SINGLE         $817                  $4,061                        $4,878

                                                                    FAMILY                     $3,685                                                                        $9,785                                $13,470

                                                          PPO
                                                                    SINGLE      $806                     $4,116                         $4,922

                                                                    FAMILY                   $3,470                                                                      $10,249*                                    $13,719

                                                          POS
                                                                    SINGLE      $741                    $4,093                         $4,835

                                                                    FAMILY                       $4,146*                                                                     $8,929*                            $13,075
Worker and Employer Contributions for Premiums


                                                          HDHP/SO                   $540*
                                                               SINGLE                            $3,446*                      $3,986*

                                                                    FAMILY                $2,672*                                                        $8,411*                                 $11,083*

                                                          ALL PLANS
                                                                SINGLE          $779                       $4,045                      $4,824

                                                                    FAMILY                    $3,515                                                                         $9,860                               $13,375


                                                                              $0                  $2,000                   $4,000              $6,000                 $8,000           $10,000      $12,000        $14,000


                                                                               source:
                                                                                                                                                                                                     WORKER CONTRIBUTION
                                                                         kaiser/hret survey of employer-sponsored health Benefits, 2009.                                                             EMPLOYER CONTRIBUTION


                                                                     * estimate is statistically different from all Plans estimate by coverage type (p.05).


                                             6
section six


                                                 72
                                                      t h e k a i s e r fa m i ly f o u n d at i o n - a n d - h e a lt h r e s e a r C h  e d u C at i o n a l t r u s t
Employer Health Benefits          2 0 0 9 An n u a l s u r ve y


e x h i B i t 6.6

average annual Worker Contributions for Covered Wor kers with single Coverage, by fir m size,
1999–2009


$1,000


 $900                                                                                                                                                           $854*

 $800                                                                                                                           $759*            $769

                                                                                                                 $689
 $700
                                                                                                $638*

 $600
                                                                                 $578
                                                                 $536                                                                            $624            $625
                                                  $495*                                                                          $561
 $500                                                                                            $556
                                                                                 $513                            $515
                                     $380                        $450
 $400                  $363
           $334
                                                  $406*


                                                                                                                                                                                          Worker and Employer Contributions for Premiums
 $300
                                     $306
           $286        $280
 $200


 $100


   $0
           1999         2000          2001         2002           2003            2004            2005            2006            2007            2008            2009


                    source:
                                                                                                                                                 ALL SMALL FIRMS
            kaiser/hret survey of employer-sponsored health Benefits, 1999–2009.                                                                 3 199 WORKERS

                                                                                                                                                 ALL LARGE FIRMS
                                                                                                                                                 200 OR MORE WORKERS
         * estimate is statistically different from estimate for the previous year shown (p.05).


                                                                                                                                                                                          6


                                                                                                                                                                                                section six


                                                                                                                                                                                     73
                                                              t h e k a i s e r fa m i ly f o u n d at i o n - a n d - h e a lt h r e s e a r C h  e d u C at i o n a l t r u s t
Employer Health Benefits          2 0 0 9 A n n u a l s u r ve y


                                                          e x h i B i t 6. 7

                                                          average annual Worker Contributions for Covered Wor kers with family Coverage, by fir m size,
                                                          1999–2009


                                                         $5,000


                                                                                                                                                                                        $4,236*   $4,101     $4,204

                                                         $4,000
                                                                                                                                                                               $3,550
                                                                                                                                                     $3,382*
                                                                                                                                                                      $3,170
                                                                                                                                      $2,970
                                                         $3,000
                                                                                                                     $2,647*                                                                                  $3,182
                                                                                                                                                                                                  $2,982
                                                                                                     $2,254*                                                                            $2,831
                                                                                                                                                                               $2,658
                                                                                      $1,940                                                                          $2,487
                                                                      $1,831                                                                         $2,340*
                                                         $2,000
                                                                                                                                     $2,146*
                                                                                                                     $1,893*
Worker and Employer Contributions for Premiums


                                                                                                      $1,551
                                                                      $1,398          $1,453
                                                         $1,000


                                                              $0
                                                                        1999            2000            2001               2002         2003            2004            2005    2006      2007     2008         2009


                                                                               source:
                                                                                                                                                                                                   ALL SMALL FIRMS
                                                                         kaiser/hret survey of employer-sponsored health Benefits, 1999–2009.                                                      3 199 WORKERS

                                                                                                                                                                                                   ALL LARGE FIRMS
                                                                                                                                                                                                   200 OR MORE WORKERS
                                                                      * estimate is statistically different from estimate for the previous year shown (p.05).


                                             6
section six


                                                 74
                                                      t h e k a i s e r fa m i ly f o u n d at i o n - a n d - h e a lt h r e s e a r C h  e d u C at i o n a l t r u s t
Employer Health Benefits          2 0 0 9 An n u a l s u r ve y


e x h i B i t 6.8

average annual Worker Premium Contributions Paid by Covered Wor kers for single and family
Coverage, by firm size, 1999–2009


                                   single Coverage                                                                      family Coverage
                     all small firms                  all large firms                              all small firms                           all large firms
                    (3–199 Workers)                (200 or more Workers)                          (3–199 Workers)                         (200 or more Workers)
1999                     $286                                 $334                                       $1,831*                                      $1,398*
2000                     $280*                                $363*                                      $1,940*                                      $1,453*
2001                     $306*                                $380*                                      $2,254*                                      $1,551*
2002                     $406*                                $495*                                      $2,647*                                      $1,893*
2003                     $450                                 $536                                       $2,970*                                      $2,146*
2004                     $513                                 $578                                       $3,382*                                      $2,340*
2005                     $556                                 $638                                       $3,170*                                      $2,487*


                                                                                                                                                                                          Worker and Employer Contributions for Premiums
2006                     $515*                                $689*                                      $3,550*                                      $2,658*
2007                     $561*                                $759*                                      $4,236*                                      $2,831*
2008                     $624*                                $769*                                      $4,101*                                      $2,982*
2009                     $625*                                $854*                                      $4,204*                                      $3,182*


                    source:

            kaiser/hret survey of employer-sponsored health Benefits, 1999–2009.

         * estimate is statistically different between all small firms and all large firms within year (p.05).


                                                                                                                                                                                          6


                                                                                                                                                                                                section six


                                                                                                                                                                                     75
                                                              t h e k a i s e r fa m i ly f o u n d at i o n - a n d - h e a lt h r e s e a r C h  e d u C at i o n a l t r u s t
Employer Health Benefits          2 0 0 9 A n n u a l s u r ve y


                                                          e x h i B i t 6. 9

                                                          average annual firm and Worker Premium Contr ibutions and total Premiums for Covered Workers
                                                          for single Coverage, by Plan type and fir m size, 2009


                                                                                                                                                             Worker           employer
                                                                                                                                                                                            total Premium
                                                                                                                                                           Contribution      Contribution

                                                          hmo
                                                           all small firms (3–199 Workers)                                                                       $714          $3,828          $4,542
                                                           all large firms (200 or more Workers)                                                                 $855          $4,148          $5,003

                                                          ppo
                                                           all small firms (3–199 Workers)                                                                       $619*         $4,329*         $4,948
                                                           all large firms (200 or more Workers)                                                                 $878*         $4,035*         $4,913

                                                          pos
                                                           all small firms (3–199 Workers)                                                                       $677          $4,146          $4,824
Worker and Employer Contributions for Premiums


                                                           all large firms (200 or more Workers)                                                                 $845          $4,007          $4,853

                                                          hDhp/so
                                                           all small firms (3–199 Workers)                                                                       $457*         $3,420          $3,877
                                                           all large firms (200 or more Workers)                                                                 $622*         $3,472          $4,094

                                                          All plANs
                                                           all small firms (3–199 Workers)                                                                       $625*         $4,092          $4,717
                                                           all large firms (200 or more Workers)                                                                 $854*         $4,022          $4,876


                                                                               source:

                                                                         kaiser/hret survey of employer-sponsored health Benefits, 2009.

                                                                      * estimates are statistically different within plan type between all small firms and all large firms (p.05).


                                             6
section six


                                                 76
                                                      t h e k a i s e r fa m i ly f o u n d at i o n - a n d - h e a lt h r e s e a r C h  e d u C at i o n a l t r u s t
Employer Health Benefits          2 0 0 9 An n u a l s u r ve y


e x h i B i t 6.1 0

average annual firm and Worker Premium Contr ibutions and total Premiums for Covered Wor kers
for family Coverage, by Plan type and fir m size, 2009


                                                                                        Worker                          employer
                                                                                                                                                       total Premium
                                                                                      Contribution                     Contribution

 hmo
  all small firms (3–199 Workers)                                                         $5,039*                          $7,216*                          $12,256*
  all large firms (200 or more Workers)                                                   $3,214*                         $10,679*                          $13,893*

 ppo
  all small firms (3–199 Workers)                                                         $4,100*                          $9,292*                          $13,392
  all large firms (200 or more Workers)                                                   $3,231*                         $10,613*                          $13,844

 pos
  all small firms (3–199 Workers)                                                         $4,647*                          $8,200*                          $12,847


                                                                                                                                                                                           Worker and Employer Contributions for Premiums
  all large firms (200 or more Workers)                                                   $3,348*                         $10,091*                          $13,439

 hDhp/so
  all small firms (3–199 Workers)                                                         $2,920                            $7,339*                         $10,259*
  all large firms (200 or more Workers)                                                   $2,430                            $9,455*                         $11,885*

 All plANs
  all small firms (3–199 Workers)                                                         $4,204*                          $8,493*                          $12,696*
  all large firms (200 or more Workers)                                                   $3,182*                         $10,522*                          $13,704*


                        source:

             kaiser/hret survey of employer-sponsored health Benefits, 2009.

          * estimates are statistically different within plan type between all small firms and all large firms (p.05).


                                                                                                                                                                                           6


                                                                                                                                                                                                 section six


                                                                                                                                                                                      77
                                                               t h e k a i s e r fa m i ly f o u n d at i o n - a n d - h e a lt h r e s e a r C h  e d u C at i o n a l t r u s t
Employer Health Benefits          2 0 0 9 A n n u a l s u r ve y


                                                          e x h i B i t 6. 11

                                                           average m onthly and annual Worker Premium Contr ibutions Paid by Covered Wor kers for single
                                                           and family Coverage, by Plan type and fir m size, 2009


                                                                                                                                                      monthly                                 annual

                                                                                                                                single Coverage                family Coverage   single Coverage   family Coverage

                                                          hmo
                                                           all small firms (3–199 Workers)                                                $59                          $420*          $714             $5,039*
                                                           all large firms (200 or more Workers)                                           71                           268*           855              3,214*
                                                          All firm sizes                                                                  $68                           $307          $817             $3,685

                                                          ppo
                                                           all small firms (3–199 Workers)                                                $52*                          $342*         $619*            $4,100*
                                                           all large firms (200 or more Workers)                                           73*                           269*          878*             3,231*
                                                          All firm sizes                                                                  $67                           $289          $806             $3,470
Worker and Employer Contributions for Premiums


                                                          pos
                                                           all small firms (3–199 Workers)                                                $56                           $387*         $677             $4,647*
                                                           all large firms (200 or more Workers)                                           70                            279*          845              3,348*
                                                          All firm sizes                                                                  $62                           $346          $741             $4,146

                                                          hDhp/so
                                                           all small firms (3–199 Workers)                                                $38*                          $243          $457*            $2,920
                                                           all large firms (200 or more Workers)                                           52*                           202           622*             2,430
                                                          All firm sizes                                                                  $45                           $223          $540             $2,672

                                                          All plANs
                                                           all small firms (3–199 Workers)                                                $52*                          $350*         $625*            $4,204*
                                                           all large firms (200 or more Workers)                                           71*                           265*          854*             3,182*
                                                          All firm sizes                                                                  $65                           $293          $779             $3,515


                                                                                source:
                                             6
                                                                         kaiser/hret survey of employer-sponsored health Benefits, 2009.
section six


                                                                      * estimates are statistically different within plan type between all small firms and all large firms (p.05).


                                                 78
                                                      t h e k a i s e r fa m i ly f o u n d at i o n - a n d - h e a lt h r e s e a r C h  e d u C at i o n a l t r u s t
Employer Health Benefits          2 0 0 9 An n u a l s u r ve y


e x h i B i t 6.1 2

average m onthly and annual Worker Premium Contr ibutions Paid by Covered Wor kers for single
and family Coverage, by Plan type and region, 2009


                                                                                 monthly                                                        annual

                                                             single Coverage              family Coverage                single Coverage                family Coverage

hmo
 northeast                                                            $87*                         $283                         $1,043*                        $3,390
 midwest                                                               66                           262                            796                          3,142
 south                                                                 66                           318                            795                          3,822
 West                                                                  57                           329                            685                          3,950
All regioNs                                                           $68                          $307                          $817                          $3,685

ppo
 northeast                                                            $78*                         $277                           $941*                        $3,319
 midwest                                                               71                           278                            847                          3,330


                                                                                                                                                                                            Worker and Employer Contributions for Premiums
 south                                                                 63                           300                            751                          3,596
 West                                                                  61                           296                            728                          3,550
All regioNs                                                           $67                          $289                           $806                         $3,470

pos
 northeast                                                            $79                          $334                           $946                         $4,007
 midwest                                                               65                           272*                           777                          3,262*
 south                                                                 58                           382                            698                          4,588
 West                                                                  49                           358                            591                          4,296
All regioNs                                                           $62                          $346                           $741                         $4,146

hDhp/so
 northeast                                                            $47                          $227                           $559                         $2,730
 midwest                                                               49                           198                            588                          2,375
 south                                                                 51                           250                            606                          2,999
 West                                                                  30*                          223                            354*                         2,681
All regioNs                                                           $45                          $223                           $540                         $2,672                       6
All plANs


                                                                                                                                                                                                  section six
 northeast                                                            $79*                         $282                           $946*                        $3,381
 midwest                                                               67                           264*                           799                          3,174*
 south                                                                 62                           308                            743                          3,699
 West                                                                  56*                          307                            667*                         3,682
All regioNs                                                           $65                          $293                           $779                         $3,515


                  source:

             kaiser/hret survey of employer-sponsored health Benefits, 2009.

          * estimate is statistically different within plan type from estimate for all other firms not in the indicated region (p.05).


                                                                                                                                                                                       79
                                                                t h e k a i s e r fa m i ly f o u n d at i o n - a n d - h e a lt h r e s e a r C h  e d u C at i o n a l t r u s t
Employer Health Benefits          2 0 0 9 A n n u a l s u r ve y


                                                         e x h i B i t 6. 13

                                                          average m onthly Worker Premium Contr ibutions Paid by Covered Wor kers for single and family
                                                          Coverage, by Plan type, 1999–2009


                                                                                              1999          2000           2001          2002          2003           2004   2005     2006   2007    2008    2009

                                                          single Coverage
                                                            hmo                                $28            $26           $32           $38           $42           $46     $47     $49     $59     $59        $68
                                                            PPo                                 27             29            29            39*           44            48      50      53      60*     61         67*
                                                            Pos                                 27             28            29            40*           41            45      61*     53      52      72         62
                                                            hdhP/so                              ^              ^             ^             ^             ^             ^       ^      47      43      39         45
                                                          All plANs                            $27            $28           $30           $39*          $42           $47     $51     $52     $58*    $60        $65

                                                          family Coverage
                                                            hmo                              $124           $131           $150        $164           $179          $223*    $217  $257*     $276    $282    $307
                                                            PPo                               128            141            153         188*           210*          224      220   243*      270*    279     289
                                                            Pos                               141            136            143         180*           206           218      271*  269       305     311     346
Worker and Employer Contributions for Premiums


                                                            hdhP/so                             ^              ^              ^           ^              ^             ^        ^   187       238     234     223
                                                          All plANs                          $129           $135           $149*       $178*          $201*         $222*    $226 $248*      $273*   $280    $293


                                                                               source:

                                                                         kaiser/hret survey of employer-sponsored health Benefits, 1999–2009.

                                                                      * estimate is statistically different from estimate for the previous year shown (p.05).
                                                                      ^ information was not obtained for hdhP/sos prior to 2006.


                                                         e x h i B i t 6. 14

                                                          distr ibution of Worker Premium Contr ibutions for single and family Coverage r elative to the
                                                          average annual Worker Premium Contr ibution, 2009


                                                                                          single Coverage                                                                        family Coverage
                                             6                   Premium range,                                  Percent Covered                                  Premium range,              Percent Covered
                                                                  dollar amount                                  Workers in range                                  dollar amount              Workers in range
section six


                                                                   less than $623                                           41%                                    less than $2,812                  43%
                                                                   $623 to $779                                            11%                                   $2,812 to $3,515                  15%
                                                                   $779 to $935                                            11%                                   $3,515 to $4,218                  13%
                                                                    $935 or more                                            37%                                     $4,218 or more                   28%


                                                                               source:

                                                                         kaiser/hret survey of employer-sponsored health Benefits, 2009.

                                                                      note: the average annual worker contribution is $779 for single coverage and $3,515 for family coverage. the worker
                                                                      contribution distribution is relative to the average single or family worker contribution. for example, $623 is 80% of the
                                                                      average single worker contribution and $935 is 120% of the average single worker contribution. the same break points
                                                                      relative to the average are used for the distribution for family coverage.


                                                 80
                                                      t h e k a i s e r fa m i ly f o u n d at i o n - a n d - h e a lt h r e s e a r C h  e d u C at i o n a l t r u s t
Employer Health Benefits          2 0 0 9 An n u a l s u r ve y


e x h i B i t 6.1 5

distr ibution of Percentage of Premium Paid by Covered Wor kers for single and family Coverage,
2001–2009


   SINGLE
COVERAGE      2001                          32%                                                     50%                                                 15%           3%
              2002*                   24%                                                     58%                                                      13%           5%
              2003*                   24%                                                     57%                                                       17%           3%
              2004*               21%                                                   56%                                                          21%                    2%
              2005                21%                                                   57%                                                          19%              3%
              2006                23%                                                      56%                                                        18%                   2%
              2007               20%                                                  56%                                                           21%                     2%
              2008               20%                                                     59%                                                           19%                  2%
              2009*              18%                                                     58%                                                          22%                   1%


                                                                                                                                                                                            Worker and Employer Contributions for Premiums
  FAMILY
COVERAGE      2001              14%                                44%                                                     27%                               15%
              2002*         9%                                46%                                                       29%                                 16%
              2003*        8%                                47%                                                           31%                                14%
              2004*        7%                            44%                                                           36%                                    13%
              2005*         9%                                46%                                                          32%                                13%
              2006          9%                             42%                                                          37%                                    12%
              2007*        6%                             47%                                                          31%                                  15%
              2008         7%                              46%                                                          33%                                  14%
              2009         6%                              48%                                                             33%                                12%

                      0%                      20%                         40%                             60%                            80%                            100%


                  source:
                                                                                                                      0%
             kaiser/hret survey of employer-sponsored health Benefits, 2001–2009.                                     GREATER THAN 0%, LESS THAN OR EQUAL TO 25%


          * distribution is statistically different within coverage type from distribution
                                                                                                                      GREATER THAN 25%, LESS THAN OR EQUAL TO 50%                           6
                                                                                                                      GREATER THAN 50%
            for the previous year shown (p.05).


                                                                                                                                                                                                  section six


                                                                                                                                                                                       81
                                                                t h e k a i s e r fa m i ly f o u n d at i o n - a n d - h e a lt h r e s e a r C h  e d u C at i o n a l t r u s t
Employer Health Benefits          2 0 0 9 A n n u a l s u r ve y


                                                         e x h i B i t 6. 16

                                                          distr ibution of Percentage of Premium Paid by Covered Wor kers for single Coverage, by fir m size,
                                                          2001–2009


                                                          ALL SMALL FIRMS
                                                          3 199 WORKERS 2001                                                    57%                                                       25%                13%       5%
                                                                                2002*                                  45%                                                     35%                        13%         8%
                                                                                2003                                   45%                                                     35%                         14%         6%
                                                                                2004                                42%                                                      35%                          17%          5%
                                                                                2005                                41%                                                      36%                          18%          6%
                                                                                2006                                  43%                                                      38%                           14%        4%
                                                                                2007                                  44%                                                      36%                          16%         4%
                                                                                2008                               40%                                                       40%                           16%         5%
                                                                                2009                               39%                                                       40%                            19%         3%
Worker and Employer Contributions for Premiums


                                                          ALL LARGE FIRMS
                                                             200 OR MORE 2001                      19%                                                            63%                                           16%          2%
                                                                WORKERS
                                                                          2002*                 14%                                                            69%                                            14%       4%
                                                                                2003*          14%                                                           67%                                             18%             1%
                                                                                2004*         11%                                                       65%                                                23%               1%
                                                                                2005          12%                                                         67%                                                20%             1%
                                                                                2006           13%                                                         66%                                               20%             1%
                                                                                2007*        9%                                                      66%                                                  23%                2%
                                                                                2008         10%                                                        68%                                                  20%             1%
                                                                                2009*        8%                                                     67%                                                    24%               1%

                                                                                        0%                          20%                           40%                         60%                   80%                   100%


                                                                               source:
                                                                                                                                                                                     0%
                                                                         kaiser/hret survey of employer-sponsored health Benefits, 2001–2009.                                        GREATER THAN 0%, LESS THAN OR EQUAL TO 25%

                                             6                        * distribution is statistically different within size category from distribution
                                                                                                                                                                                     GREATER THAN 25%, LESS THAN OR EQUAL TO 50%

                                                                                                                                                                                     GREATER THAN 50%
                                                                        for the previous year shown (p.05).
section six


                                                 82
                                                      t h e k a i s e r fa m i ly f o u n d at i o n - a n d - h e a lt h r e s e a r C h  e d u C at i o n a l t r u s t
Employer Health Benefits          2 0 0 9 An n u a l s u r ve y


e x h i B i t 6.1 7

distr ibution of Percentage of Premium Paid by Covered Wor kers for family Coverage, by fir m size,
2001–2009


ALL SMALL FIRMS
3 199 WORKERS 2001                             27%                      18%                              25%                                      30%
                      2002*              18%                   23%                                   28%                                         31%
                      2003              15%                   28%                                      26%                                       31%
                      2004*             15%            17%                                      39%                                                28%
                      2005*              18%                  22%                                         37%                                          23%
                      2006               17%               20%                                        38%                                             24%
                      2007*             13%                25%                                25%                                            37%
                      2008*             13%                27%                                        31%                                          30%
                      2009              14%                 28%                                        28%                                         30%


                                                                                                                                                                                             Worker and Employer Contributions for Premiums
ALL LARGE FIRMS
   200 OR MORE 2001                7%                                  57%                                                             28%                          8%
      WORKERS
                2002           5%                                   57%                                                              29%                           9%
                      2003*    4%                                  57%                                                                 33%                           6%
                      2004     4%                                 56%                                                                 34%                            6%
                      2005         5%                               57%                                                               30%                           7%
                      2006*    5%                                 54%                                                                 36%                             5%
                      2007*   3%                                  58%                                                                   34%                           5%
                      2008     4%                                 56%                                                                 34%                            6%
                      2009*    2%                                58%                                                                    36%                           4%

                              0%                     20%                       40%                           60%                           80%                           100%


                  source:
                                                                                                                       0%
             kaiser/hret survey of employer-sponsored health Benefits, 2001–2009.                                      GREATER THAN 0%, LESS THAN OR EQUAL TO 25%


          * distribution is statistically different within size category from distribution
                                                                                                                       GREATER THAN 25%, LESS THAN OR EQUAL TO 50%                           6
                                                                                                                       GREATER THAN 50%
            for the previous year shown (p.05).


                                                                                                                                                                                                   section six


                                                                                                                                                                                        83
                                                                 t h e k a i s e r fa m i ly f o u n d at i o n - a n d - h e a lt h r e s e a r C h  e d u C at i o n a l t r u s t
Employer Health Benefits          2 0 0 9 A n n u a l s u r ve y


                                                         e x h i B i t 6. 18

                                                          average Percentage of Premiums Paid by Covered Wor kers for single Coverage, by fir m
                                                          Charac teristics, 2009


                                                                                                                                                                                  all large firms
                                                                                                                                                                all small firms
                                                                                                                                                                                   (200 or more     all firms
                                                                                                                                                               (3–199 Workers)
                                                                                                                                                                                      Workers)
                                                          Wage level
                                                           few Workers are lower-Wage (less than 35% earn                                                                13%*          18%           16%*
                                                             $23,000 a year or less)
                                                           many Workers are lower-Wage (35% or more earn                                                                 20%*          19%           20%*
                                                             $23,000 a year or less)

                                                          unions
                                                           firm has at least some union Workers                                                                           8%*          17%           16%
                                                           firm does not have any union Workers                                                                          15%*          19%           17%
Worker and Employer Contributions for Premiums


                                                          Age
                                                           less than 35% of Workers are 26 years old or less                                                             14%           18%           17%
                                                           35% or more Workers are 26 years old or less                                                                  15%           21%           19%

                                                          funding Arrangement
                                                           fully insured                                                                                                 14%           18%           15%*
                                                           self-funded                                                                                                   15%           18%           18%*


                                                                               source:

                                                                         kaiser/hret survey of employer-sponsored health Benefits, 2009.

                                                                      * estimates are statistically different from each other within firm size category (p.05).


                                             6
section six


                                                 84
                                                      t h e k a i s e r fa m i ly f o u n d at i o n - a n d - h e a lt h r e s e a r C h  e d u C at i o n a l t r u s t
Employer Health Benefits          2 0 0 9 An n u a l s u r ve y


e x h i B i t 6.1 9

average Percentage of Premium Paid by Covered Wor kers for family Coverage, by fir m
Charac ter istics, 2009


                                                                                                                         all large firms
                                                                                          all small firms
                                                                                                                          (200 or more                       all firms
                                                                                         (3–199 Workers)
                                                                                                                             Workers)
 Wage level
  few Workers are lower-Wage (less than 35% earn                                                    33%*                        23%*                            26%*
    $23,000 a year or less)
  many Workers are lower-Wage (35% or more earn                                                     46%*                        29%*                            35%*
    $23,000 a year or less)

 unions
  firm has at least some union Workers                                                              26%                         21%*                            21%*
  firm does not have any union Workers                                                              35%                         26%*                            30%*


                                                                                                                                                                                           Worker and Employer Contributions for Premiums
 Age
  less than 35% of Workers are 26 years old or less                                                 34%                         23%*                            27%*
  35% or more Workers are 26 years old or less                                                      41%                         29%*                            33%*

 funding Arrangement
  fully insured                                                                                     36%                         27%*                            33%*
  self-funded                                                                                       29%                         23%*                            23%*


                      source:

              kaiser/hret survey of employer-sponsored health Benefits, 2009.

          * estimates are statistically different from each other within firm size category (p.05).


                                                                                                                                                                                           6


                                                                                                                                                                                                 section six


                                                                                                                                                                                      85
                                                               t h e k a i s e r fa m i ly f o u n d at i o n - a n d - h e a lt h r e s e a r C h  e d u C at i o n a l t r u s t
Employer Health Benefits          2 0 0 9 A n n u a l s u r ve y


                                                         e x h i B i t 6. 20

                                                          average Percentage of Premium Paid by Covered Workers for single and family Coverage, by Plan
                                                          type and firm size, 2009


                                                                                                                                                                             single Coverage   family Coverage

                                                          hmo
                                                           all small firms (3–199 Workers)                                                                                        18%               42%*
                                                           all large firms (200 or more Workers)                                                                                  18                23*
                                                          All firm sizes                                                                                                          18%               28%

                                                          ppo
                                                           all small firms (3–199 Workers)                                                                                        13%*              33%*
                                                           all large firms (200 or more Workers)                                                                                  19*               24*
                                                          All firm sizes                                                                                                          17%               26%

                                                          pos
Worker and Employer Contributions for Premiums


                                                           all small firms (3–199 Workers)                                                                                        15%               36%*
                                                           all large firms (200 or more Workers)                                                                                  18                25*
                                                          All firm sizes                                                                                                          16%               32%

                                                          hDhp/so
                                                           all small firms (3–199 Workers)                                                                                        12%               28%*
                                                           all large firms (200 or more Workers)                                                                                  15                21*
                                                          All firm sizes                                                                                                          14%               25%

                                                          All plANs
                                                           all small firms (3–199 Workers)                                                                                        14%*              35%*
                                                           all large firms (200 or more Workers)                                                                                  18*               24*
                                                          All firm sizes                                                                                                          17%               27%


                                                                               source:


                                             6                           kaiser/hret survey of employer-sponsored health Benefits, 2009.


                                                                      * estimates are statistically different within plan type between all small firms and all large firms (p.05).
section six


                                                 86
                                                      t h e k a i s e r fa m i ly f o u n d at i o n - a n d - h e a lt h r e s e a r C h  e d u C at i o n a l t r u s t
Employer Health Benefits          2 0 0 9 An n u a l s u r ve y


e x h i B i t 6.2 1

 average Percentage of Premium Paid by Covered Workers for single and family Coverage, by Plan
 type, 1999–2009


                                1999        2000        2001         2002          2003           2004          2005          2006           2007          2008          2009

 single Coverage
   hmo                          16%          14%         18%          16%           17%           16%           16%            15%           17%           16%            18%
   PPo                          13           14          13           16*           16            16            15             15            17            16             17
   Pos                          15           14          13           16*           16            16            19             16            14            18             16
   hdhP/so                       ^            ^           ^            ^             ^             ^             ^             18            15            11             14
 All plANs                      14%          14%         14%          16%           16%           16%           16%            16%           16%           16%            17%

 family Coverage
   hmo                          28%          26%         29%          27%           26%           29%           26%            28%           28%           26%            28%
   PPo                          26           27          26           29*           28            27            25             26            27            27             26
   Pos                          28           26          25           28            28            28            31             30            32            31             32


                                                                                                                                                                                            Worker and Employer Contributions for Premiums
   hdhP/so                       ^            ^           ^            ^             ^             ^             ^             25            27            29             25
 All plANs                      27%          26%         26%          28%           27%           28%           26%            27%           28%           27%            27%


                  source:

              kaiser/hret survey of employer-sponsored health Benefits, 1999–2009.

           * estimate is statistically different from estimate for the previous year shown (p.05).
           ^ information was not obtained for hdhP/sos prior to 2006.


                                                                                                                                                                                            6


                                                                                                                                                                                                  section six


                                                                                                                                                                                       87
                                                                t h e k a i s e r fa m i ly f o u n d at i o n - a n d - h e a lt h r e s e a r C h  e d u C at i o n a l t r u s t
Employer Health Benefits          2 0 0 9 A n n u a l s u r ve y


                                                         e x h i B i t 6. 22

                                                          average Percentage of Premium Paid by Covered Workers for single and family Coverage, by Plan
                                                          type and region, 2009


                                                                                                                                                                             single Coverage          family Coverage

                                                          hmo
                                                           northeast                                                                                                              21%*                     25%
                                                           midwest                                                                                                                17                       23*
                                                           south                                                                                                                  17                       29
                                                           West                                                                                                                   16                       33
                                                          All regioNs                                                                                                             18%                      28%

                                                          ppo
                                                           northeast                                                                                                              19%                      23%*
                                                           midwest                                                                                                                18                       25
                                                           south                                                                                                                  16                       28
Worker and Employer Contributions for Premiums


                                                           West                                                                                                                   16                       28
                                                          All regioNs                                                                                                             17%                      26%

                                                          pos
                                                           northeast                                                                                                              20%                      30%
                                                           midwest                                                                                                                17                       26
                                                           south                                                                                                                  15                       37
                                                           West                                                                                                                   14                       31
                                                          All regioNs                                                                                                             16%                      32%

                                                          hDhp/so
                                                           northeast                                                                                                              14%                      27%
                                                           midwest                                                                                                                15                       21
                                                           south                                                                                                                  15                       26
                                                           West                                                                                                                    9*                      26
                                                          All regioNs                                                                                                             14%                      25%
                                             6
                                                          All plANs
                                                           northeast                                                                                                              19%*                     25%*
section six


                                                           midwest                                                                                                                17                       24*
                                                           south                                                                                                                  16                       29
                                                           West                                                                                                                   15                       30
                                                          All regioNs                                                                                                             17%                      27%


                                                                               source:

                                                                         kaiser/hret survey of employer-sponsored health Benefits, 2009.


                                                                      * estimate is statistically different within plan type from estimate for all other firms not in the indicated region (p.05).


                                                 88
                                                      t h e k a i s e r fa m i ly f o u n d at i o n - a n d - h e a lt h r e s e a r C h  e d u C at i o n a l t r u s t
Employer Health Benefits          2 0 0 9 An n u a l s u r ve y


e x h i B i t 6.2 3

 average Percentage of Premium Paid by Covered Wor kers, by Plan type and i ndustr y, 2009


                                                                                           single Coverage                      family Coverage

 hmo
  agriculture/mining/Construction                                                                  nsd                                  nsd
  manufacturing                                                                                     18%                                  28%
  transportation/Communications/utilities                                                           15                                   21
  Wholesale                                                                                        nsd                                  nsd
  retail                                                                                            24                                   49*
  finance                                                                                           19                                   29
  service                                                                                           17                                   31
  state/local Government                                                                            11*                                  19*
  health Care                                                                                       14                                   20*
 All iNDusTries                                                                                     18%                                  28%


                                                                                                                                                                        Worker and Employer Contributions for Premiums
 ppo
  agriculture/mining/Construction                                                                    18%                                   31%
  manufacturing                                                                                      19                                    24
  transportation/Communications/utilities                                                            16                                    20*
  Wholesale                                                                                          24*                                   32*
  retail                                                                                             21                                    32*
  finance                                                                                            20                                    27
  service                                                                                            16                                    27
  state/local Government                                                                             11*                                   23
  health Care                                                                                        13*                                   24
 All iNDusTries                                                                                      17%                                   26%

 pos
  agriculture/mining/Construction                                                                  nsd                                  nsd
  manufacturing                                                                                     16%                                  26%
  transportation/Communications/utilities                                                          nsd                                  nsd
  Wholesale                                                                                        nsd                                  nsd                             6
  retail                                                                                           nsd                                  nsd
  finance                                                                                          nsd                                  nsd


                                                                                                                                                                              section six
  service                                                                                           13                                    31
  state/local Government                                                                           nsd                                  nsd
  health Care                                                                                       13                                   38
 All iNDusTries                                                                                     16%                                  32%

                                                                                                                           Continued on next page


                                                                                                                                                                   89
                                            t h e k a i s e r fa m i ly f o u n d at i o n - a n d - h e a lt h r e s e a r C h  e d u C at i o n a l t r u s t
Employer Health Benefits          2 0 0 9 A n n u a l s u r ve y


                                                         e x h i B i t 6. 23         Continued from previous page

                                                          average Percentage of Premium Paid by Covered Wor kers, by Plan type and i ndustr y, 2009


                                                                                                                                                                             single Coverage            family Coverage

                                                          hDhp/so
                                                           agriculture/mining/Construction                                                                                       nsd                        nsd
                                                           manufacturing                                                                                                          18%                         21%
                                                           transportation/Communications/utilities                                                                               nsd                        nsd
                                                           Wholesale                                                                                                             nsd                        nsd
                                                           retail                                                                                                                nsd                        nsd
                                                           finance                                                                                                                10                         22
                                                           service                                                                                                                12                         26
                                                           state/local Government                                                                                                nsd                        nsd
                                                           health Care                                                                                                            11                         30
                                                          All iNDusTries                                                                                                          14%                        25%
Worker and Employer Contributions for Premiums


                                                          All plANs
                                                           agriculture/mining/Construction                                                                                        19%                        33%
                                                           manufacturing                                                                                                          19                         25
                                                           transportation/Communications/utilities                                                                                16                         20*
                                                           Wholesale                                                                                                              23*                        31
                                                           retail                                                                                                                 22*                        36*
                                                           finance                                                                                                                18                         27
                                                           service                                                                                                                16                         28
                                                           state/local Government                                                                                                 10*                        21*
                                                           health Care                                                                                                            13*                        25
                                                          All iNDusTries                                                                                                          17%                        27%


                                                                               source:

                                                                         kaiser/hret survey of employer-sponsored health Benefits, 2009.

                                             6                        * estimate is statistically different within plan type from estimate for all other firms not in the indicated industry (p.05).
                                                                      nsd: not sufficient data.
section six


                                                 90
                                                      t h e k a i s e r fa m i ly f o u n d at i o n - a n d - h e a lt h r e s e a r C h  e d u C at i o n a l t r u s t
60%

                                      $4,8 2 4
           Employer Health Benefits
$ 13,375
              2009 annual surVey


             Employee
            Cost Sharing


                 section


                     7


           2009
Employer Health Benefits          2 0 0 9 A n n u a l s u r ve y


                                          e M p loy e e Co S t S h a r i n g


                                                 in   addiTion To any required premium conTribuTions , covered workers may face cosT sharing for The

                                                 medical services ThaT They use .                     c osT   sharing for medical services can Take a varieTy of forms , including

                                                 deducTibles ( an amounT ThaT musT be paid before some or all ser vices are covered ), copaymenTs ( fixed

                                                 dollar amounTs ), and / or coinsurance ( a percenTage of The charge for ser vices ).                                    T he   Type and level of

                                                 cosT sharing ofTen varies by The Type of plan in which The worker is enrolled .                                   c osT sharing may also vary
                                                 by The Type of service received such as office visiTs , hospiTalizaTions , or prescripTion drugs .


                                                 T he     cosT sharing amounTs reporTed here are for covered workers using services provided in - neTwork by

                                                 parTicipaTing providers .             p lan enrollees receiving services from providers ThaT do noT parTicipaTe in plan
                                                 neTworks ofTen musT pay higher deducTibles , copaymenTs , or coinsurance , and may be responsible for

                                                 charges ThaT exceed plan allowable amounTs .                              we    also would noTe ThaT we do noT collecT informaTion

                                                 on all of The plan provisions and limiTs ThaT affecT enrollee ouT - of - pockeT liabiliTy.                                        a lThough     we

                                                 have increased The number of survey quesTions abouT cosT - sharing liabiliTy, we cannoT reasonably wiTh

                                                 The framework of This sur vey capTure all of The complex cosT - sharing requiremenTs in modern plans ,

                                                 par Ticularly Those for ancillar y ser vices ( such as durable medical equipmenT or physical Therapy ) or

                                                 ThaT vary across differenT seTTings ( such as Tiered neTworks ).


                                                 geNerAl ANNuAl DeDuC Tibles                                                                   POS plans, and 66% of workers in PPOs are
                                                    A general annual deductible is an amount that must                                       in plans that require cost sharing for hospital
                                                      be paid by the enrollee before all or most services                                      admissions (Exhibit 7.2). The percentages are
                                                      are covered by their health plan. The likelihood of                                      similar for family coverage.
                                                      having a deductible varies by plan type.                                          Deductibles vary greatly by plan type and firm size.
                                                         Workers in HMOs are least likely to have a                                      For most plan types, the deductible levels for single
Employee Cost Sharing


                                                          general annual deductible for single coverage.                                  and family coverage are similar to the amounts
                                                          Eighty-four percent of workers in HMOs with                                     reported in 2008.
                                                          single coverage do not have a general annual                                        From 2008 to 2009, the average annual
                                                          deductible, compared to 38% of workers in POS                                        deductible for workers in HMOs increased
                                                          plans and 26% of workers in PPOs (Exhibit 7.1).                                      from $503 to $699 for single coverage (Exhibit
                                                          The percentages are similar for family coverage.                                     7.5) and from $1,053 to $1,524 for family
                                                          There has been no change in the percentage of                                        coverage (Exhibit 7.12). For each of the other
                                                          workers without a general annual deductible                                          plan types, there is no statistically significant
                        7                                 since 2008; however, for POS plans, since 2007,
                                                          the percentage of workers without a deductible
                                                                                                                                               increase from 2008 to 2009 for single or family
                                                                                                                                               coverage. Since 2006, the earliest year for which
                                                          decreased from 52% to 38% for workers with                                           we have comparable deductible data, the average
 section seven


                                                          single coverage.                                                                     deductible for workers with PPOs has increased
                                                         Workers without a general annual plan                                                from $473 in 2006 to $634 in 2009 for single
                                                          deductible often have other forms of cost sharing                                    coverage (Exhibit 7.5) and, for aggregate family
                                                          for medical services. For workers without a                                          deductibles, from $1,034 in 2006 to $1,488 in
                                                          general annual deductible for single coverage,                                       2009 (Exhibit 7.12).
                                                          68% of workers in HMOs, 71% of workers in


                            92
                                 t h e k a i s e r fa m i ly f o u n d at i o n - a n d - h e a lt h r e s e a r C h  e d u C at i o n a l t r u s t
Employer Health Benefits          2 0 0 9 An n u a l s u r ve y


   For PPOs, POS plans, and HDHP/SOs, the                         The percentage of workers with deductibles of $1,000
    average annual deductibles among those workers                   or more for single coverage continues to increase.
    with a deductible for single coverage are $634,
                                                                        From 2006 to 2009, the percentage of covered
    $1,061, and $1,838, respectively (Exhibit 7.5).
                                                                         workers with a deductible of $1,000 or more
   Deductibles are generally higher for covered                         for single coverage has more than doubled,
    workers in plans sponsored by small firms (3–199                     from 10% to 22%. Workers in small firms
    workers) than covered workers in large firms (200                    (3–199 workers) are more likely to have a general
    or more workers) (Exhibit 7.3).                                      annual deductible of $1,000 or more for single
                                                                         coverage than workers in large firms (200 or
   For family coverage, the majority of workers with
                                                                         more workers) (40% vs. 13%) (Exhibit 7.6).
    general annual deductibles have an aggregate
                                                                         In the past year, for workers in large firms, the
    deductible, meaning all family members’ out-
                                                                         percentage has grown from 9% in 2008 to 13%
    of-pocket expenses count toward meeting the
                                                                         in 2009, while there has been no significant
    deductible amount. Among those with a general
                                                                         increase in the percentage of workers in small
    annual deductible for family coverage, the
                                                                         firms with high deductibles (Exhibit 7.7).
    percentage of covered workers with an aggregate
    general annual deductible ranges from 62% for                  The majority of covered workers with a deductible
    PPOs to 89% for HDHP/SOs.                                        are in plans where the deductible does not have to
                                                                     be met before certain services, such as physician
   The average amounts for workers with an
                                                                     office visits, preventive care, or prescription drugs,
    aggregate deductible for family coverage are
                                                                     are covered.
    $1,524 for HMOs, $1,488 for PPOs, $2,191
    for POS plans, and $3,626 for HDHP/SOs                              Roughly three-quarters of covered workers with
    (Exhibit 7.11).                                                      general plan deductibles in PPOs and POS plans
                                                                         and over four-fifths in HMOs are enrolled in
   The other type of family deductible, a separate
                                                                         plans where the deductible does not have to be
    per-person deductible, requires each family
                                                                         met before physician office visits for primary care
    member to meet a separate per-person deductible
                                                                         are covered and about 90% of covered workers in
    amount before the plan covers expenses for that
                                                                         HMOs, PPOs, POS plans, and HDHP/SOs do
    member. Most plans with separate per-person
                                                                         not have to meet the deductible before preventive
    family deductibles consider the deductible met
                                                                         care is covered (Exhibit 7.16).
    if a prescribed number of family members each
    reach their separate deductible amounts.                            Similarly, among workers with a general annual
                                                                         deductible, almost 90% of covered workers in
   For covered workers in health plans that have
                                                                         HMOs and about 90% of workers in PPOs and


                                                                                                                                                                      Employee Cost Sharing
    separate per-person general annual deductible
                                                                         POS plans are enrolled in plans where the general
    amounts for family coverage, the average plan
                                                                         annual deductible does not have to be met before
    deductible amounts are $686 for HMOs, $633
                                                                         prescription drugs are covered (Exhibit 7.16).
    for PPOs, $1,050 for POS plans, and $2,091
    for HDHP/SOs (Exhibit 7.11). Most covered                    h o s p i TA l C o s T s h A r i N g
    workers in plans with a separate general annual
                                                                   We continue to examine and sometimes modify
    deductible for family coverage have a limit to
                                                                     the questions on hospital and outpatient surgery
    the number of family members required to meet
                                                                     cost sharing because this can be a complex
    the separate deductible amounts (Exhibit 7.14).
    Among those workers in plans with a limit on the
                                                                     component of health benefit plans. As in past                                                    7
                                                                     years, we collected information on the cost-
    number of family members, the average number
                                                                     sharing provisions for hospital admissions and
                                                                                                                                                                          section seven


    of family members required to meet the separate
                                                                     outpatient surgery that is in addition to any
    deductible amounts is three for PPOs and two for
                                                                     general annual plan deductible. However, for
    HMOs, POS plans, and HDHP/SOs.
                                                                     the 2009 survey, in order to better capture the


                                                                                                                                                                 93
                                          t h e k a i s e r fa m i ly f o u n d at i o n - a n d - h e a lt h r e s e a r C h  e d u C at i o n a l t r u s t
Employer Health Benefits          2 0 0 9 A n n u a l s u r ve y


                                                     prevalence of combinations of cost sharing,                                               workers with cost sharing for each outpatient
                                                     the survey was changed to ask a series of yes or                                          surgery episode, the average coinsurance is 19%,
                                                     no questions. Previously, the question asked                                              the average copayment is $110, and the average
                                                     respondents to select one response from a list of                                         separate annual outpatient surgery deductible is
                                                     types of cost sharing, such as separate deductibles,                                      $500 (Exhibit 7.19).
                                                     copayments, coinsurance, and per diem payments
                                                                                                                                      CosT shAriNg for physiCiAN offiCe visiTs
                                                     (for hospitalization only). Due to the change
                                                     in question format, the distribution of workers                                    The majority of covered workers are enrolled
                                                     with types of cost sharing does not equal 100% as                                    in health plans that require cost sharing for an
                                                     workers may face a combination of types of cost                                      in-network physician office visit, in addition to any
                                                     sharing. In addition, the average copayment and                                      general annual deductible.1
                                                     coinsurance rate for hospital admissions include
                                                                                                                                              The most common form of physician office
                                                     workers that may have a combination of types of
                                                                                                                                               visit cost sharing for in-network services is
                                                     cost sharing.
                                                                                                                                               copayments. Seventy-seven percent of covered
                                                   Whether or not a worker has a general annual                                              workers have a copayment for a physician office
                                                     deductible, most workers face additional types of                                         visit and 14% have coinsurance. Workers
                                                     cost sharing when admitted to a hospital, such as a                                       in HMOs, PPOs, and POS plans are much
                                                     copayment, coinsurance, or a per diem charge.                                             more likely to have copayments than workers
                                                                                                                                               in HDHP/SOs (Exhibit 7.20). The majority
                                                        The majority of workers have copayments or
                                                                                                                                               of workers in HDHP/SOs have coinsurance
                                                         coinsurance when they are admitted to a hospital,
                                                                                                                                               (44%) or no cost sharing (39%) for physician
                                                         whether or not the worker has a general annual
                                                                                                                                               office visits after the deductible is met
                                                         deductible (Exhibit 7.17). Fifty-one percent
                                                                                                                                               (Exhibit 7.20).
                                                         of covered workers have coinsurance and 19%
                                                         have copayments for hospital admissions. Lower                                       Among covered workers with a copayment for
                                                         percentages of workers have per day (per diem)                                        in-network physician office visits, the average
                                                         payments (5%), a separate hospital deductible                                         copayment is $20 for primary care and $28 for
                                                         (5%), or both copayments and coinsurance                                              specialty physicians (Exhibit 7.21). In 2008,
                                                         (8%), while 22% have no cost sharing for                                              the average copayments were $19 for primary
                                                         hospital admissions. For hospital admissions,                                         care and $26 for specialty care. While the
                                                         the average coinsurance rate is 18%, the average                                      increases between 2008 and 2009 are small, they
                                                         copayment is $234 per hospital admission,                                             are statistically significant. Fifty-six percent of
                                                         the average per diem charge is $179, and the                                          covered workers have a copayment of $15 or
                                                         average separate hospital deductible is $862                                          $20 for a primary care office visit (Exhibit 7.22).
Employee Cost Sharing


                                                         (Exhibit 7.19).                                                                       For specialty care office visits, 32% of covered
                                                                                                                                               workers have copayments of $20 or $25
                                                        The cost-sharing provisions for outpatient surgery
                                                                                                                                               (Exhibit 7.23).
                                                         are similar to those for hospital admissions, as
                                                         most workers have coinsurance or copayments.                                         Fourteen percent of covered workers pay
                                                         Fifty-three percent of covered workers have                                           coinsurance and an additional 4% of covered
                                                         coinsurance and 20% have copayments for an                                            workers have both a copay and coinsurance, or
                                                         outpatient surgery episode. In addition, 2%                                           either copayments or coinsurance, whichever is
                                                         have a separate annual deductible for outpatient                                      greater (Exhibit 7.20). The average coinsurance
                        7                                surgery, and 6% have both copayments and                                              rate for a visit with a primary care physician is
                                                         coinsurance, while 24% have no cost sharing for                                       18% (Exhibit 7.21).
 section seven


                                                         an outpatient surgery (Exhibit 7.18). For covered


                                                          noTe:

                                                    1   in 2009, the survey includes cost sharing for in-network services only. see the 2007 survey for information on
                                                        out-of-network office visit cost sharing.


                            94
                                 t h e k a i s e r fa m i ly f o u n d at i o n - a n d - h e a lt h r e s e a r C h  e d u C at i o n a l t r u s t
Employer Health Benefits          2 0 0 9 An n u a l s u r ve y


ouT-of-poCkeT mAximum AmouNTs                                           For covered workers with out-of-pocket maximums,
 
  Most covered workers are in a plan that partially or                    there is wide variation in spending limits.
  totally limits the cost sharing that a plan enrollee                        Forty-two percent of workers with an out-of-
  must pay in a year. These limits are generally                               pocket maximum for single coverage have an out-
  referred to as out-of-pocket maximum amounts.                                of-pocket maximum of less than $2,000, while
  Enrollee cost sharing such as deductibles, office visit                      26% have an out-of-pocket maximum of $3,000
  cost sharing, or spending on prescription drugs may                          or more (Exhibit 7.28).
  or may not apply to the out-of-pocket maximum.
  Therefore, the survey asks what types of out-of-                            Like deductibles, some plans have an aggregate
  pocket expenses plans count when determining                                 out-of-pocket maximum amount for family
  whether a covered worker has met the plan out-of-                            coverage that applies to cost sharing for all family
  pocket maximum. When a plan does not count                                   members, while others have a per-person out-of-
  certain types of spending, it effectively increases the                      pocket maximum that limits the amount of cost
  amount a worker may pay out-of-pocket.                                       sharing that the family must pay on behalf of
                                                                               each family member. For covered workers with
 
  Nineteen percent of covered workers enrolled in                              an aggregate out-of-pocket maximum for family
  single or family coverage are in a plan that does not                        coverage, 39% have an out-of-pocket maximum
  limit the amount of cost sharing enrollees have to                           of less than $4,000 (Exhibit 7.30). Among
  pay (Exhibit 7.26).                                                          workers with separate per-person out-of-pocket
     Covered workers in HMOs are more likely to be                            limits for family coverage, 90% have out-of-
      enrolled in a plan that does not limit the amount                        pocket maximums of less than $4,000
      of cost sharing (41%) than workers in PPOs                               (Exhibit 7.31).
      (14%) or POS plans (19%) (Exhibit 7.26). The                      As noted above, covered workers with an out-of-
      percentage of workers without an out-of-pocket                      pocket maximum may be enrolled in a plan where
      maximum has not statistically changed in the                        not all spending counts toward the out-of-pocket
      past year.                                                          maximum, potentially exposing workers to higher
     Covered workers without an out-of-pocket                            spending.
      maximum, however, may not have large cost-                              Among workers enrolled in PPO plans with an
      sharing responsibilities. For example, 94%                               out-of-pocket maximum for single or family
      of covered workers in HMOs with no out-of-                               coverage, 34% are in plans that do not count
      pocket maximum for single coverage have no                               spending for the general annual deductible
      general annual deductible, and less than 1% have                         toward the out-of-pocket limit (Exhibit 7.27).
      coinsurance for a hospital admission or for each


                                                                                                                                                                    Employee Cost Sharing
      outpatient surgery episode.                                             It is more common for covered workers to be
                                                                               in plans that do not count prescription drug
     HSA-qualified HDHPs are required by law to                               cost sharing toward the out-of-pocket limit.
      have an out-of-pocket maximum of no more                                 For example, 85% of workers in PPOs and
      than $5,800 for single coverage and $11,600 for                          78% in HMOs are in plans that do not count
      family coverage in 2009. HDHP/HRAs have no                               prescription drug spending towards the out-of-
      such requirement, and among workers enrolled                             pocket maximum (Exhibit 7.27).
      in these plans, 10% have no out-of-pocket
      maximum for single or family coverage.
                                                                                                                                                                    7
                                                                                                                                                                        section seven


                                                                                                                                                               95
                                        t h e k a i s e r fa m i ly f o u n d at i o n - a n d - h e a lt h r e s e a r C h  e d u C at i o n a l t r u s t
Employer Health Benefits          2 0 0 9 A n n u a l s u r ve y


                                     e x h i B i t 7. 1

                                     Percentage of Covered Wor kers With no G eneral annual health Plan d educ tible for single and
                                     family Coverage, by Plan type and fir m size, 2009


                                                                                                                                             single Coverage               family Coverage

                                     hmo
                                      200–999 Workers                                                                                                   82%                         82%
                                      1,000–4,999 Workers                                                                                               85                          85
                                      5,000 or more Workers                                                                                             91*                         91*
                                      All small firms (3–199 Workers)                                                                                   73%*                        71%*
                                      All large firms (200 or more Workers)                                                                             88%*                        88%*
                                     All firm sizes                                                                                                     84%                         84%

                                     ppo
                                      200–999 Workers                                                                                                   27%                         27%
                                      1,000–4,999 Workers                                                                                               30                          30
                                      5,000 or more Workers                                                                                             24                          24
                                      All small firms (3–199 Workers)                                                                                   26%                         26%
                                      All large firms (200 or more Workers)                                                                             26%                         26%
                                     All firm sizes                                                                                                     26%                         26%

                                     pos
                                      200–999 Workers                                                                                                   40%                         40%
                                      1,000–4,999 Workers                                                                                               70*                         70*
                                      5,000 or more Workers                                                                                             31                          31
                                      All small firms (3–199 Workers)                                                                                   37%                         37%
                                      All large firms (200 or more Workers)                                                                             42%                         41%
                                     All firm sizes                                                                                                     38%                         39%


                                                          source:

                                                    kaiser/hret survey of employer-sponsored health Benefits, 2009.
Employee Cost Sharing


                                                 * estimate is statistically different within plan type from estimate for all other firms not in the indicated size category (p.05).
                                                 note: hdhP/sos are not shown because all covered workers in these plans face a minimum deductible. in hdhP/hra plans, as
                                                 defined by the survey, the minimum deductible is $1,000 for single coverage and $2,000 for family coverage. in hsa-qualified
                                                 hdhPs, the legal minimum deductible for 2009 is $1,150 for single coverage and $2,300 for family coverage. average general
                                                 annual health plan deductibles for PPos, Pos plans, and hdhP/sos are for in-network services.


                        7
 section seven


                            96
                                 t h e k a i s e r fa m i ly f o u n d at i o n - a n d - h e a lt h r e s e a r C h  e d u C at i o n a l t r u s t
Employer Health Benefits          2 0 0 9 An n u a l s u r ve y


e x h i B i t 7.2

among Covered Workers with no G eneral annual health Plan deduc tible for single and family
Coverage, Percentage Who have the following types of Cost shar ing, by Plan type, 2009 ‡


                                                                                                     single Coverage                          family Coverage

separate Cost sharing for a hospital Admission
 hmo                                                                                                             68%                                      67%
 PPo                                                                                                             66                                       66
 Pos                                                                                                             71                                       71

separate Cost sharing for an outpatient surgery episode
 hmo                                                                                                             63%                                      62%
 PPo                                                                                                             65                                       65
 Pos                                                                                                             75                                       75


                    source:

             kaiser/hret survey of employer-sponsored health Benefits, 2009.

          ‡ separate cost sharing for each hospital admission includes the following types: separate annual deductible, copayment,
            coinsurance, and/or a charge per day (per diem). Cost sharing for each outpatient surgery episode includes the following
            types: separate annual deductible, copayment, and/or coinsurance.
          note: hdhP/sos are not shown because all covered workers in these plans face a deductible. in hdhP/hra plans, as defined by
          the survey, the minimum deductible is $1,000 for single coverage and $2,000 for family coverage. in hsa-qualified hdhPs, the
          legal minimum deductible for 2009 is $1,150 for single coverage and $2,300 for family coverage. average general annual health
          plan deductibles for PPos and Pos plans are for in-network services.


                                                                                                                                                                                        Employee Cost Sharing
                                                                                                                                                                                        7
                                                                                                                                                                                            section seven


                                                                                                                                                                                   97
                                                            t h e k a i s e r fa m i ly f o u n d at i o n - a n d - h e a lt h r e s e a r C h  e d u C at i o n a l t r u s t
Employer Health Benefits          2 0 0 9 A n n u a l s u r ve y


                                     e x h i B i t 7. 3

                                     among Covered Workers with a G eneral annual health Plan deduc tible for single Coverage,
                                     average d educ tible, by Plan type and fir m size, 2009


                                                                                                                                                                       single Coverage

                                     hmo
                                      all small firms (3–199 Workers)                                                                                                       $900*
                                      all large firms (200 or more Workers)                                                                                                  528*
                                     All firm sizes                                                                                                                         $699

                                     ppo
                                      all small firms (3–199 Workers)                                                                                                      $1,040*
                                      all large firms (200 or more Workers)                                                                                                   478*
                                     All firm sizes                                                                                                                         $634

                                     pos
                                      all small firms (3–199 Workers)                                                                                                      $1,268
                                      all large firms (200 or more Workers)                                                                                                   695
                                     All firm sizes                                                                                                                        $1,061

                                     hDhp/so
                                      all small firms (3–199 Workers)                                                                                                     $2,037*
                                      all large firms (200 or more Workers)                                                                                                1,642*
                                     All firm sizes                                                                                                                       $1,838


                                                          source:

                                                    kaiser/hret survey of employer-sponsored health Benefits, 2009.


                                                 * estimates are statistically different within plan type between all small firms and all large firms (p.05).
                                                 note: average general annual health plan deductibles for PPos, Pos plans, and hdhP/sos are for in-network services.
Employee Cost Sharing


                        7
 section seven


                            98
                                 t h e k a i s e r fa m i ly f o u n d at i o n - a n d - h e a lt h r e s e a r C h  e d u C at i o n a l t r u s t
Employer Health Benefits          2 0 0 9 An n u a l s u r ve y


e x h i B i t 7.4

among Covered Workers with a G eneral annual health Plan deduc tible for single Coverage,
average d educ tible, by Plan type and region, 2009


                                                                                                                                                   single Coverage

hmo
 northeast                                                                                                                                                    nsd
 midwest                                                                                                                                                      nsd
 south                                                                                                                                                       $741
 West                                                                                                                                                         nsd
All regioNs                                                                                                                                                  $699

ppo
 northeast                                                                                                                                                   $464*
 midwest                                                                                                                                                      609
 south                                                                                                                                                        673
 West                                                                                                                                                         736
All regioNs                                                                                                                                                  $634

pos
 northeast                                                                                                                                                  nsd
 midwest                                                                                                                                                   $974
 south                                                                                                                                                       878
 West                                                                                                                                                      1,340
All regioNs                                                                                                                                               $1,061

hDhp/so
 northeast                                                                                                                                                $1,936
 midwest                                                                                                                                                   1,911
 south                                                                                                                                                     1,732
 West                                                                                                                                                      1,807
All regioNs                                                                                                                                               $1,838


                                                                                                                                                                                            Employee Cost Sharing
                    source:

             kaiser/hret survey of employer-sponsored health Benefits, 2009.


          * estimate is statistically different from estimate for all other firms not in the indicated region (p.05).
          nsd: not sufficient data.
          note: average general annual health plan deductibles for PPos, Pos plans, and hdhP/sos are for in-network services.
                                                                                                                                                                                            7
                                                                                                                                                                                                section seven


                                                                                                                                                                                       99
                                                                t h e k a i s e r fa m i ly f o u n d at i o n - a n d - h e a lt h r e s e a r C h  e d u C at i o n a l t r u s t
Employer Health Benefits          2 0 0 9 A n n u a l s u r ve y


                                      e x h i B i t 7. 5

                                      among Covered Workers with a G eneral annual health Plan deduc tible for single Coverage,
                                      average d educ tible, by Plan type, 2006–2009


                                        $2,000

                                                                                                                                                                                                 $1,838
                                                                                                                                                                                        $1,812
                                                                                                                                                                            $1,715 $1,729


                                        $1,500


                                                                                                                                                                   $1,061
                                        $1,000


                                                                                                                                                                $752
                                                                                  $699*
                                                                                                                         $634                            $621
                                                                                                                    $560*                      $553
                                                                          $503                      $473 $461
                                          $500
                                                                 $401
                                                         $352


                                             $0
                                                                      HMO                                         PPO                                       POS                      HDHP/SO


                                                           source:
                                                                                                                                                                                                    2006

                                                     kaiser/hret survey of employer-sponsored health Benefits, 2006–2009.                                                                           2007
                                                                                                                                                                                                    2008

                                                  * estimate is statistically different from estimate for the previous year shown by plan type (p.05).                                             2009

                                                  note: average general annual health plan deductibles for PPos, Pos plans, and hdhP/sos are for in-network services.
Employee Cost Sharing


                        7
 section seven


                            100
                                  t h e k a i s e r fa m i ly f o u n d at i o n - a n d - h e a lt h r e s e a r C h  e d u C at i o n a l t r u s t
Employer Health Benefits          2 0 0 9 An n u a l s u r ve y


e x h i B i t 7.6

Percentage of Covered Wor kers enrolled in a Plan with a h igh G eneral annual deduc tible for
single Coverage, By firm size, 2009


100%


 80%


 60%


                       40%
 40%


                                                          22%
 20%                                                                                               16%
                                        13%
                                                                                                                                               7%
                                                                                                                          3%
   0%
                         PERCENTAGE OF COVERED WORKERS                                              PERCENTAGE OF COVERED WORKERS
                    WITH A SINGLE DEDUCTIBLE OF $1,000 OR MORE*                                WITH A SINGLE DEDUCTIBLE OF $2,000 OR MORE*


                    source:
                                                                                                                                                  ALL SMALL FIRMS
                                                                                                                                                  3 199 WORKERS
             kaiser/hret survey of employer-sponsored health Benefits, 2009.
                                                                                                                                                  ALL LARGE FIRMS
                                                                                                                                                  200 OR MORE WORKERS
          * estimate is statistically different between all small firms and all large firms within category (p.05).                              ALL FIRMS

          note: these estimates include workers enrolled in hdhP/so and other plan types. Because we do not
          collect information on the attributes of conventional plans, to be conservative, we assumed that workers
          in conventional plans do not have a deductible of $1,000 or more. Because of the low enrollment in
          conventional plans, the impact of this assumption is minimal. average general annual health plan
          deductibles for PPos, Pos plans, and hdhP/sos are for in-network services.


                                                                                                                                                                                            Employee Cost Sharing
                                                                                                                                                                                            7
                                                                                                                                                                                                section seven


                                                                                                                                                                                      101
                                                               t h e k a i s e r fa m i ly f o u n d at i o n - a n d - h e a lt h r e s e a r C h  e d u C at i o n a l t r u s t
Employer Health Benefits          2 0 0 9 A n n u a l s u r ve y


                                      e x h i B i t 7. 7

                                      Percentage of Covered Wor kers enrolled in a Plan with a G eneral annual d educ tible of $1,000 or
                                      m ore for single Coverage, By firm size, 2006–2009


                                        50%


                                                                                                                                                                  40%
                                        40%

                                                                                                                                                         35%*


                                        30%


                                                                                                             21%*                                                22%*

                                        20%                                                                                                              18%*
                                                                  16%

                                                                                                             12%*
                                                                  10%                                                                                            13%*
                                        10%

                                                                                                                                                         9%
                                                                                                               8%
                                                                   6%

                                         0%
                                                                   2006                                        2007                                      2008     2009


                                                           source:
                                                                                                                                                                ALL SMALL FIRMS
                                                                                                                                                                3 199 WORKERS
                                                     kaiser/hret survey of employer-sponsored health Benefits, 2006–2009.
                                                                                                                                                                ALL LARGE FIRMS
                                                                                                                                                                200 OR MORE WORKERS
                                                  * estimate is statistically different from estimate for the previous year shown (p.05).
                                                                                                                                                                ALL FIRMS
                                                  note: these estimates include workers enrolled in hdhP/so and other plan types. Because we do
                                                  not collect information on the attributes of conventional plans, to be conservative, we assumed that
                                                  workers in conventional plans do not have a deductible of $1,000 or more. Because of the low
                                                  enrollment in conventional plans, the impact of this assumption is minimal. average general annual
                                                  health plan deductibles for PPos, Pos plans, and hdhP/sos are for in-network services.
Employee Cost Sharing


                        7
 section seven


                            102
                                  t h e k a i s e r fa m i ly f o u n d at i o n - a n d - h e a lt h r e s e a r C h  e d u C at i o n a l t r u s t
Employer Health Benefits         2 0 0 9 An n u a l s u r ve y


e x h i B i t 7.8

among Covered Workers With a G eneral annual health Plan deduc tible for single PPo Coverage,
distr ibution of d educ tibles, 2006–2009


2006                                                  62%                                                                        26%                           8%         4%

2007*                                                  64%                                                                        24%                             10%           2%

2008*                                         52%                                                                 30%                                     13%             4%

2009                                        48%                                                              32%                                     14%                6%

        0%             10%            20%            30%            40%              50%               60%              70%               80%               90%              100%


                     source:
                                                                                                                                                               $1 $499
               kaiser/hret survey of employer-sponsored health Benefits, 2006–2009.                                                                            $500 $999

                                                                                                                                                               $1,000 $1,999
             * distribution is statistically different from distribution for the previous year shown (p.05).                                                  $2,000 OR MORE
             note: deductibles for PPo plans are for in-network services.


e x h i B i t 7.9

among Covered Workers With a G eneral annual health Plan deduc tible for single Pos Coverage,
distr ibution of d educ tibles, 2006–2009


2006                               38%                                                                44%                                                   16%                 1%

2007*                                       50%                                                              26%                                  19%                    5%


                                                                                                                                                                                               Employee Cost Sharing
2008*                          33%                                                32%                                               25%                            10%

2009*                          29%                                   24%                                           29%                                      18%

        0%             10%            20%            30%            40%              50%               60%              70%               80%               90%              100%


                     source:
                                                                                                                                                               $1 $499                         7
               kaiser/hret survey of employer-sponsored health Benefits, 2006–2009.                                                                            $500 $999

                                                                                                                                                               $1,000 $1,999
                                                                                                                                                                                                   section seven


             * distribution is statistically different from distribution for the previous year shown (p.05).                                                  $2,000 OR MORE
             note: deductibles for Pos plans are for in-network services.


                                                                                                                                                                                         103
                                                                  t h e k a i s e r fa m i ly f o u n d at i o n - a n d - h e a lt h r e s e a r C h  e d u C at i o n a l t r u s t
Employer Health Benefits          2 0 0 9 A n n u a l s u r ve y


                                      e x h i B i t 7. 10

                                       distr ibution of type of G eneral annual deduc tible for Covered Wor kers with family Coverage, by
                                       Plan type and firm size, 2009


                                                                                                                                                                            separate amount
                                                                                                                                  no deductible          aggregate amount
                                                                                                                                                                               per Person

                                       hmo
                                        all small firms (3–199 Workers)*                                                                  71%                  25%                3%
                                        all large firms (200 or more Workers)*                                                            88                    7                 4
                                       All firm sizes                                                                                     84%                  12%                4%

                                       ppo
                                        all small firms (3–199 Workers)                                                                  26%                  45%                29%
                                        all large firms (200 or more Workers)                                                            26                   46                 28
                                       All firm sizes                                                                                    26%                  46%                28%

                                       pos
                                        all small firms (3–199 Workers)                                                                   37%                  44%               19%
                                        all large firms (200 or more Workers)                                                             41                   32                26
                                       All firm sizes                                                                                     39%                  39%               22%

                                       hDhp/so
                                        all small firms (3–199 Workers)                                                                  na                    85%               15%
                                        all large firms (200 or more Workers)                                                            na                    92                 8
                                       All firm sizes                                                                                    NA                    89%               11%


                                                                source:

                                                          kaiser/hret survey of employer-sponsored health Benefits, 2009.


                                                      * distributions are statistically different between all small firms and all large firms within plan type (p.05).
                                                      na: not applicable. all covered workers in hdhP/sos face a general annual deductible. in hdhP/hra plans, as defined by the survey,
                                                      the minimum deductible is $1,000 for single coverage and $2,000 for family coverage. in hsa-qualified hdhPs, the legal minimum
Employee Cost Sharing


                                                      deductible for 2009 is $1,150 for single coverage and $2,300 for family coverage.
                                                      note: the survey distinguished between plans that have an aggregate deductible amount in which all family members’ out-of-pocket
                                                      expenses count toward the deductible and plans that have a separate amount for each family member, typically with a limit on the
                                                      number of family members required to reach that amount. among workers with a general annual deductible, 74% of workers in
                                                      hmos have an aggregate deductible, 62% in PPos have an aggregate deductible, and 64% in Pos plans have an aggregate
                                                      deductible. average general annual health plan deductibles for PPos, Pos plans, and hdhP/sos are for in-network services.


                        7
 section seven


                            104
                                  t h e k a i s e r fa m i ly f o u n d at i o n - a n d - h e a lt h r e s e a r C h  e d u C at i o n a l t r u s t
Employer Health Benefits          2 0 0 9 An n u a l s u r ve y


e x h i B i t 7.1 1

 among Covered Wor kers with a G eneral annual health Plan deduc tible, average deduc tibles for
 family Coverage, by d educ tible type, Plan type, and fir m size, 2009


                                                                                          aggregate amount                         separate amount per Person

 hmo
  all small firms (3–199 Workers)                                                                     nsd                                                 nsd
  all large firms (200 or more Workers)                                                             $1,089                                               $600
 All firm sizes                                                                                     $1,524                                               $686

 ppo
  all small firms (3–199 Workers)                                                                   $2,596*                                              $904*
  all large firms (200 or more Workers)                                                              1,077*                                               527*
 All firm sizes                                                                                     $1,488                                               $633

 pos
  all small firms (3–199 Workers)                                                                    $2,566*                                            nsd
  all large firms (200 or more Workers)                                                               1,387*                                            $841
 All firm sizes                                                                                      $2,191                                           $1,050

 hDhp/so
  all small firms (3–199 Workers)                                                                   $4,037*                                             nsd
  all large firms (200 or more Workers)                                                              3,258*                                           $1,973
 All firm sizes                                                                                     $3,626                                            $2,091


                      source:

              kaiser/hret survey of employer-sponsored health Benefits, 2009.


           * estimates are statistically different within plan and deductible type between all small firms and all large firms (p.05).
           nsd: not sufficient data.
           note: average general annual health plan deductibles for PPos, Pos plans, and hdhP/sos are for in-network services. the


                                                                                                                                                                                            Employee Cost Sharing
           survey distinguished between plans that have an aggregate deductible amount in which all family members’ out-of-pocket
           expenses count toward the deductible and plans that have a separate amount for each family member, typically with a limit
           on the number of family members required to reach that amount.


                                                                                                                                                                                            7
                                                                                                                                                                                                section seven


                                                                                                                                                                                      105
                                                               t h e k a i s e r fa m i ly f o u n d at i o n - a n d - h e a lt h r e s e a r C h  e d u C at i o n a l t r u s t
Employer Health Benefits          2 0 0 9 A n n u a l s u r ve y


                                     e x h i B i t 7. 12

                                      among Covered Workers with a G eneral annual health Plan deduc tible for family Coverage,
                                      average aggregate d educ tible, by Plan type, 2006–2009


                                          $4,000

                                                                                                                                                                             $3,596    $3,626
                                                                                                                                                                        $3,511    $3,559
                                          $3,500


                                          $3,000


                                          $2,500

                                                                                                                                                               $2,191

                                          $2,000
                                                                                                                                                         $1,860

                                                                                $1,524*                          $1,488
                                          $1,500
                                                                                                           $1,344*                               $1,359
                                                                                                       $1,040                               $1,227
                                                                        $1,053                    $1,034
                                          $1,000
                                                         $751 $759

                                            $500


                                              $0
                                                                      HMO                                         PPO                                    POS                    HDHP/SO


                                                           source:
                                                                                                                                                                                            2006
                                                     kaiser/hret survey of employer-sponsored health Benefits, 2006–2009.
                                                                                                                                                                                            2007
                                                                                                                                                                                            2008
                                                   * estimate is statistically different from estimate for the previous year shown by plan type (p.05).
                                                                                                                                                                                            2009
                                                   note: average general annual health plan deductibles for PPos, Pos plans, and hdhP/sos are for in-network services.
Employee Cost Sharing


                        7
 section seven


                            106
                                  t h e k a i s e r fa m i ly f o u n d at i o n - a n d - h e a lt h r e s e a r C h  e d u C at i o n a l t r u s t
Employer Health Benefits          2 0 0 9 An n u a l s u r ve y


e x h i B i t 7.1 3

 among Covered Workers With a G eneral annual health Plan deduc tible for family Coverage,
 distr ibution of d educ tibles, by Plan type and deduc tible type, 2009


                                                 $1–$499                       $500–$999                        $1,000–$1,999                      $2,000 or more

 hmo
  aggregate amount                                   7%                              22%                                33%                                  38%
  separate amount                                   46%                              13%                                36%                                   5%

 ppo
  aggregate amount                                  12%                              30%                                35%                                  23%
  separate amount                                   46%                              34%                                12%                                   8%

 pos
  aggregate amount                                   3%                              18%                                30%                                  49%
  separate amount                                   43%                              12%                                15%                                  30%

 hDhp/so‡
  aggregate amount                                    0%                               0%                                0%                               100%
  separate amount                                     0%                               0%                               40%                                60%


                      source:

              kaiser/hret survey of employer-sponsored health Benefits, 2009.

           ‡ By definition, 100% of covered workers in hdhP/sos with an aggregate deductible have a family deductible of $2,000 or more.

           note: average general annual health plan deductibles for PPos, Pos plans, and hdhP/sos are for in-network services. the
           survey distinguished between plans that have an aggregate deductible amount in which all family members’ out-of-pocket
           expenses count toward the deductible and plans that have a separate amount for each family member, typically with a limit on
           the number of family members required to reach that amount.


                                                                                                                                                                                         Employee Cost Sharing
                                                                                                                                                                                         7
                                                                                                                                                                                             section seven


                                                                                                                                                                                   107
                                                            t h e k a i s e r fa m i ly f o u n d at i o n - a n d - h e a lt h r e s e a r C h  e d u C at i o n a l t r u s t
Employer Health Benefits          2 0 0 9 A n n u a l s u r ve y


                                     e x h i B i t 7. 14

                                      among Covered Wor kers With a s eparate per Person G eneral annual health Plan deduc tible for
                                      family Coverage, distribution of m aximum number of family m embers r equired to m eet the
                                      d educ tible, by Plan type, 2009


                                           HMO                                                                     80%                                                                   20%              1%


                                           PPO                                     42%                                                                         42%                     1%     14%


                                            POS                                         47%                                                14%             2%                    37%


                                     HDHP/SO                                                                 72%                                                            14%               14%

                                                  0%              10%             20%              30%              40%              50%                 60%         70%      80%           90%        100%


                                                           source:
                                                                                                                                                                           TWO
                                                       kaiser/hret survey of employer-sponsored health Benefits, 2009.                                                     THREE

                                                                                                                                                                           FOUR OR MORE WITH SPECIFIED LIMIT
                                                  note: average general annual health plan deductibles for PPos, Pos plans, and
                                                                                                                                                                           NO LIMIT
                                                  hdhP/sos are for in-network services. the survey distinguished between plans that
                                                  have an aggregate deductible amount in which all family members’ out-of-pocket
                                                  expenses count toward the deductible and plans that have a separate amount for
                                                  each family member, typically with a limit on the number of family members required
                                                  to reach that amount.
Employee Cost Sharing


                        7
 section seven


                            108
                                  t h e k a i s e r fa m i ly f o u n d at i o n - a n d - h e a lt h r e s e a r C h  e d u C at i o n a l t r u s t
Employer Health Benefits          2 0 0 9 An n u a l s u r ve y


e x h i B i t 7.1 5

 among Covered Workers With an aggregate G eneral annual health Plan deduc tible for family
 Coverage, distribution of aggregate d educ tibles, by Plan type, 2006–2009


                                          $1–$499                         $500–$999                           $1,000–$1,999                          $2,000 or more

 hmo
  2006                                         27%                              42%                                    23%                                     7%
  2007                                         22                               48                                     23                                      8
  2008*                                        31                               26                                     20                                     23
  2009*                                         7                               22                                     33                                     38

 ppo
  2006                                         20%                              42%                                    27%                                    12%
  2007*                                        14                               49                                     25                                     12
  2008*                                        11                               38                                     32                                     19
  2009*                                        12                               30                                     35                                     23

 pos
  2006                                         12%                              26%                                    45%                                    18%
  2007*                                        32                               13                                     29                                     25
  2008                                         23                               14                                     24                                     39
  2009*                                         3                               18                                     30                                     49


                      source:

              kaiser/hret survey of employer-sponsored health Benefits, 2006–2009.


           * distribution is statistically different from distribution for the previous year shown (p.05).
           note: By definition, 100% of covered workers in hdhP/sos with an aggregate deductible have a family deductible of $2,000
           or more. average general annual health plan deductibles for PPos and Pos plans are for in-network services. the survey
           distinguished between plans that have an aggregate deductible amount in which all family members’ out-of-pocket
           expenses count toward the deductible and plans that have a separate amount for each family member, typically with a limit
           on the number of family members required to reach that amount.


                                                                                                                                                                                             Employee Cost Sharing
                                                                                                                                                                                             7
                                                                                                                                                                                                 section seven


                                                                                                                                                                                       109
                                                                t h e k a i s e r fa m i ly f o u n d at i o n - a n d - h e a lt h r e s e a r C h  e d u C at i o n a l t r u s t
Employer Health Benefits          2 0 0 9 A n n u a l s u r ve y


                                     e x h i B i t 7. 16

                                      among Covered Workers with a G eneral annual health Plan deduc tible, Percentage with Coverage
                                      for the following s er vices Without having to first m eet the deduc tible, by Plan type, 2009


                                                                                                                                  hmo                      PPo         Pos            hdhP/so

                                      Physician office Visits for Primary Care                                                     84%                     74%         74%              na
                                      Preventive Care                                                                              92%                     88%         87%              92%
                                      Prescription drugs                                                                           88%                     93%         91%               71%§


                                                           source:

                                                     kaiser/hret survey of employer-sponsored health Benefits, 2009.


                                                  note: these questions are asked of firms with a deductible for single or family coverage. average general annual
                                                  health plan deductibles for PPos, Pos plans, and hdhP/sos are for in-network services.
                                                  na: not applicable. information for Physician office Visits is not collected for hdhP/sos.
                                                  § Percentage is for covered workers in hdhP/hras only.    Both hdhP/hras and hsa-qualified hdhPs were asked
                                                    about preventive benefits, but only hdhP/hras were asked about prescription drugs. hsa-qualified hdhPs are
                                                    required by law to apply the plan deductible to nearly all services.


                                     e x h i B i t 7. 17

                                      distr ibution of Covered Wor kers With s eparate Cost sharing for a hospital admission in addition
                                      to any G eneral annual deduc tible, by Plan type, 2009


                                      separate Cost sharing for a hospital Admission                                               hmo                   PPo     Pos    hdhP/so§ All plANs

                                      separate annual deductible for hospitalizations                                                6%                   3%     10%          0%*          5%
                                      Copayment and/or Coinsurance
                                        Copayment                                                                                     44*                12*     31*          3*          19
Employee Cost Sharing


                                        Coinsurance                                                                                   14*                65*     37*         52           51
                                        Both Copayment and Coinsurance‡                                                                8                 11       7          1*           8
                                      Charge Per day                                                                                   9*                 3*     13           1*           5
                                      none                                                                                            29                 18      21          43*          22


                                                           source:

                                                     kaiser/hret survey of employer-sponsored health Benefits, 2009.
                        7
                                                  * estimate is statistically different from all Plans estimate (p.05).
                                                  ‡ this includes enrollees who are required to pay the higher amount of either the copayment or coinsurance under the plan.
 section seven


                                                  note: as in past years, we collected information on the cost-sharing provisions for hospital admissions that are in addition to
                                                  any general annual plan deductible. however, for the 2009 survey, in order to better capture the prevalence of combinations of
                                                  cost sharing, the survey was changed to ask a series of yes or no questions. Previously, the question asked respondents to select
                                                  one response from a list of types of cost sharing, such as separate deductibles, copayments, coinsurance, and per diem
                                                  payments (for hospitalization only). due to the change in question format, the distribution of workers with types of cost sharing
                                                  does not equal 100% as workers may face a combination of types of cost sharing. less than 1% of covered workers have an
                                                  “other” type of cost sharing for a hospital admission.
                                                  § information on separate deductibles for hospital admissions was collected only for hdhP/hras   because federal regulations
                                                    for hsa-qualified hdhPs make it unlikely these plans would have a separate deductible for specific services.


                            110
                                  t h e k a i s e r fa m i ly f o u n d at i o n - a n d - h e a lt h r e s e a r C h  e d u C at i o n a l t r u s t
Employer Health Benefits          2 0 0 9 An n u a l s u r ve y


e x h i B i t 7.1 8

 distr ibution of Covered Wor kers With s eparate Cost sharing for an outpatient surger y in addition
 to any G eneral annual deduc tible, by Plan type, 2009


 separate Cost sharing for an outpatient surgery                                    hmo                   PPo                  Pos            hdhP/so§ All plANs

 separate annual deductible for outpatient surgery                                     4%                    2%                    1%                  1%                   2%
 Copayment and/or Coinsurance
   Copayment                                                                          45*                  11*                  39*                   3*                  20
   Coinsurance                                                                        18*                  68*                  35*                  51                   53
   Both Copayment and Coinsurance‡                                                     3*                   7                   10                   1*                   6
 none                                                                                 33*                  19*                  23                   46*                  24


                      source:

              kaiser/hret survey of employer-sponsored health Benefits, 2009.


           * estimate is statistically different from all Plans estimate (p.05).
           ‡ this includes enrollees who are required to pay the higher amount of either the copayment or coinsurance under the plan.

           note: as in past years, we collected information on the cost-sharing provisions for outpatient surgery that are in addition to any
           general annual plan deductible. however, for the 2009 survey, in order to better capture the prevalence of combinations of cost
           sharing, the survey was changed to ask a series of yes or no questions. Previously, the question asked respondents to select one
           response from a list of types of cost sharing, such as separate deductibles, copayments, coinsurance, and per diem payments
           (for hospitalization only). due to the change in question format, the distribution of workers with types of cost sharing does not
           equal 100% as workers may face a combination of types of cost sharing. less than 1% of covered workers have an “other” type of
           cost sharing for an outpatient surgery.
           § information on separate deductibles for outpatient surgery was collected only for hdhP/hras because federal regulations for
             hsa-qualified hdhPs make it unlikely these plans would have a separate deductible for specific services.


                                                                                                                                                                                               Employee Cost Sharing
                                                                                                                                                                                               7
                                                                                                                                                                                                   section seven


                                                                                                                                                                                         111
                                                                  t h e k a i s e r fa m i ly f o u n d at i o n - a n d - h e a lt h r e s e a r C h  e d u C at i o n a l t r u s t
Employer Health Benefits          2 0 0 9 A n n u a l s u r ve y


                                     e x h i B i t 7. 19

                                      among Covered Wor kers With s eparate Cost sharing for a hospital admission or outpatient
                                      surger y in addition to any G eneral annual deduc tible, average Cost shar ing, by Plan type, 2009*


                                                                                                                                                average       average               Charge
                                                                                                                                               Copayment    Coinsurance             Per day

                                       separate Cost sharing for a hospital Admission
                                        hmo                                                                                                          $247       17%                  $216
                                        PPo                                                                                                           217       18                    136
                                        Pos                                                                                                           256       18                    183
                                        hdhP/so                                                                                                       nsd       18                    nsd
                                       All plANs                                                                                                     $234       18%                  $179

                                       separate Cost sharing for an outpatient surgery
                                        hmo                                                                                                          $104       17%                    na
                                        PPo                                                                                                           113       19                     na
                                        Pos                                                                                                           116       19                     na
                                        hdhP/so                                                                                                       nsd       18                     na
                                       All plANs                                                                                                     $110       19%                    NA


                                                           source:

                                                     kaiser/hret survey of employer-sponsored health Benefits, 2009.


                                                  * tests found no statistical differences between plan type estimates and estimates for all plans (p.05).
                                                  nsd: not sufficient data.
                                                  na: not applicable. the survey did not offer “Charge Per day” (per diem) as a response option for questions about separate cost
                                                  sharing for each outpatient surgery episode.
                                                  note: the average separate annual deductible for hospital admission is $862 and the average separate deductible for outpatient
                                                  surgery is $500. By plan type, in most cases there were too few observations to present the average estimates. the average
                                                  amounts include workers that may have a combination of types of cost sharing. all Plans estimates are weighted by workers in
                                                  firms that reported cost sharing. see the survey design and methods section for more information on weighting.
Employee Cost Sharing


                        7
 section seven


                            112
                                  t h e k a i s e r fa m i ly f o u n d at i o n - a n d - h e a lt h r e s e a r C h  e d u C at i o n a l t r u s t
Employer Health Benefits          2 0 0 9 An n u a l s u r ve y


e x h i B i t 7.2 0

 i n addition to any Plan d educ tible, Percentage of Covered Wor kers With the following types of
 Cost shar ing for Physician o ffice Visits, by Plan type, 2009


                                                                                         Both Copay
                                Copay only              Coinsurance only                                                 no Cost sharing               none of the above
                                                                                       and Coinsurance‡

  hmo*                               94%                              2%                            2%                               2%                             0%
  PPo*                               77                              16                             5                                3                             1
  Pos*                               89                               6                             4                                1                             1
  hdhP/so*                           14                              44                             2                               39                              2
 All plANs                           77%                             14%                            4%                               5%                            1%


                      source:

              kaiser/hret survey of employer-sponsored health Benefits, 2009.


           * distribution is statistically different from all Plans distribution (p.05).
           ‡ this includes enrollees who are required to pay the higher amount of either the copayment or coinsurance under the plan.

           note: in 2009, the survey includes cost sharing for in-network services only. see the 2007 survey for information on out-of-
           network office visit cost sharing. in 2009, in order to better capture the percentage of workers with no cost sharing, the “no cost
           sharing” response was distinguished from the “other” response.


e x h i B i t 7.2 1

 among Covered Workers with Copayments and/or Coinsurance for i n-net wor k Physician o ffice
 Visits, average Copayments and Coinsurance, by Plan type, 2009


                                                                           hmo                     PPo                    Pos               hdhP/so               All plANs

 in-Network office visits
   average Copay for Primary Care Physician                                  $18*                    $21                    $21                   $22                    $20


                                                                                                                                                                                               Employee Cost Sharing
     office Visit
   average Copay for specialist Physician                                    $26*                   $28                     $31*                  $29                    $28
     office Visit
   average Coinsurance for Primary Care                                     nsd                    18%                    nsd                    18%                    18%
     Physician office Visit


                      source:

              kaiser/hret survey of employer-sponsored health Benefits, 2009.
                                                                                                                                                                                               7
                                                                                                                                                                                                   section seven


           * estimate is statistically different from all Plans estimate (p.05).
           nsd: not sufficient data.
           note: the survey asks respondents if the plan has cost sharing for in-network office visits. if the respondent indicates the plan
           has a copayment for office visits, we assume the plan has a copayment for both primary and specialty care visits. the survey
           does not allow for a respondent to report that a plan has a copayment for primary care visits and coinsurance for visits with a
           specialist physician.


                                                                                                                                                                                         113
                                                                  t h e k a i s e r fa m i ly f o u n d at i o n - a n d - h e a lt h r e s e a r C h  e d u C at i o n a l t r u s t
Employer Health Benefits          2 0 0 9 A n n u a l s u r ve y


                                     e x h i B i t 7. 22

                                      among Covered Workers With Copayments for a Physician o ffice Visit with a Primar y Care Physician,
                                      distribution of Copayments, by Plan type, 2004–2009


                                                              $5 Per Visit           $10 Per Visit            $15 Per Visit           $20 Per Visit      $25 Per Visit      $30 Per Visit           other

                                      hmo
                                       2004                          3%                     28%                      40%                     22%                3%                  3%                1%
                                       2005*                         5                      23                       34                      27                 6                   4                 1
                                       2006                          3                      21                       37                      25                 8                   5                 2
                                       2007*                         3                      20                       25                      34                13                   4                 1
                                       2008*                         6                      16                       29                      30                11                   5                 3
                                       2009                          5                      11                       29                      31                13                   8                 3

                                      ppo
                                       2004                         1%                      17%                      35%                     28%               11%                 4%                 3%
                                       2005*                       1                       16                       25                      34                15                  5                  4
                                       2006                        1                       12                       25                      35                17                  7                  3
                                       2007*                        2                       11                       24                      35                19                  7                  2
                                       2008                         1                       11                       22                      34                21                  8                  3
                                       2009*                       1                       11                       18                      34                23                 11                  2

                                      pos
                                       2004                          3%                      17%                     34%                     36%                8%                1%                 1%
                                       2005*                         2                       16                      35                      30                11                  6                  1
                                       2006*                         2                       22                      26                      27                16                  6                 1
                                       2007*                         2                       10                      36                      25                15                  6                  5
                                       2008*                         2                       14                      19                      27                21                 12                  7
                                       2009*                         1                        8                      14                      39                21                 12                  4

                                      hDhp/so‡
                                       2007                         7%                       1%                    12%                      38%               13%                19%                12%
                                       2008                         0                         2                     17                       33                 9                 18                 21
Employee Cost Sharing


                                       2009                        1                         4                     24                       29                11                 29                  4

                                      All plANs
                                       2004                          1%                     19%                      37%                     27%                9%                 3%                 3%
                                       2005*                         2                      17                       29                      32                12                  5                  3
                                       2006                          2                      15                       28                      32                15                  6                  3
                                       2007                          2                      14                       25                      34                17                  7                  2
                                       2008                          2                      13                       23                      33                18                  8                  4
                        7              2009*                         2                      10                       21                      34                20                 11                  2
 section seven


                                                           source:

                                                     kaiser/hret survey of employer-sponsored health Benefits, 2004–2009.


                                                  * distribution is statistically different from distribution for the previous year shown (p.05).
                                                  ‡ there are insufficient data to report the results from the 2006 survey.              information was not obtained for hdhP/sos prior to 2006.
                                                  note: Copayments for PPo, Pos, and hdhP/so plans are for in-network providers. the survey has asked specifically about
                                                  copayments for primary care physicians since 2005. in 2004, the survey question did not specify primary or specialist physician.


                            114
                                  t h e k a i s e r fa m i ly f o u n d at i o n - a n d - h e a lt h r e s e a r C h  e d u C at i o n a l t r u s t
Employer Health Benefits          2 0 0 9 An n u a l s u r ve y


e x h i B i t 7.2 3

 among Covered Workers With Copayments for a Physician o ffice Visit with a specialty Care
 Physician, distribution of Copayments, by Plan type, 2006-2009


                       $5 Per         $10 Per         $15 Per         $20 Per            $25 Per            $30 Per            $35 Per            $40 Per
                                                                                                                                                                      other
                        Visit          Visit           Visit           Visit              Visit              Visit              Visit              Visit

 hmo
  2006                    3%             14%              20%              20%                17%               13%                  5%                 5%                 4%
  2007*                   2              11               12               26                 22                14                   5                  7                  2
  2008*                   2              13               14               18                 20                16                   5                  5                  7
  2009*                   3               6               17               15                 17                18                   7                  9                  8

 ppo
  2006                   1%               9%             15%              25%                20%               15%                  6%                 5%                 5%
  2007                    1                8              13               24                 18                16                   8                  7                  4
  2008*                  1                7              14               21                 17                15                   9                  9                  8
  2009*                  1                8              10               20                 14                15                  11                 11                 11

 pos
  2006                    2%             13%              13%              17%                18%               17%                  8%                5%                 8%
  2007*                   7               6               10               21                 19                16                   6                 6                  9
  2008*                   1               7                8               14                 13                21                  11                 9                 17
  2009                    1               4                5               17                 11                25                   6                14                 17

 hDhp/so‡
  2007                    0%               7%              5%              23%                  7%              18%                  5%                21%               15%
  2008                    0                2              11               18                   4               27                   3                  9                28
  2009                   1                4              11               18                   8               23                  15                 11                 9

 All plANs
  2006                    2%             10%              15%              22%                19%               16%                  6%                 5%                5%
  2007                    2               8               12               24                 20                16                   6                  7                 5
  2008*                   1               9               13               18                 17                16                   8                  8                10


                                                                                                                                                                                             Employee Cost Sharing
  2009*                   1               7               11               18                 14                17                  10                 11                11


                      source:

              kaiser/hret survey of employer-sponsored health Benefits, 2006–2009.


           * distribution is statistically different from distribution for the previous year shown (p.05).
           ‡ there are insufficient data to report the results from the 2006 survey.

           note: Copayments for PPo, Pos, and hdhP/so plans are for in-network providers. information on copayments for specialty
           physician office visits was not obtained prior to 2006. the survey asks respondents if the plan has cost sharing for in-network
                                                                                                                                                                                             7
           office visits. if the respondent indicates the plan has a copayment for office visits, we assume the plan has a copayment for both
                                                                                                                                                                                                 section seven


           primary and specialty care visits. the survey does not allow for a respondent to report that a plan has a copayment for primary
           care visits and coinsurance for visits with a specialist physician.


                                                                                                                                                                                       115
                                                                t h e k a i s e r fa m i ly f o u n d at i o n - a n d - h e a lt h r e s e a r C h  e d u C at i o n a l t r u s t
Employer Health Benefits          2 0 0 9 A n n u a l s u r ve y


                                     e x h i B i t 7. 24

                                      among Covered Workers in hmos with a Copayment for a Physician o ffice Visit, Percentage with
                                      Var ious Copayments, 1999–2008


                                                                          $5 Per Visit                    $10 Per Visit                   $15 Per Visit               $20 Per Visit     other

                                         1999                                    23%                             60%                             12%                        1%            3%
                                         2000*                                   22                              54                              16                         3             6
                                         2001*                                   15                              56                              22                         3             4
                                         2002*                                    7                              52                              27                        11             3
                                         2003*                                    4                              35                              37                        12            12
                                         2004*                                    3                              28                              40                        22             7
                                         2005*                                    5                              23                              34                        27            11
                                         2006                                     3                              21                              37                        25            15
                                         2007*                                    3                              20                              25                        34            18
                                         2008*                                    6                              16                              29                        30            19
                                         2009                                     5                              11                              29                        31            24


                                                           source:

                                                     kaiser/hret survey of employer-sponsored health Benefits, 1999–2009.


                                                  * distribution is statistically different from distribution for the previous year shown (p.05).
                                                  note: the survey has asked specifically about copayments for primary care physicians since 2005. Prior to 2005, the survey
                                                  question did not specify primary or specialist physician.


                                     e x h i B i t 7. 25

                                      among Covered Workers With Coinsurance for Physician o ffice Visits, distr ibution of average
                                      Coinsurance r ates, by Plan type, 2009*
Employee Cost Sharing


                                      Coinsurance rates                                         10% or 15%                 20% or 25%                    30% or 35%        40% or 45%    other

                                         PPo                                                           31%                        64%                       2%                 1%         1%
                                         hdhP/so                                                       30                         65                        5                  0         1

                                      All plANs                                                        32%                       64%                        2%                   1%       1%


                                                           source:

                        7                            kaiser/hret survey of employer-sponsored health Benefits, 2009.
 section seven


                                                  * tests found no statistical difference for plan type distribution compared to all Plans distribution (p.05).
                                                  note: Coinsurance rates for hmo and Pos plans are not shown because there is not sufficient data as only 2% or 6% of covered
                                                  workers, respectively, face coinsurance for office visits.


                            116
                                  t h e k a i s e r fa m i ly f o u n d at i o n - a n d - h e a lt h r e s e a r C h  e d u C at i o n a l t r u s t
Employer Health Benefits          2 0 0 9 An n u a l s u r ve y


e x h i B i t 7.2 6

 Percentage of Covered Workers Without an annual out- of-Pocket m aximum for single and family
 Coverage, by Plan type, 2009


                                                                        single Coverage                                                  family Coverage

    hmo                                                                           41%*                                                            41%*
    PPo                                                                          14*                                                              14*
    Pos                                                                          19                                                               19
    hdhP/so                                                                      na                                                               na

 All plANs                                                                        19%                                                              19%


                      source:

              kaiser/hret survey of employer-sponsored health Benefits, 2009.


           * estimate is statistically different from all Plans estimate (p.05).
           na: not applicable. hsa-qualified hdhPs are required to have an annual maximum out-of-pocket liability of no more than
           $5,800 for single coverage and $11,600 for family coverage in 2009. hdhP/hras have no such requirement, and the percentage
           of covered workers in hdhP/hras with “no limit” for annual out-of-pocket maximum for single and family coverage is 10% and
           10%, respectively.


e x h i B i t 7.2 7

 among Covered Workers with an annual out- of-Pocket m aximum, Percentage Whose spending for
 Var ious s er vices d oes not Count towards the out- of-Pocket m aximum, 2009


                                                                                    hmo                        PPo                         Pos                  hdhP/so‡

    General annual Plan deductible                                                  30%                        34%                        20%                        13%


                                                                                                                                                                                               Employee Cost Sharing
    any additional Plan deductibles                                                 nsd                        29%                        nsd                        nsd
    Physician office Visit Copayments                                               51%                        75%                        51%                        nsd
    Physician office Visit Coinsurance                                              nsd                         8%                        nsd                         8%
    Prescription drug Cost sharing                                                  78%                        85%                        60%                        53%


                      source:

              kaiser/hret survey of employer-sponsored health Benefits, 2009.
                                                                                                                                                                                               7
           ‡ among hdhP/so plans, questions other than “overall plan deductible” were asked only of hdhP/hras and not of hsa-
                                                                                                                                                                                                   section seven


             qualified hdhPs. hsa-qualified hdhPs are required to apply most cost sharing to the out-of-pocket maximum. When hdhP/
             hras are considered exclusively, among covered workers with an annual out-of-pocket maximum, the percentage whose out-
             of-pocket maximum does not include certain services is as follows: any additional plan deductibles is nsd, office visit
             copayments is nsd, office visit coinsurance is 8%, and prescription drug cost sharing is 55%.
           nsd: not sufficient data.
           note: this series of questions is asked if the plan has an out-of-pocket maximum for single or family coverage.


                                                                                                                                                                                         117
                                                                  t h e k a i s e r fa m i ly f o u n d at i o n - a n d - h e a lt h r e s e a r C h  e d u C at i o n a l t r u s t
Employer Health Benefits          2 0 0 9 A n n u a l s u r ve y


                                     e x h i B i t 7. 28

                                      among Covered Workers with an out- of-Pocket m aximum for single Coverage, distr ibution of
                                      out- of-Pocket m aximums, by Plan type, 2009


                                            HMO*           8%             12%                                      36%                                         18%          7%               20%


                                              PPO        6%                   20%                            17%                             21%                     11%                  25%


                                              POS        5%                   22%                                20%                             17%                 12%                 23%
                                                         1%
                                       HDHP/SO*             8%            9%                  15%                         18%                                              49%


                                     ALL PLANS           6%                18%                          18%                                21%                   11%                    26%

                                                    0%                                20%                              40%                               60%                     80%                       100%


                                                           source:
                                                                                                                                                                                       $999 OR LESS
                                                     kaiser/hret survey of employer-sponsored health Benefits, 2009.                                                                   $1,000 $1,499

                                                                                                                                                                                       $1,500 $1,999
                                                  * distribution is statistically different from all Plans distribution (p.05).                                                       $2,000 $2,499
                                                  note: distributions are among covered workers facing a specified limit for out-of-pocket                                             $2,500 $2,999
                                                  maximum amounts. hsa-qualified hdhPs are required by law to have an out-of-pocket
                                                                                                                                                                                       $3,000 OR MORE
                                                  maximum of no more than $5,800 for single coverage and $11,600 for family coverage in 2009.
                                                                                                                                                                                        WITH A SPECIFIED LIMIT
Employee Cost Sharing


                        7
 section seven


                            118
                                  t h e k a i s e r fa m i ly f o u n d at i o n - a n d - h e a lt h r e s e a r C h  e d u C at i o n a l t r u s t
Employer Health Benefits          2 0 0 9 An n u a l s u r ve y


e x h i B i t 7.2 9

 distr ibution of type of out- of-Pocket m aximum for Covered Workers with family Coverage, by Plan
 type and fir m size, 2009*


                                                                                                                                                   separate amount
                                                                                    no limit                   aggregate amount
                                                                                                                                                      per Person

 hmo
  all small firms (3–199 Workers)                                                      37%                                 55%                                 8%
  all large firms (200 or more Workers)                                                42                                  44                                 15
 All firm sizes                                                                        41%                                 47%                                13%

 ppo
  all small firms (3–199 Workers)                                                      17%                                 58%                                25%
  all large firms (200 or more Workers)                                                13                                  62                                 25
 All firm sizes                                                                        14%                                 61%                                25%

 pos
  all small firms (3–199 Workers)                                                      19%                                 60%                                22%
  all large firms (200 or more Workers)                                                20                                  52                                 28
 All firm sizes                                                                        19%                                 57%                                24%

 hDhp/so‡
  all small firms (3–199 Workers)                                                        4%                                88%                                  8%
  all large firms (200 or more Workers)                                                  3                                 90                                   6
 All firm sizes                                                                          3%                                89%                                  7%

 All firms
  all small firms (3–199 Workers)                                                      19%                                 61%                                20%
  all large firms (200 or more Workers)                                                20                                  59                                 21
 All firm sizes                                                                        19%                                 60%                                21%


                      source:


                                                                                                                                                                                            Employee Cost Sharing
              kaiser/hret survey of employer-sponsored health Benefits, 2009.


           * tests found no statistical differences between distributions for all small firms and all large firms within plan type (p.05).
           ‡ hsa-qualified hdhPs are required by law to have an annual maximum out-of-pocket liability of no more than $5,800 for single
             coverage and $11,600 for family coverage in 2009. When they are excluded from the calculation, the distribution of type of
             out-of-pocket maximum for hdhP/hras only is as follows: all small firms – not sufficient data; all large firms – 8% no limit,
             82% aggregate amount, and 10% separate amount per Person; all firm sizes – 10% no limit, 79% aggregate amount, and
             11% separate amount per Person.
           note: the survey distinguished between plans that have a family aggregate out-of-pocket maximum that applies to spending
           by any covered person in the family or a separate per person out-of-pocket maximum that applies to spending by each family                                                       7
           member or a limited number of family members. among workers with an out-of-pocket maximum, 78% of workers in hmos
           have an aggregate out-of-pocket maximum, 71% in PPos have an aggregate out-of-pocket maximum, 70% in Pos plans have
                                                                                                                                                                                                section seven


           an aggregate out-of-pocket maximum and 74% in all Plans have an aggregate out-of-pocket maximum.


                                                                                                                                                                                      119
                                                               t h e k a i s e r fa m i ly f o u n d at i o n - a n d - h e a lt h r e s e a r C h  e d u C at i o n a l t r u s t
Employer Health Benefits          2 0 0 9 A n n u a l s u r ve y


                                     e x h i B i t 7. 30

                                      among Covered Workers with an aggregate out- of-Pocket m aximum for family Coverage,
                                      distr ibution of out- of-Pocket m aximums, by Plan type, 2009


                                            HMO*         5%              16%                                    31%                                       19%        7%                 22%


                                             PPO          8%               13%                         20%                             18%                     11%                29%


                                             POS       4%               17%                             21%                       10%                    15%                     33%
                                                         1%
                                       HDHP/SO*           7%             10%                11%                      21%                                             50%

                                     ALL PLANS           6%            13%                        19%                             18%                     12%                    31%

                                                    0%                                20%                              40%                               60%               80%                        100%


                                                         source:
                                                                                                                                                                                  $1,999 OR LESS
                                                 kaiser/hret survey of employer-sponsored health Benefits, 2009.                                                                  $2,000 $2,999

                                                                                                                                                                                  $3,000 $3,999
                                              * distribution is statistically different from all Plans distribution (p.05).                                                      $4,000 $4,999
                                              note: distributions are among covered workers facing a specified limit for out-of-pocket maximum                                    $5,000 $5,999
                                              amounts. hsa-qualified hdhPs are required by law to have an out-of-pocket maximum of no more
                                                                                                                                                                                  $6,000 OR MORE
                                              than $5,800 for single coverage and $11,600 for family coverage in 2009. the survey distinguished
                                                                                                                                                                                   WITH A SPECIFIED LIMIT
                                              between plans that have a family aggregate out-of-pocket maximum that applies to spending by
                                              any covered person in the family or a separate per person out-of-pocket maximum that applies to
                                              spending by each family member or a limited number of family members.
Employee Cost Sharing


                        7
 section seven


                            120
                                  t h e k a i s e r fa m i ly f o u n d at i o n - a n d - h e a lt h r e s e a r C h  e d u C at i o n a l t r u s t
Employer Health Benefits          2 0 0 9 An n u a l s u r ve y


e x h i B i t 7.3 1

 among Covered Workers with a s eparate per Person out- of-Pocket m aximum for family Coverage,
 distr ibution of out- of-Pocket m aximums, by Plan type, 2009


      HMO                                          52%                                                              28%                                 14%               5%

      PPO                                  42%                                                          34%                                        15%               4% 3% 1%
                                                                                                                                                      1%
       POS*                                       51%                                                         25%                       4% 3%                   18%
                                                                                                                                   1%
 HDHP/SO*                 20%                                       34%                                       17%                                  24%                      4%

ALL PLANS                                    44%                                                            34%                                    11%           4% 3%3%

              0%                           20%                           40%                               60%                               80%                              100%


                      source:
                                                                                                                                                      $1,999 OR LESS

               kaiser/hret survey of employer-sponsored health Benefits, 2009.                                                                        $2,000 $2,999

                                                                                                                                                      $3,000 $3,999
            * distribution is statistically different from all Plans distribution (p.05).                                                            $4,000 $4,999

            note: distributions are among covered workers facing a specified limit for out-of-pocket maximum                                          $5,000 $5,999
            amounts. the survey distinguished between plans that have a family aggregate out-of-pocket maximum                                        $6,000 OR MORE
            that applies to spending by any covered person in the family or a separate per person out-of-pocket                                        WITH A SPECIFIED LIMIT
            maximum that applies to spending by each family member or a limited number of family members.


e x h i B i t 7.3 2

 among Covered Workers with a s eparate per Person out- of-Pocket m aximum for family Coverage,
 distr ibution of m aximum number of family m embers r equired to m eet the m aximum, by Plan
 type, 2009


                                                                                                                                                                                                Employee Cost Sharing
     HMO                                                 60%                                                                   25%                               15%
                                                                                                                                                              1%
      PPO                                      47%                                                                    40%                                           13%


      POS                                     45%                                                             35%                               2%             18%


 HDHP/SO*                                                        71%                                                                 9%            6%             14%
                                                                                                                                                           1%                                   7
ALL PLANS                                        48%                                                                37%                                            14%
                                                                                                                                                                                                    section seven


              0%                           20%                           40%                               60%                               80%                              100%


                      source:
                                                                                                                                                      TWO
               kaiser/hret survey of employer-sponsored health Benefits, 2009.                                                                        THREE
                                                                                                                                                      FOUR OR MORE
                                                                                                                                                       WITH A SPECIFIED LIMIT
            * distribution is statistically different from all Plans distribution (p.05).
                                                                                                                                                      NO LIMIT
            note: the survey distinguished between plans that have a family aggregate out-of-pocket maximum
            that applies to spending by any covered person in the family or a separate out-of-pocket maximum that
            applies to spending by each family member or a limited number of family members.

                                                                                                                                                                                          121
                                                                   t h e k a i s e r fa m i ly f o u n d at i o n - a n d - h e a lt h r e s e a r C h  e d u C at i o n a l t r u s t
60%

                                      $4,8 2 4
           Employer Health Benefits
$ 13,375
              2009 annual surVey


           High-Deductible
            Health Plans
            with Savings
               Option

                 section


                     8


           2009
Employer Health Benefits          2 0 0 9 A n n u a l s u r ve y


                                                                    h i g h - D e D u C t i B l e h e a lt h p l a n S W i t h S av i n g S o p t i o n


                                                                             c hanges       in law over The pasT few years have permiTTed The esTablishmenT of new Types of savings

                                                                             arrangemenTs for healTh care .                       T he   Two mosT common are healTh reimbursemenT arrangemenTs                     (hra s )
                                                                             and healTh savings accounTs                   (hsa s ). hra s and hsa s are boTh financial accounTs ThaT workers or Their
                                                                             family members can use To pay for healTh care services .                                T hese savings arrangemenTs are ofTen ( or, in The
                                                                             case of      hsa s , always ) paired wiTh healTh plans wiTh high deducTibles . T he survey TreaTs high - deducTible
                                                                             plans ThaT can be paired wiTh a savings opTion as a disTincT plan Type —h igh -d educTible                                 h ealTh p lan wiTh
                                                                             s avings o pTion (hdhp/so)— even if The plan would oTherwise be considered a ppo, hmo, pos plan , or
                                                                             convenTional healTh plan .                 s pecifically for The survey, hdhp/so s are defined as (1) healTh plans wiTh a
                                                                             deducTible of aT leasT             $1,000 for single coverage and $2,000 for family coverage 1 offered wiTh an hra
                                                                             ( referred To as hdhp/hra s ); or (2) high - deducTible healTh plans ThaT meeT The federal legal requiremenTs
                                                                             To permiT an enrollee To esTablish and conTribuTe To an                                    hsa ( referred   To as   hsa- qualified hdhps ). 2


                                                                             p e r C e N TA g e o f f i r m s o f f e r i N g                                       Enrollment in HDHP/SOs remained at 8% of
                                                                             hDhp/hr As AND hsA-QuAlifieD hDhps,                                                      covered workers in 2009 (Exhibit 8.4).
                                                                             AND eNrollmeNT
                                                                                                                                                                          Three percent of covered workers are enrolled
                                                                               Twelve percent of firms offering health benefits offer                                    in HDHP/HRAs and 6% are enrolled in
                                                                                 an HDHP/HRA, an HSA-qualified HDHP, or both                                               HSA-qualified HDHPs (Exhibit 8.4). Nine
                                                                                 in 2009, a similar percentage to last year. Among                                         percent of covered workers in small firms (3-199
                                                                                 firms offering health benefits, 2% offer an HDHP/                                         workers) are enrolled in HSA-qualified HDHPs,
                                                                                 HRA and 10% offer an HSA-qualified HDHP                                                   compared to 4% of workers in large firms (200 or
                                                                                 (Exhibit 8.1).                                                                            more workers) (Exhibit 8.5).
                                                                                       Firms with 1,000 or more workers are more
                                                                                                                                                                  plAN DeDuCTibles
                                                                                        likely to offer an HDHP/SO than smaller firms.
High-Deductible Health Plans with Savings Option


                                                                                                                                                                    As expected, workers enrolled in HDHP/SOs have
                                                                                        Twenty-eight percent of firms with 1,000 or
                                                                                        more workers offer an HDHP/SO compared to                                     higher deductibles than workers enrolled in HMOs,
                                                                                        11% of firms with 3 to 199 workers or 18% of                                  PPOs, or POS plans.
                                                                                        firms with 200-999 workers (Exhibit 8.2).                                         The average general annual deductible for single
                                                                                       The percentage of firms with 1,000 or more                                         coverage is $1,690 for HDHP/HRAs and $1,922
                                                                                        workers offering an HDHP/SO increased in                                           for HSA-qualified HDHPs (Exhibit 8.6). These
                                                                                        2009 to 28% from 22% in 2008 (Exhibit 8.3).                                        averages are similar to the amounts reported in
                                                                                                                                                                           2008.


                                                                                        noTe:

                                                                                1
                                                                                    there is no legal requirement for the minimum deductible in a plan offered with an hra. the survey defines a high-deductible
                                                                                    plan as a plan with a deductible of at least $1,000 for single coverage and $2,000 for family coverage. federal law requires a
                                                                                    deductible of at least $1,150 for single coverage and $2,300 for family coverage for hsa-qualified hdhPs in 2009. see the text
                                                                                    Box for more information on hsa-qualified hdhPs and hdhP/hras.

                                                   8                            2
                                                                                    the definitions of hdhP/sos do not include other consumer-driven plan options, such as arrangements that combine an hra
                                                                                    with a lower-deductible health plan or arrangements in which an insurer (rather than the employer as in the case of hras or
                                                                                    the enrollee as in the case of hsas) establishes an account for each enrollee. other arrangements may be included in future
s ection eig ht


                                                                                    surveys as the market evolves.


                                                       124
                                                             t h e k a i s e r fa m i ly f o u n d at i o n - a n d - h e a lt h r e s e a r C h  e d u C at i o n a l t r u s t
Employer Health Benefits          2 0 0 9 An n u a l s u r ve y


      Health Reimbursement Arrangements (HRAs)                           care. An individual may establish an HSA if he or
      are medical care reimbursement plans established                   she is covered by a “qualified health plan” which
      by employers that can be used by employees to                      is a plan with a high deductible (i.e., a deductible
      pay for health care. HRAs are funded solely by                     of at least $1,150 for single coverage and $2,300
      employers. Employers typically commit to make                      for family coverage in 2009) that also meets other
      a specified amount of money available in the HRA                   requirements. Employers can encourage their
      for premiums and medical expenses incurred                         employees to create HSAs by offering an HDHP
      by employees or their dependents. HRAs are                         that meets the federal requirements. Employers
      accounting devices, and employers are not required                 in some cases also may assist their employees by
      to expend funds until an employee incurs expenses                  identifying HSA options, facilitating applications,
      that would be covered by the HRA. Unspent                          or negotiating favorable fees from HSA vendors.
      funds in the HRA usually can be carried over to                    Both employers and employees can contribute
      the next year (sometimes with a limit). Employees                  to an HSA, up to the statutory cap of $3,000
      cannot take their HRA balances with them if they                   for single coverage and $5,950 for family
      leave their job, although an employer can choose                   coverage in 2009. Employee contributions to
      to make the remaining balance available to former                  the HSA are made on a pre-income tax basis,
      employees to pay for health care.                                  and some employers arrange for their employees
      HRAs often are offered along with a high-                          to fund their HSAs through payroll deductions.
      deductible health plan (HDHP). In such cases,                      Employers are not required to contribute to HSAs
      the employee pays for health care first from his                   established by their employees but, if they elect
                                                                         to do so, their contributions are not taxable to
      or her HRA and then out-of-pocket until the
                                                                         the employee. Interest and other earnings on
      health plan deductible is met. Sometimes certain
                                                                         amounts in an HSA are not taxable. Withdrawals
      preventive services or other services such as
                                                                         from the HSA by the account owner to pay for
      prescription drugs are paid for by the plan before
                                                                         qualified health care expenses are not taxed. The
      the employee meets the deductible.
                                                                         savings account is owned by the individual who
      Health Savings Accounts (HSAs) are savings                         creates the account, so employees retain their HSA
      accounts created by individuals to pay for health                  balances if they leave their job.
      1 see u.s. department of the treasury, Health Savings Accounts, available at http://www.treas.gov/press/releases/hp975.htm.


                                                                                                                                                                                High-Deductible Health Plans with Savings Option
     There is wide variation in the average general                          deductible is satisfied), or (2) a per-person amount
      annual deductible amounts for single coverage.                          that applies to each family member (typically with a
      Forty-two percent of workers with single coverage                       limit on the number of family members that would
      in HDHP/HRAs have a deductible between                                  be required to meet the deductible amount).
      $1,000 and $1,499, and 6% have a deductible
                                                                                 The average aggregate deductibles for workers
      of $3,000 or more. For workers with single
                                                                                  with family coverage are $3,422 for HDHP/
      coverage in HSA-qualified plans, 27% of workers
                                                                                  HRAs and $3,734 for HSA-qualified HDHPs
      have a deductible between $1,150 and $1,499,
                                                                                  (Exhibit 8.6).
      and 10% are in a plan with a deductible of
      $3,000 or more (Exhibit 8.9).                                              Forty-three percent of workers in HDHP/HRAs
                                                                                  are in plans with an aggregate family deductible
     Most workers in HDHP/HRAs (94%) and HSA-
                                                                                  between $2,000 and $2,999, while 18% are
      qualified HDHPs (90%) do not have to meet the
                                                                                  enrolled in plans with an aggregate family
      general annual deductible before preventive care
                                                                                  deductible of $5,000 or more. Twenty-seven
      is covered (Exhibit 8.12).
                                                                                  percent of workers in HSA-qualified HDHPs
 
  Since 2006, the survey has collected information                                are in plans with an aggregate family deductible
  on two types of family deductibles. The survey asks                             between $2,300 and $2,999, while 26% are
  employers whether the family deductible amount                                  enrolled in plans with an aggregate family                                                    8
  is (1) an aggregate amount (i.e., the out-of-pocket                             deductible of $5,000 or more (Exhibit 8.11).
                                                                                                                                                                                s ection ei ght


  expenses of all family members are counted until the


                                                                                                                                                                          125
                                                   t h e k a i s e r fa m i ly f o u n d at i o n - a n d - h e a lt h r e s e a r C h  e d u C at i o n a l t r u s t
Employer Health Benefits          2 0 0 9 A n n u a l s u r ve y


                                                                             ouT-of-poCkeT mAximum AmouNTs                                                        Worker CoNTribuTioNs To premiums

                                                                               HSA-qualified HDHPs are legally required to have                                    The average annual worker contributions to
                                                                                 a maximum annual out-of-pocket liability of no                                        premiums for workers enrolled in HDHP/
                                                                                 more than $5,800 for single coverage and $11,600                                      HRAs are $734 for single coverage and $3,067
                                                                                 for family coverage in 2009. HDHP/HRAs have no                                        for family coverage. The worker contribution in
                                                                                 similar requirement.                                                                  HDHP/HRAs for family coverage is significantly
                                                                                                                                                                       less than worker contribution for family coverage
                                                                                    The average annual out-of-pocket maximum for
                                                                                                                                                                       in plans that are not HDHP/SOs (Exhibit 8.8).
                                                                                     single coverage is $3,035 for HDHP/HRAs3 and
                                                                                     $2,976 for HSA-quali.fied HDHPs (Exhibit 8.6).                                 The average annual worker contributions to
                                                                                                                                                                      premiums for workers in HSA-qualified plans are
                                                                                    As with deductibles, the survey asks employers
                                                                                                                                                                      $438 for single coverage and $2,453 for family
                                                                                     whether the family out-of-pocket maximum
                                                                                                                                                                      coverage. The average contributions for single
                                                                                     liability is (1) an aggregate amount that applies
                                                                                                                                                                      and family coverage for workers in HSA-qualified
                                                                                     to spending by any covered person in the family,
                                                                                                                                                                      HDHPs are significantly less than the average
                                                                                     or (2) a separate per person amount that applies
                                                                                                                                                                      premium contributions made by covered workers in
                                                                                     to spending by each family member or a limited
                                                                                                                                                                      plans that are not HDHP/SOs (Exhibit 8.8).
                                                                                     number of family members. The survey also asks
                                                                                     whether spending by enrollees on various services                            e m p loye r Co N T r i b u T i o N s
                                                                                     counts towards meeting the plan out-of-pocket                                To p r e m i u m s A N D s Av i N g s o p T i o N s
                                                                                     maximum.
                                                                                                                                                                    Employers contribute to HDHP/SOs in two ways:
                                                                                    Among covered workers with family coverage                                       through their contributions toward the premium
                                                                                     whose out-of-pocket maximum is an aggregate                                      for the health plan and through their contributions
                                                                                     amount that applies to spending by any covered                                   (if any, in the case of HSAs) to the savings account
                                                                                     person in the family, the average annual amounts                                 option (i.e., the HRAs or HSAs themselves).
                                                                                     are $6,441 for HDHP/HRAs and $5,842 for
                                                                                                                                                                          Looking just at the annual employer
                                                                                     HSA-qualified HDHPs (Exhibit 8.6).
                                                                                                                                                                           contributions to premiums, covered workers
                                                                             premiums                                                                                      in HDHP/HRAs on average receive employer
                                                                                                                                                                           contributions of $3,540 for single coverage and
                                                                               In 2009, the average annual premiums for
                                                                                                                                                                           $9,157 for family coverage. The amount for
                                                                                 HDHP/HRAs are $4,274 for single coverage and
                                                                                                                                                                           single coverage is lower than the average amount
                                                                                 $12,223 for family coverage. The HDHP/HRA
                                                                                                                                                                           contributed by employers for single coverage for
                                                                                 premium amounts for covered workers with single
                                                                                                                                                                           workers who are not enrolled in HDHP/SOs
High-Deductible Health Plans with Savings Option


                                                                                 and family coverage are lower than the average
                                                                                                                                                                           (Exhibit 8.8).
                                                                                 premiums for single and family coverage for
                                                                                 workers in plans that are not HDHP/SOs                                                   The average annual employer contributions to
                                                                                 (Exhibit 8.8).                                                                            premiums for workers in HSA-qualified HDHPs
                                                                                                                                                                           are $3,391 for single coverage and $7,943 for
                                                                               The average annual premium for workers in HSA-
                                                                                                                                                                           family coverage. These amounts are lower than
                                                                                 qualified HDHPs is $3,829 for single coverage and
                                                                                                                                                                           the average contributions for single or family
                                                                                 $10,396 for family coverage. These amounts are
                                                                                                                                                                           coverage for workers in plans that are not
                                                                                 lower than the average single and family premium
                                                                                                                                                                           HDHP/SOs (Exhibit 8.8).
                                                                                 for workers in plans that are not HDHP/SOs
                                                                                 (Exhibit 8.8).


                                                                                    noTe:

                                                   8                            3   the average out-of-pocket maximum for hdhP/hras is calculated for plans with an out-of-pocket maximum. about 10% of
                                                                                    covered workers in hdhP/hras with single coverage or family coverage are in plans that reported having no limit on
                                                                                    out-of-pocket expenses.
s ection eig ht


                                                       126
                                                             t h e k a i s e r fa m i ly f o u n d at i o n - a n d - h e a lt h r e s e a r C h  e d u C at i o n a l t r u s t
Employer Health Benefits          2 0 0 9 An n u a l s u r ve y


 
  When looking at employer contributions to the                            Employer contributions to savings account options
  savings option, on average, workers enrolled                               (i.e., the HRAs and HSAs themselves) for their
  in HDHP/HRAs receive an annual employer                                    employees can be added to their health plan
  contribution to their HRA of $1,052 for single                             premium contributions to calculate total employer
  coverage and $2,073 for family coverage                                    contributions toward HDHP/SOs.
  (Exhibit 8.8).
                                                                                For HDHP/HRAs, the average annual total
      In looking at employer contributions to HRAs,                             employer contribution for covered workers is
       we note that some HRAs are structured in such                             $4,592 for workers with single coverage and
       a way that employers may not actually spend                               $11,230 for workers with family coverage. The
       the whole amount that they make available to                              average total employer contribution amounts for
       their employees’ HRAs.4 Amounts committed                                 single and family coverage in HDHP/HRAs is
       to an employee’s HRA that are not used by the                             higher than the average amount that employers
       employee generally roll over and can be used in                           contribute towards single and family coverage in
       future years, but any balance may revert back to                          health plans that are not HDHP/SOs (Exhibit
       the employer if the employee leaves his or her                            8.8).
       job. Thus, the employer contribution amounts to
                                                                                For HSA-qualified HDHPs, the average annual
       HRAs that we capture in the survey may exceed
                                                                                 total employer contribution for covered workers
       the amount that employers will actually spend.
                                                                                 is $4,079 for single coverage and $9,070 for
 
  Workers enrolled in HSA-qualified HDHPs on                                     workers with family coverage. The average
  average receive an annual employer contribution to                             total employer contribution amount for family
  their HSA of $688 for single coverage and $1,126                               coverage in HSA-qualified HDHPs is lower than
  for family coverage (Exhibit 8.8).                                             the average amount that employers contribute
                                                                                 towards family coverage in health plans that are
      In looking at employer contributions to
                                                                                 not HDHP/SOs. The total amount contributed
       HSAs, we note that not all employers make
                                                                                 for workers in HSA-qualified HDHPs for single
       contributions towards HSAs established by their
                                                                                 coverage is similar to that contributed for workers
       employees. Twenty-nine percent of employers
                                                                                 not in HDHP/SOs (Exhibit 8.8).
       offering single or family coverage through HSA-
       qualified HDHPs do not make contributions                         hsA-QuAlifieD hDhps
       towards the HSAs that their workers establish                     iN smAll AND lArge firms
       (covering 31% of covered workers enrolled in
                                                                           There are some differences between the plan
       HSA-qualified HDHPs for single or family
                                                                             attributes of HSA-qualified HDHPs offered to
       coverage).


                                                                                                                                                                               High-Deductible Health Plans with Savings Option
                                                                             covered workers in small firms (3–199 workers)
      The average HSA contributions reported above                          and large firms (200 or more workers). As we note
       include the portion of covered workers whose                          above, however, although the number of responding
       employer contribution to the HSA is zero. When                        employers offering HSA-qualified HDHPs has
       those firms that do not contribute to the HSA                         grown over the past several years, it is still relatively
       are excluded from the calculation, the average                        small, so we may see some rather large swings from
       employer contribution for covered workers is                          year to year for some statistics, particularly when
       $1,000 for single coverage and $1,640 for family                      subgroups are compared. It will be important to
       coverage.                                                             watch these relationships over time to see if the
                                                                             differences persist.


        noTe:

  4   in the survey, we ask, “up to what dollar amount does your firm promise to contribute each year to an employee’s hra or health
      reimbursement arrangement for single coverage?” We refer to the amount that the employer commits to make available to an hra
      as a contribution for ease of discussion. as discussed, hras are notional accounts, and employers are not required to actually
      transfer funds until an employee incurs expenses. thus, employers may not expend the entire amount that they commit to make
                                                                                                                                                                               8
      available to their employees through an hra.
                                                                                                                                                                               s ection ei ght


                                                                                                                                                                         127
                                                  t h e k a i s e r fa m i ly f o u n d at i o n - a n d - h e a lt h r e s e a r C h  e d u C at i o n a l t r u s t
Employer Health Benefits          2 0 0 9 A n n u a l s u r ve y


                                                                                    There is not a significant difference between the                            fuTure plANs
                                                                                     percentage of small and large employers making                                 Firms indicate some interest in offering
                                                                                     contributions to the HSAs of their workers (71%                                  HDHP/HRAs and HSA-qualified HDHPs
                                                                                     and 66%, respectively, for both single and family                                in the next year.
                                                                                     coverage) (Exhibit 8.7).
                                                                                                                                                                          Five percent of firms not currently offering an
                                                                                    For workers in firms that contribute to the HSAs                                      HDHP/HRA report that they are “very likely”
                                                                                     of their employers, workers with HSA-qualified                                        to offer an HDHP/HRA in the next year, and
                                                                                     HDHPs in small firms receive higher average                                           another 15% of such firms report they are
                                                                                     contributions from their employers to their HSAs                                      “somewhat likely” to do so. Among firms not
                                                                                     than workers in large firms. Covered workers in                                       currently offering an HSA-qualified HDHP, 6%
                                                                                     small firms with HSA-qualified HDHPs have                                             report that they are “very likely” to do so in the
                                                                                     average contributions by their employers to their                                     next year and another 16% of such firms report
                                                                                     HSAs of $1,319 for single coverage and $2,077                                         they are “somewhat likely” to do so (Exhibit 8.20).
                                                                                     for family coverage, compared with average
                                                                                     contributions for workers with HSA-qualified
                                                                                     HDHPs in large firms of $619 for single coverage
                                                                                     and $1,121 for family coverage (Exhibit 8.7).

                                                                                    Workers in HSA-qualified HDHPs in small firms
                                                                                     face significantly higher deductibles for single
                                                                                     coverage ($2,083) and family coverage ($4,034)
                                                                                     than workers with HSA-qualified HDHPs in
                                                                                     large firms, where deductibles average $1,710
                                                                                     for single coverage and $3,361 for an aggregate
                                                                                     deductible for family coverage (Exhibit 8.7).

                                                                                    The maximum out-of-pocket liability for family
                                                                                     coverage for workers in HSA-qualified HDHPs is
                                                                                     higher for workers in large firms ($6,417) than for
                                                                                     workers in smaller firms ($5,396) (Exhibit 8.7).
High-Deductible Health Plans with Savings Option


                                                   8
s ection eig ht


                                                       128
                                                             t h e k a i s e r fa m i ly f o u n d at i o n - a n d - h e a lt h r e s e a r C h  e d u C at i o n a l t r u s t
Employer Health Benefits          2 0 0 9 An n u a l s u r ve y


e x h i B i t 8.1

among fir ms o ffer ing health B enefits, Percentage that o ffer an hdhP/hr a and/or an
hsa- Qualified hdhP, 2005–2009


     50%


     40%


     30%


     20%
                                                                                                                                                         13% 12%
                                                                                                11% 10%                                         10%
     10%                                                                      6%*       7%                                              7%
                                   3%      3%                                                                                  4%
                    2%     1%                      2%                2%
      0%
                                HDHP/HRA                                     HSA QUALIFIED HDHP                                        EITHER HDHP/HRA OR
                                                                                                                                       HSA QUALIFIED HDHP ‡


                    source:
                                                                                                                                                                           2005

              kaiser/hret survey of employer-sponsored health Benefits, 2005–2009.                                                                                         2006

                                                                                                                                                                           2007
           * estimate is statistically different from estimate for the previous year shown (p.05).                                                                        2008
           ‡ the 2009 estimate includes 0.1% of all firms offering health benefits that offer both an hdhP/hra and an hsa-qualified
                                                                                                                                                                           2009
            hdhP. the comparable percentages for 2005, 2006, 2007, and 2008 are 0.3%, 0.4%, 0.2%, and 0.3%, respectively.


e x h i B i t 8.2

among fir ms o ffering health Benefits, Percentage that o ffer an hdhP/so, by fir m size, 2009


     50%


     40%


                                                                                                                                                                                              High-Deductible Health Plans with Savings Option
     30%                                                                                                                                         28%

     20%                                                                               18%
                                  11%
     10%


      0%
                             3 199 WORKERS*                                    200 999 WORKERS*                                      1,000 OR MORE WORKERS*


                    source:

              kaiser/hret survey of employer-sponsored health Benefits, 2009.


           * estimate is statistically different from estimate for all other firms not in the indicated size category (p.05).
           note: the 2009 estimates include 0.1% of all firms offering health benefits that offer both an hdhP/hra and an hsa-qualified hdhP.


                                                                                                                                                                                              8
                                                                                                                                                                                              s ection ei ght


                                                                                                                                                                                        129
                                                                 t h e k a i s e r fa m i ly f o u n d at i o n - a n d - h e a lt h r e s e a r C h  e d u C at i o n a l t r u s t
Employer Health Benefits          2 0 0 9 A n n u a l s u r ve y


                                                                 e x h i B i t 8. 3

                                                                 among firms o ffering health Benefits, Percentage that o ffer an hdhP/so, by firm size, 2005–2009


                                                                       50%


                                                                       40%


                                                                       30%                                                                                                                                              28%*
                                                                                                                                                                                                                22%
                                                                       20%                                                                                                          18%          17%* 18%
                                                                                                                                                                           15%
                                                                                                            13% 11%                                              13%*
                                                                                                        10%                                                                               10%
                                                                       10%                      7%
                                                                                       4%                                                       4%       5%
                                                                         0%
                                                                                                  3 199 WORKERS                                           200 999 WORKERS                       1,000 OR MORE WORKERS


                                                                                      source:
                                                                                                                                                                                                                               2005

                                                                                kaiser/hret survey of employer-sponsored health Benefits, 2005–2009.                                                                           2006

                                                                                                                                                                                                                               2007
                                                                              * estimate is statistically different from estimate for previous year shown (p.05).                                                             2008

                                                                              note: the 2009 estimate includes 0.1% of all firms offering health benefits that offer both an hdhP/hra and an                                   2009
                                                                              hsa-qualified hdhP. the comparable percentages for 2005, 2006, 2007, and 2008 are 0.3%, 0.4%, 0.2%, and 0.3%,
                                                                              respectively.


                                                                 e x h i B i t 8. 4

                                                                 Percentage of Covered Workers enrolled in an hdhP/hra or hsa- Qualified hdhP, 2006–2009


                                                                       50%
High-Deductible Health Plans with Savings Option


                                                                       40%


                                                                       30%


                                                                       20%


                                                                       10%                                                                                                                                  8%*         8%
                                                                                                                                                                                    6%              5%
                                                                                                   3%          3%         3%                                 3%         4%*               4%
                                                                                        2%                                                       2%
                                                                         0%
                                                                                                     HDHP/HRA                                           HSA QUALIFIED HDHP                            HDHP/SO


                                                                                      source:
                                                                                                                                                                                                                               2006

                                                                                kaiser/hret survey of employer-sponsored health Benefits, 2006–2009.                                                                           2007

                                                                                                                                                                                                                               2008
                                                                              * estimate is statistically different from estimate for the previous year shown (p.05).                                                         2009


                                                   8
s ection eig ht


                                                       130
                                                             t h e k a i s e r fa m i ly f o u n d at i o n - a n d - h e a lt h r e s e a r C h  e d u C at i o n a l t r u s t
Employer Health Benefits          2 0 0 9 An n u a l s u r ve y


e x h i B i t 8.5

Percentage of Covered Workers enrolled in an hdhP/hra or hsa- Qualified hdhP, by firm size, 2009


     50%


     40%


     30%


     20%
                                                                                                                               13%
     10%                                                               9%                                                                                      8%
                                                                                                      6%                                        6%
                      3%           3%           3%                                    4%
      0%
                                HDHP/HRA                                    HSA QUALIFIED HDHP*                                              HDHP/SO*


                     source:
                                                                                                                              ALL SMALL FIRMS 3 199 WORKERS

             kaiser/hret survey of employer-sponsored health Benefits, 2009.                                                  ALL LARGE FIRMS 200 OR MORE WORKERS

                                                                                                                              ALL FIRMS
           * estimates are statistically different between all small firms and all large firms
             within category (p.05).


 e x h i B i t 8.6

 hdhP/hr a and hsa- Qualified hdhP features for Covered Wor kers, 2009


                                                                               hDhp/hrA                                             hsA-Qualified hDhp

 Annual plan Averages for:                                          single                        family                         single                         family

   Premium                                                         $4,274                       $12,223                          $3,829                       $10,396
   Worker Contribution to Premium                                   $734                         $3,067                           $438                         $2,453


                                                                                                                                                                                             High-Deductible Health Plans with Savings Option
   General annual deductible‡                                      $1,690                        $3,422                          $1,922                        $3,734
   out-of-Pocket maximum liability‡                                $3,035                         $6,441                         $2,976                         $5,842
   firm Contribution to the hra or hsa§                            $1,052                         $2,073                            $688                        $1,126


                     source:

              kaiser/hret survey of employer-sponsored health Benefits, 2009.

           ‡ ten percent of workers enrolled in hdhP/hras have employers that reported no out-of-pocket maximum for single coverage and family
             coverage. these workers are excluded from the hdhP/hra out-of-pocket maximum liability calculation. the deductible and out-of-
             pocket maximum averages shown for both hdhP/hras and hsa-qualified hdhPs for family coverage are for covered workers whose firms
             report that they face an aggregate amount. among covered workers in hdhP/hras, 19% are in plans whose family deductible is a
             separate per person amount and 11% are in a plan where the family out-of-pocket maximum is a separate per person amount. among
             covered workers in hsa-qualified hdhPs, the percentages are 7% for deductibles and 6% for out-of-pocket maximums.
           § When those firms that do not contribute to the hsa (29% for single and family coverage) are excluded from the calculation, the average
             firm contribution to the hsa for covered workers is $1,000 for single coverage and $1,640 for family coverage. for hdhP/hras, we refer to
             the amount that the employer commits to make available to an hra as a contribution for ease of discussion. hras are notional accounts,
             and employers are not required to actually transfer funds until an employee incurs expenses. thus, employers may not expend the entire
             amount that they commit to make available to their employees through an hra. therefore, the employer contribution amounts to hras
             that we capture in the survey may exceed the amount that employers will actually spend.
                                                                                                                                                                                             8
                                                                                                                                                                                             s ection ei ght


                                                                                                                                                                                       131
                                                                t h e k a i s e r fa m i ly f o u n d at i o n - a n d - h e a lt h r e s e a r C h  e d u C at i o n a l t r u s t
Employer Health Benefits          2 0 0 9 A n n u a l s u r ve y


                                                                 e x h i B i t 8. 7

                                                                 hsa- Qualified hdhP features for Covered Wor kers, by fir m size, 2009


                                                                 Annual plan Averages for:                                                                                          single Coverage   family Coverage

                                                                 premium
                                                                   all small firms (3–199 Workers)                                                                                     $3,921            $10,170
                                                                   all large firms (200 or more Workers)                                                                                3,706             10,694
                                                                 All firm sizes                                                                                                        $3,829            $10,396

                                                                 Worker Contribution to premium
                                                                  all small firms (3–199 Workers)                                                                                        $426             $2,888*
                                                                  all large firms (200 or more Workers)                                                                                   454              1,881*
                                                                 All firm sizes                                                                                                          $438             $2,453

                                                                 Deductible‡
                                                                  all small firms (3–199 Workers)                                                                                      $2,083*            $4,034*
                                                                  all large firms (200 or more Workers)                                                                                 1,710*             3,361*
                                                                 All firm sizes                                                                                                        $1,922             $3,734

                                                                 out-of-pocket maximum liability‡
                                                                  all small firms (3–199 Workers)                                                                                      $2,812             $5,396*
                                                                  all large firms (200 or more Workers)                                                                                 3,193              6,417*
                                                                 All firm sizes                                                                                                        $2,976             $5,842

                                                                 percentage of firms Contributing to hsA
                                                                  all small firms (3–199 Workers)                                                                                          71%                71%
                                                                  all large firms (200 or more Workers)                                                                                    66                 66
                                                                 All firm sizes                                                                                                            71%                71%

                                                                 firm Contribution to hsA, Among Workers with a Contribution
                                                                   all small firms (3–199 Workers)                                                                                     $1,319*            $2,077*
                                                                   all large firms (200 or more Workers)                                                                                  619*             1,121*
High-Deductible Health Plans with Savings Option


                                                                 All firm sizes                                                                                                        $1,000             $1,640

                                                                 firm Contribution to hsA§
                                                                   all small firms (3–199 Workers)                                                                                       $868*            $1,364*
                                                                   all large firms (200 or more Workers)                                                                                  450*               815*
                                                                 All firm sizes                                                                                                          $688             $1,126


                                                                                      source:

                                                                                kaiser/hret survey of employer-sponsored health Benefits, 2009.


                                                                             * estimates are statistically different within plan feature between all small firms and all large firms (p.05).
                                                                             ‡ the deductible and out-of-pocket maximum averages shown for family coverage are for covered workers whose firms report
                                                                              that they face an aggregate amount. among covered workers in hsa-qualified hdhPs, 7% are in plans whose family
                                                                              deductible is a separate per person amount and 6% are in a plan where the family out-of-pocket maximum is a separate per
                                                                              person amount.
                                                                             § includes workers in firms that do not contribute to the hsa.


                                                   8
s ection eig ht


                                                       132
                                                             t h e k a i s e r fa m i ly f o u n d at i o n - a n d - h e a lt h r e s e a r C h  e d u C at i o n a l t r u s t
Employer Health Benefits          2 0 0 9 An n u a l s u r ve y


e x h i B i t 8.8

average annual Premiums and Contr ibutions to savings accounts for Covered Workers in
hdhP/hr as or hsa- Qualified hdhPs, Compared to all non-hdhP/so Plans, 2009


                                                                 hDhp/hrA                          hsA-Qualified hDhp                       Non-hDhp/so plans§

                                                           single               family               single              family               single               family

Total Annual premium                                      $4,274*              $12,223*             $3,829*            $10,396*               $4,902              $13,591
  Worker Contribution to Premium                           $734                 $3,067*                438*             $2,453*                 $801               $3,595
  firm Contribution to Premium                            $3,540*               $9,157              $3,391*             $7,943*               $4,101               $9,996

Annual firm Contribution to the hrA                        $1,052                $2,073                $688              $1,126                     na                   na
 or hsA‡

Total Annual firm Contribution                             $4,592*             $11,230*             $4,079               $9,070*               $4,101              $9,996
  (firm share of Premium Plus firm
  Contribution to hra or hsa)

Total Annual Cost                                          $5,325*             $14,296              $4,517*            $11,523*               $4,902              $13,591
  (total Premium Plus firm
  Contribution to hra or hsa,
  if applicable)


                    source:

            kaiser/hret survey of employer-sponsored health Benefits, 2009.

          * estimate is statistically different from estimate for all non-hdhP/so Plans (p.05).
         ‡ When those firms that do not contribute to the hsa (29% for single and family coverage) are excluded from the calculation,
           the average firm contribution to the hsa for covered workers is $1,000 for single coverage and $1,640 for family coverage.
           for hdhP/hras, we refer to the amount that the employer commits to make available to an hra as a contribution for ease
           of discussion. hras are notional accounts, and employers are not required to actually transfer funds until an employee
           incurs expenses. thus, employers may not expend the entire amount that they commit to make available to their
           employees through an hra. therefore, the employer contribution amounts to hras that we capture in the survey may


                                                                                                                                                                                           High-Deductible Health Plans with Savings Option
           exceed the amount that employers will actually spend.
         § in order to compare costs for hdhP/sos to all other plans that are not hdhP/sos, we created composite variables excluding
           hdhP/so data.
         na: not applicable.
         note: Values shown in the table may not equal the sum of their component parts. the averages presented in the table are
         aggregated at the firm level and then averaged, which is methodologically more appropriate than adding the averages.
         this is relevant for total annual Premium, total annual firm Contribution, and total annual Cost.


                                                                                                                                                                                           8
                                                                                                                                                                                           s ection ei ght


                                                                                                                                                                                     133
                                                              t h e k a i s e r fa m i ly f o u n d at i o n - a n d - h e a lt h r e s e a r C h  e d u C at i o n a l t r u s t
Employer Health Benefits          2 0 0 9 A n n u a l s u r ve y


                                                                 e x h i B i t 8. 9

                                                                 distribution of Covered Workers with the following General annual deduc tible amounts for single
                                                                 Coverage, hsa- Qualified hdhPs and hdhP/hras, 2009


                                                                             HDHP/HRA                                     42%                                                 23%                     30%                6%


                                                                HSA QUALIFIED HDHP                            27%                                      26%                                36%                           10%


                                                                              HDHP/SO                             33%                                            25%                            34%                     9%

                                                                                          0%             10%             20%             30%            40%             50%         60%   70%         80%         90%         100%


                                                                                      source:
                                                                                                                                                                                                                  $1,000 $1,499
                                                                                kaiser/hret survey of employer-sponsored health Benefits, 2009.                                                                   $1,500 $1,999

                                                                                                                                                                                                                  $2,000 $2,999
                                                                             note: the minimum annual deductible for workers enrolled in hsa-qualified hdhPs is $1,150 in 2009                                    $3,000 OR MORE
                                                                             according to federal regulation. therefore, the distribution for hsa-qualified hdhPs starts at $1,150.


                                                                e x h i B i t 8. 10

                                                                 among Covered Workers, distribution of type of G eneral annual deduc tible for family Coverage,
                                                                 hdhP/hr as and hsa- Qualified hdhPs, 2009


                                                                                                                                               aggregate amount                           separate amount per Person

                                                                 hdhP/hra                                                                                  81%                                              19%
                                                                 hsa-Qualified hdhP                                                                         93                                              7
                                                                 hDhp/so                                                                                   89%                                              11%
High-Deductible Health Plans with Savings Option


                                                                                      source:

                                                                                kaiser/hret survey of employer-sponsored health Benefits, 2009.


                                                                             note: the survey distinguished between plans that have an aggregate deductible amount in which all family members’ out-of-pocket
                                                                             expenses count toward the deductible, and plans that have a separate amount for each family member, typically with a limit on the
                                                                             number of family members required to reach that amount.


                                                   8
s ection eig ht


                                                       134
                                                             t h e k a i s e r fa m i ly f o u n d at i o n - a n d - h e a lt h r e s e a r C h  e d u C at i o n a l t r u s t
Employer Health Benefits          2 0 0 9 An n u a l s u r ve y


e x h i B i t 8.1 1

 distribution of Covered Workers with the following aggregate family deduc tible amounts,
 hdhP/hras and hsa- Qualified hdhPs, 2009


           HDHP/HRA             18%                       25%                                  22%                            18%                       18%


HSA QUALIFIED HDHP           13%             14%                            31%                                  16%                              26%

             HDHP/SO         14%                    19%                            28%                               16%                            23%

                        0%         10%        20%         30%            40%             50%             60%            70%             80%             90%            100%


                      source:
                                                                                                                                                         $2,000 $2,499
              kaiser/hret survey of employer-sponsored health Benefits, 2009.                                                                            $2,500 $2,999

                                                                                                                                                         $3,000 $3,999
           note: the survey distinguished between family deductibles that are an aggregate amount in which all family                                    $4,000 $4,999
           members’ out-of-pocket expenses count toward the deductible, and plans that have a separate amount for each
                                                                                                                                                         $5,000 OR MORE
           family member, typically with a limit on the number of family members required to reach that amount. the
           minimum annual family deductible for workers enrolled in hsa-qualified hdhP is $2,300 in 2009 according to
           federal regulation. therefore, the distribution for hsa-qualified hdhPs starts at $2,300.


e x h i B i t 8.1 2

 Percentage of Covered Wor kers with Coverage for the following s er vices Without having to first
 m eet the d educ tible, hdhP/hr as and hsa- Qualified hdhPs, by B enefit type, 2009


                                                    hdhP/hra                           hsa-Qualified hdhP                                       hdhP/so

    Preventive Care                                   94%                                           90%                                             92%
    Prescription drugs                                71%                                           na                                              na


                                                                                                                                                                                         High-Deductible Health Plans with Savings Option
                      source:

              kaiser/hret survey of employer-sponsored health Benefits, 2009.


           na: not applicable. firms with either hdhP/hras or hsa-qualified hdhPs were asked about preventive benefits, but only firms
           with hdhP/hras were asked about prescription drugs. hsa-qualified hdhPs are required by law to apply the plan deductible
           to nearly all services.


                                                                                                                                                                                         8
                                                                                                                                                                                         s ection ei ght


                                                                                                                                                                                   135
                                                            t h e k a i s e r fa m i ly f o u n d at i o n - a n d - h e a lt h r e s e a r C h  e d u C at i o n a l t r u s t
Employer Health Benefits          2 0 0 9 A n n u a l s u r ve y


                                                                e x h i B i t 8. 13

                                                                 Percentage of Covered Workers in Par tially or Completely self-funded hdhP/hras and hsa-Qualified
                                                                 hdhPs, 2009


                                                                      100%

                                                                       90%

                                                                       80%

                                                                       70%
                                                                                                        61%
                                                                       60%

                                                                       50%                                                                                                                             48%
                                                                                                                                                                  40%
                                                                       40%

                                                                       30%

                                                                       20%

                                                                       10%

                                                                         0%
                                                                                                     HDHP/HRA                                           HSA QUALIFIED HDHP                            HDHP/SO


                                                                                      source:

                                                                                kaiser/hret survey of employer-sponsored health Benefits, 2009.


                                                                              note: for definitions of self-funded and fully insured Plans, see the introduction to section 10.


                                                                e x h i B i t 8. 14

                                                                 distr ibution of Covered Workers with the following annual employer Contr ibutions to their hr a
                                                                 or hsa, for single Coverage, 2009
High-Deductible Health Plans with Savings Option


                                                                              HDHP/HRA         7%                  20%                              21%                 4%          15%                    32%
                                                                                                                                                                                                1%
                                                                HSA QUALIFIED HDHP                               31%                               13%                  13%          9%   7%                 26%

                                                                                          0%             10%             20%             30%            40%             50%         60%   70%        80%         90%           100%


                                                                                      source:
                                                                                                                                                                                                                   $0
                                                                                kaiser/hret survey of employer-sponsored health Benefits, 2009.                                                                    $1 $399

                                                                                                                                                                                                                   $400 $599
                                                                              note: for single coverage, 29% of employers offering hsa-qualified hdhPs (covering 31%                                               $600 $799
                                                                              of workers enrolled in these plans) do not make contributions towards the hsas that their
                                                                                                                                                                                                                   $800 $999
                                                                              workers establish.
                                                                                                                                                                                                                   $1,000 $1,199

                                                                                                                                                                                                                   $1,200 OR MORE


                                                   8
s ection eig ht


                                                       136
                                                             t h e k a i s e r fa m i ly f o u n d at i o n - a n d - h e a lt h r e s e a r C h  e d u C at i o n a l t r u s t
Employer Health Benefits            2 0 0 9 An n u a l s u r ve y


e x h i B i t 8.1 5

 distr ibution of Covered Workers with the following annual employer Contr ibutions to their hr a
 or hsa, for family Coverage, 2009


             HDHP/HRA        11%              16%                           27%                                   19%                  8%                   18%


  HSA QUALIFIED HDHP                      31%                                       29%                             11%           6%          9%           6%         8%

                        0%          10%          20%          30%            40%             50%            60%             70%             80%              90%            100%


                      source:
                                                                                                                                                            $0
              kaiser/hret survey of employer-sponsored health Benefits, 2009.                                                                               $1 $999

                                                                                                                                                            $1,000 $1,499
           note: for family coverage, 29% of employers offering hsa-qualified hdhPs (covering 31%                                                           $1,500 $1,999
           of workers enrolled in these plans) do not make contributions towards the hsas that their
                                                                                                                                                            $2,000 $2,499
           workers establish.
                                                                                                                                                            $2,500 $2,999

                                                                                                                                                            $3,000 OR MORE


e x h i B i t 8.1 6

 distr ibution of firm Contributions to the hr a for single and family Coverage relative to the
 average annual firm Contribution to the hr a, 2009


                             single Coverage                                                                        family Coverage
         Premium range,                       Percent Covered                               Premium range,                                  Percent Covered
          dollar amount                       Workers in range                               dollar amount                                  Workers in range

        less than $841                                 49%                                  less than $1,659                                             50%


                                                                                                                                                                                           High-Deductible Health Plans with Savings Option
       $841 to $1,052                                 19%                                 $1,659 to $2,073                                             20%
      $1,052 to $1,262                                 7%                                 $2,073 to $2,488                                              4%
       $1,262 or more                                  25%                                   $2,488 or more                                              27%


                      source:


              kaiser/hret survey of employer-sponsored health Benefits, 2009.


           note: the average annual firm contribution to the hra is $1,052 for single coverage and $2,073 for family coverage. the hra
           account contribution distribution is relative to the average single or family account contribution. for example, $841 is 80% of the
           average single hra account contribution and $1,262 is 120% of the average single hra account contribution. the same break
           points relative to the average are used for the distribution for family coverage.


                                                                                                                                                                                           8
                                                                                                                                                                                           s ection ei ght


                                                                                                                                                                                     137
                                                              t h e k a i s e r fa m i ly f o u n d at i o n - a n d - h e a lt h r e s e a r C h  e d u C at i o n a l t r u s t
Employer Health Benefits          2 0 0 9 A n n u a l s u r ve y


                                                                e x h i B i t 8. 17

                                                                 distr ibution of firm Contributions to the hsa for single and family Coverage relative to the
                                                                 average annual firm Contribution to the hsa, 2009


                                                                                                  single Coverage                                                                      family Coverage
                                                                                                                        Percent Covered                                                             Percent Covered
                                                                       Contribution range                                                                              Contribution range
                                                                                                                        Workers in range                                                            Workers in range

                                                                          less than $550                                           55%                                     less than $901                 55%
                                                                          $550 to $688                                             5%                                    $901 to $1,126                  9%
                                                                          $688 to $826                                             6%                                   $1,126 to $1,352                 6%
                                                                           $826 or more                                            33%                                    $1,352 or more                  30%


                                                                                      source:


                                                                                kaiser/hret survey of employer-sponsored health Benefits, 2009.


                                                                             note: the average annual firm contribution to the hsa is $688 for single coverage and $1,126 for family coverage. the distribution
                                                                             includes workers in firms who do not make any contribution. the hsa account contribution distribution is relative to the average
                                                                             single or family account contribution. for example, $550 is 80% of the average single hsa account contribution and $826 is 120%
                                                                             of the average single hsa account contribution. the same break points relative to the average are used for the distribution for
                                                                             family coverage.
High-Deductible Health Plans with Savings Option


                                                   8
s ection eig ht


                                                       138
                                                             t h e k a i s e r fa m i ly f o u n d at i o n - a n d - h e a lt h r e s e a r C h  e d u C at i o n a l t r u s t
Employer Health Benefits          2 0 0 9 An n u a l s u r ve y


e x h i B i t 8.1 8

 distr ibution of Covered Wor kers in hdhP/hr as and hsa- Qualified hdhPs With the following types
 of Cost shar ing in addition to the G eneral annual deduc tible, 2009


                                                                                                                           hsa-Qualified
 separate Cost sharing for a hospital Admission                                                 hdhP/hra                                                   hdhP/so§
                                                                                                                              hdhP

    deductible                                                                                          0%                         na                               0%
    Copayment and/or Coinsurance
     Copayment                                                                                          4                            3%                            3
     Coinsurance                                                                                       69                           43                            52
     Both Copay and Coinsurance‡                                                                       1                           1                            1
    Charge Per day                                                                                     1                            2                             1
    none                                                                                               26                           52                            43

 separate Cost sharing for an outpatient surgery episode

    deductible                                                                                          2%                         na                               1%
    Copayment and/or Coinsurance
     Copayment                                                                                          3                            3%                            3
     Coinsurance                                                                                       62                           44                            51
     Both Copay and Coinsurance‡                                                                        1                            0                            1
    none                                                                                               34                           52                            46

 separate Cost sharing for physician office visits

    Copayment only                                                                                    30%                            6%                           14%
    Coinsurance only                                                                                  56                            36                            44
    Both Copayment and Coinsurance‡                                                                    3                             2                             2
    none                                                                                              10                            54                            39


                      source:


                                                                                                                                                                                           High-Deductible Health Plans with Savings Option
              kaiser/hret survey of employer-sponsored health Benefits, 2009.

           ‡ this includes enrollees who are required to pay the higher amount of either the copayment or coinsurance under the plan.

           § information on separate deductibles for hospital admissions or outpatient surgery was collected for hdhP/hras only.

           na: not applicable. information on separate annual deductibles for hospital admissions or outpatient surgery was not collected for
           hsa-qualified hdhPs because federal regulations make it unlikely the plan would have a separate deductible for specific services.
           note: as in past years, we collected information on the cost-sharing provisions for hospital admissions that are in addition to any
           general annual plan deductible. however, for the 2009 survey, in order to better capture the prevalence of combinations of cost
           sharing, the survey was changed to ask a series of yes or no questions. Previously, the question asked respondents to select one
           response from a list of types of cost sharing, such as separate deductibles, copayments, coinsurance, and per diem payments (for
           hospitalization only). due to the change in question format, the distribution of workers with types of cost sharing does not equal
           100% as workers may face a combination of types of cost sharing. less than 1% of covered workers in hdhP/sos have an “other”
           type of cost sharing for a hospital admission, 0% have an “other” type of cost sharing for an outpatient surgery, and 2% have an
           “other” type of cost sharing for physician office visits.


                                                                                                                                                                                           8
                                                                                                                                                                                           s ection ei ght


                                                                                                                                                                                     139
                                                              t h e k a i s e r fa m i ly f o u n d at i o n - a n d - h e a lt h r e s e a r C h  e d u C at i o n a l t r u s t
Employer Health Benefits          2 0 0 9 A n n u a l s u r ve y


                                                                e x h i B i t 8. 19

                                                                 among firms o ffering hdhP/sos, employer opinions on outcomes and reasons for o ffering
                                                                 hdhP/sos, 2009


                                                                                                                                                                                            all large firms
                                                                                                                                                                          all small firms
                                                                                                                                                                                             (200 or more     all firms
                                                                                                                                                                         (3–199 Workers)
                                                                                                                                                                                                Workers)

                                                                 most successful outcome

                                                                    encourage employees to be better health care consumers                                                          17%          37%            27%
                                                                    Controlling health care costs/lower costs                                                                       56           43             49
                                                                    too early to tell                                                                                                6            5              6
                                                                    has not been successful                                                                                          6            3              4
                                                                    Providing employees with more choice                                                                            1            1              1
                                                                    other                                                                                                           13           10             11
                                                                    don't know                                                                                                       1            1              1

                                                                 biggest challenge*

                                                                    administration                                                                                                  6%             2%             4%
                                                                    Building participation                                                                                          6              9              7
                                                                    educating/communicating with employees regarding
                                                                                                                                                                                    45           78              61
                                                                      benefit
                                                                    employee cannot afford deductible                                                                               16             5            10
                                                                    none                                                                                                             6            1             3
                                                                    other                                                                                                           22             4            13
                                                                    don't know                                                                                                       1             1             1

                                                                 how satisfied are employees

                                                                    Very satisfied                                                                                                  35%          41%            38%
                                                                    somewhat satisfied                                                                                              44           44             44
High-Deductible Health Plans with Savings Option


                                                                    somewhat dissatisfied                                                                                           10            6              8
                                                                    Very dissatisfied                                                                                                6            1              3
                                                                    don't know                                                                                                       6            8              7

                                                                 primary reason for offering*

                                                                    save on health care costs                                                                                       84%          60%            72%
                                                                    to offer a lower cost alternative as a choice                                                                    8            8              8
                                                                    employee request                                                                                                 2            6              4
                                                                    employee retention/health care trend                                                                            1            3              2
                                                                    encourage employees to be more responsible for health
                                                                                                                                                                                     1           17               9
                                                                      care costs
                                                                    other                                                                                                            5             6             6
                                                                    don't know                                                                                                      1            1            1


                                                                                      source:

                                                   8                            kaiser/hret survey of employer-sponsored health Benefits, 2009.
s ection eig ht


                                                                             * distributions for all small firms and all large firms are statistically different (p.05).


                                                       140
                                                             t h e k a i s e r fa m i ly f o u n d at i o n - a n d - h e a lt h r e s e a r C h  e d u C at i o n a l t r u s t
Employer Health Benefits          2 0 0 9 An n u a l s u r ve y


e x h i B i t 8.2 0

 among fir ms not Currently o ffering an hdhP/hr a or hsa- Qualified hdhP, distr ibution of fir ms
 r epor ting the likelihood of o ffering an hdhP/hr a or hsa- Qualified hdhP in the nex t year, by
 fir m size, 2009*


                                                                          somewhat                        not                        not
                                                 Very likely                                                                                                 don’t know
                                                                            likely                     too likely                at all likely
 offer hDhp/hrA‡

  3–199 Workers                                        5%                        16%                         19%                         60%                        1%
  200–999 Workers                                      7                         14                          25                          54                         1
  1,000–4,999 Workers                                 10                         12                          25                          53                        1
  5,000 or more Workers                               11                         14                          20                          55                         1
 All firms                                             5%                        15%                         19%                         59%                        1%

 offer hsA-Qualified hDhp‡

  3–199 Workers                                        5%                        16%                         23%                         54%                       1%
  200–999 Workers                                      6                         14                          32                          47                         1
  1,000–4,999 Workers                                  8                         15                          29                          47                         1
  5,000 or more Workers                                9                         19                          21                          50                        1
 All firms                                             6%                        16%                         24%                         54%                       1%


                      source:

              kaiser/hret survey of employer-sponsored health Benefits, 2009.


           * tests found no statistically different distributions between firm size category and all other firms (p.05).
           ‡ among firms not currently offering this type of hdhP/so.


                                                                                                                                                                                             High-Deductible Health Plans with Savings Option


                                                                                                                                                                                             8
                                                                                                                                                                                             s ection ei ght


                                                                                                                                                                                       141
                                                                t h e k a i s e r fa m i ly f o u n d at i o n - a n d - h e a lt h r e s e a r C h  e d u C at i o n a l t r u s t
60%

                                      $4,8 2 4
           Employer Health Benefits
$ 13,375
              2009 annual surVey


            Prescription
           Drug Benefits


                 section


                     9


           2009
section nine
                                      Employer Health Benefits          2 0 0 9 A n n u a l s u r ve y


                          9                  preSCription Drug BenefitS
 Prescription Drug Benefits


                                                    virTually       all covered workers have coverage for prescripTion drugs .                                 m ore   Than Three in four covered

                                                    workers are in plans wiTh Three or more cosT - sharing Tiers for prescripTion drugs .                                      c opaymenTs   raTher

                                                    Than coinsurance conTinue To be The dominanT form of cosT sharing for prescripTion drugs .


                                                    presCripTioN Drug beNefiTs                                                               Among workers covered by plans with three or more
                                                       As in prior years, nearly all (98%) covered workers                                   tiers of cost sharing for prescription drugs, a large
                                                        in employer-sponsored plans have a prescription                                       majority face copayments rather than coinsurance
                                                        drug benefit.                                                                         for the first three tiers (Exhibit 9.3). The
                                                                                                                                              percentages differ slightly across drug types because
                                                       A large majority of covered workers (89%) in 2009                                     some plans have copayments for some drug tiers
                                                        have some sort of tiered cost-sharing formula for                                     and coinsurance for other drug tiers.
                                                        prescription drugs (Exhibit 9.1). Cost-sharing
                                                        tiers involve a health plan placing a drug on a                                          For covered workers in plans with three or more
                                                        formulary or preferred drug list; generally classifying                                   of cost sharing for prescription drugs, the average
                                                        those drugs as generic, preferred brand-name, or                                          drug copayments for first-tier drugs ($10),
                                                        nonpreferred brand-name, and assigning different                                          second-tier drugs ($27), and third-tier drugs
                                                        cost sharing to each category. Over the past years,                                       ($46) are consistent with the amounts reported
                                                        an increasing number of plans have created a fourth                                       in 2008 (Exhibit 9.4).
                                                        tier of drug cost sharing, which may be used for                                         For covered workers in plans with three or
                                                        lifestyle drugs or expensive biologics.                                                   more tiers of cost sharing for prescription drugs
                                                       Seventy-eight percent of covered workers are                                              who face coinsurance rather than copayments,
                                                        enrolled in plans with three, four, or more tiers                                         coinsurance levels average 20% for first-tier drugs,
                                                        of cost sharing for prescription drugs, a similar                                         26% for second-tier drugs, and 37% for third-
                                                        percentage to last year (77%) (Exhibit 9.1). The                                          tier drugs, also similar to the percentages reported
                                                        prevalence of three or more tiers of cost sharing has                                     in 2008 (Exhibit 9.4).
                                                        increased from 69% of workers in 2004.                                               This year, 11% of workers are in a plan that has
                                                           HDHP/SOs have a different cost-sharing pattern                                    four or more tiers of cost sharing for prescription
                                                            from other plan types. Only 43% of covered                                        drugs (Exhibit 9.1). For covered workers in plans
                                                            workers in HDHP/SOs are in a plan with three                                      with four cost-sharing tiers, 41% face a copayment
                                                            or more tiers of cost sharing for prescription                                    for fourth-tier drugs and 29% face coinsurance
                                                            drugs. Fifteen percent of covered workers in                                      (Exhibit 9.3).
                                                            HDHP/SOs are in plans that apply the same                                            The average copayment for a fourth-tier drug is
                                                            cost-sharing structure regardless of the type of                                      $85 and the average coinsurance is 31% (Exhibit
                                                            drug, and an additional 29% are in plans that                                         9.4). These amounts are not statistically different
                                                            pay 100% of prescription costs once the plan                                          from the amounts reported in 2008.
                                                            deductible is met (Exhibit 9.2).
                                                                                                                                             Twelve percent of covered workers are in a plan
                                                                                                                                              that has two tiers for prescription drug cost sharing
                                                                                                                                              (Exhibit 9.1). Similar to workers in plans with other
                                                                                                                                              cost-sharing tiers, copayments are more common
                                                                                                                                              than coinsurance for workers in plans with two
                                                                                                                                              tiers (Exhibit 9.5). The average copayment for the
                                                                                                                                              first tier is $10, and the average copayment for the
                                                                                                                                              second tier is $26 (Exhibit 9.6).


                              144
                                    t h e k a i s e r fa m i ly f o u n d at i o n - a n d - h e a lt h r e s e a r C h  e d u C at i o n a l t r u s t
section nine
                                                                                              Employer Health Benefits          2 0 0 9 An n u a l s u r ve y


                                                                                                                                                                           9


                                                                                                                                                                            Prescription Drug Benefits
   Five percent of covered workers are covered by plans
    in which cost sharing is the same regardless of the                  Generic drugs: A drug product that is no longer
    type of drug chosen (Exhibit 9.1). Among these                       covered by patent protection and thus may be
    covered workers, 40% have copayments and 57%                         produced and/or distributed by multiple drug
    have coinsurance (Exhibit 9.7). The vast majority                    companies.
    of covered workers in HDHP/SOs with the same                         Preferred drugs: Drugs included on a formulary
    cost sharing regardless of the type of drug face                     or preferred drug list; for example, a brand-name
    coinsurance rather than copayments (83% vs. 7%)                      drug without a generic substitute.
    for prescriptions (Exhibit 9.7).
                                                                         Nonpreferred drugs: Drugs not included on a
       For those workers with the same cost sharing                     formulary or preferred drug list; for example, a
        regardless of the type of drug, the average                      brand-name drug with a generic substitute.
        copayment is $15 and the average coinsurance is
        22% (Exhibit 9.8).                                               Fourth-tier drugs: New types of cost-sharing
                                                                         arrangements that typically build additional
   Twelve percent of covered workers with drug                          layers of higher copayments or coinsurance for
    coverage face a separate drug deductible, in addition                specifically identified types of drugs, such as
    to any general annual deductible the plan may have                   lifestyle drugs or biologics.
    (Exhibit 9.9). The average separate annual drug
    deductible is $108.                                                  Brand-name drugs: Generally, a drug
                                                                         product that is covered by a patent and is thus
   As in 2008, ten percent of covered workers with                      manufactured and sold exclusively by one firm.
    drug coverage have a separate annual out-of-pocket                   Cross-licensing occasionally occurs, allowing an
    maximum that applies to prescription drugs                           additional firm to market the drug. After the
    (Exhibit 9.10). The average annual separate out-of-                  patent expires, multiple firms can produce the
    pocket maximum is $1,912.                                            drug product, but the brand name or trademark
                                                                         remains with the original manufacturer’s product.


                                                                                                                                                                     145
                                              t h e k a i s e r fa m i ly f o u n d at i o n - a n d - h e a lt h r e s e a r C h  e d u C at i o n a l t r u s t
section nine
                                      Employer Health Benefits          2 0 0 9 A n n u a l s u r ve y


                                        e x h i B i t 9. 1

                                        distr ibution of Covered Workers facing different Cost-shar ing for mulas for Prescr iption drug
                          9             B enefits, 2000–2009
 Prescription Drug Benefits


                                       2000                         27%                                                                49%                                               22%                 2%

                                       2001 *                                   41%                                                                        41%                                 18%           1%

                                       2002 *                                                 55%                                                                30%                             13%         1%

                                       2003 *                                                      63%                                                                 23%                       13%         2%

                                       2004 ‡   3%                                                        65%                                                                20%                     10%     1%

                                       2005 *   4%                                                               70%                                                               15%               8%      2%

                                       2006        5%                                                             69%                                                              16%               8%      2%
                                                                                                                                                                                                           2%
                                       2007 ‡      7%                                                               68%                                                            16%               6%     1%

                                       2008 *      7%                                                                 70%                                                            15%             4% 3% 1%

                                       2009 *        11%                                                                  67%                                                      12%           5% 3% 3%

                                              0%              10%               20%               30%              40%               50%               60%       70%          80%              90%         100%


                                                             source:
                                                                                                                                                                                   FOUR OR MORE TIERS
                                                        kaiser/hret survey of employer-sponsored health Benefits, 2000-2009.                                                       THREE TIERS

                                                                                                                                                                                   TWO TIERS
                                                    * distribution is statistically different from distribution for the previous year shown (p.05).                               PAYMENT IS THE SAME
                                                    ‡ no statistical tests are conducted between 2003 and 2004 or between 2006 and 2007 due                                        REGARDLESS OF TYPE OF DRUG
                                                     to the addition of a new category.                                                                                            NO COST SHARING AFTER
                                                                                                                                                                                   DEDUCTIBLE IS MET
                                                    note: fourth-tier drug cost sharing information was not obtained prior to 2004.
                                                                                                                                                                                   OTHER


                              146
                                    t h e k a i s e r fa m i ly f o u n d at i o n - a n d - h e a lt h r e s e a r C h  e d u C at i o n a l t r u s t
section nine
                                                                                                                   Employer Health Benefits          2 0 0 9 An n u a l s u r ve y


 e x h i B i t 9.2

 distr ibution of Covered Workers facing different Cost-shar ing for mulas for Prescr iption drug
 B enefits, by Plan type, 2009                                                                                                                                                                  9


                                                                                                                                                                                                 Prescription Drug Benefits
                                                                                                                                                                          1%

     HMO*            10%                                                   66%                                                                15%                6%      3%
                                                                                                                                                                         1%
      PPO*           12%                                                         69%                                                                11%           4%           3%
                                                                                                                                                                       2%
      POS*        7%                                                      70%                                                                      17%              3%  1%

 HDHP/SO*         7%                            36%                                8%                 15%                                 29%                           5%

ALL PLANS            11%                                                      67%                                                             12%             5% 3% 3%

             0%            10%            20%            30%            40%             50%              60%              70%             80%              90%             100%


                     source:
                                                                                                                                                FOUR OR MORE TIERS

               kaiser/hret survey of employer-sponsored health Benefits, 2009.                                                                  THREE TIERS

                                                                                                                                                TWO TIERS
            * distribution is statistically different from all Plans distribution (p.05).                                                      PAYMENT IS THE SAME
                                                                                                                                                REGARDLESS OF TYPE OF DRUG

                                                                                                                                                NO COST SHARING AFTER
                                                                                                                                                DEDUCTIBLE IS MET

                                                                                                                                                OTHER


                                                                                                                                                                                          147
                                                                   t h e k a i s e r fa m i ly f o u n d at i o n - a n d - h e a lt h r e s e a r C h  e d u C at i o n a l t r u s t
section nine
                                      Employer Health Benefits          2 0 0 9 A n n u a l s u r ve y


                                        e x h i B i t 9. 3

                                        among Wor kers with three, four, or m ore tiers of Cost sharing, distribution of Covered Workers
                                        with the following types of Cost shar ing for Prescr iption drugs, by drug and Plan type, 2009
                          9
 Prescription Drug Benefits


                                                                                                                                                                       Plan Pays
                                                                                                                                                            either    entire Cost     some
                                                                                                                           Copay             Coinsurance
                                        first-Tier Drugs, often Called generic Drugs                                                                       Copay or    after any      other
                                                                                                                            only                only
                                                                                                                                                         Coinsurance‡ deductibles    amount
                                                                                                                                                                        are met

                                         hmo*                                                                               92%                      4%       2%          1%               3%
                                         PPo                                                                                84                       7        3            1                6
                                         Pos*                                                                               92                       3        2            3                0
                                         hdhP/so*                                                                           83                       9        1            4                2
                                        All plANs                                                                           86%                      6%       2%           1%               4%

                                                                                                                                                                       Copay or
                                        second-Tier Drugs, often Called preferred                                                                                     Coinsurance
                                          Drugs                                                                                                                        Plus any
                                                                                                                                                                      differences§

                                         hmo*                                                                               87%                     4%        6%          0%                4%
                                         PPo                                                                                76                     10         6          1                 9
                                         Pos*                                                                               91                      3         2          1                 3
                                         hdhP/so*                                                                           76                     15         2          1                 6
                                        All plANs                                                                           79%                     9%        6%         1%                7%

                                        Third-Tier Drugs, often Called Nonpreferred
                                          Drugs

                                         hmo*                                                                               81%                     6%        6%         1%            7%
                                         PPo                                                                                71                     11         8           1            10
                                         Pos*                                                                               87                      6         2           0             4
                                         hdhP/so*                                                                           74                     15         4          1             7
                                        All plANs                                                                           75%                    10%        7%         1%            9%

                                        fourth-Tier Drugs

                                         hmo*                                                                                51%                   15%        3%          4%           27%
                                         PPo                                                                                 44                    27         2           2            25
                                         Pos                                                                                 nsd                   nsd       nsd         nsd           nsd
                                         hdhP/so                                                                             nsd                   nsd       nsd         nsd           nsd
                                        All plANs                                                                            41%                   29%        2%          2%           25%


                                                             source:

                                                       kaiser/hret survey of employer-sponsored health Benefits, 2009.

                                                    * distribution is statistically different from all Plans distribution within drug type (p.05).
                                                    ‡ this includes enrollees who are required to pay the higher amount of either the copayment or coinsurance under the plan.

                                                    § Category includes workers who pay a copayment or coinsurance plus the difference between the cost of the prescription and the cost
                                                     of a comparable generic drug.
                                                    nsd: not sufficient data.
                                                    note: these distributions do not include the 3% of covered workers whose employers report “none of the above” to the survey question
                                                    about the type of prescription drug cost-sharing formula. for definitions of Generic, Preferred, nonpreferred, and fourth-tier drugs,
                                                    see the introduction to section 9.
                              148
                                    t h e k a i s e r fa m i ly f o u n d at i o n - a n d - h e a lt h r e s e a r C h  e d u C at i o n a l t r u s t
section nine
                                                                                                              Employer Health Benefits          2 0 0 9 An n u a l s u r ve y


e x h i B i t 9.4

among Covered Workers with three, four, or m ore tiers of Prescr iption Cost shar ing, average
Copayments and average Coinsurance, 2000–2009                                                                                                                                              9


                                                                                                                                                                                            Prescription Drug Benefits
                                                                  2000 2001 2002 2003 2004 2005 2006 2007 2008 2009

Average Copayments
 first-tier drugs, often Called Generic                             $8         $8   $9               $9*        $10*        $10  $11*              $11        $10         $10
 second-tier drugs, often Called Preferred                         $15        $16* $18*             $20*        $22*        $23* $25*              $25        $26         $27
 third-tier drugs, often Called nonpreferred                       $29        $28 $32*              $35*        $38*        $40* $43*              $43        $46*        $46
 fourth-tier drugs                                                   ^          ^    ^                ^         $59         $74 $59                $71*       $75         $85

Average Coinsurance
 first-tier drugs, often Called Generic                            18%        18%        18%         18%        18%         19%        19%         21%        21%        20%
 second-tier drugs, often Called Preferred                         nsd        23%        24%         23%        25%         27%        26%         26%        25%        26%
 third-tier drugs, often Called nonpreferred                       28%        33%        40%         34%*       34%         38%        38%         40%        38%        37%
 fourth-tier drugs                                                  ^          ^          ^           ^         30%         43%*       42%         36%        28%        31%


                source:

            kaiser/hret survey of employer-sponsored health Benefits, 2000–2009.

        * estimate is statistically different from estimate for the previous year shown (p.05).
        ^   fourth-tier drug copayment or coinsurance information was not obtained prior to 2004.
        nsd: not sufficient data.


                                                                                                                                                                                     149
                                                              t h e k a i s e r fa m i ly f o u n d at i o n - a n d - h e a lt h r e s e a r C h  e d u C at i o n a l t r u s t
section nine
                                      Employer Health Benefits          2 0 0 9 A n n u a l s u r ve y


                                        e x h i B i t 9. 5

                                        among Workers with two tiers of Cost sharing for Prescription drugs, distribution of Covered Workers
                          9             with the following types of Cost sharing for Prescription drugs, by drug and Plan type, 2009
 Prescription Drug Benefits


                                                                                                                                                                       Plan Pays
                                                                                                                                                            either    entire Cost      some
                                                                                                                           Copay             Coinsurance
                                        first-Tier Drugs, often Called generic Drugs                                                                       Copay or    after any       other
                                                                                                                            only                only
                                                                                                                                                         Coinsurance‡ deductibles     amount
                                                                                                                                                                        are met

                                         hmo*                                                                               95%                     3%        1%           0%          2%
                                         PPo                                                                                72                      8          7            9           3
                                         Pos*                                                                               95                      0          0            5          1
                                         hdhP/so                                                                            nsd                    nsd        nsd          nsd         nsd
                                        All plANs                                                                           75%                    10%         5%           8%          2%

                                                                                                                                                                         Copay or
                                        second-Tier Drugs, often Called preferred                                                                             either                   some
                                                                                                                           Copay             Coinsurance                Coinsurance
                                          Drugs                                                                                                              Copay or                  other
                                                                                                                            only                only                        Plus
                                                                                                                                                           Coinsurance‡               amount
                                                                                                                                                                        difference§

                                         hmo*                                                                               90%                     3%        1%           0%          7%
                                         PPo                                                                                51                     25         10            1          13
                                         Pos*                                                                               81                      6          0            0          13
                                         hdhP/so                                                                            nsd                    nsd        nsd          nsd         nsd
                                        All plANs                                                                           61%                    24%         6%          1%          9%


                                                             source:

                                                       kaiser/hret survey of employer-sponsored health Benefits, 2009.

                                                    * distribution is statistically different from all Plans distribution within drug type (p.05).
                                                    ‡ this includes enrollees who are required to pay the higher amount of either the copayment or coinsurance under the plan.

                                                    § Category includes workers who pay a copayment or coinsurance plus the difference between the cost of the prescription
                                                     and the cost of a comparable generic drug.
                                                    nsd: not sufficient data.
                                                    note: these distributions do not include the 3% of covered workers whose employers report “none of the above” to the
                                                    survey question about the type of prescription drug cost-sharing formula. for definitions of Generic and Preferred drugs,
                                                    see the introduction to section 9.


                              150
                                    t h e k a i s e r fa m i ly f o u n d at i o n - a n d - h e a lt h r e s e a r C h  e d u C at i o n a l t r u s t
section nine
                                                                                                                 Employer Health Benefits          2 0 0 9 An n u a l s u r ve y


e x h i B i t 9.6

among Covered Workers with two tiers of Prescription Cost sharing, average Copayments and average
Coinsurance, 2000–2009                                                                                                                                                                        9


                                                                                                                                                                                               Prescription Drug Benefits
                                                                   2000       2001         2002      2003        2004        2005        2006       2007        2008        2009

Average Copayments
 first-tier drugs, often Called Generic                              $7        $8*          $9*        $9        $10          $10        $11         $10         $11         $10
 second-tier drugs, often Called Preferred                          $14       $15*         $18*       $20*       $22*         $22        $23         $23         $24         $26

Average Coinsurance
 first-tier drugs, often Called Generic                            19%         17%         20%        21%         17%        16%         22%         21%        19%         nsd
 second-tier drugs, often Called Preferred                         28%         25%         25%        28%         25%        24%         27%         28%        32%         28%


                source:

           kaiser/hret survey of employer-sponsored health Benefits, 2000–2009.

        * estimate is statistically different from estimate for the previous year shown (p.05).
        nsd: not sufficient data.


e x h i B i t 9.7

among Workers with the same Cost sharing regardless of type of drug, distribution of Covered
Workers with the following types of Cost sharing for Prescription drugs, by Plan type, 2009


                                                                                                                                  either
                                                                           Copay                   Coinsurance                                                some
                                                                                                                                 Copay or
                                                                            only                      only                                                 other amount
                                                                                                                               Coinsurance‡

 hmo                                                                        nsd                          nsd                           nsd                         nsd
 PPo*                                                                       25%                          69%                            4%                          1%
 Pos                                                                        nsd                          nsd                           nsd                         nsd
 hdhP/so*                                                                    7                           83                            1                          10
All plANs                                                                   40%                          57%                            2%                          1%


                    source:

             kaiser/hret survey of employer-sponsored health Benefits, 2009.

          * distribution is statistically different from all Plans distribution (p.05).
          ‡ this includes enrollees who are required to pay the higher amount of either the copayment or coinsurance under the plan.

          nsd: not sufficient data.
          note: these distributions do not include the 3% of covered workers whose employers report “none of the above” to the survey question
          about the type of prescription drug cost sharing formula.


                                                                                                                                                                                        151
                                                                 t h e k a i s e r fa m i ly f o u n d at i o n - a n d - h e a lt h r e s e a r C h  e d u C at i o n a l t r u s t
section nine
                                      Employer Health Benefits          2 0 0 9 A n n u a l s u r ve y


                                        e x h i B i t 9. 8

                                        among Covered Workers with the same Cost sharing regardless of type of drug, average Copayments
                          9             and average Coinsurance, 2000-2009
 Prescription Drug Benefits


                                                                                                            2000         2001        2002         2003          2004   2005    2006     2007     2008   2009
                                        Average Copayments                                                      $8        $10*         $10         $10          $14*   $10*    $13*     $13       $15    $15
                                        Average Coinsurance                                                  22%         20%          23%         22%           25%    23%     23%      22%      24%    22%


                                                          source:

                                                     kaiser/hret survey of employer-sponsored health Benefits, 2000–2009.

                                                  * estimate is statistically different from estimate for the previous year shown (p.05).


                                        e x h i B i t 9. 9

                                        Percentage of Covered Wor kers with drug Coverage Who face a s eparate drug deduc tible, by Plan
                                        type, 2005–2009*


                                         50%


                                         40%


                                         30%


                                         20%

                                                                                                                                                                14% 15%
                                                                                                  11% 12% 11% 12%                             11%                               10% 11% 11%
                                                                                                                                                                                            12%
                                         10%                   8%       9%       8%                                                                        7%
                                                       4%

                                          0%
                                                                    HMO                                         PPO                                         POS                          ALL PLANS


                                                          source:
                                                                                                                                                                        2005     2007          2008     2009

                                                     kaiser/hret survey of employer-sponsored health Benefits, 2005–2009.

                                                  * tests found no statistical difference from estimate for the previous year shown (p.05).
                                                  note: information on hdhP/sos was not collected prior to 2008 because, due to federal regulations, it is unlikely a plan would have
                                                  a separate deductible for prescription drugs. in 2009, information on separate drug deductibles was collected for hdhP/hras only,
                                                  and 4% of covered workers in hdhP/hras have a separate drug deductible. in 2007, information on whether a plan has a separate
                                                  drug deductible was not imputed for one PPo and one Pos plan that cover prescription drugs. if these responses had been
                                                  imputed, the prevalence of separate drug deductibles would not have changed for PPos and would have increased or decreased
                                                  no more than 1% for Pos plans. Questions about separate drug deductibles were not asked in 2006.


                              152
                                    t h e k a i s e r fa m i ly f o u n d at i o n - a n d - h e a lt h r e s e a r C h  e d u C at i o n a l t r u s t
section nine
                                                                                                               Employer Health Benefits          2 0 0 9 An n u a l s u r ve y


e x h i B i t 9.1 0

 Percentage of Covered Workers with drug Coverage with a separate annual out-of-Pocket limit that
 applies to Prescription drugs, by Plan type, 2007–2009*                                                                                                                                    9


                                                                                                                                                                                             Prescription Drug Benefits
 50%


 40%


 30%


 20%


                                11%                 10%     11%       10%                               11%                                          10%       10%
 10%                     8%                                                                                                                8%
                6%                                                                             5%                  6%

  0%
                         HMO                                 PPO                                         POS                                       ALL PLANS


                      source:
                                                                                                                                                                         2007
              kaiser/hret survey of employer-sponsored health Benefits, 2007–2009.                                                                                       2008

                                                                                                                                                                         2009
           * tests found no statistical difference from estimate for the previous year shown (p.05).
           note: data for hdhP/sos are not included in this exhibit because hsa-qualified hdhPs are required by law to have an annual out-
           of-pocket limit of no more than $5,800 for single coverage and $11,600 for family coverage in 2009, making it unlikely a plan would
           include a separate out-of-pocket maximum for prescription drugs. as a result, only firms offering hdhP/hras were asked if the plan
           has a separate out-of-pocket maximum that applies to prescription drugs. among covered workers enrolled in hdhP/hras, 3% are
           enrolled in plans with a separate annual out-of-pocket limit that applies to prescription drugs in 2009.


                                                                                                                                                                                      153
                                                               t h e k a i s e r fa m i ly f o u n d at i o n - a n d - h e a lt h r e s e a r C h  e d u C at i o n a l t r u s t
60%

                                      $4,8 2 4
           Employer Health Benefits
$ 13,375
              2009 annual surVey


                  Plan
                Funding


                 section


                    10


           2009
Employer Health Benefits          2 0 0 9 A n n u a l s u r ve y


                            plan funDing
section ten


                                     T he e mployee r eTiremenT i ncome s ecuriTy a cT (erisa)                               of    1974     exempTs self - funded plans from sTaTe

                                     insurance laws , including reser ve requiremenTs , mandaTed benefiTs , premium Taxes , and consumer

                                     proTecTion regulaTions .                 o ver       one half    (57%)      of covered workers are in a self - funded healTh plan .

                                     b ecause larger firms have more employees over whom To spread The risk of cosTly claims , self funding is
       10                            more common and less risky for larger firms Than for smaller ones .
Plan Funding


                                       Slightly more than half (57%) of covered workers                                         A higher percentage of workers in PPOs are in
                                         are in a self-funded plan (Exhibit 10.1). The                                             a self-funded plan (67%), compared to 48% in
                                         percentage of covered workers who are in a plan that                                      conventional health plans, 48% in HDHP/SOs,
                                         is completely or partially self-funded has remained                                       40% in HMOs, and 25% in POS plans
                                         stable over the last few years, but has increase from                                     (Exhibit 10.2).
                                         44% in 1999.
                                                                                                                              Self-Funded Plan: An insurance arrangement
                                            As expected, covered workers in large firms (200
                                                                                                                              in which the employer assumes direct financial
                                             or more workers) are more likely to be in a self-
                                                                                                                              responsibility for the costs of enrollees’ medical
                                             funded plan than workers in small firms (3–199
                                                                                                                              claims. Employers sponsoring self-funded plans
                                             workers) (77% vs. 15%) (Exhibit 10.3). The
                                                                                                                              typically contract with a third-party administrator
                                             percentage of covered workers in self-funded
                                                                                                                              or insurer to provide administrative services for
                                             plans increases as the number of employees
                                                                                                                              the self-funded plan. In some cases, the employer
                                             increases. Forty-eight percent of workers in firms
                                                                                                                              may buy stop-loss coverage from an insurer to
                                             with 200 to 999 workers are in self-funded plans,
                                                                                                                              protect the employer against very large claims.
                                             compared to 80% of workers in firms with 1,000
                                             to 4,999 workers, and 88% of workers in firms                                    Fully Insured Plan: An insurance arrangement in
                                             with 5,000 or more workers (Exhibit 10.3).                                       which the employer contracts with a health plan
                                             As previously mentioned, these percentages                                       that assumes financial responsibility for the costs
                                             have changed little over the past several years                                  of enrollees’ medical claims.
                                             (Exhibit 10.1).


               156
                     t h e k a i s e r fa m i ly f o u n d at i o n - a n d - h e a lt h r e s e a r C h  e d u C at i o n a l t r u s t
Employer Health Benefits          2 0 0 9 An n u a l s u r ve y


e x h i B i t 10.1

 Percentage of Covered Workers in Par tially or Completely self-funded Plans, by firm size, 1999–2009*


                                                                                                                                                                                             section ten
                                       1999        2000       2001         2002         2003          2004         2005         2006          2007         2008          2009

   3–199 Workers                        13%        15%         17%         13%           10%          10%          13%            13%         12%          12%           15%
   200–999 Workers                      51         53          52          48            50           50           53             53          53           47            48
   1,000–4,999 Workers                  62         69          66          67            71           78           78             77          76           76            80
   5,000 or more Workers                62         72          70          72            79           80           82             89          86           89            88
                                                                                                                                                                                            10
 All firms                             44%         49%        49%          49%          52%           54%          54%          55%           55%          55%           57%


                                                                                                                                                                                             Plan Funding
                source:

           kaiser/hret survey of employer-sponsored health Benefits, 1999–2009.

         * tests found no statistical difference from estimate for the previous year shown (p.05).
         note: due to a change in the survey questionnaire, funding status was not asked of firms with conventional plans in 2006.
         therefore, conventional plan funding status is not included in this exhibit for 2006. for definitions of self-funded and fully
         insured plans, see the introduction to section 10.


e x h i B i t 10.2

 Percentage of Covered Workers in Par tially or Completely self-funded Plans, by Plan type, 1999–2009


                             1999         2000        2001         2002          2003          2004           2005          2006           2007           2008          2009

   Conventional               65%         64%          65%         58%           49%            43%            53%            ^            53%            47%            48%
   hmo                        16          23*          31*         27            29             29             32            33            34             40             40
   PPo                        60          63           61          61            61             64             65            63            65             64             67
   Pos                        42          45           42          40            44             46             36            32            34             29             25
   hdhP/so                     ^           ^            ^           ^             ^              ^              ^            50            41             35             48*

 All plANs                    44%         49%         49%          49%           52%            54%           54%            55%           55%            55%            57%


                source:

           kaiser/hret survey of employer-sponsored health Benefits, 1999–2009.

         * estimate is statistically different from estimate for the previous year shown (p.05).
         ^ information was not obtained for conventional plans in 2006 and hdhP/so plans prior to 2006.
         note: due to a change in the survey questionnaire, funding status was not asked of firms with conventional plans in 2006.
         therefore, conventional plan funding status is not included in this exhibit for 2006. for definitions of self-funded and fully
         insured plans, see the introduction to section 10.


                                                                                                                                                                                      157
                                                               t h e k a i s e r fa m i ly f o u n d at i o n - a n d - h e a lt h r e s e a r C h  e d u C at i o n a l t r u s t
Employer Health Benefits          2 0 0 9 A n n u a l s u r ve y


                        e x h i B i t 10. 3

                         Percentage of Covered Workers in Par tially or Completely s elf-funded Plans, by fir m size, region,
                         and i ndustr y, 2009
section ten


                                                                                                                                                  self-funded
                                                                                                                                  (employer Bears some or all of financial risk)

                         firm size
                           200–999 Workers                                                                                                           48%*
       10                  1,000–4,999 Workers                                                                                                       80*
                           5,000 or more Workers                                                                                                     88*
Plan Funding


                         All small firms (3–199 Workers)                                                                                             15%*
                         All large firms (200 or more Workers)                                                                                       77%*

                         regioN
                          northeast                                                                                                                   62%
                          midwest                                                                                                                     58
                          south                                                                                                                       63*
                          West                                                                                                                        40*

                         iNDusTry
                           agriculture/mining/Construction                                                                                            35%*
                           manufacturing                                                                                                              70*
                           transportation/Communications/utilities                                                                                    76*
                           Wholesale                                                                                                                  53
                           retail                                                                                                                     40*
                           finance                                                                                                                    61
                           service                                                                                                                    49*
                           state/local Government                                                                                                     59
                           health Care                                                                                                                72*

                         All firms                                                                                                                   57%


                                           source:

                                      kaiser/hret survey of employer-sponsored health Benefits, 2009.

                                   * estimate is statistically different from estimate for all other firms not in the indicated size, region, or industry category (p.05).
                                   note: for definitions of self-funded and fully insured plans, see the introduction to section 10.


               158
                     t h e k a i s e r fa m i ly f o u n d at i o n - a n d - h e a lt h r e s e a r C h  e d u C at i o n a l t r u s t
Employer Health Benefits          2 0 0 9 An n u a l s u r ve y


e x h i B i t 10.4

 Percentage of Covered Workers in Par tially or Completely self-funded Plans, by Plan type and firm
 size, 2009


                                                                                                                                                                                              section ten
                                                 Conventional                   hmo                         PPo                         Pos                    hdhP/so

   3–199 Workers                                    nsd                           6%*                        21%*                        5%*                       18%*
   200–999 Workers                                  nsd                          26*                         55*                        39                         36
   1,000–4,999 Workers                              nsd                          50                          87*                        53*                        81*
   5,000 or more Workers                            nsd                          61*                         93*                        76*                        96*                       10


                                                                                                                                                                                              Plan Funding
 All firms                                             48%                       40%                         67%                        25%                        48%


                     source:

             kaiser/hret survey of employer-sponsored health Benefits, 2009.

          * estimate is statistically different from estimate for all other firms not in the indicated size category within plan type (p.05).
          nsd: not sufficient data.
          note: for definitions of self-funded and fully insured plans, see the introduction to section 10.


e x h i B i t 10.5

 Percentage of Covered Workers in Par tially or Completely s elf-funded hmo Plans, by fir m size,
 1999–2009


                                             1999       2000       2001         2002         2003         2004         2005         2006        2007         2008         2009

   3–199 Workers                              5%          4%        14%          10%          5%           4%          10%           3%           1%          10%          6%
   200–999 Workers                           14          13         23           16          21           18           17           29           19           22          26
   1,000–4,999 Workers                       22          27         32           31          37           49           50           54           44           48          50
   5,000 or more Workers                     19          35*        40           38          44           40           44           47           58           66          61

 All hmo plANs                               16%         23%* 31%*              27%          29%          29%          32%          33%          34%         40%          40%


                source:

           kaiser/hret survey of employer-sponsored health Benefits, 1999-2009.

         * estimate is statistically different from estimate for the previous year shown (p.05).
         note: for definitions of self-funded and fully insured plans, see the introduction to section 10.


                                                                                                                                                                                       159
                                                                t h e k a i s e r fa m i ly f o u n d at i o n - a n d - h e a lt h r e s e a r C h  e d u C at i o n a l t r u s t
Employer Health Benefits          2 0 0 9 A n n u a l s u r ve y


                        e x h i B i t 10. 6

                         Percentage of Covered Workers in Par tially or Completely s elf-funded PPo Plans, by fir m size,
                         1999–2009
section ten


                                                                    1999          2000         2001          2002          2003         2004      2005   2006   2007   2008   2009

                         3–199 Workers                               19%          23%            23%          15%          13%              13%   18%    19%    17%    15%    21%
                         200–999 Workers                             69           72             66           63           60               63    67     61     65     55     55
                         1,000–4,999 Workers                         84           89             87           83           85               88    88     85     87     85     87
       10                5,000 or more Workers                       87           88             87           93           93               93    95     97     90*    94     93
Plan Funding


                         All ppo plANs                              60%           63%            61%          61%           61%             64%   65%    63%    65%    64%    67%

                                           source:

                                      kaiser/hret survey of employer-sponsored health Benefits, 1999–2009.

                                   * estimate is statistically different from estimate for the previous year shown (p.05).
                                   note: for definitions of self-funded and fully insured plans, see the introduction to section 10.


                        e x h i B i t 10. 7

                         Percentage of Covered Workers in Par tially or Completely s elf-funded Pos Plans, by fir m size,
                         1999–2009


                                                                    1999          2000         2001          2002          2003         2004      2005   2006   2007   2008   2009

                         3–199 Workers                               10%          10%            10%         10%            8%               9%    9%     6%    14%     9%     5%
                         200–999 Workers                             35           39             40          21*           42*              42    31     36     33     20     39
                         1,000–4,999 Workers                         62           71             60          67            73               63    48     62     47     52     53
                         5,000 or more Workers                       75           77             76          67            71               77    74     80     89     65     76

                         All pos plANs                              42%           45%            42%         40%           44%              46%   36%    32%    34%    29%    25%


                                           source:

                                      kaiser/hret survey of employer-sponsored health Benefits, 1999-2009.

                                   * estimate is statistically different from estimate for the previous year shown (p.05).
                                   note: for definitions of self-funded and fully insured plans, see the introduction to section 10.


               160
                     t h e k a i s e r fa m i ly f o u n d at i o n - a n d - h e a lt h r e s e a r C h  e d u C at i o n a l t r u s t
Employer Health Benefits          2 0 0 9 An n u a l s u r ve y


e x h i B i t 10.8

 Percentage of Covered Workers in Par tially or Completely s elf-funded hdhP/sos, by fir m size,
 2006–2009


                                                                                                                                                                                             section ten
                                                      2006                             2007                               2008                               2009

 3–199 Workers                                         7%                               4%                                 7%                                 18%
 200–999 Workers                                      57                               27                                 48                                  36
 1,000–4,999 Workers                                  81                               86                                 72                                  81
 5,000 or more Workers                               100                               97                                 91                                  96                            10


                                                                                                                                                                                             Plan Funding
 All hDhp/sos                                         50%                              41%                                35%                                 48%*


                source:

           kaiser/hret survey of employer-sponsored health Benefits, 2006–2009.

         * estimate is statistically different from estimate for the previous year shown (p.05).
         note: information on funding status for hdhP/sos was not collected prior to 2006. for definitions of self-funded and
         fully insured plans, see the introduction to section 10.


                                                                                                                                                                                      161
                                                               t h e k a i s e r fa m i ly f o u n d at i o n - a n d - h e a lt h r e s e a r C h  e d u C at i o n a l t r u s t
60%

                                      $4,8 2 4
           Employer Health Benefits
$ 13,375
              2009 annual surVey


           Retiree Health
              Benefits


                 section


                    11


           2009
Employer Health Benefits          2 0 0 9 A n n u a l s u r ve y


                                        r e t i r e e h e a lt h B e n e f i t S


                                                r eTiree     healTh benefiTs are an imporTanT consideraTion for older workers making decisions abouT Their

                                                reTiremenT .       h ealTh     benefiTs for reTirees also provide an imporTanT supplemenT To                            m edicare   for reTirees

                                                age     65   or older.        a mong      firms offering healTh benefiTs To Their workers , large firms                          (200   or more

                                                workers ) are much more likely Than small firms                               (3-199      workers ) To offer reTiree healTh benefiTs .       T he
                                                percenTage of large firms offering coverage fell dramaTically from The laTe                                       1980 s   To The early   1990 s ,
 section eleven


                                                and has been declining slowly since .


                                                   Twenty-nine percent of large firms (200 or more                                          Large firms (200 or more workers) with union
                                                    workers) that offer health benefits to their employees                                    workers are significantly more likely to offer
                                                    offer retiree coverage in 2009, similar to 31% in                                         retiree health benefits than large firms without
             11                                     2008 but down from 66% in 1988 (Exhibit 11.1).                                            union workers—47% of all large firms with
                                                                                                                                              union employees that offer health benefits offer
Retiree Health Benefits


                                                   The percentage of firms offering retiree health
                                                                                                                                              retiree health benefits, compared to 22% for all
                                                    benefits varies substantially by firm size, industry,
                                                                                                                                              large firms with no union employees (Exhibit
                                                    presence of union workers, and other factors.
                                                                                                                                              11.3).
                                                       Large firms (200 or more workers) are much
                                                                                                                                             Large firms (200 or more workers) with fewer
                                                        more likely to offer retiree health benefits than
                                                                                                                                              younger workers (less than 35% of workers are 26
                                                        small firms (3–199 workers). Among firms that
                                                                                                                                              years old or less) are significantly more likely to
                                                        offer health benefits, 29% of large firms offer
                                                                                                                                              offer retiree health benefits than large firms with
                                                        retiree health benefits, compared to just 5% of
                                                                                                                                              a higher proportion of younger workers (35%
                                                        small firms (Exhibit 11.2).
                                                                                                                                              or more workers are 26 years old or less)—31%
                                                       Among large firms (200 or more workers) that                                          versus 15% (Exhibit 11.3).
                                                        offer health benefits, state and local governments,
                                                                                                                                        Among firms offering health benefits, virtually all
                                                        and firms in the transportation, communications,
                                                                                                                                         large firms (200 or more workers) that offer retiree
                                                        and utilities industry category are more likely
                                                                                                                                         health benefits offer them to early retirees under the
                                                        than large firms in other industries to offer retiree
                                                                                                                                         age of 65 (92%). A lower percentage (68%) of large
                                                        health benefits (Exhibit 11.2). In contrast, large
                                                                                                                                         firms offering retiree health benefits offer them to
                                                        firms in the retail, wholesale, service, and health
                                                                                                                                         Medicare-age retirees (Exhibit 11.4).
                                                        care industries are less likely to offer retiree health
                                                        benefits when compared to large firms in other
                                                        industries.


                          164
                                t h e k a i s e r fa m i ly f o u n d at i o n - a n d - h e a lt h r e s e a r C h  e d u C at i o n a l t r u s t
Employer Health Benefits          2 0 0 9 An n u a l s u r ve y


e x h i B i t 11.1

 among all large firms (200 or m ore Workers) o ffer ing health B enefits to ac tive Wor kers,
 Percentage of firms o ffering retiree health B enefits, 1988–2009*


     100%

      90%

      80%

      70%     66%
      60%


                                                                                                                                                                                              section eleven
      50%              46%
                                         40%      40%      40%                                       38%
      40%                       36%                                  35%        37%       36%                   36%                  35%
                                                                                                                           33%                  33%        31%
      30%
                                                                                                                                                                      29%

      20%

      10%

       0%
              1988     1991     1993     1995     1998     1999      2000       2001       2002      2003       2004       2005       2006      2007       2008       2009
                                                                                                                                                                                            11


                                                                                                                                                                                             Retiree Health Benefits
                source:

            kaiser/hret survey of employer-sponsored health Benefits, 1999–2009; kPmG survey of employer-sponsored
            health Benefits, 1991, 1993, 1995, 1998; the health insurance association of america (hiaa), 1988.

         * tests found no statistical difference from estimate for the previous year shown (p.05). no statistical tests are conducted
           for years prior to 1999.


                                                                                                                                                                                      165
                                                               t h e k a i s e r fa m i ly f o u n d at i o n - a n d - h e a lt h r e s e a r C h  e d u C at i o n a l t r u s t
Employer Health Benefits          2 0 0 9 A n n u a l s u r ve y


                                   e x h i B i t 11. 2

                                    among firms offering health Benefits to active Workers, Percentage of firms offering retiree health
                                    Benefits, by firm size, region, and industr y, 2009


                                                                                                                                      all small firms                 all large firms
                                                                                                                                     (3–199 Workers)               (200 or more Workers)

                                    firm size
                                      3–199 Workers                                                                                           5%                               —
                                      200–999 Workers                                                                                         —                                24%*
 section eleven


                                      1,000–4,999 Workers                                                                                     —                                39*
                                      5,000 or more Workers                                                                                   —                                49*

                                    regioN
                                     northeast                                                                                                  7%                             27%
                                     midwest                                                                                                    6                              28
                                     south                                                                                                      4                              33
                11                   West                                                                                                       3                              26
Retiree Health Benefits


                                    iNDusTry
                                      agriculture/mining/Construction                                                                        2%*                               34%
                                      manufacturing                                                                                          5                                 30
                                      transportation/Communications/utilities                                                              nsd                                 50*
                                      Wholesale                                                                                              3                                 18*
                                      retail                                                                                                 0*                                12*
                                      finance                                                                                                9                                 41
                                      service                                                                                                4                                 22*
                                      state/local Government                                                                               nsd                                 81*
                                      health Care                                                                                           1*                                20*

                                    All firms                                                                                                   5%                             29%


                                                          source:

                                                    kaiser/hret survey of employer-sponsored health Benefits, 2009.

                                                * estimate is statistically different within small or large firm category from estimate for all other firms not in the indicated
                                                  size, region, or industry category (p.05).
                                                nsd: not sufficient data.


                          166
                                t h e k a i s e r fa m i ly f o u n d at i o n - a n d - h e a lt h r e s e a r C h  e d u C at i o n a l t r u s t
Employer Health Benefits          2 0 0 9 An n u a l s u r ve y


e x h i B i t 11.3

 among all large firms (200 or m ore Workers) o ffer ing health B enefits to ac tive Wor kers,
 Percentage of firms o ffering retiree health B enefits, by fir m Charac ter istics, 2009


                                   WAGE LEVEL*
             FEW WORKERS ARE LOWER WAGE
 LESS THAN 35% EARN $23,000 A YEAR OR LESS                                                                                        32%
           MANY WORKERS ARE LOWER WAGE
   35% OR MORE EARN $23,000 A YEAR OR LESS
                                                                                                19%
                         PART TIME WORKERS*
                  FEW WORKERS ARE PART TIME
              LESS THAN 35% WORK PART TIME
                                                                                                                                     33%


                                                                                                                                                                                               section eleven
                 MANY WORKERS ARE PART TIME
                35% OR MORE WORK PART TIME
                                                                                 13%
                                        UNIONS*
       FIRM HAS AT LEAST SOME UNION WORKERS                                                                                                                              47%

    FIRM DOES NOT HAVE ANY UNION WORKERS                                                                 22%

                                           AGE*
                     LESS THAN 35% OF WORKERS
                                                                                                                                31%
                                                                                                                                                                                             11
                       ARE 26 YEARS OLD OR LESS
                        35% OR MORE WORKERS
                      ARE 26 YEARS OLD OR LESS                                        15%


                                                                                                                                                                                              Retiree Health Benefits
                                                 0%                   10%                       20%                      30%                       40%                       50%


                 source:

            kaiser/hret survey of employer-sponsored health Benefits, 2009.

          * estimates are statistically different from each other within category (p.05).


e x h i B i t 11.4

 among all large fir ms (200 or m ore Wor kers) o ffering health Benefits to ac tive Workers and
 o ffer ing retiree Coverage, Percentage of fir ms o ffer ing health B enefits to ear ly and m edicare -
 age r etirees, 1999–2009


100%                    98%* 96%           96% 94% 94%
          93%                        93%               92% 93% 92%
 90%
                 89%
                                                                                                                                       81%
 80%                                                                                     76%                    76% 78% 75%                    77%            75%
                                                                                                 71% 73%                                               71%
 70%                                                                                                                                                                  68%

 60%

 50%

 40%

 30%

 20%

 10%

  0%
           1999 2000 2001 2002 2003 2004 2005 2006 2007 2008 2009                         1999 2000 2001 2002 2003 2004 2005 2006 2007 2008 2009
                         OFFER HEALTH BENEFITS TO EARLY RETIREES                                      OFFER HEALTH BENEFITS TO MEDICARE AGE RETIREES


                 source:

            kaiser/hret survey of employer-sponsored health Benefits, 1999–2009.

          * estimate is statistically different from estimate for the previous year shown (p.05).
          early retirees: Workers retiring before age 65.

                                                                                                                                                                                       167
                                                                t h e k a i s e r fa m i ly f o u n d at i o n - a n d - h e a lt h r e s e a r C h  e d u C at i o n a l t r u s t
Employer Health Benefits          2 0 0 9 A n n u a l s u r ve y


                                   e x h i B i t 11. 5

                                    among all large firms (200 or more Workers) offering health Benefits to active Workers and offering
                                    retiree Coverage, Percentage of firms offering retiree health Benefits to early and medicare -age
                                    retirees, by firm size, region, and industr y, 2009


                                                                                                                                      Percentage of large               Percentage of large
                                                                                                                                      employers offering                employers offering
                                                                                                                                     retiree health Benefits          retiree health Benefits
                                                                                                                                        to early retirees            to medicare-age retirees

                                    firm size
 section eleven


                                      200–999 Workers                                                                                                  88%*                         61%*
                                      1,000–4,999 Workers                                                                                              95                           75
                                      5,000 or more Workers                                                                                            97*                          85*

                                    regioN
                                     northeast                                                                                                         88%                          73%
                                     midwest                                                                                                           97*                          67
                11                   south                                                                                                             88                           64
                                     West                                                                                                              99*                          75
Retiree Health Benefits


                                    iNDusTry
                                      agriculture/mining/Construction                                                                             nsd                            nsd
                                      manufacturing                                                                                                93%                            74%
                                      transportation/Communications/utilities                                                                      92                             64
                                      Wholesale                                                                                                   nsd                            nsd
                                      retail                                                                                                      nsd                            nsd
                                      finance                                                                                                      95                             68
                                      service                                                                                                      88                             70
                                      state/local Government                                                                                      100*                            73
                                      health Care                                                                                                 nsd                            nsd

                                    All lArge firms (200 or more Workers)                                                                              92%                          68%


                                                         source:

                                                   kaiser/hret survey of employer-sponsored health Benefits, 2009.

                                                * estimate is statistically different from estimate for all other large firms not in the indicated size, region, or industry category (p.05).
                                                early retirees: Workers retiring before age 65.
                                                nsd: not sufficient data.


                          168
                                t h e k a i s e r fa m i ly f o u n d at i o n - a n d - h e a lt h r e s e a r C h  e d u C at i o n a l t r u s t
60%

                                      $4,8 2 4
           Employer Health Benefits
$ 13,375
              2009 annual surVey


              Wellness
            Programs and
             Health Risk
             Assessments

                 section


                    12


           2009
Employer Health Benefits           2 0 0 9 A n n u a l s u r ve y


                                                               W e l l n e S S p r o g r a M S a n D h e a lt h r i S k a S S e S S M e n t S


                                                                      e mployers       play a significanT role in healTh insurance coverage — sponsoring healTh benefiTs for abouT

                                                                      159     million nonelderly people in                  a merica 1 — and          many firms also provide wellness programs To Their

                                                                      employees .          as   in   2008,    The sur vey included several quesTions on The wellness programs offered To

                                                                      employees , incenTives for parTicipaTion in wellness programs , and employer opinions of wellness programs .

                                                                      T his   year ’s sur vey included new quesTions on The financial incenTives provided if employees compleTe a

                                                                      healTh risk assessmenT .


                                                                      WellNess beNefiTs                                                                            Among firms offering health benefits and at least
                                                                        In an effort to improve health and lower costs, some                                      one wellness program, 81% of employers report
                                                                          employers and health plans offer wellness programs.                                       that most of the wellness benefits they offer are
                                                                          Wellness programs may range from classes in                                               provided through the health plan (Exhibit 12.3).3
   section twelve


                                                                          nutrition or healthy living to a wellness newsletter.                                     There is a significant difference between small
                                                                                                                                                                    firms (3–199 workers) and large firms (200 or
                                                                             Fifty-eight percent of firms offering health                                          more workers) in the percentage reporting that
                                                                              benefits offer at least one of the following                                          most wellness programs are provided by the
                                                                              wellness programs: weight loss programs, gym                                          health plan (83% vs. 60%) (Exhibit 12.3).
                                                                              membership discounts or on-site exercise
                                                                                                                                                             In order to encourage participation in wellness
                                                                              facilities, smoking cessation program, personal
                             12                                               health coaching, classes in nutrition or healthy                                 programs, firms may offer financial incentives to
                                                                                                                                                               employees who participate.4
                                                                              living, web-based resources for healthy living,
Wellness Programs and Health Risk Assessments


                                                                              or a wellness newsletter.2 The offer rate for each                                   Ten percent of firms offering health benefits offer
                                                                              type of wellness benefit included in the survey                                       gift cards, travel, merchandise, or cash to workers
                                                                              is presented in Exhibit 12.1 and Exhibit 12.2.                                        who participate in wellness programs, and large
                                                                              Forty-eight percent of firms offering health                                          firms (200 or more workers) are more likely to
                                                                              insurance and wellness benefits offer the benefits                                    offer these incentives than small firms (3–199
                                                                              to spouses or dependents (Exhibit 12.3).                                              workers) (27% vs. 9%) (Exhibit 12.4).
                                                                             The percentage of large firms (200 or more                                           Very few firms offering health benefits offer the
                                                                              workers) offering at least one wellness program                                       following incentives to workers who participate
                                                                              increased from 88% in 2008 to 93% in 2009,                                            in wellness programs: a smaller share of the
                                                                              while the percentage of small firms (3–199                                            premium (4%) or a lower deductible (1%).
                                                                              workers) did not statistically increase.                                              Among firms that offer a high-deductible plan
                                                                                                                                                                    paired with a HRA or HSA, 1% of firms offer
                                                                                                                                                                    workers who participate in wellness programs
                                                                                                                                                                    higher HSA or HRA contributions than
                                                                                                                                                                    employees who do not participate (Exhibit 12.4).


                                                                               noTes:

                                                                         1 kaiser family foundation, kaiser Commission on medicaid and the uninsured, the uninsured: a Primer, october 2008.

                                                                         2 in 2009, respondents were given the option to report “other” types of wellness programs.                 if those firms that responded “other”
                                                                            are included, the percentage offering at least one wellness benefit is 60 percent.
                                                                         3 the survey asks firms offering at least one wellness program if most of the wellness benefits are provided by the health plan or
                                                                            by the firm.
                                                                         4 We modified the survey instrument this year so that firms that offer only web-based resources or a wellness newsletter are not
                                                                            asked questions about any financial incentives provided.


                                                170
                                                      t h e k a i s e r fa m i ly f o u n d at i o n - a n d - h e a lt h r e s e a r C h  e d u C at i o n a l t r u s t
Employer Health Benefits          2 0 0 9 An n u a l s u r ve y


 
  Firms sometimes use methods such as health fairs                        Among firms offering an HDHP/SO and wellness
  or health claims that identify health risks to identify                   benefits, 10% report that their decision to offer a
  individuals and encourage participation in wellness                       wellness program was related to their decision to
  programs.                                                                 offer a high-deductible health plan.

     Twenty percent of firms offering health benefits                    Among firms offering health benefits, almost two-
      and wellness programs use health fairs to identify                    thirds (63%) of employers think offering wellness
      individuals and encourage participation in                            programs is effective in improving the health of
      wellness programs. About 15% of firms report                          the firm’s employees. Among those firms offering
      the use of claims to identify individuals and                         health coverage, 51% of employers think offering
      encourage wellness participation (Exhibit 12.5).                      wellness programs is effective in reducing their
      The percentage of firms using claims to identify                      firm’s health care costs. Large firms (200 or more
      individuals with health risks to encourage their                      workers) are more likely than small firms (3–199
      participation in wellness programs increased from                     workers) to think offering wellness programs is
      6% in 2008 to 15% in 2009.                                            effective improving health (80% vs. 61%) or


                                                                                                                                                                                  section twelve
                                                                            in reducing health care costs (71% vs. 49%)
     Large firms (200 or more workers) are more likely
                                                                            (Exhibit 12.7).
      than small firms (3–199 workers) to use health
      fairs or claims information to encourage wellness                 h e A lT h r i s k A s s e s s m e N T s
      participation. Forty-six percent of large firms
                                                                          Some firms give their employees the option of
      (200 or more workers) offering health benefits
                                                                            completing a health risk assessment to identify
      and wellness benefits use health fairs to encourage
                                                                            potential health risks. Health risk assessments
      participation in wellness programs, compared to
                                                                            generally include questions on medical history,                                                   12
      18% of small firms (3–199 workers). Thirty-five
                                                                            health status, and lifestyle.


                                                                                                                                                                               Wellness Programs and Health Risk Assessments
      percent of large firms (200 or more workers)
      offering health benefits and wellness benefits                           Overall, 16% of firms offering health
      use claims to identify individuals and encourage                          benefits offer health risk assessments to their
      participation in wellness, compared to 13% of                             employees. Fifty-five percent of large firms
      small firms (3–199 workers) (Exhibit 12.5).                               (200 or more workers) provide the option,
                                                                                compared to 14% of small firms (3–199
 
  Among firms offering health benefits and wellness
                                                                                workers) (Exhibit 12.8).
  programs, 20% of employers report their primary
  reason for offering wellness programs is to improve                          Thirty-eight percent of firms that offer health
  the health of employees and reduce absenteeism.                               risk assessments use them as a method to identify
  Thirty-six percent of employers offering health                               individuals and encourage their participation
  benefits and wellness programs state their primary                            in wellness programs. Sixty-one percent of
  reason is that the benefits were part of the health                           large firms (200 or more workers) use health
  plan. Large firms (200 or more workers) are more                              risk assessments to encourage participation in
  likely than small firms (3–199 workers) to report                             wellness programs, compared to 33% of small
  that reducing health care costs (28% vs. 9%) or                               firms (3–199 workers) (Exhibit 12.8).
  improving the health of employees and reducing
  absenteeism (32% vs. 19%) was a primary reason
  for offering wellness (Exhibit 12.6).5


       noTe:

  5 less than 1% of firms reported “don’t know” when asked their primary reason for offering wellness programs.


                                                                                                                                                                        171
                                                 t h e k a i s e r fa m i ly f o u n d at i o n - a n d - h e a lt h r e s e a r C h  e d u C at i o n a l t r u s t
Employer Health Benefits          2 0 0 9 A n n u a l s u r ve y


                                                                        This year we added additional questions on the                                     Employers were also asked if employees have to take
                                                                          financial incentives that firms offer to encourage                                   the health risk assessment during open enrollment
                                                                          employees to complete health risk assessments.                                       or during another specified time frame.

                                                                             Of those firms offering health insurance that offer                                  The majority of firms offering health benefits
                                                                              health risk assessments, 11% offer a financial                                        and health risk assessments (67%) report there
                                                                              incentive to employees who complete a health                                          is no specified time frame in which a health
                                                                              risk assessment, with large firms (200 or more                                        risk assessment must be taken by an employee.
                                                                              workers) more likely than small firms (3–199                                          Nineteen percent of firms indicate health
                                                                              workers) to do so (34% vs. 7%) (Exhibit 12.8).                                        risk assessments must be taken during open
                                                                                                                                                                    enrollment, and 13% of firms report there is no
                                                                             The survey asked those firms that reported
                                                                                                                                                                    specified time frame during which employees
                                                                              offering financial incentives about some specific
                                                                                                                                                                    must take the assessment (Exhibit 12.10).
                                                                              types of incentives they may offer. Among those
                                                                              large firms (200 or more workers) that reported
                                                                              offering financial incentives to employees who
   section twelve


                                                                              complete a health risk assessment, 27% of firms
                                                                              reported that employees pay a smaller share of the
                                                                              premium, 7% reported employees have a smaller
                                                                              deductible, and only 2% reported employees
                                                                              have a lower coinsurance rate (Exhibit 12.9).6

                                                                             Among all firms that reported offering health
                             12                                               risk assessments, 11% of firms reported that they
                                                                              offer gift cards, travel, merchandise, or cash to
Wellness Programs and Health Risk Assessments


                                                                              employees that complete a health risk assessment.
                                                                              Twenty-seven percent of large firms (200 or more
                                                                              workers) offer this incentive, compared to 8% of
                                                                              small firms (3–199 workers) (Exhibit 12.8).7


                                                                               noTes:

                                                                         6 there is insufficient data to report the percentage of small firms with specific financial incentives for health risk assessments.

                                                                         7 five percent of firms that said no to offering a financial incentive said that they offer gift cards, travel, merchandise, or cash to
                                                                            employees who complete a health risk assessment.


                                                172
                                                      t h e k a i s e r fa m i ly f o u n d at i o n - a n d - h e a lt h r e s e a r C h  e d u C at i o n a l t r u s t
Employer Health Benefits          2 0 0 9 An n u a l s u r ve y


e x h i B i t 12.1

 among firms offering health Benefits, Percentage offering a Particular Wellness Program to their
 employees, by firm size, region, and industr y, 2009


                                                                    Gym
                                                                membership                                      Web-based
                                                                                         smoking                                                                Personal
                                                                discounts or                                     resources              Wellness
                                                                                         Cessation                                                               health
                                                                   on-site                                      for healthy            newsletter
                                                                                         Program                                                                Coaching
                                                                  exercise                                         living
                                                                  facilities

 firm size
   3–24 Workers                                                       23%*                    26%*                   29%*                   32%*                     8%*
   25–199 Workers                                                     40*                     37                     51*                    42                      23*
   200–999 Workers                                                    58*                     58*                    76*                    60*                     33*
   1,000–4,999 Workers                                                75*                     66*                    82*                    52*                     39*
   5,000 or more Workers                                              73*                     75*                    87*                    65*                     55*
 All small firms (3–199 Workers)                                      27%*                    28%*                   34%*                   34%*                    12%*
 All large firms (200 or more Workers)                                63%*                    61%*                   79%*                   59%*                    36%*


                                                                                                                                                                                                section twelve
 regioN
  northeast                                                           44%*                    40%                    35%                     46%                    14%
  midwest                                                             27                      30                     45                      34                     20
  south                                                               20                      16*                    32                      38                      8*
  West                                                                25                      37                     34                      24                      9

 iNDusTry
                                                                                                                                                                                            12
   agriculture/mining/Construction                                    19%                     15%*                   36%                     39%                    10%


                                                                                                                                                                                             Wellness Programs and Health Risk Assessments
   manufacturing                                                      21                      53*                    55*                     42                      8
   transportation/Communications/utilities                            40                      37                     36                      41                     12
   Wholesale                                                          69*                     70*                    21                      76*                    21
   retail                                                              9*                     41                     23                      19*                    10
   finance                                                            24                      16                     52                      27                     19
   service                                                            32                      21*                    37                      34                     11
   state/local Government                                             24                      16                     24                      22                     11
   health Care                                                        22                      61*                    26                      30                     30

 All firms                                                            28%                     30%                    36%                     35%                    13%


                     source:

             kaiser/hret survey of employer-sponsored health Benefits, 2009.

          * estimate is statistically different within type of wellness program from estimate for all other firms not in the indicated size,
            region, or industry category (p.05).
          note: the offer rates for additional types of wellness programs are presented in exhibit 12.2.


                                                                                                                                                                                      173
                                                               t h e k a i s e r fa m i ly f o u n d at i o n - a n d - h e a lt h r e s e a r C h  e d u C at i o n a l t r u s t
Employer Health Benefits          2 0 0 9 A n n u a l s u r ve y


                                                         e x h i B i t 12. 2

                                                          among firms offering health Benefits, Percentage offering a Particular Wellness Program to their
                                                          employees, by firm size, region, and industr y, 2009


                                                                                                                                                                                      offer at least
                                                                                                                                                                       Classes in
                                                                                                                                          Weight loss                                 one specified      other Wellness
                                                                                                                                                                       nutrition/
                                                                                                                                           Programs                                     Wellness            Program
                                                                                                                                                                     healthy living
                                                                                                                                                                                       Program‡

                                                          firm size
                                                            3–24 Workers                                                                        22%*                         16%*         52%*                9%*
                                                            25–199 Workers                                                                      31                           27           72*                19*
                                                            200–999 Workers                                                                     50*                          45*          92*                34*
                                                            1,000–4,999 Workers                                                                 57*                          55*          95*                46*
                                                            5,000 or more Workers                                                               64*                          47*          97*                39*
                                                          All small firms (3–199 Workers)                                                       24%*                         19%*         57%*               11%*
                                                          All large firms (200 or more Workers)                                                 53%*                         47%*         93%*               36%*

                                                          regioN
   section twelve


                                                           northeast                                                                            36%                          15%          58%                 6%*
                                                           midwest                                                                              26                           21           57                 17
                                                           south                                                                                18                           14           55                 11
                                                           West                                                                                 23                           32           64                 14

                                                          iNDusTry
                                                            agriculture/mining/Construction                                                     24%                           3%*         54%                15%
                               12                           manufacturing                                                                       39                           37           71                  6*
                                                            transportation/Communications/utilities                                             27                           27           59                 14
Wellness Programs and Health Risk Assessments


                                                            Wholesale                                                                           63*                          19           87*                 4*
                                                            retail                                                                              15                           15           52                  7
                                                            finance                                                                             18                           15           57                  9
                                                            service                                                                             18                           23           55                 15
                                                            state/local Government                                                              12                           13           32                 12
                                                            health Care                                                                         57*                          35           69                 12

                                                          All firms                                                                             25%                          20%          58%                12%


                                                                                  source:

                                                                            kaiser/hret survey of employer-sponsored health Benefits, 2009.

                                                                        * estimate is statistically different within type of wellness program from estimate for all other firms not in the indicated size,
                                                                          region, or industry category (p.05).
                                                                        ‡ includes the following wellness programs: weight loss programs, gym membership discounts or on-site exercise facilities,
                                                                          smoking cessation program, personal health coaching, classes in nutrition or healthy living, web-based resources for
                                                                          healthy living, or a wellness newsletter. in 2009, respondents were given the option to reply that they offer another type
                                                                          of wellness benefit. if those that responded “other” are included in the percentage of firms offering at least one wellness
                                                                          benefit, the percentage is 60%.
                                                                        note: the offer rates for additional types of wellness programs are presented in exhibit 12.1.


                                                174
                                                      t h e k a i s e r fa m i ly f o u n d at i o n - a n d - h e a lt h r e s e a r C h  e d u C at i o n a l t r u s t
Employer Health Benefits          2 0 0 9 An n u a l s u r ve y


e x h i B i t 12.3

 among firms offering health Benefits, Percentage of firms With the following features of Wellness
 Benefits, by firm size and region, 2009


                                                                      Wellness Benefits offered                                  most Wellness Benefits
                                                                     to spouses or dependents                                are Provided By the health Plan

 firm size
   3–24 Workers                                                                        41%*                                                        85%
   25–199 Workers                                                                      59*                                                         78
   200–999 Workers                                                                     70*                                                         62*
   1,000–4,999 Workers                                                                 67*                                                         57*
   5,000 or more Workers                                                               69*                                                         54*
 All small firms (3–199 Workers)                                                       46%*                                                        83%*
 All large firms (200 or more Workers)                                                 69%*                                                        60%*

 regioN
  northeast                                                                            60%                                                          90%
  midwest                                                                              42                                                           79


                                                                                                                                                                                                  section twelve
  south                                                                                65*                                                          78
  West                                                                                 24*                                                          80

 All firms                                                                             48%                                                          81%


                     source:
                                                                                                                                                                                              12
                kaiser/hret survey of employer-sponsored health Benefits, 2009.


                                                                                                                                                                                               Wellness Programs and Health Risk Assessments
             * estimate is statistically different from estimate for all other firms not in the indicated size or region (p.05).
             note: the survey asks firms offering at least one wellness program if most of the wellness benefits are provided by the health
             plan or by the firm.


                                                                                                                                                                                        175
                                                                 t h e k a i s e r fa m i ly f o u n d at i o n - a n d - h e a lt h r e s e a r C h  e d u C at i o n a l t r u s t
Employer Health Benefits          2 0 0 9 A n n u a l s u r ve y


                                                         e x h i B i t 12. 4

                                                          among firms offering health and Wellness Benefits, Percentage of firms that offer specific incentives
                                                          to employees Who Par ticipate in Wellness Programs, by firm size and region, 2009


                                                                                                                                         Workers Pay                                                        receive Gift
                                                                                                                                                                      Workers have   receive higher
                                                                                                                                           smaller                                                          Cards, travel,
                                                                                                                                                                        smaller       hra or hsa
                                                                                                                                         Percentage                                                         merchandise,
                                                                                                                                                                       deductible    Contributions‡
                                                                                                                                       of the Premium                                                         or Cash

                                                          firm size
                                                            3–24 Workers                                                                         5%                          1%          nsd                       8%
                                                            25–199 Workers                                                                       1                           0            1%                      12
                                                            200–999 Workers                                                                      6                           2            6*                      25*
                                                            1,000–4,999 Workers                                                                 11*                          1            5                       29*
                                                            5,000 or more Workers                                                               12*                          3            8*                      32*
                                                          All small firms (3–199 Workers)                                                        4%                          1%           1%*                      9%*
                                                          All large firms (200 or more Workers)                                                  8%                          2%           6%*                     27%*

                                                          regioN
   section twelve


                                                           northeast                                                                             1%                          1%          6%                      10%
                                                           midwest                                                                               1                           1           1                       25*
                                                           south                                                                                12                            2           1                        7
                                                           West                                                                                  2                           1          1                        1*

                                                          All firms                                                                               4%                         1%            1%                     10%

                               12
                                                                                  source:
Wellness Programs and Health Risk Assessments


                                                                            kaiser/hret survey of employer-sponsored health Benefits, 2009.

                                                                        * estimate is statistically different within type of incentive from estimate for all other firms not in the indicated size or region (p.05).
                                                                        ‡ only firms that offer an hdhP/hra or hsa-qualified hdhP were asked if participating employees receive higher contributions as an
                                                                          incentive to participate in wellness programs.
                                                                        nsd: not sufficient data.


                                                176
                                                      t h e k a i s e r fa m i ly f o u n d at i o n - a n d - h e a lt h r e s e a r C h  e d u C at i o n a l t r u s t
Employer Health Benefits          2 0 0 9 An n u a l s u r ve y


e x h i B i t 12.5

 among firms offering health Benefits and Wellness Programs, Percentage that use specific methods
 to identify individuals and encourage Par ticipation in Wellness Programs, by firm size, region, and
 industr y, 2009


                                                                                                                         use of Claims
                                                                                                                                                           health risk
                                                                                         health fairs                     to identify
                                                                                                                                                          assessments‡
                                                                                                                         health risks

 firm size
   3–24 Workers                                                                               18%                              15%                               nsd
   25–199 Workers                                                                             18                               10                                49%
   200–999 Workers                                                                            39*                              29*                               56*
   1,000–4,999 Workers                                                                        60*                              45*                               67*
   5,000 or more Workers                                                                      59*                              56*                               73*
 All small firms (3–199 Workers)                                                              18%*                             13%*                              33%*
 All large firms (200 or more Workers)                                                        46%*                             35%*                              61%*

 regioN


                                                                                                                                                                                                  section twelve
  northeast                                                                                    8%*                              6%*                              40%
  midwest                                                                                     27                               27                                56
  south                                                                                       21                               25                                35
  West                                                                                        24                                4*                               15*

 iNDusTry
   agriculture/mining/Construction                                                            13%                              46%                               nsd
   manufacturing                                                                              11                                5*                               55%                          12
   transportation/Communications/utilities                                                    28                               20                                59


                                                                                                                                                                                               Wellness Programs and Health Risk Assessments
   Wholesale                                                                                   6*                               4*                               78*
   retail                                                                                     47                                4*                               39
   finance                                                                                    18                                7                                48
   service                                                                                    16                               11                                26
   state/local Government                                                                     41*                              25                                52
   health Care                                                                                50                               42                                86*

 All firms                                                                                     20%                             15%                               38%


                     source:

                kaiser/hret survey of employer-sponsored health Benefits, 2009.

             * estimate is statistically different from all firms not in the indicated size, region, or industry category (p.05).
             ‡ a firm’s use of health risk assessments to encourage participation in wellness is asked only of firms who offer employees the
              option to take a health risk assessment. a health risk assessment includes questions on medical history, health status, and
              lifestyle, and is designed to identify the health risks of the person being assessed.
             nsd: not sufficient data.


                                                                                                                                                                                        177
                                                                 t h e k a i s e r fa m i ly f o u n d at i o n - a n d - h e a lt h r e s e a r C h  e d u C at i o n a l t r u s t
Employer Health Benefits          2 0 0 9 A n n u a l s u r ve y


                                                         e x h i B i t 12. 6

                                                          among firms offering health Benefits and Wellness Programs, Percentage of firms repor ting the
                                                          following as the firm’s Primar y reason for offering Wellness Programs, by firm size, 2009


                                                          50%


                                                          40%
                                                                                                                                                                              37%          36%
                                                                                32%
                                                          30%                                                       28%


                                                                       19%                20%
                                                          20%
                                                                                                                                                                                    17%                18%            18%
                                                                                                                                              15%                15%                                           15%

                                                                                                            9%                10%
                                                          10%
                                                                                                                                                         7%


                                                            0%
                                                                       IMPROVE THE HEALTH                     REDUCE HEALTH                     IMPROVE EMPLOYEE              PART OF THE HEALTH              OTHER
                                                                      OF EMPLOYEES/REDUCE                       CARE COSTS*                        MORALE AND                       PLAN*
   section twelve


                                                                          ABSENTEEISM*                                                            PRODUCTIVITY


                                                                                  source:
                                                                                                                                                                                          ALL SMALL FIRMS (3–199 WORKERS)
                                                                            kaiser/hret survey of employer-sponsored health Benefits, 2009.                                               ALL LARGE FIRMS (200 OR MORE WORKERS)

                                                                                                                                                                                          ALL FIRMS
                                                                        * estimate is statistically different between all small firms and all large firms
                                                                          within category (p.05).
                               12                                       note: less than 1% percent of firms reported “don’t know” to the question about their primary reason for offering wellness.
Wellness Programs and Health Risk Assessments


                                                         e x h i B i t 12. 7

                                                          among firms offering health Benefits and Wellness Programs, Percentage of firms that think offering
                                                          Wellness Programs is effective at improving health or reducing Costs, 2009


                                                                                                                                                      effective in improving the               effective in reducing the
                                                                                                                                                         health of employees                   firm's health Care Costs

                                                          firm size
                                                            3–24 Workers                                                                                               55%*                                 45%
                                                            25–199 Workers                                                                                             74                                   59
                                                            200–999 Workers                                                                                            80*                                  70*
                                                            1,000–4,999 Workers                                                                                        81*                                  73*
                                                            5,000 or more Workers                                                                                      79*                                  75*
                                                          All small firms (3–199 Workers)                                                                              61%*                                 49%*
                                                          All large firms (200 or more Workers)                                                                        80%*                                 71%*

                                                          All firms                                                                                                    63%                                  51%

                                                                                  source:

                                                                            kaiser/hret survey of employer-sponsored health Benefits, 2009.

                                                                        * estimate is statistically different from estimate for all other firms not in the indicated size category (p.05).
                                                                        note: six percent of firms responded “don’t know” to whether they think offering wellness programs is effective in improving the health
                                                                        of employees. ten percent said “don’t know” to whether they think wellness programs are effective in reducing health care costs.

                                                178
                                                      t h e k a i s e r fa m i ly f o u n d at i o n - a n d - h e a lt h r e s e a r C h  e d u C at i o n a l t r u s t
Employer Health Benefits          2 0 0 9 An n u a l s u r ve y


e x h i B i t 12.8

 among fir ms o ffer ing health B enefits, Percentage of firms that o ffer employees health r isk
 assessments, o ffer i ncentives to Complete assessments, and use assessments to i ncrease
 Wellness Par ticipation, by firm size and r egion, 2009


                                                                                                                                                         employees that
                                                            offer employees                offer financial                use health risk               Complete health
                                                                 option                       incentives                   assessments                  risk assessment
                                                             to Complete                    to employees                    to increase                   receive Gift
                                                              health risk                  Who Complete                      Wellness                     Cards, travel,
                                                              assessment                   an assessment‡                  Participation‡                 merchandise,
                                                                                                                                                            or Cash‡

 firm size
   3–24 Workers                                                     11%*                           nsd                             nsd                           nsd
   25–199 Workers                                                   23*                            13%                             49%                           17%*
   200–999 Workers                                                  49*                            29*                             56*                           25*
   1,000–4,999 Workers                                              65*                            40*                             67*                           30*
   5,000 or more Workers                                            75*                            48*                             73*                           34*


                                                                                                                                                                                                  section twelve
 All small firms (3–199 Workers)                                    14%*                            7%*                            33%*                           8%*
 All large firms (200 or more Workers)                              55%*                           34%*                            61%*                          27%*

 regioN
  northeast                                                           6%*                          23%*                            40%                           18%
  midwest                                                            21                            11                              56                            15
  south                                                              17                            13                              35                             8
  West                                                               18                             5                              15*                            6                           12


                                                                                                                                                                                               Wellness Programs and Health Risk Assessments
 All firms                                                          16%                            11%                             38%                            11%


                     source:

                kaiser/hret survey of employer-sponsored health Benefits, 2009.

             * estimate is statistically different from estimate for all other firms not in the indicated size or region (p.05).
             ‡ among firms offering employees the option to complete a health risk assessment.

             nsd: not sufficient data.
             note: a health risk assessment includes questions on medical history, health status, and lifestyle, and is designed to identify
             the health risks of the person being assessed.


                                                                                                                                                                                        179
                                                                 t h e k a i s e r fa m i ly f o u n d at i o n - a n d - h e a lt h r e s e a r C h  e d u C at i o n a l t r u s t
Employer Health Benefits          2 0 0 9 A n n u a l s u r ve y


                                                         e x h i B i t 12. 9

                                                          among large firms (200 or more Workers) offering financial incentives for health risk assessments,
                                                          Percentage of firms that offer the following incentives to Complete assessments, by firm size and
                                                          region, 2009*


                                                                                                                                               Workers Pay                      Workers                    Workers
                                                                                                                                            smaller Percentage                have smaller               have lower
                                                                                                                                             of the Premium                    deductible                Coinsurance

                                                          firm size
                                                            200–999 Workers                                                                            28%                         9%                         3%
                                                            1,000–4,999 Workers                                                                        25                          3                          1
                                                            5,000 or more Workers                                                                      28                          8                          2

                                                          regioN
                                                           northeast                                                                                   31%                          5%                        5%
                                                           midwest                                                                                     29                           7                         2
                                                           south                                                                                       26                           5                         1
                                                           West                                                                                        20                          15                         0
   section twelve


                                                          All large firms (200 or more Workers)                                                        27%                         7%                         2%


                                                                                  source:

                                                                            kaiser/hret survey of employer-sponsored health Benefits, 2009.


                               12                                       * tests found no statistically significant differences (p.05).
                                                                        note: a health risk assessment includes questions on medical history, health status, and lifestyle, and is designed to identify
                                                                        the health risks of the person being assessed. there is insufficient data to report the percentage of small firms with specific
Wellness Programs and Health Risk Assessments


                                                                        financial incentives for health risk assessments.


                                                        e x h i B i t 12. 10

                                                          among firms offering health Benefits and health risk assessments, distribution of firms repor ting
                                                          the following in terms of When employees must take health risk assessments, by firm size, 2009


                                                                  ALL SMALL FIRMS
                                                                  3 199 WORKERS *                     21%                      11%                                                 67%

                                                                ALL LARGE FIRMS
                                                         200 OR MORE WORKERS *              8%                        26%                                                          66%

                                                                          ALL FIRMS                 19%                       13%                                                  67%
                                                                                       0%             10%            20%             30%             40%            50%      60%         70%      80%         90%        100%


                                                                               source:
                                                                                                                                                                                               DURING OPEN ENROLLMENT
                                                                         kaiser/hret survey of employer-sponsored health Benefits, 2009.                                                       ANOTHER SPECIFIED TIME FRAME

                                                                                                                                                                                               NO SPECIFIED TIME FRAME
                                                                      * distributions for all small firms and all large firms are statistically different (p.05).


                                                180
                                                      t h e k a i s e r fa m i ly f o u n d at i o n - a n d - h e a lt h r e s e a r C h  e d u C at i o n a l t r u s t
60%

                                       $4,8 2 4
            Employer Health Benefits
$ 13,375
               2009 annual surVey


             Employer and
              Health Plan
             Practices, and
           Employer Opinions

                  section


                     13


           2009
Employer Health Benefits          2 0 0 9 A n n u a l s u r ve y


                                                                       e M p lo y e r a n D h e a lt h p l a n p r a C t i C e S , a n D e M p lo y e r o p i n i o n S


                                                                              e mployers       play a significanT role in healTh insurance coverage — sponsoring healTh benefiTs for abouT
Employer and Health Plan Practices, and Employer Opinions


                                                                              159 million nonelderly people in a merica 1— so Their aTTiTudes , knowledge, and experiences are imporTanT
                                                                              facTors in healTh policy discussions .                          e mployers        were asked how They view differenT approaches To

                                                                              conTaining cosT increases and how They plan To change Their healTh benefiT plans in The near fuTure .                                         T he
                                                                              survey also collecTed informaTion on employer healTh plan pracTices , such as uTilizaTion managemenT

                                                                              and lifeTime benefiT maximums .                     q uesTions        were also included on incenTives for employees To refuse

                                                                              coverage , or elecT single raTher Than family coverage .


                                                                              e m p loye r o p i N i o N s o N Co s T                                                 Each year we ask employers whether they expect to
                                                                              C o N TA i N m e N T A N D l i k e ly C h A N g e s                                       change the employee premium contributions, cost
                                                                              i N h e A lT h b e N e f i T s                                                            sharing, or eligibility for health benefits in the next
                                                                                All firms, including those that offer and do not offer                                year.
                                                                                  health benefits, were asked to rate how effective                                        Forty-three percent of large firms (200 or more
                                                                                  several different strategies would be in reducing the                                     workers) say that they are “very likely” to increase
                                                                                  growth of health insurance costs. Few firms rate                                          the amount employees pay for health insurance
                                                                                  any of the suggested strategies as “very effective” at                                    in the next year, compared to 20% of small firms
                                                                                  controlling costs (between 13% and 23% of firms,                                          (3–199 workers) (Exhibit 13.2).
                                                                                  depending on the strategy). About one-third of
                                     13                                           firms (between 31% and 36%) report that each of                                          Some firms also report that they are “very likely”
                                                                                  the approaches we asked about would be “somewhat                                          to increase employee cost sharing next year,
    sec tio n thir teen


                                                                                  effective” at controlling cost growth.                                                    with 16% saying that they are “very likely” to
                                                                                                                                                                            increase deductibles, 15% saying that they are
                                                                                      Similar percentages of employers report that                                         “very likely” to increase office visit copayments or
                                                                                       consumer-driven health plans (16%), higher                                           coinsurance, and 14% saying that they are “very
                                                                                       employee cost sharing (13%), or tighter managed                                      likely” to increase the amount that employees
                                                                                       care restrictions (13%) would be “very effective”                                    pay for prescription drugs (Exhibit 13.2). These
                                                                                       in reducing the growth of health care costs.                                         responses vary little between small firms (3–199
                                                                                       Twenty-three percent of employers report disease                                     workers) and large firms (200 or more workers).
                                                                                       management is “very effective” (Exhibit 13.1).                                       The percentage of large firms who report that
                                                                                       There are no statistically significant differences                                   they are very likely to increase deductibles
                                                                                       between small firms (3–199 workers) and large                                        increased from 9% in 2008 to 15% in 2009.
                                                                                       firms (200 or more workers) in the percentage
                                                                                       that report that strategies are “very effective.”                                   As observed in previous years, small percentages
                                                                                                                                                                            of employers report that they are likely to restrict
                                                                                                                                                                            eligibility or drop coverage altogether. Four
                                                                                                                                                                            percent of firms say that they are “very likely” to
                                                                                                                                                                            restrict eligibility for benefits in the next year.
                                                                                                                                                                            About two percent of firms say that they are “very
                                                                                                                                                                            likely” to drop coverage in the next year (Exhibit
                                                                                                                                                                            13.2). These percentages are not statistically
                                                                                                                                                                            different from the percentages reported in 2008,
                                                                                                                                                                            and do not vary by small and large firms.

                                                                                           noTe:

                                                                                       1 kaiser family foundation, kaiser Commission on medicaid and the uninsured, the uninsured: a Primer, october 2008.


                                                            182
                                                                  t h e k a i s e r fa m i ly f o u n d at i o n - a n d - h e a lt h r e s e a r C h  e d u C at i o n a l t r u s t
Employer Health Benefits          2 0 0 9 An n u a l s u r ve y


e m p loye r’s r e s p o N s e                                       eNrollmeNT iNCeNTives


                                                                                                                                                                            Employer and Health Plan Practices, and Employer Opinions
To The eCoNomiC DoWNTurN                                               Firms may require employees to contribute different
 
  To gauge employer responses to the economic                            amounts for coverage depending on whether
  downturn, a couple of questions were included on                       employees have an alternative source of coverage,
  whether employers have reduced their benefits or                       or may provide incentives for employees to enroll
  increased cost sharing due to the downturn.                            in single rather than family coverage or turn down
                                                                         coverage completely.
      Twenty-one percent of employers report reducing
       the scope of health benefits or increasing cost                      Sixteen percent of firms that offer coverage
       sharing and 15% report increasing the amount                          vary the contribution they make toward family
       employees pay for coverage in response to the                         coverage based on whether an employee’s family
       economic downturn. More large firms than                              member has the option of obtaining insurance
       small firms report increasing the share of the                        from another source, such as another employer
       premium that the employee pays (22% vs. 15%)                          (Exhibit 13.7). The survey asks firms that do
       (Exhibit 13.3).                                                       not vary the contribution whether or not they
                                                                             are likely to do so in the future. Few firms say
mArkeT TurNover
                                                                             they are “very likely” (2%) or “somewhat likely”
 
  About every other year, we ask firms that offer                            (11%) to adopt such an approach in the next two
  health insurance if they have shopped for a new                            years. (Exhibit 13.8).
  insurance carrier or a new health plan.
                                                                            Eighteen percent of firms provide additional
      Sixty-two percent of firms that offer health                          compensation or benefits to employees if they
       insurance have shopped for a new health plan or                       elect not to participate in the health plan (Exhibit                                          13
       insurance carrier in the past year (Exhibit 13.4).                    13.7). One-in-ten firms are “very likely” or


                                                                                                                                                                                    sec tio n thir teen
       Small firms (3–199 workers) were more likely                          “somewhat likely” to adopt this approach in the
       to have shopped than large firms (200 or more                         next two years (Exhibit 13.8).
       workers) (63% vs. 48%). Among those firms
                                                                            A small percentage of firms (4%) provide
       that shopped in the past year, 20% changed their
                                                                             additional compensation or benefits to employees
       insurance carrier and 31% changed the type of
                                                                             if they elect single rather than family coverage
       health plan (Exhibit 13.5). Among firms that
                                                                             (Exhibit 13.7). Only 1% are “very likely” and
       shopped, small firms were more likely to have
                                                                             6% are “somewhat likely” to adopt this approach
       changed the type of health plan than large firms
                                                                             in the next two years (Exhibit 13.8).
       (31% vs. 20%).
 
                                                                     W o r k - s i T e h e A lT h A N D s A f e T y
  We also asked all firms that offer health benefits,
  what, in addition to cost, is the most important                     New to the survey this year were two questions
  factor in your decision to choose a particular plan.                   for firms with 1,000 or more employees regarding
                                                                         on-site health clinics. These questions were asked of
      A considerable percentage of firms (58%)
                                                                         all firms surveyed, including those that do not offer
       reported that, in addition to cost, they consider
                                                                         health benefits.
       the quality of providers in networks to be the
       most important factor when choosing a particular                     Among both firms that offer health benefits
       health plan, with 59% of small firms (3–199                           and those that do not, 20% of firms with 1,000
       workers), compared to 43% of large firms (200 or                      or more workers reported that they have an
       more workers) reporting this factor. Large firms                      on-site health clinic for employees at any of their
       (33%) were more likely to report that the size of                     locations. Of those firms with an on-site health
       the network is the most important factor than                         clinic, 79% reported that employees can receive
       small firms (17%). Relatively few firms reported                      treatment for non-work related illness at the
       their most important factor as administrator or                       on-site clinic (Exhibit 13.9).
       carrier (4%), wellness programs (1%), or other
       factors (15%) (Exhibit 13.6).


                                                                                                                                                                     183
                                              t h e k a i s e r fa m i ly f o u n d at i o n - a n d - h e a lt h r e s e a r C h  e d u C at i o n a l t r u s t
Employer Health Benefits          2 0 0 9 A n n u a l s u r ve y


                                                                                    Many firms offer injury prevention programs, such                                  Health plans may also include case management
                                                                                      as worker safety or ergonomics information.                                          services for individuals with large claims. Case
                                                                                                                                                                           management is the coordination of care for those
                                                                                         Overall, 39% of firms offer an injury prevention
                                                                                                                                                                           with high claims to improve quality of care and to
                                                                                          program. The majority of large firms (200 or
                                                                                                                                                                           lower costs.
                                                                                          more workers) have injury prevention programs
Employer and Health Plan Practices, and Employer Opinions


                                                                                          (64%) compared to 38% of small firms (3–199                                          Thirty-seven percent of firms report that their
                                                                                          workers) (Exhibit 13.9). Firms with at least some                                     largest health plan has case management for large
                                                                                          union workers are significantly more likely than                                      claims. Large firms (200 or more workers) are
                                                                                          firms without any union workers to offer an                                           more likely to report case management services
                                                                                          injury prevention program (71% vs. 38%).                                              than small firms (3–199 workers) (82% vs. 35%)
                                                                                                                                                                                (Exhibit 13.10).
                                                                                  u T i l i z AT i o N m A N A g e m e N T

                                                                                   
                                                                                                                                                                       lifeTime mAximums
                                                                                      Some health plans require pre-admission
                                                                                      certification prior to obtaining certain services, such                            The majority of covered workers are in plans with a
                                                                                      as inpatient hospital care, outpatient surgery, or                                   limit on the amount of benefits a plan will pay for
                                                                                      imaging services.                                                                    an employee over his or her lifetime.

                                                                                         The majority of firms (55%) report that their                                        Overall, 59% of covered workers are in plans
                                                                                          largest health plan requires pre-admission                                            with a lifetime maximum on benefits (Exhibit
                                                                                          certification for inpatient hospital care, with large                                 13.11). The percentage of covered workers with
                                                                                          firms (200 or more workers) more likely to report                                     no lifetime maximum limit is not statistically
                                                                                          their largest plan has this requirement than small                                    different between 2009 and 2007, the last time
                                                                                          firms (3–199 workers) (72% vs. 54%). Fifty-                                           the question was asked. Forty-three percent of
                                                                                          nine percent of firms report that pre-admission                                       covered workers have a specified limit of two
                                                                                          certification is required by their largest health                                     million dollars or more, a statistically significant
                                                                                          plan for outpatient surgery, and 42% report pre-                                      increase from 32% of covered workers in 2007.
                                     13                                                   admission certification is required for imaging
                                                                                                                                                                               The majority of covered workers in HMO (69%)
                                                                                          services, such as MRIs, CAT scans, or PET scans
    sec tio n thir teen


                                                                                                                                                                                and POS plans (52%) have no lifetime maximum
                                                                                          (Exhibit 13.10).
                                                                                                                                                                                on benefits paid for by the plan, and about one-
                                                                                                                                                                                third of workers in PPOs (31%) and HDHP/SOs
                                                                                                                                                                                (32%) have no limit (Exhibit 13.12).


                                                            184
                                                                  t h e k a i s e r fa m i ly f o u n d at i o n - a n d - h e a lt h r e s e a r C h  e d u C at i o n a l t r u s t
Employer Health Benefits          2 0 0 9 An n u a l s u r ve y


e x h i B i t 13.1

 among Both firms offering and not offering health Benefits, distribution of firms’ opinions on the
 effectiveness of the following strategies to Contain health insurance Costs, by firm size, 2009


                                                                       Very                somewhat                not too               not at all                don’t
                                                                     effective              effective              effective             effective                 know


                                                                                                                                                                                             Employer and Health Plan Practices, and Employer Opinions
 Tighter managed Care restrictions*
   all small firms (3–199 Workers)                                       13%                   33%                     20%                   25%                      9%
   all large firms (200 or more Workers)                                  9%                   40%                     32%                   16%                      2%
 All firms                                                               13%                   34%                     20%                   25%                      8%

 Consumer-Driven health plans
  (ex: high-Deductible plan Combined
  with a health savings Account)*
  all small firms (3–199 Workers)                                        16%                   35%                     20%                   23%                      6%
  all large firms (200 or more Workers)                                  19%                   33%                     28%                   17%                      4%
 All firms                                                               16%                   35%                     20%                   22%                      6%

 higher employee Cost sharing*
  all small firms (3–199 Workers)                                        13%                   36%                     17%                   28%                      5%
  all large firms (200 or more Workers)                                  14%                   35%                     27%                   22%                      2%
 All firms                                                               13%                   36%                     18%                   28%                      5%

 Disease management programs*
  all small firms (3–199 Workers)                                        23%                   30%                     19%                   23%                      5%
  all large firms (200 or more Workers)                                  26%                   43%                     22%                    8%                      2%                    13
 All firms                                                               23%                   31%                     19%                   22%                      5%


                                                                                                                                                                                                     sec tio n thir teen
                     source:

               kaiser/hret survey of employer-sponsored health Benefits, 2009.

             * distributions are statistically different between all small firms and all large firms within category (p.05).


                                                                                                                                                                                      185
                                                               t h e k a i s e r fa m i ly f o u n d at i o n - a n d - h e a lt h r e s e a r C h  e d u C at i o n a l t r u s t
Employer Health Benefits          2 0 0 9 A n n u a l s u r ve y


                                                                     e x h i B i t 13. 2

                                                                      among firms offering health Benefits, distribution of firms repor ting the likelihood of making the
                                                                      following Changes in the next year, by firm size, 2009


                                                                                                                                                          Very              somewhat     not too       not at all   don’t
Employer and Health Plan Practices, and Employer Opinions


                                                                                                                                                         likely               likely      likely        likely      know
                                                                      increase the Amount employees pay
                                                                        for health insurance*
                                                                        all small firms (3–199 Workers)                                                    20%                   20%      13%            46%        1%
                                                                        all large firms (200 or more Workers)                                              43%                   23%      16%            17%         1%
                                                                      All firms                                                                            21%                   20%      14%            44%        1%
                                                                      increase the Amount employees pay
                                                                        for Deductibles*
                                                                        all small firms (3–199 Workers)                                                   16%                    19%      18%            46%        1%
                                                                        all large firms (200 or more Workers)                                             15%                    25%      27%            33%         1%
                                                                      All firms                                                                           16%                    20%      18%            46%        1%
                                                                      increase the Amount employees pay
                                                                        for office visit Copays or Coinsurance*
                                                                        all small firms (3–199 Workers)                                                   15%                    25%      18%            42%        1%
                                                                        all large firms (200 or more Workers)                                             11%                    23%      30%            35%         2%
                                                                      All firms                                                                           15%                    25%      19%            41%        1%
                                                                      increase the Amount employees pay
                                                                        for prescription Drugs*
                                                                        all small firms (3–199 Workers)                                                   14%                    23%      19%            44%        1%
                                                                        all large firms (200 or more Workers)                                              9%                    24%      30%            35%         2%
                                                                      All firms                                                                           14%                    23%      19%            43%        1%
                                     13
                                                                      restrict employees’ eligibility for Coverage*
                                                                       all small firms (3–199 Workers)                                                      4%                     5%      7%            83%        1%
    sec tio n thir teen


                                                                       all large firms (200 or more Workers)                                                1%                     5%     12%            81%         1%
                                                                      All firms                                                                             4%                     5%      8%            83%        1%
                                                                      Drop Coverage entirely*
                                                                       all small firms (3–199 Workers)                                                      2%                     6%      6%            86%        1%
                                                                       all large firms (200 or more Workers)                                                1%                     1%      2%            96%         1%
                                                                      All firms                                                                             2%                     6%      6%            86%        1%
                                                                      offer hDhp/hrA‡
                                                                       all small firms (3–199 Workers)                                                      5%                   16%      19%            60%         1%
                                                                       all large firms (200 or more Workers)                                                8%                   14%      24%            54%         1%
                                                                      All firms                                                                             5%                   15%      19%            59%         1%
                                                                      offer hsA-Qualified hDhp‡
                                                                       all small firms (3–199 Workers)                                                      5%                   16%      23%            54%        1%
                                                                       all large firms (200 or more Workers)                                                7%                   14%      31%            47%         1%
                                                                      All firms                                                                             6%                   16%      24%            54%        1%

                                                                                              source:

                                                                                        kaiser/hret survey of employer-sponsored health Benefits, 2009.

                                                                                    * distributions are statistically different between all small firms and all large firms within category (p.05).
                                                                                    ‡ among firms not currently offering this type of hdhP/so.


                                                            186
                                                                  t h e k a i s e r fa m i ly f o u n d at i o n - a n d - h e a lt h r e s e a r C h  e d u C at i o n a l t r u s t
Employer Health Benefits          2 0 0 9 An n u a l s u r ve y


e x h i B i t 13.3

 among firms offering health Benefits, Percentage of firms that report they made the following
 Changes as a result of the economic downturn, by firm size and region, 2009


                                                                                                          reduced scope
                                                                                                                                                       increased
                                                                                                         of health Benefits


                                                                                                                                                                                               Employer and Health Plan Practices, and Employer Opinions
                                                                                                                                                  the Worker's share
                                                                                                         or increased Cost
                                                                                                                                                    of the Premium
                                                                                                              sharing

 firm size
   200–999 Workers                                                                                                 23%                                       22%*
   1,000–4,999 Workers                                                                                             19                                        21
   5,000 or more Workers                                                                                           21                                        19
 All small firms (3–199 Workers)                                                                                   21%                                       15%*
 All large firms (200 or more Workers)                                                                             22%                                       22%*

 regioN
  northeast                                                                                                        31%                                       15%
  midwest                                                                                                          22                                        18
  south                                                                                                            22                                        16
  West                                                                                                             10*                                       12
 All firms                                                                                                         21%                                       15%


                     source:

                kaiser/hret survey of employer-sponsored health Benefits, 2009.

             * estimate is statistically different from estimate for all other firms not in the indicated size or region (p.05).                                                             13


                                                                                                                                                                                                       sec tio n thir teen


                                                                                                                                                                                        187
                                                                 t h e k a i s e r fa m i ly f o u n d at i o n - a n d - h e a lt h r e s e a r C h  e d u C at i o n a l t r u s t
Employer Health Benefits          2 0 0 9 A n n u a l s u r ve y


                                                                     e x h i B i t 13. 4

                                                                      Percentage of firms offering health Benefits that shopped for a new Plan or health insurance Carrier
                                                                      in the Past year, by firm size, 2009


                                                                      100%
Employer and Health Plan Practices, and Employer Opinions


                                                                        80%


                                                                                             63%                                                                                                                  62%
                                                                        60%
                                                                                                                                 53%


                                                                        40%                                                                                         38%
                                                                                                                                                                                          32%


                                                                        20%


                                                                         0%
                                                                                            3 199                             200 999                           1,000 4,999              5,000 OR               ALL FIRMS
                                                                                           WORKERS*                           WORKERS                            WORKERS*                 MORE
                                                                                                                                                                                         WORKERS*


                                                                                              source:

                                                                                        kaiser/hret survey of employer-sponsored health Benefits, 2009.

                                     13                                             * estimate is statistically different within category from estimate for firms not in the indicated size category (p.05).
    sec tio n thir teen


                                                            188
                                                                  t h e k a i s e r fa m i ly f o u n d at i o n - a n d - h e a lt h r e s e a r C h  e d u C at i o n a l t r u s t
Employer Health Benefits          2 0 0 9 An n u a l s u r ve y


e x h i B i t 13.5

 among firms offering health Benefits that shopped for a new Plan or insurance Carrier, Percentage
 reporting that they Changed insurance Carrier and/or health Plan type in the Past year, by firm size,
 2009


                                                                                                                                                                                              Employer and Health Plan Practices, and Employer Opinions
   50%

   45%

   40%

                                                      35%*
   35%
                                                                                                    31%*                                                  31%
   30%

   25%                         23%
                     20%                   21%                    20%                                            20%*          20%*
   20%                                                                                                                                      18%*
   15%

   10%

    5%

    0%
                               CHANGED INSURANCE CARRIER                                                          CHANGED HEALTH PLAN TYPE


                     source:
                                                                                                                                                   3 199 WORKERS
               kaiser/hret survey of employer-sponsored health Benefits, 2009.                                                                     200 999 WORKERS
                                                                                                                                                   1,000 4,999 WORKERS

                                                                                                                                                                                             13
             * estimate is statistically different within category from estimate for firms not in the indicated size                               5,000 OR MORE WORKERS
               category (p.05).                                                                                                                   ALL FIRMS


                                                                                                                                                                                                      sec tio n thir teen


                                                                                                                                                                                       189
                                                                t h e k a i s e r fa m i ly f o u n d at i o n - a n d - h e a lt h r e s e a r C h  e d u C at i o n a l t r u s t
Employer Health Benefits          2 0 0 9 A n n u a l s u r ve y


                                                                     e x h i B i t 13. 6

                                                                      among firms o ffering health Benefits, Percentage of fir ms r epor ting the following as the m ost
                                                                      i mpor tant fac tor in the firm’s d ecision to Choose a Par ticular Plan, in addition to Cost, by firm
                                                                      size, 2009
Employer and Health Plan Practices, and Employer Opinions


                                                                      100%


                                                                       90%


                                                                       80%


                                                                       70%


                                                                       60%       59%             58%


                                                                       50%

                                                                                         43%
                                                                       40%

                                                                                                                                                     33%
                                                                       30%


                                                                       20%                                                                   17%            18%
                                                                                                                                                                                          15%           15%
                                                                                                                                                                                                13%
                                                                       10%                                              8%
                                                                                                                4%              4%                                                                              3% 2% 3%
                                     13                                 0%
                                                                                                                                                                           1% 1% 1%
                                                                               QUALITY OF PROVIDERS              ADMINSTRATOR/                      SIZE                       WELLNESS         OTHER             DON'T KNOW
                                                                                  IN NETWORKS*                     CARRIER*                     OF NETWORK*                    PROGRAMS
    sec tio n thir teen


                                                                                              source:
                                                                                                                                                                                                              ALL SMALL FIRMS
                                                                                                                                                                                                              3 199 WORKERS
                                                                                        kaiser/hret survey of employer-sponsored health Benefits, 2009.
                                                                                                                                                                                                              ALL LARGE FIRMS
                                                                                                                                                                                                              200 OR MORE WORKERS
                                                                                    * estimate is statistically different between all small firms and all large firms within category (p.05).                ALL FIRMS


                                                            190
                                                                  t h e k a i s e r fa m i ly f o u n d at i o n - a n d - h e a lt h r e s e a r C h  e d u C at i o n a l t r u s t
Employer Health Benefits          2 0 0 9 An n u a l s u r ve y


e x h i B i t 13.7

 among firms offering health Benefits, Percentage of firms reporting the use of the following
 Contribution approaches for health Benefits, 2009*


  50%


                                                                                                                                                                                             Employer and Health Plan Practices, and Employer Opinions
  40%


  30%


  20%                                                               18%            19%           18%
                     17%                   16%

                              10%
  10%

                                                                                                                               4%             3%            4%

   0%
                        VARY CONTRIBUTION                           ADDITIONAL COMPENSATION                                   ADDITIONAL COMPENSATION
                       FOR FAMILY COVERAGE                      OR BENEFITS PROVIDED IF EMPLOYEES                         OR BENEFITS PROVIDED IF EMPLOYEES
                       IF FAMILY MEMBER HAS                          ELECT NOT TO PARTICIPATE                                    ELECT SINGLE RATHER
                      OTHER INSURANCE OPTION                         IN FIRM'S HEALTH BENEFITS                                  THAN FAMILY COVERAGE


                      source:
                                                                                                                                                  ALL SMALL FIRMS
                                                                                                                                                  3 199 WORKERS
               kaiser/hret survey of employer-sponsored health Benefits, 2009.
                                                                                                                                                                                            13
                                                                                                                                                  ALL LARGE FIRMS
                                                                                                                                                  200 OR MORE WORKERS
             * tests found no statistical differences between all small and all large firms (p.05).                                              ALL FIRMS


                                                                                                                                                                                                     sec tio n thir teen


                                                                                                                                                                                      191
                                                               t h e k a i s e r fa m i ly f o u n d at i o n - a n d - h e a lt h r e s e a r C h  e d u C at i o n a l t r u s t
Employer Health Benefits          2 0 0 9 A n n u a l s u r ve y


                                                                     e x h i B i t 13. 8

                                                                      among firms offering health Benefits, distribution of firms repor ting the likelihood of adopting the
                                                                      following Contribution approaches for health Benefits in the next two years, 2009


                                                                                                                                                                                 Very    somewhat      not too   not at all
Employer and Health Plan Practices, and Employer Opinions


                                                                                                                                                                                likely     likely       likely    likely

                                                                      vary Contribution for family Coverage if family member
                                                                       has other insurance Coverage option*
                                                                       all small firms (3–199 Workers)                                                                             2%      10%          22%        66%
                                                                       all large firms (200 or more Workers)                                                                       2%      17%          31%        50%
                                                                      All firms                                                                                                    2%      11%          23%        65%

                                                                      Additional Compensation or benefits provided if
                                                                       employees elect Not to participate in firm's health
                                                                       benefits
                                                                       all small firms (3–199 Workers)                                                                             3%       7%          20%        70%
                                                                       all large firms (200 or more Workers)                                                                       2%       9%          26%        63%
                                                                      All firms                                                                                                    3%       7%          20%        70%

                                                                      Additional Compensation or benefits provided if
                                                                       employees elect single rather Than family Coverage*
                                                                       all small firms (3–199 Workers)                                                                             1%       6%          16%        78%
                                                                       all large firms (200 or more Workers)                                                                       1%       5%          27%        68%
                                                                      All firms                                                                                                    1%       6%          16%        77%


                                                                                              source:
                                     13                                                 kaiser/hret survey of employer-sponsored health Benefits, 2009.
    sec tio n thir teen


                                                                                    * distributions are statistically different between all small firms and all large firms within category (p.05).


                                                            192
                                                                  t h e k a i s e r fa m i ly f o u n d at i o n - a n d - h e a lt h r e s e a r C h  e d u C at i o n a l t r u s t
Employer Health Benefits          2 0 0 9 An n u a l s u r ve y


e x h i B i t 13.9

 among offering and non-offering firms, Percentage With the following on-site health and safety
 Programs, by firm size, region, and industr y, 2009


                                                                                                                          at on-site Clinic,
                                                                                                                             employees


                                                                                                                                                                                               Employer and Health Plan Practices, and Employer Opinions
                                                                                                                                                            offers injury
                                                                                              offers on-site                Can receive
                                                                                                                                                            Prevention
                                                                                              health Clinic                  treatment
                                                                                                                                                             Program
                                                                                                                           for non-Work-
                                                                                                                           related illness‡

 firm size
   3–24 Workers                                                                                      na                            na                             36%*
   25–199 Workers                                                                                    na                            na                             50*
   200–999 Workers                                                                                   na                            na                             60*
   1,000–4,999 Workers                                                                               18%*                          76%                            72*
   5,000 or more Workers                                                                             25*                           82                             79*
 All small firms (3–199 Workers)                                                                     NA                            NA                             38%*
 All large firms (200 or more Workers)                                                               20%                           79%                            64%*

 regioN
  northeast                                                                                           20%                           84%                            38%
  midwest                                                                                             29*                           74                             36
  south                                                                                               19                            82                             37
  West                                                                                                12*                           nsd                            43

 iNDusTry
   agriculture/mining/Construction                                                                    nsd                           nsd                           58%*                        13
   manufacturing                                                                                      22%                           nsd                           42


                                                                                                                                                                                                       sec tio n thir teen
   transportation/Communications/utilities                                                             9*                           nsd                           77*
   Wholesale                                                                                           9*                           nsd                           57
   retail                                                                                             12                            nsd                           30
   finance                                                                                            21                            nsd                           10*
   service                                                                                            18                            83%                           35
   state/local Government                                                                             28                            nsd                           39
   health Care                                                                                        53*                           74                            34

 All firms                                                                                            20%                           79%                            39%


                     source:

                kaiser/hret survey of employer-sponsored health Benefits, 2009.

             * estimate is statistically different from all firms not in the indicated size, region, or industry category (p.05).
             ‡ among firms that have an on-site health clinic at any of their locations.

             na: only firms with 1,000 or more workers were asked about on-site health clinics.
             nsd: not sufficient data.


                                                                                                                                                                                        193
                                                                 t h e k a i s e r fa m i ly f o u n d at i o n - a n d - h e a lt h r e s e a r C h  e d u C at i o n a l t r u s t
Employer Health Benefits          2 0 0 9 A n n u a l s u r ve y


                                                                    e x h i B i t 13. 10

                                                                      Percentage of firms with the following utilization management Provisions in their largest health
                                                                      Plan, By firm size, region, and industr y, 2009


                                                                                                                                               Pre-admission                 Pre-admission
                                                                                                                                                                                               Pre-admission          Case
Employer and Health Plan Practices, and Employer Opinions


                                                                                                                                                Certification                 Certification
                                                                                                                                                                                                Certification    management
                                                                                                                                                for inpatient                for outpatient
                                                                                                                                                                                                 for imaging    for large Claims
                                                                                                                                               hospital Care                     surgery

                                                                      firm size
                                                                        3–24 Workers                                                                  53%                            60%           41%               31%*
                                                                        25–199 Workers                                                                60                             56            46                49*
                                                                        200–999 Workers                                                               70*                            57            46                79*
                                                                        1,000–4,999 Workers                                                           75*                            55            44                90*
                                                                        5,000 or more Workers                                                         77*                            54            48                95*
                                                                      All small firms (3–199 Workers)                                                 54%*                           59%           42%               35%*
                                                                      All large firms (200 or more Workers)                                           72%*                           57%           46%               82%*

                                                                      regioN
                                                                       northeast                                                                      49%                                58        55                40%
                                                                       midwest                                                                        62                                 63        40                43
                                                                       south                                                                          68*                                63        44                38
                                                                       West                                                                           39*                                49        29                26

                                                                      iNDusTry
                                                                        agriculture/mining/Construction                                               65%                                63%       60%               52%
                                                                        manufacturing                                                                 58                                 58        41                33
                                     13                                 transportation/Communications/
                                                                                                                                                       51                                55         63               63*
                                                                          utilities
    sec tio n thir teen


                                                                        Wholesale                                                                      53                            56            71*               28
                                                                        retail                                                                         22*                           62            39                19*
                                                                        finance                                                                        64                            65            28                36
                                                                        service                                                                        55                            55            29*               33
                                                                        state/local Government                                                         91*                           88*           83*               30
                                                                        health Care                                                                    73                            57            57                66*

                                                                      All firms                                                                       55%                            59%           42%               37%


                                                                                              source:

                                                                                        kaiser/hret survey of employer-sponsored health Benefits, 2009.

                                                                                    * estimate for utilization management for inpatient hospital care, outpatient surgery, imaging, or case management is
                                                                                      statistically different from all other firms not in the indicated size, region, or industry category (p.05).


                                                            194
                                                                  t h e k a i s e r fa m i ly f o u n d at i o n - a n d - h e a lt h r e s e a r C h  e d u C at i o n a l t r u s t
Employer Health Benefits          2 0 0 9 An n u a l s u r ve y


e x h i B i t 13.1 1

  distribution of Covered Workers by maximum lifetime Benefit Payable to an employee with single
  Coverage, by Plan type, 2004–2009


                          less than $1,000,000               $1,000,000–$1,999,999                      $2,000,000 or more                                no limit


                                                                                                                                                                                               Employer and Health Plan Practices, and Employer Opinions
  hmo
   2004                               1%                                 10%                                       15%                                       75%
   2007                                0%                                  9%                                       15%                                       76%
   2009*                              1%                                  5%                                       25%                                       69%

  ppo
   2004                                1%                                 33%                                       31%                                       35%
   2007*                               1%                                 27%                                       38%                                       33%
   2009*                              1%                                 20%                                       49%                                       31%

  pos
   2004                                2%                                 21%                                       15%                                       63%
   2007*                               0%                                 20%                                       27%                                       53%
   2009                                1%                                 18%                                       29%                                       52%

  hDhp/so‡
   2007                                0%                                 13%                                       54%                                       33%
   2009*                              1%                                  5%                                       62%                                       32%

  All plANs
   2004                                1%                                 24%                                       25%                                        49%
   2007*                               1%                                 22%                                       32%                                        45%
   2009*                              1%                                 16%                                       43%                                        41%
                                                                                                                                                                                              13


                                                                                                                                                                                                       sec tio n thir teen
                       source:

                kaiser/hret survey of employer-sponsored health Benefits, 2004–2009.

              * distribution is statistically different from distribution for the previous year shown (p.05).
              ‡ information was not obtained for hdhP/sos prior to 2006.


                                                                                                                                                                                        195
                                                                 t h e k a i s e r fa m i ly f o u n d at i o n - a n d - h e a lt h r e s e a r C h  e d u C at i o n a l t r u s t
Employer Health Benefits          2 0 0 9 A n n u a l s u r ve y


                                                                    e x h i B i t 13. 12

                                                                      distribution of Covered Workers by maximum lifetime Benefit Payable to an employee with single
                                                                      Coverage, by Plan type and firm size, 2009


                                                                                                                                                       less than                  $1,000,000 –   $2,000,000 or
                                                                                                                                                                                                                 no limit
Employer and Health Plan Practices, and Employer Opinions


                                                                                                                                                      $1,000,000                   $1,999,999        more

                                                                      hmo*
                                                                       all small firms (3–199 Workers)                                                      0%                           4%          11%          84%
                                                                       all large firms (200 or more Workers)                                                1                            6           30           63
                                                                      All hmo plans                                                                        1%                           5%          25%          69%

                                                                      ppo
                                                                       all small firms (3–199 Workers)                                                     1%                           17%         47%          36%
                                                                       all large firms (200 or more Workers)                                               1                            21          49           30
                                                                      All ppo plans                                                                        1%                           20%         49%          31%

                                                                      pos
                                                                       all small firms (3–199 Workers)                                                       1%                          12%         31%          56%
                                                                       all large firms (200 or more Workers)                                                 0                           27          26           47
                                                                      All pos plans                                                                          1%                          18%         29%          52%

                                                                      hDhp/so
                                                                       all small firms (3–199 Workers)                                                      1%                           2%          61%          36%
                                                                       all large firms (200 or more Workers)                                                0                            8           64           28
                                                                      All hDhp/sos                                                                         1%                           5%          62%          32%

                                     13                               All plANs*
                                                                       all small firms (3–199 Workers)                                                      1%                           12%         39%          48%
    sec tio n thir teen


                                                                       all large firms (200 or more Workers)                                               1                            18          45           37
                                                                      All firms                                                                            1%                           16%         43%          41%


                                                                                              source:

                                                                                        kaiser/hret survey of employer-sponsored health Benefits, 2009.

                                                                                     * distributions are statistically different between all small firms and all large firms (p.05).


                                                            196
                                                                  t h e k a i s e r fa m i ly f o u n d at i o n - a n d - h e a lt h r e s e a r C h  e d u C at i o n a l t r u s t
-and-


             The Henry J. Kaiser Family Foundation                                   Health Research  Educational Trust

                            Headquarters
                    2400 Sand Hill Road                                                   1 North Franklin Street
                   Menlo Park, CA 94025                                                      Chicago, IL 60606
           Phone 650-854-9400 Fax 650-854-4800                                     Phone 312-422-2600 Fax 312-422-4568

                        Washington Offices and                                                     www.hret.org
                   Barbara Jordan Conference Center
                          1330 G Street, NW
                        Washington, DC 20005
                 Phone 202-347-5270    Fax 202-347-5274

                             www.kff.org


                        This publication (#7936) is available on the Kaiser Family Foundation’s website at www.kff.org.
                           Multiple copies may be obtained from HRET by calling 1-800-242-2626 (order #097520).


September 2009

2009 Kaiser Employer Health Study

  • 1.
    60% $4,8 2 4 T H E K A I S E R FA M I Ly F O u N D AT I O N $ 13,375 - AND - H E A LT H R E S E A R C H & E D u C AT I O N A L T R u S T Employer Health Benefits 2009 Annual Survey 2009 -a nd-
  • 2.
    Primary Authors: KAISER FAMILYFOUNDATION Gary Claxton Bianca DiJulio Benjamin Finder Janet Lundy HEALTH RESEARCH & EDUCATIONAL TRUST Megan McHugh Awo Osei-Anto NATIONAL OpINION RESEARCH CENTER Heidi Whitmore Jeremy pickreign Jon Gabel The Kaiser Family Foundation is a non-profit private operating foundation, based in Menlo Park, California, dedicated to producing and communicating the best possible analysis and information on health issues. Founded in 1944, the Health Research & Educational Trust (HRET) is a private, not-for-profit organization involved in research, education, and demonstration programs addressing health management and policy issues. An affiliate of the American Hospital Association (AHA), HRET collaborates with health care, government, academic, business, and community organizations across the united States to conduct research and disseminate findings that shape the future of health care. For more information about HRET, visit www.hret.org. NORC, known since its founding in 1941 as the National Opinion Research Center, pursues objective research that serves the public interest. NORC has offices on the university of Chicago campus and in Chicago, Bethesda, MD, and Berkeley, CA, and a field staff that operates nationwide. NORC’s clients include government agencies, educational institutions, foundations, other nonprofit organizations, and private corporations. Its projects are interdisciplinary and are local, regional, national, and international in scope. Copyright © 2009 Henry J. Kaiser Family Foundation, Menlo Park, California, and Health Research & Educational Trust, Chicago, Illinois. All rights reserved. Printed in the united States of America. ISBN: 978-0-87258-864-6 American Hospital Association/Health Research & Educational Trust Catalog Number 097520
  • 3.
    t h ek a i s e r fa m i ly f o u n dat i o n - AND - he alt h r e se arCh & eduC at i onal t rus t Employer Health Benefits 2009 Annual Survey -and-
  • 5.
    T A bl e o f C o N T e N T s lisT of exhibiTs v summAry of fiNDiNgs 1 survey DesigN AND meThoDs 9 seCTioN 1 Cost of Health Insurance 19 seCTioN 2 Health Benefits Offer Rates 35 seCTioN 3 Employee Coverage, Eligibility, and Participation 47 seCTioN 4 Types of Plans Offered 55 seCTioN 5 Market Shares of Health Plans 61 seCTioN 6 Worker and Employer Contributions for Premiums 65 seCTioN 7 Employee Cost Sharing 91 seCTioN 8 High-Deductible Health Plans with Savings Option 123 seCTioN 9 Prescription Drug Benefits 143 s e C T i o N 10 Plan Funding 155 s e C T i o N 11 Retiree Health Benefits 163 s e C T i o N 12 Wellness Programs and Health Risk Assessments 169 s e C T i o N 13 Employer and Health Plan Practices, and Employer Opinions 181 iii t h e k a i s e r fa m i ly f o u n d at i o n - a n d - h e a lt h r e s e a r C h & e d u C at i o n a l t r u s t
  • 7.
    l i sT o f e x h i b i T s survey DesigN AND meThoDs exhibit 1.9 30 Distribution of Annual Premiums for Covered exhibit m.1 15 Workers with Single Coverage, 2009 Selected Characteristics of Firms in the Survey Sample, 2009 exhibit 1.10 30 Distribution of Annual Premiums for Covered exhibit m.2 16 Workers with Family Coverage, 2009 Distribution of Employers, Workers, and Workers Covered by Health Benefits, exhibit 1.11 31 by Firm Size, 2009 Average Annual Premiums for Single and Family Coverage, by Whether or Not Firm Offered the exhibit m.3 17 Same Plan Last Year and by Firm Size, 2009 States by Region, 2009 exhibit 1.12 32 Co s T o f h e A lT h i N s u r A N C e Average Annual Premiums for Single and Family Coverage, 1999–2009 exhibit 1.1 22 Average Monthly and Annual Premiums exhibit 1.13 33 for Covered Workers, Single and Family Average Annual Premiums for Covered Coverage, by Plan Type, 2009 Workers with Family Coverage, by Firm Size, 1999–2009 exhibit 1.2 23 Average Monthly and Annual Premiums for exhibit 1.14 33 Covered Workers, by Plan Type and Firm Size, Average Annual Premiums for Covered 2009 Workers with Family Coverage, by Firm Size, 1999–2009 exhibit 1.3 24 Average Monthly and Annual Premiums for exhibit 1.15 34 Covered Workers, by Plan Type and Region, Among Workers in Large Firms (200 or 2009 More Workers), Average Health Insurance Premiums for Family Coverage, by Funding exhibit 1.4 25 Arrangement, 1999–2009 Average Monthly and Annual Premiums for Covered Workers, by Plan Type and Industry, h e A lT h b e N e f i T s o f f e r r AT e s 2009 exhibit 2.1 38 exhibit 1.5 27 Percentage of Firms Offering Health Benefits, Average Annual Premiums for Covered 1999–2009 Workers with Single Coverage, by Firm Characteristics, 2009 exhibit 2.2 38 Percentage of Firms Offering Health Benefits, exhibit 1.6 28 by Firm Size, 1999–2009 Average Annual Premiums for Covered Workers with Family Coverage, by Firm exhibit 2.3 39 Characteristics, 2009 Percentage of Firms Offering Health Benefits, by Firm Size, Region, and Industry, 2009 exhibit 1.7 29 Distribution of Annual Premiums for Single exhibit 2.4 40 and Family Coverage Relative to the Average Percentage of Firms Offering Health Benefits, Annual Single or Family Premium, 2009 by Firm Characteristics, 2009 exhibit 1.8 29 exhibit 2.5 41 Distribution of Premiums for Single and Among Firms Offering Health Benefits, Family Coverage Relative to the Average Percentage That Offer Health Benefits to Annual Single or Family Premium, 2009 Part-Time Workers, by Firm Size, 1999–2009 v t h e k a i s e r fa m i ly f o u n d at i o n - a n d - h e a lt h r e s e a r C h & e d u C at i o n a l t r u s t
  • 8.
    exhibit 2.6 41 exhibit 3.2 51 Among Firms Offering Health Benefits, Eligibility, Take-Up Rate, and Coverage in Percentage That Offer Health Benefits to Firms Offering Health Benefits, by Firm Size, Temporary Workers, by Firm Size, 1999–2009 Region, and Industry, 2009 exhibit 2.7 42 exhibit 3.3 52 Among Firms Offering Health Benefits, Among Workers in Firms Offering Health Distribution of Whether Employers Offer Benefits, Percentage of Workers Eligible Health Benefits to Unmarried Opposite-Sex for Health Benefits Offered by Their Firm, Domestic Partners, by Firm Size, Region, by Firm Characteristics, 2009 and Industry, 2009 exhibit 3.4 52 exhibit 2.8 43 Among Workers in Firms Offering Health Among Firms Offering Health Benefits, Benefits, Percentage of Eligible Workers Who Distribution of Whether Employers Offer Take Up Health Benefits Offered by Their Health Benefits to Unmarried Same-Sex Firm, by Firm Characteristics, 2009 Domestic Partners, by Firm Size, Region, and Industry, 2009 exhibit 3.5 53 Among Workers in Firms Offering Health exhibit 2.9 44 Benefits, Percentage of Workers Covered Among Small Firms (3–199 Workers) by Health Benefits Offered by Their Firm, Not Offering Health Benefits, Reasons by Firm Characteristics, 2009 for Not Offering, 2009 exhibit 3.6 53 exhibit 2.10 44 Eligibility, Take-Up Rate, and Coverage Among Small Firms (3–199 Workers) Not for Workers in Firms Offering Health Benefits, Offering Health Benefits, Percentage That by Firm Size, 1999–2009 Report The Following Activities Regarding Health Benefits, by Firm Size, 2009 exhibit 3.7 54 Percentage of Covered Workers in Firms with exhibit 2.11 45 a Waiting Period for Coverage and Average Among Small Firms (3–199 Workers) Not Waiting Period in Months, by Firm Size, Offering Health Benefits, Employer Beliefs Region, and Industry, 2009 About Employees’ Preferences for Higher Wages or Health Insurance Benefits, 2003–2009 exhibit 3.8 54 Distribution of Covered Workers with the exhibit 2.12 45 Following Waiting Periods for Coverage, 2009 Among Small Firms (3–199 Workers) Not Offering Benefits, Distribution of Firms by Types of plANs offereD the Amount They Believe They Could Afford to Pay Monthly for Health Insurance exhibit 4.1 57 Coverage for an Employee with Single Among Firms Offering Health Benefits, Coverage, by Firm Size, 2009 Percentage of Firms That Offer One, Two, or Three or More Plan Types, by Firm Size, 2009 exhibit 2.13 46 Among Small Firms (3–199 Workers) Not exhibit 4.2 58 Offering Health Benefits, Distribution of Among Firms Offering Health Benefits, Firms by the Amount They Believe the Total Percentage of Covered Workers in Firms Monthly Cost of Health Insurance for One Offering One, Two, or Three or More Plan Employee with Single Coverage Would be if Types, by Firm Size, 2009 They Offered the Benefit, by Firm Size, 2009 exhibit 4.3 59 Among Firms Offering Health Benefits, e m p loy e e Co v e r Ag e , Percentage of Firms That Offer the Following e l i g i b i l i T y, A N D pA r T i C i pAT i o N Plan Types, by Firm Size, 2009 exhibit 3.1 50 exhibit 4.4 59 Percentage of All Workers Covered by Their Among Firms Offering Health Benefits, Employers’ Health Benefits, in Firms Both Percentage of Covered Workers in Firms That Offering and Not Offering Health Benefits, Offer the Following Plan Types, by Firm Size, by Firm Size, 1999–2009 2009 vi t h e k a i s e r fa m i ly f o u n d at i o n - a n d - h e a lt h r e s e a r C h & e d u C at i o n a l t r u s t
  • 9.
    m A rk e T s h A r e s o f h e A lT h p l A N s exhibit 6.10 77 Average Annual Firm and Worker Premium exhibit 5.1 63 Contributions and Total Premiums for Distribution of Health Plan Enrollment for Covered Workers for Family Coverage, Covered Workers, by Plan Type, 1988–2009 by Plan Type and Firm Size, 2009 exhibit 5.2 64 exhibit 6.11 78 Distribution of Health Plan Enrollment Average Monthly and Annual Worker for Covered Workers, by Firm Size, Region, Premium Contributions Paid by Covered and Industry, 2009 Workers for Single and Family Coverage, by Plan Type and Firm Size, 2009 W o r k e r A N D e m p loy e r Co N T r i b u T i o N s f o r p r e m i u m s exhibit 6.12 79 Average Monthly and Annual Worker exhibit 6.1 68 Premium Contributions Paid by Covered Average Percentage of Premium Paid Workers for Single and Family Coverage, by Covered Workers for Single and Family by Plan Type and Region, 2009 Coverage, 1999–2009 exhibit 6.13 80 exhibit 6.2 69 Average Monthly Worker Premium Average Monthly Worker Premium Contributions Paid by Covered Workers Contributions Paid by Covered Workers for Single and Family Coverage, by Plan Type, for Single and Family Coverage, 1999–2009 1999–2009 exhibit 6.3 70 exhibit 6.14 80 Average Annual Worker and Employer Distribution of Worker Premium Contributions to Premiums and Total Contributions for Single and Family Coverage Premiums for Single Coverage, 1999–2009 Relative to the Average Annual Worker Premium Contribution, 2009 exhibit 6.4 71 Average Annual Worker and Employer exhibit 6.15 81 Contributions to Premiums and Total Distribution of Percentage of Premium Paid Premiums for Family Coverage, 1999–2009 by Covered Workers for Single and Family Coverage, 2001–2009 exhibit 6.5 72 Average Annual Firm and Worker Premium exhibit 6.16 82 Contributions and Total Premiums for Distribution of Percentage of Premium Paid Covered Workers for Single and Family by Covered Workers for Single Coverage, Coverage, by Plan Type, 2009 by Firm Size, 2001–2009 exhibit 6.6 73 exhibit 6.17 83 Average Annual Worker Contributions Distribution of Percentage of Premium Paid for Covered Workers with Single Coverage, by Covered Workers for Family Coverage, by Firm Size, 1999–2009 by Firm Size, 2001–2009 exhibit 6.7 74 exhibit 6.18 84 Average Annual Worker Contributions Average Percentage of Premium Paid for Covered Workers with Family Coverage, by Covered Workers for Single Coverage, by Firm Size, 1999–2009 by Firm Characteristics, 2009 exhibit 6.8 75 exhibit 6.19 85 Average Annual Worker Premium Average Percentage of Premium Paid Contributions Paid by Covered Workers by Covered Workers for Family Coverage, for Single and Family Coverage, by Firm Size, by Firm Characteristics, 2009 1999–2009 exhibit 6.20 86 exhibit 6.9 76 Average Percentage of Premium Paid Average Annual Firm and Worker Premium by Covered Workers for Single and Family Contributions and Total Premiums for Coverage, by Plan Type and Firm Size, 2009 Covered Workers for Single Coverage, by Plan Type and Firm Size, 2009 vii t h e k a i s e r fa m i ly f o u n d at i o n - a n d - h e a lt h r e s e a r C h & e d u C at i o n a l t r u s t
  • 10.
    exhibit 6.21 87 exhibit 7.9 103 Average Percentage of Premium Paid Among Covered Workers With a General by Covered Workers for Single and Family Annual Health Plan Deductible for Single Coverage, by Plan Type, 1999–2009 POS Coverage, Distribution of Deductibles, 2006–2009 exhibit 6.22 88 Average Percentage of Premium Paid exhibit 7.10 104 by Covered Workers for Single and Family Distribution of Type of General Annual Coverage, by Plan Type and Region, 2009 Deductible for Covered Workers with Family Coverage, by Plan Type and Firm Size, 2009 exhibit 6.23 89 Average Percentage of Premium Paid by exhibit 7.11 105 Covered Workers, by Plan Type and Industry, Among Covered Workers with a General 2009 Annual Health Plan Deductible, Average Deductibles for Family Coverage, by Deductible e m p loy e e Co s T s h A r i N g Type, Plan Type, and Firm Size, 2009 exhibit 7.1 96 exhibit 7.12 106 Percentage of Covered Workers With No Among Covered Workers with a General General Annual Health Plan Deductible Annual Health Plan Deductible for Family for Single and Family Coverage, by Plan Type Coverage, Average Aggregate Deductible, and Firm Size, 2009 by Plan Type, 2006–2009 exhibit 7.2 97 exhibit 7.13 107 Among Covered Workers with No General Among Covered Workers with a General Annual Health Plan Deductible for Single and Annual Health Plan Deductible, Average Family Coverage, Percentage Who Have the Deductibles for Family Coverage, by Deductible Following Types of Cost Sharing, by Plan Type, Plan Type, and Firm Size, 2009 Type, 2009 exhibit 7.14 108 exhibit 7.3 98 Among Covered Workers With a Separate per Among Covered Workers with a General Person General Annual Health Plan Deductible Annual Health Plan Deductible for Single for Family Coverage, Distribution of Maximum Coverage, Average Deductible, by Plan Type Number of Family Members Required to Meet and Firm Size, 2009 the Deductible, by Plan Type, 2009 exhibit 7.4 99 exhibit 7.15 109 Among Covered Workers with a General Among Covered Workers With an Aggregate Annual Health Plan Deductible for Single General Annual Health Plan Deductible for Coverage, Average Deductible, by Plan Type Family Coverage, Distribution of Aggregate and Region, 2009 Deductibles, by Plan Type, 2006–2009 exhibit 7.5 100 exhibit 7.16 110 Among Covered Workers with a General Annual Among Covered Workers with a General Health Plan Deductible for Single Coverage, Annual Health Plan Deductible, Percentage Average Deductible, by Plan Type, 2006–2009 with Coverage for the Following Services Without Having to First Meet the Deductible, exhibit 7.6 101 by Plan Type, 2009 Percentage of Covered Workers Enrolled in a Plan with a High General Annual Deductible exhibit 7.17 110 for Single Coverage, By Firm Size, 2009 Distribution of Covered Workers With Separate Cost Sharing for a Hospital exhibit 7.7 102 Admission in Addition to Any General Percentage of Covered Workers Enrolled Annual Deductible, by Plan Type, 2009 in a Plan with a General Annual Deductible of $1,000 or More for Single Coverage, exhibit 7.18 111 By Firm Size, 2006–2009 Distribution of Covered Workers With Separate Cost Sharing for an Outpatient exhibit 7.8 103 Surgery in Addition to Any General Annual Among Covered Workers With a General Annual Deductible, by Plan Type, 2009 Health Plan Deductible for Single PPO Coverage, Distribution of Deductibles, 2006–2009 viii t h e k a i s e r fa m i ly f o u n d at i o n - a n d - h e a lt h r e s e a r C h & e d u C at i o n a l t r u s t
  • 11.
    exhibit 7.19 112 exhibit 7.30 120 Among Covered Workers With Separate Among Covered Workers with an Aggregate Cost Sharing for a Hospital Admission or Out-of-Pocket Maximum for Family Outpatient Surgery in Addition to Any Coverage, Distribution of Out-of-Pocket General Annual Deductible, Average Cost Maximums, by Plan Type, 2009 Sharing, by Plan Type, 2009 exhibit 7.31 121 exhibit 7.20 113 Among Covered Workers with a Separate per In Addition to Any Plan Deductible, Person Out-of-Pocket Maximum for Family Percentage of Covered Workers With the Coverage, Distribution of Out-of-Pocket Following Types of Cost Sharing for Physician Maximums, by Plan Type, 2009 Office Visits, by Plan Type, 2009 exhibit 7.32 121 exhibit 7.21 113 Among Covered Workers with a Separate per Among Covered Workers with Copayments Person Out-of-Pocket Maximum for Family and/or Coinsurance for In-Network Physician Coverage, Distribution of Maximum Number Office Visits, Average Copayments and of Family Members Required to Meet the Coinsurance, by Plan Type, 2009 Maximum, by Plan Type, 2009 exhibit 7.22 114 h i g h - D e D u C T i b l e h e A lT h p l A N s Among Covered Workers With Copayments for a Physician Office Visit with a Primary W i T h s Av i N g s o p T i o N Care Physician, Distribution of Copayments, exhibit 8.1 129 by Plan Type, 2004–2009 Among Firms Offering Health Benefits, exhibit 7.23 115 Percentage That Offer an HDHP/HRA and/ Among Covered Workers With Copayments or an HSA-Qualified HDHP, 2005–2009 for a Physician Office Visit with a Specialty exhibit 8.2 129 Care Physician, Distribution of Copayments, Among Firms Offering Health Benefits, by Plan Type, 2006–2009 Percentage That Offer an HDHP/SO, by Firm exhibit 7.24 116 Size, 2009 Among Covered Workers in HMOs With exhibit 8.3 130 Copayments for a Physician Office Visit, Among Firms Offering Health Benefits, Distribution of Percentage of Workers with Percentage That Offer an HDHP/SO, by Firm Various Copayments, 1999–2009 Size, 2005–2009 exhibit 7.25 116 exhibit 8.4 130 Among Covered Workers With Coinsurance Percentage of Covered Workers Enrolled for Physician Office Visits, Distribution of in an HDHP/HRA or HSA-Qualified HDHP, Average Coinsurance Rates, by Plan Type, 2009 2006–2009 exhibit 7.26 117 exhibit 8.5 131 Percentage of Covered Workers Without an Percentage of Covered Workers Enrolled Annual Out-of-Pocket Maximum for Single in an HDHP/HRA or HSA-Qualified HDHP, and Family Coverage, by Plan Type, 2009 by Firm Size, 2009 exhibit 7.27 117 exhibit 8.6 131 Among Covered Workers with an Annual HDHP/HRA and HSA-Qualified HDHP Out-of-Pocket Maximum, Percentage Whose Features for Covered Workers, 2009 Spending for Various Services Does Not Count Towards the Out-of-Pocket Maximum, 2009 exhibit 8.7 132 HSA-Qualified HDHP Features for Covered exhibit 7.28 118 Workers, by Firm Size, 2009 Among Covered Workers with an Out-of-Pocket Maximum for Single Coverage, Distribution of exhibit 8.8 133 Out-of-Pocket Maximums, by Plan Type, 2009 Average Annual Premiums and Contributions to Savings Accounts For Covered Workers exhibit 7.29 119 in HDHP/HRAs or HSA-Qualified HDHPs, Distribution of Type of Out-of-Pocket Compared to All Non-HDHP/SO Plans, 2009 Maximum for Covered Workers with Family Coverage, by Plan Type and Firm Size, 2009 ix t h e k a i s e r fa m i ly f o u n d at i o n - a n d - h e a lt h r e s e a r C h & e d u C at i o n a l t r u s t
  • 12.
    exhibit 8.9 134 exhibit 8.20 141 Distribution of Covered Workers with the Among Firms Not Currently Offering an Following General Annual Deductible HDHP/HRA or HSA-Qualified HDHP, Amounts for Single Coverage, HSA-Qualified Distribution of Firms Reporting the Likelihood HDHPs and HDHP/HRAs, 2009 of Offering an HDHP/HRA or HSA-Qualified HDHP in the Next Year, by Firm Size, 2009 exhibit 8.10 134 Among Covered Workers, Distribution of Type of General Annual Deductible for Family presCripTioN Drug beNefiTs Coverage, HDHP/HRAs and HSA-Qualified exhibit 9.1 146 HDHPs, 2009 Distribution of Covered Workers Facing Different Cost-Sharing Formulas for exhibit 8.11 135 Prescription Drug Benefits, 2000–2009 Distribution of Covered Workers with the Following Aggregate Family Deductible exhibit 9.2 147 Amounts, HDHP/HRAs and HSA-Qualified Distribution of Covered Workers Facing HDHPs, 2009 Different Cost-Sharing Formulas for Prescription Drug Benefits, by Plan Type, 2009 exhibit 8.12 135 Percentage of Covered Workers with Coverage exhibit 9.3 148 for the Following Services Without Having to Among Workers with Three, Four, or More First Meet the Deductible, HDHP/HRAs and Tiers of Cost Sharing, Distribution of Covered HSA-Qualified HDHPs, by Benefit Type, 2009 Workers with the Following Types of Cost Sharing for Prescription Drugs, by Drug and exhibit 8.13 136 Plan Type, 2009 Percentage of Covered Workers in Partially or Completely Self-Funded HDHP/HRAs and exhibit 9.4 149 HSA-Qualified HDHPs, 2009 Among Covered Workers with Three, Four, or More Tiers of Prescription Cost Sharing, exhibit 8.14 136 Average Copayments and Average Distribution of Covered Workers with the Coinsurance, 2000–2009 Following Annual Employer Contributions to their HRA or HSA, for Single Coverage, 2009 exhibit 9.5 150 Among Workers with Two Tiers of Cost exhibit 8.15 137 Sharing for Prescription Drugs, Distribution Distribution of Covered Workers with the of Covered Workers with the Following Types Following Annual Employer Contributions to of Cost Sharing for Prescription Drugs, their HRA or HSA, for Family Coverage, 2009 by Drug and Plan Type, 2009 exhibit 8.16 137 exhibit 9.6 151 Distribution of Firm Contributions to the Among Covered Workers with Two Tiers of HRA for Single and Family Coverage Relative Prescription Cost Sharing, Average Copayments to the Average Annual Firm Contribution and Average Coinsurance, 2000–2009 to the HRA, 2009 exhibit 9.7 151 exhibit 8.17 138 Among Workers with the Same Cost Sharing Distribution of Firm Contributions to the Regardless of Type of Drug, Distribution HSA for Single and Family Coverage Relative of Covered Workers with the Following Types to the Average Annual Firm Contribution of Cost Sharing for Prescription Drugs, to the HSA, 2009 by Plan Type, 2009 exhibit 8.18 139 exhibit 9.8 152 Distribution of Covered Workers in HDHP/ Among Covered Workers with the Same Cost HRAs and HSA-Qualified HDHPs With the Sharing Regardless of Type of Drug, Average Following Types of Cost Sharing in Addition Copayments and Average Coinsurance, to the General Annual Deductible, 2009 2000–2009 exhibit 8.19 140 exhibit 9.9 152 Among Firms Offering HDHP/SOs, Percentage of Covered Workers with Drug Employer Opinions on Outcomes and Coverage Who Face a Separate Drug Reasons for Offering HDHP/SOs, 2009 Deductible, by Plan Type, 2005–2009 x t h e k a i s e r fa m i ly f o u n d at i o n - a n d - h e a lt h r e s e a r C h & e d u C at i o n a l t r u s t
  • 13.
    exhibit 9.10 153 exhibit 11.3 167 Percentage of Covered Workers with Drug Among All Large Firms (200 or More Workers) Coverage with a Separate Annual Out-of- Offering Health Benefits to Active Workers, Pocket Limit That Applies to Prescription Percentage of Firms Offering Retiree Health Drugs, by Plan Type, 2007–2009 Benefits, by Firm Characteristics, 2009 exhibit 11.4 167 plAN fuNDiNg Among All Large Firms (200 or More Workers) exhibit 10.1 157 Offering Health Benefits to Active Workers and Percentage of Covered Workers in Partially Offering Retiree Coverage, Percentage of Firms or Completely Self-Funded Plans, Offering Health Benefits to Early and Medicare- by Firm Size, 1999–2009 Age Retirees, 1999–2009 exhibit 10.2 157 exhibit 11.5 168 Percentage of Covered Workers in Partially Among All Large Firms (200 or More or Completely Self-Funded Plans, Workers) Offering Health Benefits to Active by Plan Type, 1999–2009 Workers and Offering Retiree Coverage, Percentage of Firms Offering Retiree Health exhibit 10.3 158 Benefits to Early and Medicare-Age Retirees, Percentage of Covered Workers in Partially by Firm Size, Region, and Industry, 2009 or Completely Self-Funded Plans, by Firm Size, Region, and Industry, 2009 WellNess progrAms exhibit 10.4 159 A N D h e A lT h r i s k A s s e s s m e N T s Percentage of Covered Workers in Partially exhibit 12.1 173 or Completely Self-Funded Plans, Among Firms Offering Health Benefits, by Plan Type and Firm Size, 2009 Percentage Offering a Particular Wellness exhibit 10.5 159 Program to Their Employees, by Firm Size, Percentage of Covered Workers in Partially Region, and Industry, 2009 or Completely Self-Funded HMO Plans, exhibit 12.2 174 by Firm Size, 1999-2009 Among Firms Offering Health Benefits, exhibit 10.6 160 Percentage Offering a Particular Wellness Percentage of Covered Workers in Partially Program to Their Employees, by Firm Size, or Completely Self-Funded PPO Plans, Region, and Industry, 2009 by Firm Size, 1999–2009 exhibit 12.3 175 exhibit 10.7 160 Among Firms Offering Health Benefits, Percentage Percentage of Covered Workers in Partially of Firms With the Following Features of Wellness or Completely Self-Funded POS Plans, Benefits, by Firm Size and Region, 2009 by Firm Size, 1999–2009 exhibit 12.4 176 exhibit 10.8 161 Among Firms Offering Health and Wellness Percentage of Covered Workers in Partially Benefits, Percentage of Firms That Offer or Completely Self-Funded HDHP/SOs, Specific Incentives to Employees Who by Firm Size, 2006–2009 Participate in Wellness Programs, by Firm Size and Region, 2009 r e T i r e e h e A lT h b e N e f i T s exhibit 12.5 177 Among Firms Offering Health Benefits exhibit 11.1 165 and Wellness Programs, Percentage That Use Among All Large Firms (200 or More Workers) Specific Methods to Identify Individuals and Offering Health Benefits to Active Workers, Encourage Participation in Wellness Programs, Percentage of Firms Offering Retiree Health by Firm Size, Region, and Industry, 2009 Benefits, 1988-2009 exhibit 12.6 178 exhibit 11.2 166 Among Firms Offering Health Benefits Among Firms Offering Health Benefits to and Wellness Programs, Percentage of Firms Active Workers, Percentage of Firms Offering Reporting the Following as the Firm’s Primary Retiree Health Benefits, by Firm Size, Region, Reason for Offering Wellness Programs, and Industry, 2009 by Firm Size, 2009 xi t h e k a i s e r fa m i ly f o u n d at i o n - a n d - h e a lt h r e s e a r C h & e d u C at i o n a l t r u s t
  • 14.
    exhibit 12.7 178 exhibit 13.5 189 Among Firms Offering Health Benefits and Among Firms Offering Health Benefits That Wellness Programs, Percentage of Firms That Shopped for a New Plan or Insurance Carrier, Think Offering Wellness Programs is Effective Percentage Reporting That They Changed at Improving Health or Reducing Costs, 2009 Insurance Carrier and/or Health Plan Type in the Past Year, by Firm Size, 2009 exhibit 12.8 179 Among Firms Offering Health Benefits, exhibit 13.6 190 Percentage of Firms That Offer Employees Among Firms Offering Health Benefits, Health Risk Assessments, Offer Incentives to Percentage of Firms Reporting the Following Complete Assessments, and Use Assessments as the Most Important Factor in the Firm’s to Increase Wellness Participation, by Firm Decision to Choose a Particular Plan, in Size and Region, 2009 Addition to Cost, by Firm Size, 2009 exhibit 12.9 180 exhibit 13.7 191 Among Large Firms (200 or More Workers) Among Firms Offering Health Benefits, Offering Financial Incentives for Health Risk Percentage of Firms Reporting the Use Assessments, Percentage of Firms That Offer of the Following Contribution Approaches the Following Incentives to Complete for Health Benefits, 2009 Assessments, by Firm Size and Region, 2009 exhibit 13.8 192 exhibit 12.10 180 Among Firms Offering Health Benefits, Among Firms Offering Health Benefits Distribution of Firms Reporting the and Health Risk Assessments, Distribution Likelihood of Adopting the Following of Firms Reporting the Following in Terms Contribution Approaches for Health Benefits of When Employees Must Take Health Risk in the Next Two Years, 2009 Assessments, by Firm Size, 2009 exhibit 13.9 193 Among Offering and Non-Offering Firms, e m p loy e r A N D h e A lT h p l A N Percentage With the Following On-Site Health p r AC T i C e s , A N D e m p loy e r o p i N i o N s and Safety Programs, by Firm Size, Region, and Industry, 2009 exhibit 13.1 185 Among Both Firms Offering and Not exhibit 13.10 194 Offering Health Benefits, Distribution Percentage of Firms with the Following of Firms’ Opinions on the Effectiveness Utilization Management Provisions in their of the Following Strategies to Contain Health Largest Health Plan, By Firm Size, Region, Insurance Costs, by Firm Size, 2009 and Industry, 2009 exhibit 13.2 186 exhibit 13.11 195 Among Firms Offering Health Benefits, Distribution of Covered Workers by Distribution of Firms Reporting the Maximum Lifetime Benefit Payable to an Likelihood of Making the Following Changes Employee with Single Coverage, by Plan Type, in the Next Year, by Firm Size, 2009 2004–2009 exhibit 13.3 187 exhibit 13.12 196 Among Firms Offering Health Benefits, Distribution of Covered Workers by Percentage of Firms That Report They Made Maximum Lifetime Benefit Payable to an the Following Changes as a Result of the Employee with Single Coverage, by Plan Type Economic Downturn, by Firm Size and and Firm Size, 2009 Region, 2009 exhibit 13.4 188 Percentage of Firms Offering Health Benefits That Shopped For a New Plan or Health Insurance Carrier in the Past Year, by Firm Size, 2009 xii t h e k a i s e r fa m i ly f o u n d at i o n - a n d - h e a lt h r e s e a r C h & e d u C at i o n a l t r u s t
  • 15.
    Summary of Findings E mployer - sponsored insurance is the leading source of health insurance , covering about 159 million nonelderly people in a merica . 1 to provide current information about the nature of employer - sponsored health benefits , the K aiser family foundation (K aiser ) and the h ealth r esearch & e ducational trust (hret ) conduct an annual national survey of nonfederal private and public employers with three or more worKers . t his is the eleventh K aiser /hret survey and reflects health benefit information for 2009. The key findings from the 2009 survey, conducted from January through May Exhibit A 2009, provide a mixed, but relatively stable Average Annual health insurance premiums and Worker Contributions story compared to 2008. In 2009, there was for family Coverage, 1999–2009 an increase in the average family premium, 131% $13,375 the percentage of covered workers with a Premium Increase deductible of $1,000 or more for single coverage, office visit copayments, and the $9,860 percentage of large firms offering wellness $5,791 128% programs. The average premium for single Worker Contribution coverage did not significantly increase, $4,247 Increase breaking a long-standing trend. $3,515 $1,543 The survey shows that many of the statistics 1999 2009 related to health benefits remained relatively stable despite the severe economic downturn. Employer Contribution Worker Contribution This may indicate a strong commitment to note: the average worker contribution and the average employer contribution may not add to the average total maintaining workers’ benefits, but several premium due to rounding. other factors may have contributed to this source: kaiser/hret survey of employer-sponsored health Benefits, 1999–2009. result as well. One is that the survey only collects information from firms that are still workers) than for workers in large firms premium while 18% make no contribution. in business and cannot estimate the number (200 or more workers). Average premiums Forty-five percent of workers with family of workers who lost coverage due to their for high-deductible health plans with a coverage pay more than 25% of the total company downsizing or closing. Another is savings option (HDHP/SOs) are lower than premium; only 6% make no contribution that some firms may have made decisions the overall average for all plan types for both (Exhibit D). In terms of dollar amounts, about health benefits in advance of the plan single and family coverage (Exhibit B). the average annual worker contributions year and may not have foreseen the full impact of the worsening economy on the As a result of factors such as benefit for single and family coverage are $779 firm. These firms may have made changes differences and geographical location, there and $3,515,2 respectively, which are not after they were surveyed or may make is significant variation around the average significantly different from the amounts changes for the next plan year. annual premium. Twenty percent of covered reported in 2008. For single coverage, workers workers with family coverage are in plans in small firms (3–199 workers) contribute less H E A LT H I N S U R A N C E P R E M I U M S with an annual total premium of at least on average than workers in large firms (200 or $16,050 (120% of the average premium); more workers) ($625 vs. $854), but for family In 2009, the average annual premiums for 21% of covered workers are in plans where employer-sponsored health insurance are coverage, workers in small firms contribute the family premium is less than $10,700 $4,824 for single coverage and $13,375 significantly more than workers in large firms (80% of the average premium) (Exhibit C). for family coverage. Premiums for family ($4,204 vs. $3,182). coverage are 5% higher than last year On average, covered workers contribute ($12,680), but there was no statistically 17% of the total premium for single coverage The majority (60%) of covered workers are significant growth in the single premiums. and 27% for family coverage, similar to the enrolled in preferred provider organizations Since 1999, average premiums for family last several years. The share of the premium (PPOs). Health maintenance organizations coverage have increased 131% (Exhibit A). workers contribute for coverage also varies (HMOs) cover 20%, followed by point-of- Average premiums for family coverage are considerably. For single coverage, 24% of service (POS) plans (10%), HDHP/SOs lower for workers in small firms (3–199 workers pay more than 25% of the total (8%), and conventional plans (1%). 1 t h e k a i s e r fa m i ly f o u n d at i o n - a n d - h e a lt h r e s e a r C h & e d u C at i o n a l t r u s t
  • 16.
    Exhibit b Average Annual employer and Worker premium Contributions and Total premiums for Covered Workers for single and family Coverage, by plan Type, 2009 HMO Single $817 $4,061 $4,878 Family $3,685 $9,785 $13,470 PPO Single $806 $4,116 $4,922 Family $3,470 $10,249* $13,719 POS Single $741 $4,093 $4,835 Family $4,146* $8,929* $13,075 HDHP/SO $540* Single $3,446* $3,986* Family $2,672* $8,411* $11,083* ALL PLANS Single $779 $4,045 $4,824 Family $3,515 $9,860 $13,375 $0 $2,000 $4,000 $6,000 $8,000 $10,000 $12,000 $14,000 Worker Contribution Employer Contribution * estimate is statistically different from all Plans estimate by coverage type (p<.05). source: kaiser/hret survey of employer-sponsored health Benefits, 2009. EMPLOYEE COST SHARING $1,053 to $1,524 for family coverage.3 As to meet the deductible before prescription in recent years, for single coverage, workers drugs are covered. Most covered workers face additional costs in small firms (3–199 workers) have higher when they use health care services. Most The majority of workers also have to pay a workers in PPOs (74%) and POS plans deductibles than workers in large firms portion of the cost of physician office visits. (62%) have a general annual deductible for (200 or more workers) for HMOs, PPOs, For example, 77% of covered workers pay single coverage that must be met before all and HDHP/SOs. The percentage of covered a copayment (a fixed dollar amount) for a or most services are payable by the plan. In workers in a plan with a deductible of at least visit, and 14% pay coinsurance (a percentage contrast, only 16% of workers in HMOs $1,000 for single coverage grew from 18% to of the charge). Covered workers in HMOs, have a general annual deductible. Many 22% in the past year and, among large firms, PPOs, and POS plans are more likely to workers with no deductible have other it increased from 9% to 13% (Exhibit E). face copayments, while covered workers forms of cost sharing for office visits or other While there was no increase in the percentage in HDHP/SOs are more likely to have services. of workers enrolled in HDHP/SOs in the coinsurance requirements or no cost sharing past year, the percentage of workers in plans Among workers with a deductible, the after any deductibles are met. Covered with deductibles of at least $1,000 who do average general annual deductible for single workers with a copayment pay an average of not have a savings option increased from coverage is $634 for workers in PPOs, $699 $20 for primary care and $28 for specialty 10% to 13%. for workers in HMOs, $1,061 for workers physicians for in-network office visits, both of in POS plans, and $1,838 for workers in Most plans cover certain services before the which are higher than last year ($19 and $26). HDHP/SOs (which by definition have high deductible is met. For example, in the most The percentage of workers with copayments deductibles). Although only 16% of workers common plan type, PPOs, 88% of covered of $25 or $30 dollars for primary care in HMOs have a general annual deductible, workers with a general annual deductible physician office visits increased from 12% in from 2008 to 2009 the average annual do not have to meet the deductible before 2004 to 31% in 2009. For covered workers deductible for these workers increased from preventive care is covered. Ninety-three with coinsurance, the average coinsurance is $503 to $699 for single coverage and from percent of workers in PPOs do not have 18% for primary care, similar to last year. 2 t h e k a i s e r fa m i ly f o u n d at i o n - a n d - h e a lt h r e s e a r C h & e d u C at i o n a l t r u s t
  • 17.
    Exhibit C Distribution of premiums for single and family Coverage relative to the Average Annual single or family premium, 2009 single Coverage family Coverage Percent Covered Percent Covered Premium range, dollar amount Workers in range Premium range, dollar amount Workers in range less than $3,859 23% less than $10,700 21% $3,859 to <$4,341 15% $10,700 to <$12,038 16% $4,341 to <$4,824 19% $12,038 to <$13,375 14% $4,824 to <$5,306 13% $13,375 to <$14,713 17% $5,306 to <$5,788 13% $14,713 to <$16,050 12% $5,788 or more 18% $16,050 or more 20% note: the average annual premium is $4,824 for single coverage and $13,375 for family coverage. the premium distribution is relative to the average single or family premium. for example, $3,859 is 80% of the average single premium, $4,341 is 90% of the average single premium, $5,306 is 110% of the average single premium, and $5,788 is 120% of the average single premium. the same break points relative to the average are used for the distribution for family coverage. source: kaiser/hret survey of employer-sponsored health Benefits, 2009. Almost all covered workers (98%) have fourth tier, there is no statistical difference in average copayment is $85 and the average prescription drug coverage, and the majority the percentage of workers with copayments coinsurance is 31%. face cost sharing for their prescriptions. (41%) or coinsurance (29%). Among Cost sharing for prescription drugs varies by Over three-quarters (78%) of covered workers with three- or four-tier plans, the plan type. Covered workers in HDHP/SOs workers are in plans with three or more average copayments per prescription are $10 are more likely than workers in other plan levels or tiers of cost sharing that generally for first-tier drugs, often called generics; $27 types to be in plans with no cost sharing are based on the type or cost of the drug. for second-tier drugs, often called preferred; after the deductible is met or in plans where Copayments are more common than and $46 for third-tier drugs, often called the cost sharing is the same regardless of the coinsurance for the first three tiers. For the nonpreferred. For fourth-tier drugs the type of drug. Exhibit D Distribution of the percentage of Total premium paid by Covered Workers for single and family Coverage, by firm size, 2009 SINGLE COVERAGE* All Small Firms 39% 40% 19% 3% (3–199 Workers) 1% All Large Firms 8% 67% 24% (200 or More Workers) 1% ALL FIRMS 18% 58% 22% FAMILY COVERAGE* All Small Firms 14% 28% 28% 30% (3–199 Workers) 2% All Large Firms 58% 36% 4% (200 or More Workers) ALL FIRMS 6% 48% 33% 12% 0% 10% 20% 30% 40% 50% 60% 70% 80% 90% 100% 0% Greater than 25%, less than or equal to 50% Greater than 0%, less than or equal to 25% Greater than 50% * distributions for all small firms and all large firms are statistically different (p<.05). source: kaiser/hret survey of employer-sponsored health Benefits, 2009. 3 t h e k a i s e r fa m i ly f o u n d at i o n - a n d - h e a lt h r e s e a r C h & e d u C at i o n a l t r u s t
  • 18.
    Most workers alsoface additional cost less than $1,500. However, not all spending AVAILABILIT Y OF EMPLOYER- sharing for a hospital admission or an counts toward the out-of-pocket maximum. SPONSORED COVERAGE outpatient surgery. For hospital admissions, For example, among workers in PPOs with Sixty percent of employers offer health 51% of covered workers have coinsurance, an out-of-pocket maximum, 75% are in benefits in 2009, which is not statistically 19% have a copayment, and 8% have plans that do not count physician office different from the 63% reported last both coinsurance and copayments. An visit copayments, 34% are in plans that do year (Exhibit F). Less than half (46%) of additional 5% have a per day (per diem) not count spending for the general annual firms with 3 to 9 workers offer coverage, payment and 5% have a separate annual deductible, and 85% are in plans that do compared to 72% of firms with 10 to 24 hospital deductible, while 22% of covered not count prescription drug spending when workers, 87% of firms with 25 to 49 workers have no cost sharing for hospital determining if an enrollee has reached the workers, and over 95% of firms with 50 admissions. For hospital admissions, the out-of-pocket limit. Even in the absence of an out-of-pocket maximum, some workers or more workers. As we have seen in past average coinsurance rate is 18%, the average copayment is $234 per hospital admission, may face limited cost sharing. For example, years, the offer rate is higher for firms with the average per diem charge is $179, and of the 41% of workers in HMOs with no at least some union workers, compared the average separate hospital deductible is out-of-pocket maximum for single coverage, to firms with no union workers (97% $862.4 94% have no general annual deductible and vs. 57%). Firms with fewer lower-wage less than 1% have coinsurance for hospital workers (less than 35% of workers earn Although covered workers are often $23,000 or less annually) are also more admissions. responsible for cost sharing when accessing likely to offer benefits compared to firms health services, there is often a limit to Health plans may limit the benefit amount with more lower-wage employees (35% the amount of cost sharing workers must payable to an employee, often known as or more earn $23,000 or less annually) pay each year, generally referred to as an a lifetime maximum. Forty-one percent (64% vs. 39%). The offer rate represents out-of-pocket maximum. Eighty-one of covered workers are in a plan with no information on firms that are still in percent of covered workers have an out- lifetime maximum benefit payable by the business and does not account for firms of-pocket maximum, but such limits vary plan, while 16% have a lifetime maximum that have gone out of business due to the considerably. For example, among covered between $1 and $2 million, and 43% have economic recession. workers in plans that have an out-of-pocket a lifetime maximum of $2 million or more. maximum for single coverage, 26% are The percentage of workers with a lifetime Even in firms that offer coverage, not all in plans with an annual out-of-pocket maximum of $2 million or more has workers are covered. Some workers are maximum of $3,000 or more, and 24% are increased from 32% of covered workers in not eligible to enroll as a result of waiting in plans with an out-of-pocket maximum of 2007, the last time the question was asked. periods or minimum work-hour rules. Exhibit E percentage of Covered Workers enrolled in a plan with a general Annual Deductible of $1,000 or more for single Coverage, by firm size, 2006–2009 50% 40% 40% 35%* 30% 21%* 22%* 20% 18%* 16% 12%* 13%* 10% 9% 10% 8% 6% 0% 2006 2007 2008 2009 All Small Firms (3–199 Workers) All Large Firms (200 or More Workers) All Firms * estimate is statistically different from estimate for the previous year shown (p<.05). note: these estimates include workers enrolled in hdhP/so and other plan types. Because we do not collect information on the attributes of conventional plans, to be conservative, we assumed that workers in conventional plans do not have a deductible of $1,000 or more. Because of the low enrollment in conventional plans, the impact of this assumption is minimal. source: kaiser/hret survey of employer-sponsored health Benefits, 2006–2009. 4 t h e k a i s e r fa m i ly f o u n d at i o n - a n d - h e a lt h r e s e a r C h & e d u C at i o n a l t r u s t
  • 19.
    Others choose notto enroll, perhaps H I G H - D E D U C T I B L E H E A LT H Account (HSA), referred to as “HSA- because of the cost of coverage or their PLANS WITH SAVINGS OPTION qualified HDHPs.” ability to access coverage through a spouse. High-deductible health plans with a savings Twelve percent of firms offering health Among firms that offer coverage, an average option include (1) health plans with a benefits offer an HDHP/SO in 2009, similar of 79% of workers are eligible for the health deductible of at least $1,000 for single to last year. Although the HDHP/SO offer benefits offered by their employer. Of those eligible, 81% take up coverage, resulting coverage and $2,000 for family coverage rate remained steady among all firms, the in 65% of workers in firms offering health offered with an Health Reimbursement percentage of firms with 1,000 or more benefits having coverage through their Arrangement (HRA), referred to as workers offering an HDHP/SO increased employer. Among both firms that offer and “HDHP/HRAs,” and (2) high-deductible from 22% in 2008 to 28% in 2009. Firms do not offer health benefits, 59% of workers health plans that meet the federal legal with 1,000 or more workers are more likely are covered by health plans offered by their requirements to permit an enrollee to to offer HDHP/SOs (28%) than firms employer. establish and contribute to a Health Savings with 3 to 199 workers (11%) or 200 to 999 Exhibit F percentage of firms offering health benefits, by firm size, 1999-2009 FiRM SiZE 1999 2000 2001 2002 2003 2004 2005 2006 2007 2008 2009 3–9 Workers 56% 57% 58% 58% 55% 52% 47% 48% 45% 49% 46% 10–24 Workers 74% 80% 77% 70%* 76% 74% 72% 73% 76% 78% 72% 25–99 Workers 86% 91% 90% 86% 84% 87% 87% 87% 83% 90%* 87% 50–199 Workers 97% 97% 96% 95% 95% 92% 93% 92% 94% 94% 95% All Small Firms 65% 68% 68% 66% 65% 63% 59% 60% 59% 62% 59% (3–199 Workers) All Large Firms 99% 99% 99% 98% 98% 99% 98% 98% 99% 99% 98% (200 or More Workers) ALL FiRMS 66% 69% 68% 66% 66% 63% 60% 61% 60% 63% 60% * estimate is statistically different from estimate for the previous year shown (p<.05). note: as noted in the survey design and methods section, estimates presented in this exhibit are based on the sample of both firms that completed the entire survey and those that answered just one question about whether they offer health benefits. source: kaiser/hret survey of employer-sponsored health Benefits, 1999–2009. Exhibit G percentage of Covered Workers enrolled in an hDhp/hrA or hsA-Qualified hDhp, by firm size, 2009 40% 30% 20% 13% 10% 9% 8% 6% 6% 3% 3% 3% 4% 0% HDHP/HRA HSA-Quali ed HDHP* HDHP/SO* All Small Firms (3–199 Workers) All Large Firms (200 or More Workers) * estimates are statistically different between all small firms and all large firms within category (p<.05). All Firms source: kaiser/hret survey of employer-sponsored health Benefits, 2009. 5 t h e k a i s e r fa m i ly f o u n d at i o n - a n d - h e a lt h r e s e a r C h & e d u C at i o n a l t r u s t
  • 20.
    workers (18%). Amongfirms offering health Deductibles vary considerably however; for annual firm contributions to HSAs are $688 benefits, 2% offer an HDHP/HRA and example, 27% of workers enrolled in an for single coverage and $1,126 for family 10% offer an HSA-qualified HDHP; neither HSA-qualified HDHP coverage, and although these estimates estimate represents a significant difference for single coverage have a deductible are lower than the estimates for 2008, the from the percentages reported in 2008. between $1,150 and $1,499, while 10% differences are not statistically significant. have a deductible of $3,000 or more. It is important to note that not all firms Enrollment of covered workers in The average aggregate annual deductible offering HSA-qualified HDHPs contribute HDHP/SOs remained the same as in 2008 for family coverage for HDHP/HRAs is to the HSAs established by their workers. (8%). Covered workers in small firms $3,422 and $3,734 for HSA-qualified For example, among firms offering an (3–199 workers) are more likely to be HDHPs. Similar to the other plan types, HSA-qualified HDHP, 29% do not make enrolled in an HDHP/SO than workers many HDHP/SOs cover preventive a contribution to the HSA for single or in large firms (200 or more workers) (13% services before the deductible is met: 94% family coverage (covering 31% of workers vs. 6%). Three percent of covered workers of workers in HDHP/HRAs and 90% of in these plans). If workers with no employer are enrolled in HDHP/HRAs and 6% are workers in HSA-qualified HDHPs have contribution to their HSA are excluded enrolled in HSA-qualified HDHPs. Nine preventive care covered before having to from the calculation, the average employer percent of workers in small firms (3–199 meet the deductible. HSA contributions are $1,000 and $1,640 workers) are enrolled in HSA-qualified The distinguishing aspect of these high for single and family coverage, respectively. HDHPs, compared to 4% of workers deductible plans is the savings feature Among workers with an employer in large firms (200 or more workers) available to employees. Workers enrolled contribution to their HSA, workers in small (Exhibit G). in an HDHP/HRA receive an average firms (3–199 workers) on average receive Annual deductibles for single coverage for annual contribution from their employer of higher contributions than workers in large HDHP/HRAs and HSA-qualified HDHPs $1,052 for single coverage and $2,073 for firms (200 or more workers) for both single average $1,690 and $1,922, respectively. family coverage (Exhibit H). The average coverage ($1,319 vs. $619) and family Exhibit h Average Annual premiums and Contributions to savings Accounts for Covered Workers in hDhp/hrAs, or hsA-Qualified hDhps, Compared to All Non-hDhp/so plans, 2009 All Non-hDhP/SO hDhP/hRA hSA-Qualified hDhP Plans§ single family single family single family total Annual Premium $4,274* $12,223* $3,829* $10,396* $4,902 $13,591 Worker Contribution to Premium $734 $3,067* 438* $2,453* $801 $3,595 firm Contribution to Premium $3,540* $9,157 $3,391* $7,943* $4,101 $9,996 Annual Firm Contribution to the hRA or hSA‡ $1,052 $2,073 $688 $1,126 na na total Annual Firm Contribution (firm share of $4,592* $11,230* $4,079 $9,070* $4,101 $9,996 Premium Plus firm Contribution to hra or hsa) total Annual Cost (total Premium Plus firm $5,325* $14,296 $4,517* $11,523* $4,902 $13,591 Contribution to hra or hsa, if applicable) * estimate is statistically different from estimate for all non-hdhP/so Plans (p<.05). ‡ When those firms that do not contribute to the hsa (29% for single and family coverage) are excluded from the calculation, the average firm contribution to the hsa for covered workers is $1,000 for single coverage and $1,640 for family coverage. for hdhP/hras, we refer to the amount that the employer commits to make available to an hra as a contribution for ease of discussion. hras are notional accounts, and employers are not required to actually transfer funds until an employee incurs expenses. thus, employers may not expend the entire amount that they commit to make available to their employees through an hra. therefore, the employer contribution amounts to hras that we capture in the survey may exceed the amount that employers will actually spend. § in order to compare costs for hdhP/sos to all other plans that are not hdhP/sos, we created composite variables excluding hdhP/so data. na: not applicable. note: Values shown in the table may not equal the sum of their component parts. the averages presented in the table are aggregated at the firm level and then averaged, which is methodologically more appropriate than adding the averages. this is relevant for total annual Premium, total annual firm Contribution, and total annual Cost. source: kaiser/hret survey of employer-sponsored health Benefits, 2009. 6 t h e k a i s e r fa m i ly f o u n d at i o n - a n d - h e a lt h r e s e a r C h & e d u C at i o n a l t r u s t
  • 21.
    coverage ($2,077 vs.$1,121), but they also large firms that offer retiree health benefits, risk assessment to employees than small face higher deductibles. 92% offer health benefits to early retirees firms (3–199 workers) (55% vs. 14%). and 68% offer health benefits to Medicare- Eleven percent of firms offering health risk For both single and family coverage, age retirees, similar to last year. assessments offer financial incentives for average total premiums for HSA-qualified workers to complete them. Large firms HDHPs and HDHP/HRAs are lower than WELLNESS BENEFITS (200 or more workers) are more likely than the average premiums for workers in plans small firms (3–199 workers) to offer financial that are not HDHP/SOs. The average More than half (58%) of employers offering incentives (34% vs. 7%). Among large firms worker contributions to HSA-qualified health benefits offer at least one of the offering financial incentives to employees HDHP single and family premiums and the following wellness programs: weight loss who complete a health risk assessment, HDHP/HRA family worker contribution program, gym membership discounts or 27% of firms reported that employees pay a to premiums are also lower than the on-site exercise facilities, smoking cessation smaller share of the premium, 7% reported average for non-HDHP/SO plans. When program, personal health coaching, classes employees have a smaller deductible, and the employer contribution to the HSA is in nutrition or healthy living, Web-based only 2% reported employees have a lower added to the total premium, the average resources for healthy living, or a wellness coinsurance rate. Among firms offering total cost (i.e., the total premium plus any newsletter. Fifty-seven percent of small health risk assessments, 11% report offering firm contribution to the savings option) firms (3–199 workers) and 93% of large employees merchandise, travel, gift cards, or for workers in HSA-qualified HDHPs is firms (200 or more workers) offering health cash for completing a health risk assessment; lower than the total cost for the average of benefits offer a wellness program, up from 27% of large firms (200 or more workers) all non-HDHP/SO plans for both single 88% of large firms in 2008. Firms offering offer this incentive, compared to 8% of small and family coverage. In contrast, when the health coverage and wellness benefits report firms (3–199 workers). employer contribution to the HRA is added that most wellness benefits (81%) are to the total premium for HDHP/HRAs, the provided through the health plan rather OTHER TOPICS total cost for workers in HDHP/HRAs with than by the firm directly. For the first time, the survey asked firms single coverage is more than the total cost with 1,000 or more employees about the for workers in other plans. H E A LT H R I S K A S S E S S M E N T S availability of on-site health clinics. Among Sixteen percent of firms offering health all firms, including those that do not offer RETIREE COVERAGE benefits give their employees the option coverage, 20% of firms with 1,000 or more Twenty-nine percent of large firms (200 or of completing a health risk assessment to workers reported that they have an on-site more workers) offer retiree health benefits help employees identify potential health health clinic for employees at one or more in 2009, which is not statistically different risks (Exhibit I).5 Large firms (200 or more locations. Of those firms with an on-site from the 2008 offer rate of 31%. Among workers) are more likely to offer a health health clinic, 79% reported that employees Exhibit i Among firms offering health benefits, percentage of firms That offer health risk Assessments and incentives to Complete Assessments, by firm size, 2009 100% 90% 80% 70% 60% 55% 50% 40% 34% 30% 20% 14% 16% 11% 10% 7% 0% Firm O ers Health Risk Assessment * Firm O ers Financial Incentives to Complete Health Risk Assessments * ‡ * estimate is statistically different between all small firms and all large firms within category (p<.05). All Small Firms (3–199 Workers) ‡ among firms offering employees the option to complete a health risk assessment. All Large Firms (200 or More Workers) source: kaiser/hret survey of employer-sponsored health Benefits, 2009. All Firms 7 t h e k a i s e r fa m i ly f o u n d at i o n - a n d - h e a lt h r e s e a r C h & e d u C at i o n a l t r u s t
  • 22.
    can receive treatmentfor non-work related to increase the amount workers contribute coverage, while the steady trend of increases illness at the on-site clinic. to premiums (42%), increase deductible in single premiums was broken. The amounts (36%), increase office visit cost percentage of workers with deductibles for We also asked employers whether they have sharing (39%), or increase the amount single coverage of $1,000 or more increased, reduced their benefits or increased cost sharing that employees have to pay for prescription as did the average copayments for primary due to the economic downturn. Twenty-one drugs (37%). Although firms report or specialty physician office visits. The percent of employers offering health benefits planning to increase the amount employees percentage of firms offering health insurance report that, in response to the economic have to pay when they have insurance, and the percentage of workers covered by downturn, they reduced the scope of health relatively few firms report they are very health insurance at their firm remained benefits or increased cost sharing, and 15% likely (2%) or somewhat likely (6%) steady. The survey shows that health benefits report they increased the employee share of to drop coverage. Four percent of firms remained relatively stable despite the severe the premium. More large firms (200 or more offering coverage say that they are very economic downturn. As noted above, this workers) than small firms (3–199 workers) likely to restrict eligibility for coverage next may indicate a strong commitment by report increasing the share of the premium year, and an additional 5% say that they employers to maintaining workers’ benefits, that the employee pays (22% vs. 15%). are somewhat likely to do so. Among firms but also could reflect the possibility that offering health benefits but not offering some employers made decisions about OUTLOOK FOR THE FUTURE health benefits before the implications of an HSA-qualified HDHP, 6% say that Each year we ask employers about the they are very likely and 16% say they are the worsening economy were fully apparent. changes they plan to make to their health somewhat likely to offer an HSA-qualified Further, the survey only collects information benefits in the next year. This year, given HDHP in the next year. A similar share from firms that are still in business and the extreme uncertainties about future does not estimate the number of workers of offering firms not currently offering an economic trends, it is likely that employers who lost coverage due to their company HDHP/HRA report that they are very had more difficulty making predictions downsizing or closing. Given the ongoing likely (5%) or somewhat likely (15%) to about their future health care decisions. In economic problems facing businesses, it will offer that plan type next year. general though, employers’ responses this be important to monitor health benefits year are in line with those in the last several offer rates and coverage levels as well as years. Among those that offer benefits, CONCLUSION other plan attributes. This information large percentages of firms report that in the In 2009, the survey finds premiums also will help inform the continuing health next year they are very or somewhat likely increased only moderately for family reform debate. __________________________________________________________________________________________________________________________________________________________ 1 kaiser family foundation, kaiser Commission on medicaid and the uninsured, The Uninsured: A Primer, october 2008. 2 the average worker contributions include those workers with no contribution. 3 data presented are for workers with a family aggregate deductible where spending by any covered person in the family counts toward the deductible. 4 in 2009, we changed the structure of the hospital and outpatient surgery cost-sharing questions. see the introduction to section 7 for more information, available at www.kff.org/insurance/7936/index.cfm. 5 health risk assessments generally include questions on medical history, health status, and lifestyle. 8 t h e k a i s e r fa m i ly f o u n d at i o n - a n d - h e a lt h r e s e a r C h & e d u C at i o n a l t r u s t
  • 23.
    60% $4,8 2 4 Employer Health Benefits $ 13,375 2009 annual surVey Survey Design and Methods 2009
  • 24.
    Survey Design andMethods Employer Health Benefits 2 0 0 9 A n n u a l s u r ve y Survey DeSign anD MethoDS t he K aiser family f oundation and the h ealth r esearch & e ducational trust (K aiser /hret ) conduct this annual survey of employer - sponsored health benefits . hret, a nonprofit research organization , is an affiliate of the a merican h ospital a ssociation . t he K aiser family foundation designs , analyzes , and conducts this survey in partnership with hret, and also pays for the cost of the survey. hret subcontracts with researchers at n ational o pinion r esearch center (norc) at the u niversity of c hicago, who worK with foundation and hret researchers in conducting the study. K aiser /hret retained n ational r esearch , llc (nr), a washington , d.c.- based survey research firm , to conduct telephone interviews with human resource and benefits managers using the K aiser /hret survey instrument . from J anuary to m ay 2009 nr completed full interviews with 2,054 firms . survey TopiCs ChANges To The 2009 survey As in past years, Kaiser/HRET asked each Each year we examine ways to improve the survey and participating firm as many as 400 questions about respond to changes in the health insurance market. its largest health maintenance organization (HMO), Throughout the past, many changes have been made preferred provider organization (PPO), point-of- in an attempt to ensure the survey reflects current service (POS) plan, and high-deductible health market trends, such as the introduction of questions on plan with a savings option (HDHP/SO).1 In 2006, emerging plan types. We also reexamine the questions Kaiser/HRET began asking employers if they asked and the analytic methods used to determine if had a health plan that was an exclusive provider there are ways to better and more accurately convey organization (EPO). We treat EPOs and HMOs the information obtained from respondents. In the together as one plan type and report the information fall of 2008, with guidance from experts in survey under the banner of “HMO;” if an employer sponsors methods and design from NORC, we reviewed the both an HMO and an EPO, they are asked about the methods used for the survey. As a result of this review, attributes of the plan with the larger enrollment. several important modifications were made to the 2009 survey, including the sample design and questionnaire. New topics in the 2009 survey include additional questions on financial incentives for health risk For the first time, this year we determined the sample assessments, on-site health clinics, and firm responses requirements based on the universe of firms obtained to the economic downturn. As in past years, this from the U.S. Census rather than Dun and Bradstreet. year’s survey included questions on the cost of health Prior to the 2009 survey, the sample requirements were insurance, offer rates, coverage, eligibility, enrollment based on the total counts provided by Survey Sampling patterns, premiums,2 employee cost sharing, Incorporated (SSI) (which obtains data from Dun prescription drug benefits, retiree health benefits, and and Bradstreet). Over the years, we have found the employer opinions. Dun and Bradstreet frequency counts to be volatile because of duplicate listings of firms, or firms that are note: 1 hdhP/so includes high-deductible health plans offered with either a health reimbursement arrangement (hra) or a health savings account (hsa). although hras can be offered along with a health plan that is not an hdhP, the survey collected information only on hras that are offered along with hdhPs. for specific definitions of hdhPs, hras, and hsas, see the introduction to section 8. 2 hdhP/so premium estimates do not include contributions made by the employer to health savings accounts or health reimbursement arrangements. 10 t h e k a i s e r fa m i ly f o u n d at i o n - a n d - h e a lt h r e s e a r C h & e d u C at i o n a l t r u s t
  • 25.
    Survey Design andMethods Employer Health Benefits 2 0 0 9 An n u a l s u r ve y no longer in business. These inaccuracies vary by firm three or more workers. As in the past, the post- size and industry. In 2003, we began using the more stratification is based on the most up-to-date Census consistent and accurate counts provided by the Census data available (the 2006 update to the Census of U.S. Bureau’s Statistics of U.S. Businesses and the Census Businesses was purchased during the survey field of Governments as the basis for post-stratification, period) and the 2007 Census of Governments. The although the sample was still drawn from a Dun and Census of Governments is conducted every five years, Bradstreet list. In order to further address this concern and this is the first year the data from the 2007 Census at the time of sampling, we now also use Census data of Governments have been available for use. as the basis for the sample. This change resulted in Each year, the survey asks firms for the percentage of shifts in the sample of firms required in some size and their employees that earn less than a specified amount. industry categories. This year, the income threshold increased from $22,000 This year, we also defined Education as a separate to $23,000 per year. This threshold is based on the sampling category, rather than as a subgroup of the 25th percentile of workers’ earnings as reported by the Service category. In the past, Education firms were Bureau of Labor Statistics using data from the National a disproportionately large share of Service firms. Compensation Survey (2007), the most current data Education is controlled for during post-stratification, available at the time of the survey design. The threshold and adjusting the sampling frame to also control for was then adjusted to account for the change in workers’ Education allows for a more accurate representation of earnings from 2007 to 2008, using the Bureau of Labor both Education and Service industries. Statistics’ Employment Cost Index. In past years, both private and government firms were Based on recommendations from cognitive researchers sampled from the Dun and Bradstreet database. For at NORC and internal analysis of the survey instrument, the 2009 sample, Government firms were sampled a number of questions were revised to improve the in-house from the 2007 Census of Governments. This clarity and flow of the survey in order to minimize change was made to eliminate the overlap of state survey burden. For example, in order to better capture agencies that were frequently sampled from the Dun the prevalence of combinations of inpatient and and Bradstreet database. Each year the survey attempts outpatient surgery cost sharing, the survey was changed to repeat interviews with respondents from past years to ask a series of yes or no questions. Previously, the (see “Response Rate” section below), and in order to question asked respondents to select one response from a maintain government firms that had completed the list of types of cost sharing, such as separate deductibles, survey in the past (firms that have completed the survey copayments, coinsurance, and per diem payments in the past are known as panel firms), government firms (for hospitalization only). We have also expanded the from the 2008 survey were matched to the Census of number of questions for which respondents can provide Governments to identify phone numbers. All panel either the number of workers or the percentage of government firms were included in the sample (resulting workers. Previously, after obtaining the total number of in an oversample). In addition, the sample of private employees, the majority of questions asked about the firms is screened for firms that are related to state/ percentage of workers with certain characteristics. Now, local governments, and if these firms are identified in for questions such as the percentage of workers making the Census of Governments, they are reclassified as $23,000 a year or less or the enrollment of workers in government firms and a private firm is randomly drawn each plan type, respondents are able to respond with to replace the reclassified firm. These changes to the either the number or the percentage of workers. Few sample frame resulted in an expected slight reduction of these changes have had any noticeable impact on in the overall response rate, since there were shifts in the responses. number of firms needed by size and industry. Minor weighting adjustments were also made and are Therefore, the data used to determine the 2009 discussed later in this chapter. Employer Health Benefits sample frame include r e s p o N s e r AT e the U.S. Census’ 2005 Statistics of U.S. Businesses and the 2007 Census of Governments. At the time After determining the required sample from U.S. of the sample design (December 2008), these data Census Bureau data, Kaiser/HRET drew its sample represented the most current information on the from a Survey Sampling Incorporated list (based on an number of public and private firms nationwide with original Dun and Bradstreet list) of the nation’s private 11 t h e k a i s e r fa m i ly f o u n d at i o n - a n d - h e a lt h r e s e a r C h & e d u C at i o n a l t r u s t
  • 26.
    Survey Design andMethods Employer Health Benefits 2 0 0 9 A n n u a l s u r ve y employers, and for the first time, the Census Bureau’s Exhibit M.2 displays the distribution of the nation’s Census of Governments list of public employers firms, workers, and covered workers (employees with three or more workers. To increase precision, receiving coverage from their employer). Among the Kaiser/HRET stratified the sample by industry and over three million firms nationally, approximately the number of workers in the firm. Kaiser/HRET 59.5% are firms employing 3 to 9 workers; such firms attempted to repeat interviews with prior years’ survey employ 8.3% of workers and 4.8% of workers covered respondents (with at least ten employees) who also by health insurance. In contrast, less than one percent participated in either the 2007 or the 2008 survey, or of firms are firms employing 1,000 or more workers; both. As a result, 1,491 firms in this year’s total sample these firms employ 46.8% of workers and 52.1% of 2,054 firms participated in either the 2007, 2008, or of covered workers. Therefore, the smallest firms both surveys.3 The overall response rate is 47%. dominate any national statistics about what employers in general are doing. In contrast, firms with 1,000 or The vast majority of questions are asked only of firms more workers are the most important employer group that offer health benefits. A total of 1,874 responding in calculating statistics regarding covered workers, firms indicated that they offered health benefits. The since they employ the largest percentage of the nation’s overall response rate of firms that offer health benefits workforce. is 48%. Throughout this report, we use the term “in-network” From previous years’ experience, we have learned that to refer to services received from a preferred provider. firms that decline to participate in the study are less Family coverage is defined as health coverage for a likely to offer health benefits. Therefore, we asked one family of four. question of all firms in the study with which we made phone contact where the firm declined to participate. r o u N D i N g A N D i m p u TAT i o N The question was, “Does your company offer a Some exhibits in the report do not sum to totals health insurance program as a benefit to any of your due to rounding effects. In a few cases, numbers employees?” A total of 3,188 firms responded to this from distribution exhibits may not add to equal question (including 2,054 who responded to the full numbers referenced in the text due to rounding survey and 1,134 who responded to this one question). effects. Although overall totals and totals for size and Their responses are included in our estimates of the industry are statistically valid, some breakdowns may percentage of firms offering health benefits.4 The not be available due to limited sample sizes. Where response rate for this question is 73%. the unweighted sample size is fewer than 30, exhibits f i r m s i z e C AT e g o r i e s A N D k e y D e f i N i T i o N s include the notation “NSD” (Not Sufficient Data). Throughout the report, exhibits categorize data by size To control for item nonresponse bias, Kaiser/HRET of firm, region, and industry. Firm size definitions are imputes values that are missing for most variables in as follows: All Small, 3 to 199 workers; and All Large, the survey. In general, less than 5% of observations 200 or more workers. Occasionally, firm size categories are imputed for any given variable. All variables will be broken into smaller groups. The All Small are imputed following a hotdeck approach. This group may be categorized by: 3 to 24 workers, and 25 imputation method does not rely on a normal to 199 workers; or 3 to 9 workers, 10 to 24 workers, 25 distribution assumption and replaces missing values with to 49 workers, and 50 to 199 workers. The All Large observed values from a firm with similar characteristics, group may be categorized by: 200 to 999 workers, in this case, size and industry. In 2009, there were three 1,000 to 4,999 workers, and 5,000 or more workers. variables where the imputation rate exceeded 20% but Exhibit M.1 shows selected characteristics of the survey was less than 30%. For these cases, the unimputed sample. Exhibit M.3 identifies which states are in each variable was compared with the imputed variable and region. there is no statistically significant difference. There are note: 3 in total, 185 firms participated in 2007 and 2009, 367 firms participated in 2008 and 2009, and 939 firms participated in 2007, 2008, and 2009. 4 estimates presented in exhibits 2.1, 2.2 and 2.3 are based on the sample of both firms that completed the entire survey and those that answered just one question about whether they offer health benefits. 12 t h e k a i s e r fa m i ly f o u n d at i o n - a n d - h e a lt h r e s e a r C h & e d u C at i o n a l t r u s t
  • 27.
    Survey Design andMethods Employer Health Benefits 2 0 0 9 An n u a l s u r ve y a few variables that Kaiser/HRET has decided should This year we created a new weight to correct for a very not be imputed; these are typically variables where slight bias in our estimates of the take up rate. This “don’t know” is considered a valid response option (for new weight reflects all workers in the firm who are example, firms’ opinions about effectiveness of various eligible for health benefits. In the past, our estimates strategies to control health insurance costs). were a function of all workers in the firm, whether they W e i g h T i N g A N D s TAT i s T i C A l s i g N i f i C A N C e were eligible for health benefits (and could thus take up) or not. Historical take-up estimates have likewise Because Kaiser/HRET selects firms randomly, it been updated to reflect only those workers eligible for is possible through the use of statistical weights to extrapolate the results to national (as well as firm size, health benefits. regional, and industry) averages. These weights allow We continue to ask firms whether or not they offer Kaiser/HRET to present findings based on the number a conventional health plan and, if so, how many of workers covered by health plans, the number of of their covered workers are enrolled in that plan total workers, and the number of firms. In general, and whether it is self-funded or underwritten by an findings in dollar amounts (such as premiums, worker insurer. However, due to the declining market share contributions, and cost sharing) are weighted by covered workers. Other estimates, such as the offer of conventional health plans, in 2006, we stopped rate, are weighted by firms. Specific weights were asking respondents additional questions about the created to analyze the HDHP/SO plans that are offered attributes of the conventional plans they offer. As of with an HRA or that are HSA-qualified. These weights 2009 our primary covered worker weight no longer represent the proportion of employees enrolled in each includes those workers with conventional coverage.5 of these arrangements. Therefore, premium and cost-sharing levels are Calculation of the weights follows a common estimated among workers covered by an HMO, PPO, approach. First, the basic weight is determined, POS plan, or HDHP/SO. Removing workers covered followed by a nonresponse adjustment. As part of this by conventional health insurance from the covered nonresponse adjustment, Kaiser/HRET conducted worker weight has little impact on the estimates a small follow-up survey of those firms with 3 to 49 reported for “All Plans,” such as the average single or workers that refused to participate in the full survey. family premium. In cases where a firm offers only We applied an additional nonresponse adjustment to conventional health plans, no information from that the weight to reflect the findings of this survey. respondent is included in “All Plan” averages. The Next, we trimmed the weights in order to reduce exception is for whether or not the plan is self-funded, the influence of weight outliers. First, we identified for which we have information. For enrollment common groups of observations. Within each group, statistics, we weight the statistics by all covered we identified the median and the interquartile range of workers, including those in conventional insurance. the weights and calculated the trimming cut point as the median plus six times the interquartile range The survey contains a few questions on employee cost (M + [6 * IQR]). Weight values larger than this cut sharing that are asked only of firms that indicate in a point are trimmed to the cut point. In all instances, less previous question that they have a certain cost-sharing than one percent of the weight values were trimmed. provision. For example, the copayment amount for prescription drugs is asked only of those that report Finally, we applied a post-stratification adjustment. they have copayments for prescription drugs. Because We used the U.S. Census Bureau’s 2006 Statistics of U.S. Businesses as the basis for the stratification the composite variables (using data from across all and the post-stratification adjustment for firms in plan types) are reflective of only those plans with the the private sector, and we used the 2007 Census of provision, separate weights for the relevant variables Governments as the basis for post-stratification for were created in order to account for the fact that not all public sector firms. covered workers have such provisions. note: 5 in 2009, 1% of covered workers are enrolled in a conventional plan. 13 t h e k a i s e r fa m i ly f o u n d at i o n - a n d - h e a lt h r e s e a r C h & e d u C at i o n a l t r u s t
  • 28.
    Survey Design andMethods Employer Health Benefits 2 0 0 9 A n n u a l s u r ve y The data are analyzed with SUDAAN,6 which h i s T o r i C A l D ATA computes appropriate standard error estimates by Data in this report focus primarily on findings controlling for the complex design of the survey.7 All from surveys jointly authored by the Kaiser Family statistical tests are performed at the .05 level, unless Foundation and the Health Research & Educational otherwise noted. For figures with multiple years, Trust, which have been conducted since 1999. statistical tests are conducted for each year against Prior to 1999, the survey was conducted by the the previous year shown, unless otherwise noted. No Health Insurance Association of America (HIAA) statistical tests are conducted for years prior to 1999. and KPMG using a similar survey instrument, but Statistical tests for a given subgroup (firms with 25–49 data are not available for all the intervening years. workers, for instance) are tested against all other firm Following the survey’s introduction in 1987, the sizes not included in that subgroup (all firm sizes NOT HIAA conducted the survey through 1990, but including firms with 25–49 workers, in this example). some data are not available for analysis. KPMG Tests are done similarly for region and industry; for conducted the survey from 1991–1998. However, example, Northeast is compared to all firms NOT in in 1991, 1992, 1994, and 1997, only larger firms the Northeast (an aggregate of firms in the Midwest, were sampled. In 1993, 1995, 1996, and 1998, South, and West). However, statistical tests for estimates KPMG interviewed both large and small firms. In compared across plan types (for example, average 1998, KPMG divested itself of its Compensation and premiums in PPOs) are tested against the “All Plans” Benefits Practice, and part of that divestiture included estimate. In some cases, we also test plan-specific donating the annual survey of health benefits to estimates against similar estimates for other plan types HRET. (for example, single and family premiums for HDHP/ This report uses historical data from the 1993, 1996, SOs against single and family premiums for HMO, and 1998 KPMG Surveys of Employer-Sponsored PPO, and POS plans); these are noted specifically in the Health Benefits and the 1999–2008 Kaiser/HRET text. The two types of statistical tests performed are the Survey of Employer-Sponsored Health Benefits. t-test and the Pearson Chi-square test. For a longer-term perspective, we also use the 1988 The small number of observations for some variables, survey of the nation’s employers conducted by the particularly variables specific to plans with Health HIAA, on which the KPMG and Kaiser/HRET Savings Accounts or Health Reimbursement surveys are based. The survey designs for the three Arrangements, resulted in large variability around the surveys are similar. point estimates. These observations sometimes carry large weights, primarily for small firms. The reader should be cautioned that these influential weights may result in large movements in point estimates from year to year; however, often these movements are not statistically significant. note: 6 research triangle institute (2008). sudaan software for the statistical analysis of Correlated data, release 10.0, research triangle Park, nC: research triangle institute. 7 a supplement with standard errors for select estimates can be found online at www.kff.org/insurance/7936/index.cfm. 14 t h e k a i s e r fa m i ly f o u n d at i o n - a n d - h e a lt h r e s e a r C h & e d u C at i o n a l t r u s t
  • 29.
    Survey Design andMethods Employer Health Benefits 2 0 0 9 An n u a l s u r ve y e x h i B i t m .1 s elec ted Charac teristics of firms in the sur vey sample, 2009 sample distribution Percentage of total sample size after Weighting for Weighted sample firm size 3–9 Workers 117 2,028,692 59.5% 10–24 Workers 220 797,632 23.4 25–49 Workers 182 283,338 8.3 50–199 Workers 287 213,310 6.3 200–999 Workers 467 60,973 1.8 1,000–4,999 Workers 481 17,125 0.5 5,000 or more Workers 300 8,175 0.2 All firm sizes 2,054 3,409,245 100% regioN northeast 410 667,059 19.6% midwest 607 787,094 23.1 south 688 1,162,742 34.1 West 349 792,350 23.2 All regioNs 2,054 3,409,245 100% iNDusTry agriculture/mining/Construction 118 424,586 12.5% manufacturing 230 210,368 6.2 transportation/Communications/utilities 114 128,897 3.8 Wholesale 99 195,346 5.7 retail 157 432,820 12.7 finance 136 238,426 7.0 service 842 1,453,808 42.6 state/local Government 151 50,587 1.5 health Care 207 274,408 8.0 All iNDusTries 2,054 3,409,245 100% source: kaiser/hret survey of employer-sponsored health Benefits, 2009. 15 t h e k a i s e r fa m i ly f o u n d at i o n - a n d - h e a lt h r e s e a r C h & e d u C at i o n a l t r u s t
  • 30.
    Survey Design andMethods Employer Health Benefits 2 0 0 9 A n n u a l s u r ve y exhiBit m.2 distr ibution of employers, Workers, and Wor kers Covered by health B enefits, by fir m size, 2009 100% 0.2% 0.5% 1.8% 6.3% 90% 8.3% 80% 34.2% 37.7% 23.4% 70% 60% 12.6% 14.4% 50% 13.5% 40% 14.5% 14.2% 30% 59.5% 14.4% 20% 7.6% 7.1% 9.5% 10% 7.1% 8.3% 4.8% 0% EMPLOYERS WORKERS COVERED WORKERS source: 5,000 OR MORE WORKERS kaiser/hret survey of employer-sponsored health Benefits, 2009. 1,000 4,999 WORKERS note: data are based on a special data request to the u.s. Census Bureau for their most recent 200 999 WORKERS (2006) statistics of u.s. Businesses data on private sector firms. state and local government data 50 199 WORKERS are from the Census Bureau’s 2007 Census of Governments. 25 49 WORKERS 10 24 WORKERS 3 9 WORKERS 16 t h e k a i s e r fa m i ly f o u n d at i o n - a n d - h e a lt h r e s e a r C h & e d u C at i o n a l t r u s t
  • 31.
    Survey Design andMethods Employer Health Benefits 2 0 0 9 An n u a l s u r ve y e x h i B i t m .3 states by r egion, 2009 Northeast midwest south West Connecticut illinois alabama alaska maine indiana arkansas arizona massachusetts iowa delaware California new hampshire kansas district of Columbia Colorado new Jersey michigan florida hawaii new york minnesota Georgia idaho Pennsylvania missouri kentucky montana rhode island nebraska louisiana nevada Vermont north dakota maryland new mexico ohio mississippi oregon south dakota north Carolina utah Wisconsin oklahoma Washington south Carolina Wyoming tennessee texas Virginia West Virginia source: u.s. department of Commerce, economics and statistics administration, u.s. Census Bureau, available at http://www.census.gov/geo/www/us_regdiv.pdf. 17 t h e k a i s e r fa m i ly f o u n d at i o n - a n d - h e a lt h r e s e a r C h & e d u C at i o n a l t r u s t
  • 33.
    60% $4,8 2 4 Employer Health Benefits $ 13,375 2009 annual surVey Cost of Health Insurance section 1 2009
  • 34.
    section one Employer Health Benefits 2 0 0 9 A n n u a l s u r ve y 1 C o S t o f h e a lt h i n S u r a n C e Cost of Health Insurance T he average annual premium for single coverage in 2009 is $4,824 and The average annual premium for family coverage is $13,375. T he average family premium in 2009 is abouT 5% higher Than in 2008. T he average premium for single coverage is noT significanTly differenT from lasT year ($4,704). s maller firms (3–199 workers ) have a lower average family premium ($12,696) Than larger firms (200 or more workers ) ($13,704). premium CosTs for siNgle workers in firms with union employees compared A N D fA m i ly C o v e r A g e to firms without any union employees.  The average cost of premiums for single coverage in  Covered workers in firms where 35% or more 2009 is $402 per month or $4,824 per year (Exhibit of workers are age 26 or younger have lower 1.1). The average cost of premiums for family average single and family premiums than covered coverage is $1,115 per month or $13,375 per year workers in firms with a lower percentage of (Exhibit 1.1). workers age 26 or younger (Exhibits 1.5 and 1.6).  The average premiums for covered workers in  Average family premiums are higher for covered HDHP/SOs are lower for single and family workers in partially or fully self-funded plans coverage than the overall average premiums for than in fully insured plans ($13,588 vs. $13,092). covered workers (Exhibit 1.1). This difference, however, largely reflects premium  The average premium for family coverage for differences between large and small firms more covered workers in small firms (3–199 workers) is generally. Among large firms (200 or more lower than the average premium for workers in large workers), where most firms self-fund their firms (200 or more workers) (Exhibit 1.2). The health benefits, there is no significant difference average single premiums are similar for covered in family premiums for workers in firms that workers in small and large firms. are self-funded and workers in firms that have insured benefits (Exhibit 1.6).  Average single and family premiums for covered  There is a great deal of variation above and below workers in the Northeast are higher than the average premiums for covered workers in other regions the average premiums for both single and family (Exhibit 1.3). coverage.  Premiums also vary by plan funding and workforce  Eighteen percent of covered workers are attributes. employed by firms that have a single premium that is at least 20% higher than the average  Covered workers in firms where less than 35% of single premium of $4,824, while 23% of covered workers earn $23,000 or less annually have higher workers are in firms that have a single premium average single premiums than covered workers in that is less than 80% of than the average single firms with a higher percentage of workers earning premium (Exhibit 1.7 and 1.8). $23,000 or less annually (Exhibit 1.5).  For family coverage, 20% of covered workers are  Average single and family premiums are higher employed in a firm that has a family premium for covered workers in firms with at least some that is at least 20% higher than the average union workers than for covered workers in firms family premium of $13,375, while 21% of with no union employees (Exhibit 1.5 and 1.6). covered workers are in firms that have a family However, when broken out by firm size, there is premium that is less than 80% of the average no longer a significant difference in premiums for family premium (Exhibit 1.7 and 1.8). 20 t h e k a i s e r fa m i ly f o u n d at i o n - a n d - h e a lt h r e s e a r C h e d u C at i o n a l t r u s t
  • 35.
    section one Employer Health Benefits 2 0 0 9 An n u a l s u r ve y 1 Cost of Health Insurance  The survey asks employers to provide information  For the second year in a row, the average annual about their largest plan of each plan type (i.e., family premium for covered workers in small firms HMO, PPO, POS, HDHP/SO) that they offer. (3–199 workers) is significantly lower than the We ask employers to tell us whether the plans that average annual family premium for covered workers they were reporting on were also offered last year. in large firms (200 or more workers). The average For firms that report that they offered the same plan family premiums for covered workers in small and last year, we are not able to say whether that plan large firms have been similar in most other earlier was their largest plan of that plan type last year. We years (Exhibit 1.13). also do not ask whether they modified the benefits  The average family premiums for covered workers within the plan between last year and this year. in small and large firms have grown at similar  Workers in firms offering a PPO plan that the rates between 2004 and 2009 (30% in small firm did not offer last year had lower premiums firms vs. 36% in large firms) and between 1999 on average for single and family coverage than and 2009 (123% in small firms vs. 134% in large workers in firms that report offering the same firms) (Exhibit 1.14). PPO plan last year. Premiums for HMO show a  For large firms (200 or more workers), the similar pattern for single coverage (Exhibit 1.11). average family premium for covered workers in premium ChANges over Time firms that fully or partially self-fund has grown at similar rates from 2004 to 2009 (37% in self-  The average family premium in 2009 ($13,375) is funded firms vs. 36% in fully insured firms) about 5% higher than the average family premium and between 1999 and 2009 (132% in self- we reported last year ($12,680).1 The difference funded firms vs. 140% in fully insured firms) in reported average single premiums for 2008 (Exhibit 1.15). and 2009 ($4,704 and $4,824) is not statistically significant.  The $13,375 average annual family premium in 2009 is 34% higher than the average family premium in 2004 and 131% higher than the average family premium in 1999 (Exhibit 1.12). noTe: 1 the difference between the 2008 and 2009 premium value for family coverage is statistically significant (p.05). 21 t h e k a i s e r fa m i ly f o u n d at i o n - a n d - h e a lt h r e s e a r C h e d u C at i o n a l t r u s t
  • 36.
    section one Employer Health Benefits 2 0 0 9 A n n u a l s u r ve y e x h i B i t 1. 1 average m onthly and annual Premiums for Covered Wor kers, single and family Coverage, by Plan 1 type, 2009 Cost of Health Insurance monthly annual hmo single Coverage $406 $4,878 family Coverage $1,123 $13,470 ppo single Coverage $410 $4,922 family Coverage $1,143 $13,719 pos single Coverage $403 $4,835 family Coverage $1,090 $13,075 hDhp/so single Coverage $332* $3,986* family Coverage $924* $11,083* All plANs single Coverage $402 $4,824 family Coverage $1,115 $13,375 source: kaiser/hret survey of employer-sponsored health Benefits, 2009. * estimate is statistically different from all Plans estimate (p.05). 22 t h e k a i s e r fa m i ly f o u n d at i o n - a n d - h e a lt h r e s e a r C h e d u C at i o n a l t r u s t
  • 37.
    section one Employer Health Benefits 2 0 0 9 An n u a l s u r ve y e x h i B i t 1.2 average m onthly and annual Premiums for Covered Wor kers, by Plan type and fir m size, 2009 1 Cost of Health Insurance monthly annual single Coverage family Coverage single Coverage family Coverage hmo all small firms (3–199 Workers) $378 $1,021* $4,542 $12,256* all large firms (200 or more Workers) 417 1,158* 5,003 13,893* All firm sizes $406 $1,123 $4,878 $13,470 ppo all small firms (3–199 Workers) $412 $1,116 $4,948 $13,392 all large firms (200 or more Workers) 409 1,154 4,913 13,844 All firm sizes $410 $1,143 $4,922 $13,719 pos all small firms (3–199 Workers) $402 $1,071 $4,824 $12,847 all large firms (200 or more Workers) 404 1,120 4,853 13,439 All firm sizes $403 $1,090 $4,835 $13,075 hDhp/so all small firms (3–199 Workers) $323 $855* $3,877 $10,259* all large firms (200 or more Workers) 341 990* 4,094 11,885* All firm sizes $332 $924 $3,986 $11,083 All plANs all small firms (3–199 Workers) $393 $1,058* $4,717 $12,696* all large firms (200 or more Workers) 406 1,142* 4,876 13,704* All firm sizes $402 $1,115 $4,824 $13,375 source: kaiser/hret survey of employer-sponsored health Benefits, 2009. * estimates are statistically different within plan type between all small firms and all large firms (p.05). 23 t h e k a i s e r fa m i ly f o u n d at i o n - a n d - h e a lt h r e s e a r C h e d u C at i o n a l t r u s t
  • 38.
    section one Employer Health Benefits 2 0 0 9 A n n u a l s u r ve y e x h i B i t 1. 3 average m onthly and annual Premiums for Covered Wor kers, by Plan type and r egion, 2009 1 Cost of Health Insurance monthly annual single Coverage family Coverage single Coverage family Coverage hmo northeast $422 $1,166 $5,070 $13,987 midwest 417 1,174 5,008 14,086 south 401 1,125 4,816 13,502 West 396 1,070 4,758 12,843 All regioNs $406 $1,123 $4,878 $13,470 ppo northeast $421 $1,202* $5,057 $14,420* midwest 420 1,172 5,039 14,062 south 395* 1,109* 4,738* 13,311* West 419 1,116 5,028 13,392 All regioNs $410 $1,143 $4,922 $13,719 pos northeast $414 $1,173 $4,963 $14,075 midwest 385 1,040 4,625 12,480 south 417 1,077 5,009 12,927 West 384 1,077 4,614 12,925 All regioNs $403 $1,090 $4,835 $13,075 hDhp/so northeast $328 $909 $3,941 $10,905 midwest 321 915 3,851 10,980 south 347 976 4,161 11,718 West 333 872 3,996 10,467 All regioNs $332 $924 $3,986 $11,083 All plANs northeast $416* $1,174* $4,989* $14,084* midwest 403 1,125 4,834 13,498 south 395 1,099 4,740 13,193 West 401 1,076 4,808 12,915 All regioNs $402 $1,115 $4,824 $13,375 source: kaiser/hret survey of employer-sponsored health Benefits, 2009. * estimate is statistically different within plan type from estimate for all firms not in the indicated region (p.05). 24 t h e k a i s e r fa m i ly f o u n d at i o n - a n d - h e a lt h r e s e a r C h e d u C at i o n a l t r u s t
  • 39.
    section one Employer Health Benefits 2 0 0 9 An n u a l s u r ve y e x h i B i t 1.4 average m onthly and annual Premiums for Covered Wor kers, by Plan type and i ndustr y, 2009 1 Cost of Health Insurance monthly annual single Coverage family Coverage single Coverage family Coverage hmo agriculture/mining/Construction nsd nsd nsd nsd manufacturing $359* $1,026* $4,311* $12,310* transportation/Communications/ 427 1,132 5,129 13,582 utilities Wholesale nsd nsd nsd nsd retail 359* 1,025 4,310* 12,302 finance 373* 1,103 4,472* 13,242 service 425 1,156 5,105 13,873 state/local Government 447* 1,157 5,365* 13,880 health Care 440* 1,219 5,275* 14,623 All iNDusTries $406 $1,123 $4,878 $13,470 ppo agriculture/mining/Construction $376 $1,059* $4,510 $12,706* manufacturing 367* 1,066* 4,406* 12,792* transportation/Communications/ 385 1,091 4,617 13,096 utilities Wholesale 391 1,127 4,687 13,521 retail 380* 1,069* 4,557* 12,825* finance 422 1,181 5,064 14,166 service 422 1,173 5,064 14,070 state/local Government 456* 1,158 5,469* 13,891 health Care 477* 1,297* 5,720* 15,563* All iNDusTries $410 $1,143 $4,922 $13,719 pos agriculture/mining/Construction nsd nsd nsd nsd manufacturing $404 $1,062 $4,853 $12,740 transportation/Communications/ nsd nsd nsd nsd utilities Wholesale nsd nsd nsd nsd retail nsd nsd nsd nsd finance nsd nsd nsd nsd service 427 1,098 5,120 13,179 state/local Government nsd nsd nsd nsd health Care 423 1,127 5,081 13,523 All iNDusTries $403 $1,090 $4,835 $13,075 Continued on next page 25 t h e k a i s e r fa m i ly f o u n d at i o n - a n d - h e a lt h r e s e a r C h e d u C at i o n a l t r u s t
  • 40.
    section one Employer Health Benefits 2 0 0 9 A n n u a l s u r ve y e x h i B i t 1. 4 Continued from previous page average m onthly and annual Premiums for Covered Wor kers, by Plan type and i ndustr y, 2009 1 Cost of Health Insurance monthly annual single Coverage family Coverage single Coverage family Coverage hDhp/so agriculture/mining/Construction nsd nsd nsd nsd manufacturing $292* $836* $3,505* $10,037* transportation/Communications/ nsd nsd nsd nsd utilities Wholesale nsd nsd nsd nsd retail nsd nsd nsd nsd finance 321 921 3,851 11,051 service 351* 1,005* 4,213* 12,060* state/local Government nsd nsd nsd nsd health Care 374* 990 4,484* 11,880 All iNDusTries $332 $924 $3,986 $11,083 All plANs agriculture/mining/Construction $356* $1,035* $4,266* $12,417* manufacturing 361* 1,037* 4,336* 12,441* transportation/Communications/ 395 1,102 4,740 13,228 utilities Wholesale 375* 1,080 4,505* 12,956 retail 366* 1,020* 4,393* 12,238* finance 401 1,134 4,811 13,605 service 417* 1,146* 5,005* 13,753* state/local Government 448* 1,144 5,378* 13,732 health Care 455* 1,240* 5,464* 14,880* All iNDusTries $402 $1,115 $4,824 $13,375 source: kaiser/hret survey of employer-sponsored health Benefits, 2009. * estimate is statistically different within plan type from estimate for all firms not in the indicated industry (p.05). nsd: not sufficient data. 26 t h e k a i s e r fa m i ly f o u n d at i o n - a n d - h e a lt h r e s e a r C h e d u C at i o n a l t r u s t
  • 41.
    section one Employer Health Benefits 2 0 0 9 An n u a l s u r ve y e x h i B i t 1.5 average annual Premiums for Covered Wor kers with single Coverage, by fir m Charac ter istics, 2009 1 Cost of Health Insurance all large firms all small firms (200 or more all firms (3–199 Workers) Workers) Wage level few Workers are lower-Wage (less than 35% earn $4,799* $4,880 $4,853* $23,000 a year or less) many Workers are lower-Wage (35% or more earn $4,264* $4,851 $4,639* $23,000 a year or less) unions firm has at least some union Workers $5,076 $4,959 $4,969* firm does not have any union Workers $4,685 $4,802 $4,748* Age less than 35% of Workers are 26 years old or less $4,776* $4,907* $4,864* 35% or more Workers are 26 years old or less $4,034* $4,500* $4,342* funding Arrangement fully insured $4,690 $4,992 $4,796 self-funded $4,869 $4,842 $4,845 source: kaiser/hret survey of employer-sponsored health Benefits, 2009. * estimates are statistically different from each other within firm size category (p.05). 27 t h e k a i s e r fa m i ly f o u n d at i o n - a n d - h e a lt h r e s e a r C h e d u C at i o n a l t r u s t
  • 42.
    section one Employer Health Benefits 2 0 0 9 A n n u a l s u r ve y e x h i B i t 1. 6 average annual Premiums for Covered Workers with family Coverage, by firm Characteristics, 2009 1 Cost of Health Insurance all large firms all small firms (200 or more all firms (3–199 Workers) Workers) Wage level few Workers are lower-Wage (less than 35% earn $12,802 $13,734 $13,434 $23,000 a year or less) many Workers are lower-Wage (35% or more earn $12,097 $13,509 $13,011 $23,000 a year or less) unions firm has at least some union Workers $13,434 $13,915 $13,878* firm does not have any union Workers $12,630 $13,514 $13,110* Age less than 35% of Workers are 26 years old or less $12,879* $13,754 $13,470* 35% or more Workers are 26 years old or less $10,620* $13,089 $12,248* funding Arrangement fully insured $12,661 $13,870 $13,092* self-funded $12,888 $13,655 $13,588* source: kaiser/hret survey of employer-sponsored health Benefits, 2009. * estimates are statistically different from each other within firm size category (p.05). 28 t h e k a i s e r fa m i ly f o u n d at i o n - a n d - h e a lt h r e s e a r C h e d u C at i o n a l t r u s t
  • 43.
    section one Employer Health Benefits 2 0 0 9 An n u a l s u r ve y e x h i B i t 1.7 distr ibution of annual Premiums for single and family Coverage r elative to the average annual single or family Premium, 2009 1 Cost of Health Insurance Single Coverage 23% 15% 19% 13% 13% 18% $3,859 $4,824 =$5,788 Family Coverage 21% 16% 14% 17% 12% 20% $10,700 $13,375 =$16,050 LESS THAN 80% OF AVERAGE AVERAGE TO 110% OF AVERAGE 80% TO LESS THAN 90% OF AVERAGE GREATER THAN 110% OF AVERAGE TO 120% OF AVERAGE 90% TO LESS THAN AVERAGE GREATER THAN 120% OF AVERAGE source: kaiser/hret survey of employer-sponsored health Benefits, 2009. e x h i B i t 1.8 distr ibution of Premiums for single and family Coverage r elative to the average annual single or family Premium, 2009 single Coverage family Coverage Premium range, Percent Covered Premium range, Percent Covered dollar amount Workers in range dollar amount Workers in range less than $3,859 23% less than $10,700 21% $3,859 to $4,341 15% $10,700 to $12,038 16% $4,341 to $4,824 19% $12,038 to $13,375 14% $4,824 to $5,306 13% $13,375 to $14,713 17% $5,306 to $5,788 13% $14,713 to $16,050 12% $5,788 or more 18% $16,050 or more 20% source: kaiser/hret survey of employer-sponsored health Benefits, 2009. note: the average premium is $4,824 for single coverage and $13,375 for family coverage. the premium distribution is relative to the average single or family premium. for example, $3,859 is 80% of the average single premium, $4,341 is 90% of the average single premium, $5,306 is 110% of the average single premium, and $5,788 is 120% of the average single premium. the same break points relative to the average are used for the distribution for family coverage. 29 t h e k a i s e r fa m i ly f o u n d at i o n - a n d - h e a lt h r e s e a r C h e d u C at i o n a l t r u s t
  • 44.
    section one Employer Health Benefits 2 0 0 9 A n n u a l s u r ve y e x h i B i t 1. 9 distr ibution of annual Premiums for Covered Wor kers with single Coverage, 2009 1 Cost of Health Insurance Percent of Covered Workers: 50% Average: $4,824 40% 34% 30% 24% 22% 20% 10% 10% 5% 3% 2% 1% 1% 0% LESS THAN $1,000 $2,000 $3,000 $4,000 $5,000 $6,000 $7,000 $8,000 $1,000 $1,999 $2,999 $3,999 $4,999 $5,999 $6,999 $7,999 OR MORE source: kaiser/hret survey of employer-sponsored health Benefits, 2009. e x h i B i t 1. 10 distr ibution of annual Premiums for Covered Wor kers with family Coverage, 2009 Percent of Covered Workers: 50% Average: $13,375 40% 30% 22% 22% 21% 20% 12% 10% 10% 4% 5% 4% 1% 0% LESS THAN $6,000 $8,000 $10,000 $12,000 $14,000 $16,000 $18,000 $20,000 $6,000 $7,999 $9,999 $11,999 $13,999 $15,999 $17,999 $19,999 OR MORE source: kaiser/hret survey of employer-sponsored health Benefits, 2009. 30 t h e k a i s e r fa m i ly f o u n d at i o n - a n d - h e a lt h r e s e a r C h e d u C at i o n a l t r u s t
  • 45.
    section one Employer Health Benefits 2 0 0 9 An n u a l s u r ve y e x h i B i t 1.1 1 average annual Premiums for single and family Coverage, by Whether or not fir m o ffered the same Plan last year and by firm size, 2009 1 Cost of Health Insurance offered did not offer same Plan last year same Plan last year hmo single Coverage all small firms (3–199 Workers) $4,615 nsd all large firms (200 or more Workers) 5,021 $4,573 All firm sizes, single* $4,929 $4,393 family Coverage all small firms (3–199 Workers) $12,054 nsd all large firms (200 or more Workers) 13,926 $13,092 All firm sizes, family $13,531 $12,907 ppo single Coverage all small firms (3–199 Workers)* $5,126 $3,921 all large firms (200 or more Workers) 4,901 5,227 All firm sizes, single* $4,958 $4,424 family Coverage all small firms (3–199 Workers)* $13,764 $11,258 all large firms (200 or more Workers) 13,804 14,919 All firm sizes, family* $13,794 $12,671 pos single Coverage all small firms (3–199 Workers) $4,912 nsd all large firms (200 or more Workers) 4,862 nsd All firm sizes, single $4,891 NsD family Coverage all small firms (3–199 Workers) $13,188 nsd all large firms (200 or more Workers) 13,389 nsd All firm sizes, family $13,270 NsD hDhp/so single Coverage all small firms (3–199 Workers) $3,727 $4,223 all large firms (200 or more Workers) 4,089 4,122 All firm sizes, single $3,928 $4,190 family Coverage all small firms (3–199 Workers)* $9,714 $11,588 all large firms (200 or more Workers) 11,880 11,915 All firm sizes, family $10,917 $11,695 source: kaiser/hret survey of employer-sponsored health Benefits, 2009. * estimates are statistically different between firms that offered the same plan last year and those that did not offer the same plan last year within the indicated size category (p.05). note: We asked employers to tell us whether the plans that they were reporting on also were offered last year. if they offered the same plan last year, we do not ask whether they modified the benefits within the plan between last year and this year. 31 t h e k a i s e r fa m i ly f o u n d at i o n - a n d - h e a lt h r e s e a r C h e d u C at i o n a l t r u s t
  • 46.
    section one Employer Health Benefits 2 0 0 9 A n n u a l s u r ve y e x h i B i t 1. 12 average annual Premiums for single and family Coverage, 1999–2009 1 Cost of Health Insurance $2,196 1999 $5,791 $2,471* 2000 $6,438* $2,689* 2001 $7,061* $3,083* 2002 $8,003* $3,383* 2003 $9,068* $3,695* 2004 $9,950* $4,024* 2005 $10,880* $4,242* 2006 $11,480* $4,479* 2007 $12,106* $4,704* 2008 $12,680* 2009 $4,824 $13,375* $0 $2,000 $4,000 $6,000 $8,000 $10,000 $12,000 $14,000 $16,000 source: SINGLE COVERAGE kaiser/hret survey of employer-sponsored health Benefits, 1999–2009. FAMILY COVERAGE * estimate is statistically different from estimate for the previous year shown (p.05). 32 t h e k a i s e r fa m i ly f o u n d at i o n - a n d - h e a lt h r e s e a r C h e d u C at i o n a l t r u s t
  • 47.
    section one Employer Health Benefits 2 0 0 9 An n u a l s u r ve y e x h i B i t 1.1 3 average annual Premiums for Covered Wor kers with family Coverage, by fir m size, 1999–2009 1 Cost of Health Insurance all small firms (3–199 Workers) all large firms (200 or more Workers) 1999 $5,683 $5,845 2000 $6,521 $6,395 2001 $6,959 $7,113 2002* $7,781 $8,109 2003 $8,946 $9,127 2004 $9,737 $10,046 2005* $10,587 $11,025 2006 $11,306 $11,575 2007 $11,835 $12,233 2008* $12,091 $12,973 2009* $12,696 $13,704 source: kaiser/hret survey of employer-sponsored health Benefits, 1999–2009. * estimate is statistically different between all small firms and all large firms within year (p.05). e x h i B i t 1.1 4 average annual Premiums for Covered Wor kers with family Coverage, by fir m size, 1999–2009 $16,000 $13,704* $14,000 $12,973* $12,233* $11,575* $12,000 $11,025* $12,696 $12,091 $10,046* $11,835 $11,306* $10,000 $9,127* $10,587* $8,109* $9,737* $8,000 $7,113* $8,946* $6,395* $7,781* $5,845 $6,000 $6,959* $6,521* $5,683 $4,000 $2,000 $0 1999 2000 2001 2002 2003 2004 2005 2006 2007 2008 2009 source: ALL SMALL FIRMS 3 199 WORKERS kaiser/hret survey of employer-sponsored health Benefits, 1999–2009. ALL LARGE FIRMS 200 OR MORE WORKERS * estimate is statistically different from estimate for the previous year shown (p.05). 33 t h e k a i s e r fa m i ly f o u n d at i o n - a n d - h e a lt h r e s e a r C h e d u C at i o n a l t r u s t
  • 48.
    section one Employer Health Benefits 2 0 0 9 A n n u a l s u r ve y e x h i B i t 1. 15 among Wor kers in large fir ms (200 or m ore Workers), average health i nsurance Premiums for 1 family Coverage, by funding arrangement, 1999–2009 Cost of Health Insurance funding arrangement fully insured self-funded 1999 $5,769 $5,896 2000 $6,315* $6,430* 2001 $7,169* $7,086* 2002 $7,950* $8,192* 2003 $9,070* $9,149* 2004 $10,217* $9,984* 2005 $10,870* $11,077* 2006 $11,222 $11,673* 2007 $11,968* $12,315* 2008 $13,029* $12,956* 2009 $13,870* $13,655* source: kaiser/hret survey of employer-sponsored health Benefits, 1999–2009. * estimate is statistically different from estimate for the previous year shown (p.05). note: for definitions of self-funded and fully insured Plans, see the introduction to section 10. due to a change in the survey questionnaire, funding status was not asked of firms with conventional plans in 2006. therefore, conventional plan funding status is not included in this exhibit for 2006. 34 t h e k a i s e r fa m i ly f o u n d at i o n - a n d - h e a lt h r e s e a r C h e d u C at i o n a l t r u s t
  • 49.
    60% $4,8 2 4 Employer Health Benefits $ 13,375 2009 annual surVey Health Benefits Offer Rates section 2 2009
  • 50.
    Employer Health Benefits 2 0 0 9 A n n u a l s u r ve y h e a lt h B e n e f i t S o f f e r r at e S section two T he percenTage of firms offering healTh benefiTs in 2009 is noT significanTly differenT from The percenTage in 2008. n early all large firms (200 or more workers ) offer healTh benefiTs ; small firms (3–199 workers ) are significanTly less likely To do so. 2 T he offer raTe represenTs informaTion on firms ThaT are sTill in business and does noT accounT for firms ThaT have gone ouT of business due To The economic recession . Health Benefits Offer Rates  In 2009, sixty percent of firms offer health benefits,  Firms with fewer part-time workers (less than which is not statistically different from the 63% 35% of employees work part-time) are also reported in 2008 (Exhibit 2.1). significantly more likely to offer coverage to their workers than firms with many part-time workers.  Ninety-eight percent of large firms (200 or Among firms with fewer part-time workers, 67% more workers) offer health benefits in 2009, not offer health insurance, compared to 32% of firms statistically different from 2008 (Exhibit 2.2). with a higher percentage of part-time workers In contrast, only 59% of small firms (3–199 (Exhibit 2.4). workers) offer health benefits in 2009, also not statistically different from the 62% reported in  Firms that employ at least some union workers 2008. are much more likely than firms without union workers to offer health benefits to their  Between 1999 and 2009, the offer rate for large employees. Ninety-seven percent of firms firms (200 or more workers) has not dropped with some union workers offer health benefits, below 98%. Among small firms (3–199 compared to 57% of firms that do not have workers), the offer rate has varied from a high of union employees (Exhibit 2.4). 68% in 2000 to 59% in 2005, 2007 and 2009. These variations are driven primarily by changes  Among firms offering health benefits, relatively in the percentages of the smallest firms (3–9 few offer benefits to their part-time and temporary workers) offering health benefits. workers.  Offer rates vary across different types of firms.  In 2009, 31% of all firms that offer health benefits offer them to part-time workers (Exhibit  The smallest firms are least likely to offer health 2.5). Firms with 200 or more workers are insurance. Only 46% of firms with 3 to 9 more likely to offer health benefits to part-time workers offer coverage, compared to 72% of employees than firms with 3 to 199 workers firms with 10 to 24 workers, 87% of firms with (48% vs. 30%). 25 to 49 workers (Exhibit 2.3), and over 95% of firms with 50 or more employees.  A very small percentage (3%) of firms offering health benefits offer them to temporary workers  Firms with fewer lower-wage workers (less than (Exhibit 2.6). 35% of workers earn $23,000 or less annually) are significantly more likely to offer health D o m e s T i C pA r T N e r b e N e f i T s insurance than firms with many lower-wage  As in the past, we asked firms if they offer health workers (35% or more of workers earn $23,000 benefits to opposite-sex or same-sex domestic or less annually). Sixty-four percent of firms with partners. However, for the 2008 and 2009 surveys, fewer lower-wage workers offer health benefits, we changed the response options because during compared with only 39% of firms with many early tests of the 2008 survey, several firms noted lower-wage workers (Exhibit 2.4). that they had not encountered the issue, indicating 36 t h e k a i s e r fa m i ly f o u n d at i o n - a n d - h e a lt h r e s e a r C h e d u C at i o n a l t r u s t
  • 51.
    Employer Health Benefits 2 0 0 9 An n u a l s u r ve y section two that the responses of “yes,” “no,” and “don’t know”  Despite a slowing of health insurance cost growth in were insufficient. Therefore, last year we added the recent years, the cost of health insurance remains the response option “not applicable/not encountered” to primary reason cited by firms for not offering health better capture the number of firms that report not benefits.1 having a policy on the issue.  Among small firms (3–199 workers) not offering 2  In response to the question asking firms if they health benefits, 62% cite high cost as “the most Health Benefits Offer Rates offer health benefits to unmarried opposite-sex important reason” for not doing so. Other factors partners, 31% of firms report offering health frequently cited by firms as the most important benefits to unmarried opposite-sex domestic reason for not offering coverage include: firm partners. An additional 36% of firms report that is too small (9%) and employees are covered they have not encountered the issue or that the elsewhere (11%) (Exhibit 2.9). question was not applicable, with 37% of small  Many non-offering firms have either offered health firms (3–199 workers) more likely to report this benefits in the past five years, or shopped for compared to 6% of large firms (200 or more coverage recently. workers) (Exhibit 2.7).  Eighteen percent of non-offering small firms  In response to the question asking firms if they (3–199 workers) have offered health benefits in offer health benefits to unmarried same-sex the past five years, while 33% have shopped for domestic partners, 21% of firms offer health coverage in the past 12 months (Exhibit 2.10). benefits to unmarried same-sex domestic partners. An additional 44% of firms report that they have  Four-fifths of small firms (3–199 workers) not not encountered the issue or that the question offering health benefits believe that employees would was not applicable, with 46% of small firms rather receive an additional $2 per hour in the form (3–199 workers) and 6% of large firms (200 of higher wages (approximately the cost of health or more workers) reporting that they have not insurance for single coverage) than health insurance encountered the issue or that the question was not (Exhibit 2.11). applicable (Exhibit 2.8).  Small firms (3–199 workers) not offering health  Firms in the West are more likely (41%) and firms insurance gave a variety of estimates regarding the in the South are less likely (6%) to offer health amount they believe the firm could afford to pay benefits to unmarried same-sex domestic partners for health insurance coverage for an employee with than firms in other regions. single coverage. Thirty percent reported that they could pay less than $100 per month; 11% reported f i r m s N o T o f f e r i N g h e A lT h b e N e f i T s that they could pay $300 or more per month  The survey asks firms that do not offer health (Exhibit 2.12). benefits if they have offered insurance or shopped  Forty percent of small (3–199 workers) non-offering for insurance in the recent past, about their most firms believe the total cost of health insurance for important reasons for not offering, and if they think one employee would cost $400 or more per month. employees would prefer an additional $2 per hour The average monthly cost of single coverage in 2009 as wages or health insurance. Because such a small is $402, with wide variation around the average percentage of large firms (200 or more workers) (Exhibit 2.13). report not offering health benefits, we present the information for employers with 3 to 199 workers, 41% of which do not offer health benefits. noTe: 1 in 2009, the question asking non-offering firms their most important reason for not offering health benefits was changed from a question with multiple response categories to an open-ended question. 37 t h e k a i s e r fa m i ly f o u n d at i o n - a n d - h e a lt h r e s e a r C h e d u C at i o n a l t r u s t
  • 52.
    Employer Health Benefits 2 0 0 9 A n n u a l s u r ve y e x h i B i t 2. 1 Percentage of firms o ffering health B enefits, 1999–2009* section two 100% 90% 80% 69% 68% 2 70% 66% 66% 66% 63% 63% 60% 61% 60% 60% 60% Health Benefits Offer Rates 50% 40% 30% 20% 10% 0% 1999 2000 2001 2002 2003 2004 2005 2006 2007 2008 2009 source: kaiser/hret survey of employer-sponsored health Benefits, 1999–2009. * tests found no statistical difference from estimate for the previous year shown (p.05). note: as noted in the survey design and methods section, estimates presented in this exhibit are based on the sample of both firms that completed the entire survey and those that answered just one question about whether they offer health benefits. e x h i B i t 2. 2 Percentage of firms o ffering health B enefits, by fir m size, 1999–2009 firm size 1999 2000 2001 2002 2003 2004 2005 2006 2007 2008 2009 3–9 Workers 56% 57% 58% 58% 55% 52% 47% 48% 45% 49% 46% 10–24 Workers 74 80 77 70* 76 74 72 73 76 78 72 25–49 Workers 86 91 90 86 84 87 87 87 83 90* 87 50–199 Workers 97 97 96 95 95 92 93 92 94 94 95 All small firms 65% 68% 68% 66% 65% 63% 59% 60% 59% 62% 59% (3–199 Workers) All large firms 99% 99% 99% 98% 98% 99% 98% 98% 99% 99% 98% (200 or more Workers) All firms 66% 69% 68% 66% 66% 63% 60% 61% 60% 63% 60% source: kaiser/hret survey of employer-sponsored health Benefits, 1999 –2009. * estimate is statistically different from estimate for the previous year shown (p.05). note: as noted in the survey design and methods section, estimates presented in this exhibit are based on the sample of both firms that completed the entire survey and those that answered just one question about whether they offer health benefits. 38 t h e k a i s e r fa m i ly f o u n d at i o n - a n d - h e a lt h r e s e a r C h e d u C at i o n a l t r u s t
  • 53.
    Employer Health Benefits 2 0 0 9 An n u a l s u r ve y e x h i B i t 2.3 Percentage of firms o ffering health Benefits, by fir m size, r egion, and i ndustr y, 2009 section two Percentage of firms offering health Benefits firm size 3–9 Workers 46%* 10–24 Workers 72* 25–49 Workers 87* 2 50–199 Workers 95* Health Benefits Offer Rates 200–999 Workers 98* 1,000–4,999 Workers 99* 5,000 or more Workers 100* All small firms (3–199 Workers) 59%* All large firms (200 or more Workers) 98%* regioN northeast 68% midwest 63 south 53* West 61 iNDusTry agriculture/mining/Construction 66% manufacturing 80* transportation/Communications/utilities 74 Wholesale 74 retail 53 finance 56 service 56 state/local Government 63 health Care 53 All firms 60% source: kaiser/hret survey of employer-sponsored health Benefits, 2009 * estimate is statistically different from estimate for all other firms not in the indicated size, region, or industry category (p.05). note: as noted in the survey design and methods section, estimates presented in this exhibit are based on the sample of both firms that completed the entire survey and those that answered just one question about whether they offer health benefits. 39 t h e k a i s e r fa m i ly f o u n d at i o n - a n d - h e a lt h r e s e a r C h e d u C at i o n a l t r u s t
  • 54.
    Employer Health Benefits 2 0 0 9 A n n u a l s u r ve y e x h i B i t 2. 4 Percentage of firms o ffering health B enefits, by fir m Charac ter istics, 2009 section two WAGE LEVEL* FEW WORKERS ARE LOWER WAGE LESS THAN 35% EARN $23,000 A YEAR OR LESS 64% MANY WORKERS ARE LOWER WAGE 35% OR 39% MORE EARN $23,000 A YEAR OR LESS PART TIME WORKERS* FEW WORKERS ARE PART TIME 67% LESS THAN 35% WORK PART TIME 2 MANY WORKERS ARE PART TIME 32% 35% OR MORE WORK PART TIME Health Benefits Offer Rates UNIONS* FIRM HAS AT LEAST SOME UNION WORKERS 97% FIRM DOES NOT HAVE ANY UNION WORKERS 57% AGE LESS THAN 35% OF WORKERS ARE 26 YEARS OLD OR LESS 61% 35% OR MORE WORKERS ARE 26 YEARS OLD OR LESS 45% 0% 10% 20% 30% 40% 50% 60% 70% 80% 90% 100% source: kaiser/hret survey of employer-sponsored health Benefits, 2009. * estimates are statistically different from each other within category (p.05). 40 t h e k a i s e r fa m i ly f o u n d at i o n - a n d - h e a lt h r e s e a r C h e d u C at i o n a l t r u s t
  • 55.
    Employer Health Benefits 2 0 0 9 An n u a l s u r ve y e x h i B i t 2.5 among fir ms o ffering health Benefits, Percentage that o ffer health B enefits to Par t-time Wor kers, by firm size, 1999–2009* section two firm size 1999 2000 2001 2002 2003 2004 2005 2006 2007 2008 2009 3–24 Workers 19% 21% 17% 21% 24% 20% 27% 30% 23% 22% 31% 25–199 Workers 26 25 31 29 29 29 29 28 26 30 27 200–999 Workers 36 33 42 43 38 41 33 40 37 40 44 1,000–4,999 Workers 53 48 55 60 57 50 46 55 54 53 55 5,000 or more Workers 61 52 60 58 57 59 61 63 63 67 60 2 Health Benefits Offer Rates All firms 21% 23% 21% 24% 26% 23% 28% 31% 24% 25% 31% source: kaiser/hret survey of employer-sponsored health Benefits, 1999–2009. * tests found no statistical difference from estimate for the previous year shown (p.05). e x h i B i t 2.6 among fir ms o ffering health Benefits, Percentage that o ffer health B enefits to temporar y Wor kers, by firm size, 1999–2009 firm size 1999 2000 2001 2002 2003 2004 2005 2006 2007 2008 2009 3–24 Workers 5% 2% 4% 3% 1% 4% 2% 3% 2% 3% 4% 25–199 Workers 3 7 3 4 3 3 5 4 4 3 3 200–999 Workers 3 8 6 5 9 8 5 5 7 4 4 1,000–4,999 Workers 6 8 9 8 7 6 5 9 9 7 7 5,000 or more Workers 8 9 7 7 10 7 9 11 6* 8 9 All firms 4% 4% 4% 3% 2% 4% 3% 3% 2% 3% 3% source: kaiser/hret survey of employer-sponsored health Benefits, 1999-2009. * estimate is statistically different from estimate for the previous year shown (p.05). 41 t h e k a i s e r fa m i ly f o u n d at i o n - a n d - h e a lt h r e s e a r C h e d u C at i o n a l t r u s t
  • 56.
    Employer Health Benefits 2 0 0 9 A n n u a l s u r ve y e x h i B i t 2. 7 among firms o ffering health Benefits, distr ibution of Whether employers o ffer health B enefits to unmar r ied opposite -sex d omestic Par tners, by fir m size, r egion, and i ndustr y, 2009 section two not encountered/ yes no not applicable firm size 3–24 Workers 30% 29%* 41%* 2 25–49 Workers 35 37 29 50–199 Workers 26 56* 18* Health Benefits Offer Rates 200–999 Workers 33 59* 8* 1,000–4,999 Workers 36 63* 1* 5,000 or more Workers 46* 54* 1* All small firms (3–199 Workers) 30% 33%* 37%* All large firms (200 or more Workers) 35% 59%* 6%* regioN northeast 45% 29% 26% midwest 19 38 43 south 20 37 44 West 42 31 28 iNDusTry agriculture/mining/Construction 22% 23% 55%* manufacturing 24 30 46 transportation/Communications/utilities 40 38 22 Wholesale 56 18* 26 retail 46 42 12* finance 12* 75* 13* service 30 31 39 state/local Government 62 33 5* health Care 14* 40 46 All firms 31% 34% 36% source: kaiser/hret survey of employer-sponsored health Benefits, 2009. * estimate is statistically different from estimate for all firms not in the indicated size, region, or industry category (p.05). note: in 2008, we changed the response options because during early tests of the survey, several firms noted that they had not encountered the issue, indicating that the responses of “yes,”“no,” and “don’t know” were insufficient. therefore, for the 2008 and 2009 surveys we included the response option “not applicable/not encountered” to better capture the number of firms that report not having a policy on the issue. this response is distinguished from firms that report “no” since those firms have a set policy on the issue. 42 t h e k a i s e r fa m i ly f o u n d at i o n - a n d - h e a lt h r e s e a r C h e d u C at i o n a l t r u s t
  • 57.
    Employer Health Benefits 2 0 0 9 An n u a l s u r ve y e x h i B i t 2.8 among fir ms o ffering health Benefits, distr ibution of Whether employers o ffer health B enefits to unmar r ied same -s ex d omestic Par tners, by fir m size, r egion, and i ndustr y, 2009 section two not encountered/ yes no not applicable firm size 3–24 Workers 20% 30%* 51%* 25–49 Workers 24 39 37 2 50–199 Workers 20 58* 22* Health Benefits Offer Rates 200–999 Workers 33* 59* 8* 1,000–4,999 Workers 36* 62* 1* 5,000 or more Workers 56* 44 1* All small firms (3–199 Workers) 20%* 34%* 46%* All large firms (200 or more Workers) 36%* 58%* 6%* regioN northeast 25% 38% 37% midwest 15 40 45 south 6* 35 59* West 41* 27 32 iNDusTry agriculture/mining/Construction 8%* 31% 61% manufacturing 17 32 51 transportation/Communications/utilities 13 45 41 Wholesale 7* 34 59 retail 45 42 13* finance 12 75* 13* service 24 30 46 state/local Government 58 34 9* health Care 11 19* 70* All firms 21% 35% 44% source: kaiser/hret survey of employer-sponsored health Benefits, 2009. * estimate is statistically different from estimate for all firms not in the indicated size, region, or industry category (p.05). note: in 2008, we changed the response options because during early tests of the survey, several firms noted that they had not encountered the issue, indicating that the responses of “yes,”“no,” and “don’t know” were insufficient. therefore, for the 2008 and 2009 surveys we included the response option “not applicable/not encountered” to better capture the number of firms that report not having a policy on the issue. this response is distinguished from firms that report “no” since those firms have a set policy on the issue. 43 t h e k a i s e r fa m i ly f o u n d at i o n - a n d - h e a lt h r e s e a r C h e d u C at i o n a l t r u s t
  • 58.
    Employer Health Benefits 2 0 0 9 A n n u a l s u r ve y e x h i B i t 2. 9 among small firms (3–199 Workers) not o ffer ing health B enefits, r easons for not o ffer ing, 2009 section two most important reason Cost of health insurance is too high 62% the firm is too small 9 employees are generally covered under another plan 11 2 employee turnover is too great 7 other 10 Health Benefits Offer Rates don’t know 1 source: kaiser/hret survey of employer-sponsored health Benefits, 2009. e x h i B i t 2. 10 among small firms (3–199 Workers) not o ffer ing health B enefits, Percentage that repor t the following ac tivities r egarding health B enefits, by fir m size, 2009* 100% 80% 60% 40% 33% 33% 28% 23% 20% 18% 18% 0% OFFERED HEALTH INSURANCE SHOPPED FOR HEALTH INSURANCE WITHIN THE PAST FIVE YEARS WITHIN THE PAST YEAR source: 3 24 WORKERS kaiser/hret survey of employer-sponsored health Benefits, 2009. 25 199 WORKERS ALL SMALL FIRMS 3 199 WORKERS * tests found no differences between size categories (p.05). 44 t h e k a i s e r fa m i ly f o u n d at i o n - a n d - h e a lt h r e s e a r C h e d u C at i o n a l t r u s t
  • 59.
    Employer Health Benefits 2 0 0 9 An n u a l s u r ve y e x h i B i t 2.1 1 among small firms (3–199 Workers) not o ffer ing health B enefits, employer B eliefs about employees’ Preferences for h igher Wages or health i nsurance B enefits, 2003–2009 section two 2003 72% 19% 9% 2005 71% 26% 4% 2007 71% 23% 6% 2 84% 12% 4% Health Benefits Offer Rates 2008* 2009 80% 13% 7% 0% 10% 20% 30% 40% 50% 60% 70% 80% 90% 100% source: EMPLOYEES WOULD PREFER HIGHER WAGES kaiser/hret survey of employer-sponsored health Benefits, 2003–2009. EMPLOYEES WOULD PREFER HEALTH INSURANCE * distribution is statistically different from distribution for the previous year shown (p.05). DON’T KNOW note: the question asks firms whether they believe employees would rather receive an additional $2 per hour (approximately the cost of health insurance for single coverage) in the form of higher wages or health insurance. e x h i B i t 2.1 2 among small firms (3–199 Workers) not o ffer ing B enefits, distr ibution of fir ms by the amount they B elieve they Could afford to Pay m onthly for health i nsurance Coverage for an employee with single Coverage, by firm size, 2009* 3 24 WORKERS 30% 17% 11% 7% 4% 31% 25 199 WORKERS 33% 33% 6% 6% 22% ALL SMALL FIRMS 3 199 WORKERS 30% 18% 11% 7% 4% 31% 0% 10% 20% 30% 40% 50% 60% 70% 80% 90% 100% source: LESS THAN $100 PER MONTH kaiser/hret survey of employer-sponsored health Benefits, 2009. $100 $199 PER MONTH $200 $299 PER MONTH * tests found no statistical difference between distributions for firms with 3–24 Workers and $300 $399 PER MONTH 25–199 Workers (p.05). $400 OR MORE PER MONTH DON‘T KNOW 45 t h e k a i s e r fa m i ly f o u n d at i o n - a n d - h e a lt h r e s e a r C h e d u C at i o n a l t r u s t
  • 60.
    Employer Health Benefits 2 0 0 9 A n n u a l s u r ve y e x h i B i t 2. 13 among small firms (3–199 Workers) not o ffer ing health B enefits, distr ibution of fir ms by the amount they Believe the total m onthly Cost of health i nsurance for one employee with single Coverage Would be if they o ffered the B enefit, by fir m size, 2009* section two 2% 3 24 WORKERS 3% 15% 12% 40% 28% 1% 2 25 199 WORKERS 15% 14% 18% 30% 21% Health Benefits Offer Rates 2% ALL SMALL FIRMS 3 199 WORKERS 3% 15% 12% 40% 28% 0% 10% 20% 30% 40% 50% 60% 70% 80% 90% 100% source: LESS THAN $100 PER MONTH kaiser/hret survey of employer-sponsored health Benefits, 2009. $100 $199 PER MONTH $200 $299 PER MONTH * tests found no statistical difference between distributions for firms with 3–24 Workers and 25–199 Workers (p.05). $300 $399 PER MONTH $400 OR MORE PER MONTH DON‘T KNOW 46 t h e k a i s e r fa m i ly f o u n d at i o n - a n d - h e a lt h r e s e a r C h e d u C at i o n a l t r u s t
  • 61.
    60% $4,8 2 4 Employer Health Benefits $ 13,375 2009 annual surVey Employee Coverage, Eligibility, and Participation section 3 2009
  • 62.
    Employer Health Benefits 2 0 0 9 A n n u a l s u r ve y e M p l o y e e C o v e r a g e , e l i g i B i l i t y, a n D p a r t i C i p a t i o n e mployers are The principal source of healTh insurance in The u niTed s TaTes , providing healTh benefiTs for abouT 159 million nonelderly people in a merica . 1 m osT workers are offered healTh coverage aT work , and The vasT majoriTy of workers who are offered coverage Take iT . workers may noT be covered by Their own employer for several reasons : Their employer may noT offer coverage , They may be ineligible for benefiTs offered by Their firm , They may choose To elecT coverage Through Their spouse’s employer, or section three They may refuse an offer of coverage from Their firm .  Among firms offering health benefits, 65% percent  Among workers in firms offering health benefits, of workers are covered by health benefits through those in firms with fewer lower-wage workers their own employer (Exhibit 3.2). This percentage (fewer than 35% of workers earn $23,000 or 3 is reduced to 59% when considering all workers, less annually) are more likely to be covered by regardless of whether they are in a firm offering their own firm than workers in firms with many Employee Coverage, Eligibility, and Participation health benefits or not (Exhibit 3.1). lower-wage workers (35% or more of workers earn $23,000 or less annually). Sixty-nine percent of  The rate of coverage varies by certain firm workers in firms with fewer lower-wage workers characteristics. are covered by their own employer, compared to  There is significant variation in the coverage rate 46% of workers in lower-wage firms (Exhibit 3.5). by industry among workers in firms offering  Not all employees are eligible for the health benefits health benefits. For example, forty-three percent offered by their firm, and not all eligible employees of workers in retail firms are covered by health who are offered health coverage take up the offer of benefits offered by their firm, compared to 78% coverage. The share of workers covered in a firm is of workers in state and local government, 78% of a product of both the percentage of workers who workers in the transportation/communications/ are eligible for the firm’s health insurance and the utilities industry category, and 79% of workers in percentage who choose to “take up” (i.e., elect to the manufacturing industry (Exhibit 3.2). participate in) the benefit.  Among workers in firms offering health benefits,  Seventy-nine percent of workers in firms offering those in firms with relatively few part-time health benefits are eligible for the coverage workers (fewer than 35% of workers are part- offered by their employer in 2009, similar to the time) are much more likely to be covered by their percentage (80%) reported last year (Exhibit 3.6). own firm than workers in firms with a greater percentage of part-time workers. Seventy-one  Eligibility varies considerably by wage level. percent of workers in firms with relatively few Employees in firms with a lower proportion of part-time workers are covered by their own lower-wage workers (fewer than 35% of workers employer, compared to 33% in firms with higher earn $23,000 or less annually) are more likely to percentages of part-time workers (Exhibit 3.5). be eligible for health benefits than are employees in firms with a higher proportion of lower- wage workers (where 35% or more of workers earn $23,000 or less annually) (83% vs. 65%) (Exhibit 3.3). noTe: 1 kaiser family foundation, kaiser Commission on medicaid and the uninsured, the uninsured: a Primer, october 2008. 48 t h e k a i s e r fa m i ly f o u n d at i o n - a n d - h e a lt h r e s e a r C h e d u C at i o n a l t r u s t
  • 63.
    Employer Health Benefits 2 0 0 9 An n u a l s u r ve y  Employees who are offered coverage through  Seventy-four percent of covered workers face a their employer generally elect to take up coverage. waiting period before coverage is available. Covered Eighty-one percent of eligible workers take up workers in small firms (3–199 workers) are more coverage when it is offered to them, similar to the likely to face a waiting period than workers in large 82% reported last year (Exhibit 3.6).2 firms (200 or more workers) (80% vs. 70%). In addition, covered workers in the Northeast are less  The likelihood of a worker accepting a firm’s offer section three likely (64%) and covered workers in the West are of coverage also varies by firm wage level. Eligible more likely (81%) than workers in other regions employees in firms with a lower proportion of to face a waiting period. Covered workers in retail lower-wage workers are more likely to take up (93%), wholesale (88%), and healthcare (87%) coverage (83%) than eligible employees in firms firms are much more likely than workers in other with a higher proportion of lower-wage workers industries to face a waiting period (Exhibit 3.7). (35% or more of workers earn $23,000 or less annually) (70%) (Exhibit 3.4).  The average waiting period among covered workers who face a waiting period is 2.2 months 3 (Exhibit 3.7). Twenty-nine percent of covered Employee Coverage, Eligibility, and Participation workers face a waiting period of 3 months or more (Exhibit 3.8). noTe: 2 in 2009, kaiser/hret began weighting the percentage of workers that take up coverage by the number of workers eligible for coverage. the historical take up estimates have also been updated. see the survey design and methods section for more information. 49 t h e k a i s e r fa m i ly f o u n d at i o n - a n d - h e a lt h r e s e a r C h e d u C at i o n a l t r u s t
  • 64.
    Employer Health Benefits 2 0 0 9 A n n u a l s u r ve y e x h i B i t 3. 1 Percentage of all Workers Covered by their employers’ health B enefits, in fir ms B oth o ffer ing and not o ffering health Benefits, by firm size, 1999–2009* firm size 1999 2000 2001 2002 2003 2004 2005 2006 2007 2008 2009 3–24 Workers 50% 50% 49% 45% 44% 43% 41% 45% 42% 43% 39% 25–49 Workers 56 63 62 57 59 56 55 55 51 57 54 50–199 Workers 61 62 67 64 61 56 59 62 59 60 59 200–999 Workers 69 69 71 69 68 69 65 66 65 67 63 1,000–4,999 Workers 68 68 69 70 69 68 69 68 69 69 67 section three 5,000 or more Workers 64 66 69 68 68 67 66 60 63 64 65 All small firms (3–199 Workers) 55% 57% 58% 54% 53% 50% 50% 53% 50% 52% 49% All large firms (200 or more Workers) 66% 67% 69% 69% 68% 68% 66% 63% 65% 66% 65% All firms 62% 63% 65% 63% 62% 61% 60% 59% 59% 60% 59% 3 source: Employee Coverage, Eligibility, and Participation kaiser/hret survey of employer-sponsored health Benefits, 1999–2009. * tests found no statistical difference from estimate for the previous year shown (p.05). 50 t h e k a i s e r fa m i ly f o u n d at i o n - a n d - h e a lt h r e s e a r C h e d u C at i o n a l t r u s t
  • 65.
    Employer Health Benefits 2 0 0 9 An n u a l s u r ve y e x h i B i t 3.2 eligibilit y, take -up r ate, and Coverage in firms o ffering health Benefits, by firm size, region, and i ndustr y, 2009 Percentage Percentage Percentage of Workers eligible of eligible Workers of Workers Covered for health Benefits Who Participate by their employers’ offered By their in their employers’ health Benefits employer Plan (take-up rate) firm size section three 3–24 Workers 83% 79% 66% 25–49 Workers 84 78 65 50–199 Workers 78 79 61 200–999 Workers 77 83 64 1,000–4,999 Workers 80 83* 67 5,000 or more Workers 79 82 65 All small firms (3–199 Workers) 81% 79%* 64% All large firms (200 or more Workers) 79% 82%* 65% 3 Employee Coverage, Eligibility, and Participation regioN northeast 78% 80% 62% midwest 77 80 62 south 82* 82 67* West 79 82 64 iNDusTry agriculture/mining/Construction 80% 82% 65% manufacturing 93* 84* 79* transportation/Communications/utilities 89* 88* 78* Wholesale 86* 81 70 retail 58* 74* 43* finance 86* 81 70 service 76* 78* 60* state/local Government 87* 90* 78* health Care 80 83 66 All firms 79% 81% 65% source: kaiser/hret survey of employer-sponsored health Benefits, 2009. * estimate for eligibility, take-up rate, or coverage is statistically different from all other firms not in the indicated size, region, or industry category (p.05). note: in 2009, kaiser/hret began weighting the percentage of workers that take up coverage by the number of workers eligible for coverage. see the survey design and methods section for more information. 51 t h e k a i s e r fa m i ly f o u n d at i o n - a n d - h e a lt h r e s e a r C h e d u C at i o n a l t r u s t
  • 66.
    Employer Health Benefits 2 0 0 9 A n n u a l s u r ve y e x h i B i t 3. 3 among Wor kers in fir ms o ffer ing health Benefits, Percentage of Workers eligible for health B enefits o ffered by their firm, by firm Charac ter istics, 2009 WAGE LEVEL* FEW WORKERS ARE LOWER WAGE 83% LESS THAN 35% EARN $23,000 A YEAR OR LESS MANY WORKERS ARE LOWER WAGE 65% 35% OR MORE EARN $23,000 A YEAR OR LESS PART TIME WORKERS* FEW WORKERS ARE PART TIME 86% LESS THAN 35% WORK PART TIME MANY WORKERS ARE PART TIME 47% 35% OR MORE WORK PART TIME section three UNIONS FIRM HAS AT LEAST SOME UNION WORKERS 79% FIRM DOES NOT HAVE ANY UNION WORKERS 80% AGE* LESS THAN 35% OF WORKERS 83% ARE 26 YEARS OLD OR LESS 35% OR MORE WORKERS 54% ARE 26 YEARS OLD OR LESS 3 0% 10% 20% 30% 40% 50% 60% 70% 80% 90% 100% Employee Coverage, Eligibility, and Participation source: kaiser/hret survey of employer-sponsored health Benefits, 2009. * estimates are statistically different from each other within category (p.05). e x h i B i t 3. 4 among Workers in firms o ffering health B enefits, Percentage of eligible Wor kers Who take up health B enefits o ffered by their firm, by fir m Charac ter istics, 2009 WAGE LEVEL* FEW WORKERS ARE LOWER WAGE 83% LESS THAN 35% EARN $23,000 A YEAR OR LESS MANY WORKERS ARE LOWER WAGE 70% 35% OR MORE EARN $23,000 A YEAR OR LESS PART TIME WORKERS* FEW WORKERS ARE PART TIME 83% LESS THAN 35% WORK PART TIME MANY WORKERS ARE PART TIME 69% 35% OR MORE WORK PART TIME UNIONS* FIRM HAS AT LEAST SOME UNION WORKERS 84% FIRM DOES NOT HAVE ANY UNION WORKERS 80% AGE* LESS THAN 35% OF WORKERS 83% ARE 26 YEARS OLD OR LESS 35% OR MORE WORKERS ARE 26 YEARS OLD OR LESS 68% 0% 10% 20% 30% 40% 50% 60% 70% 80% 90% 100% source: kaiser/hret survey of employer-sponsored health Benefits, 2009. * estimates are statistically different from each other within category (p.05). note: in 2009, kaiser/hret began weighting the percentage of workers that take up coverage by the number of workers eligible for coverage. see the survey design and methods section for more information. 52 t h e k a i s e r fa m i ly f o u n d at i o n - a n d - h e a lt h r e s e a r C h e d u C at i o n a l t r u s t
  • 67.
    Employer Health Benefits 2 0 0 9 An n u a l s u r ve y e x h i B i t 3.5 among Wor kers in fir ms o ffer ing health Benefits, Percentage of Workers Covered by health B enefits o ffered by their firm, by firm Charac ter istics, 2009 WAGE LEVEL* FEW WORKERS ARE LOWER WAGE 69% LESS THAN 35% EARN $23,000 A YEAR OR LESS MANY WORKERS ARE LOWER WAGE 35% OR MORE EARN $23,000 A YEAR OR LESS 46% PART TIME WORKERS* FEW WORKERS ARE PART TIME LESS THAN 35% WORK PART TIME 71% MANY WORKERS ARE PART TIME 33% 35% OR MORE WORK PART TIME UNIONS section three FIRM HAS AT LEAST SOME UNION WORKERS 67% FIRM DOES NOT HAVE ANY UNION WORKERS 64% AGE* LESS THAN 35% OF WORKERS 69% ARE 26 YEARS OLD OR LESS 35% OR MORE WORKERS 37% ARE 26 YEARS OLD OR LESS 0% 10% 20% 30% 40% 50% 60% 70% 80% 90% 100% 3 Employee Coverage, Eligibility, and Participation source: kaiser/hret survey of employer-sponsored health Benefits, 2009. * estimates are statistically different from each other within category (p.05). e x h i B i t 3.6 eligibilit y, take -up r ate, and Coverage for Wor kers in fir ms o ffer ing health B enefits, by fir m size, 1999–2009 1999 2000 2001 2002 2003 2004 2005 2006 2007 2008 2009 percentage eligible all small firms (3–199 Workers) 81% 82% 85% 82%* 84% 80% 81% 83% 80% 81% 81% all large firms (200 or more Workers) 78 80 82 80 80 81 79 76 78 79 79 All firms 79% 81% 83% 81%* 81% 80% 80% 78% 79% 80% 79% percentage of eligible that Take up all small firms (3–199 Workers) 83% 83% 83% 82% 81% 80% 81% 81% 80% 80% 79% all large firms (200 or more Workers) 86 84 85 86 85 84 85 84 84 84 82 All firms 85% 84% 84% 85% 84% 83% 83% 83% 82% 82% 81% percentage Covered all small firms (3–199 Workers) 67% 68% 71% 67% 68% 64% 65% 67% 64% 65% 64% all large firms (200 or more Workers) 66 67 69 69 68 68 67 63 65 66 65 All firms 66% 68% 70% 68% 68% 67% 66% 65% 65% 65% 65% source: kaiser/hret survey of employer-sponsored health Benefits, 1999–2009. * estimate is statistically different from estimate for the previous year shown (p.05). note: in 2009, kaiser/hret began weighting the percentage of workers that take up coverage by the number of workers eligible for coverage. the historical take up estimates have also been updated. see the survey design and methods section for more information. 53 t h e k a i s e r fa m i ly f o u n d at i o n - a n d - h e a lt h r e s e a r C h e d u C at i o n a l t r u s t
  • 68.
    Employer Health Benefits 2 0 0 9 A n n u a l s u r ve y e x h i B i t 3. 7 Percentage of Covered Wor kers in firms with a Waiting Period for Coverage and average Waiting Per iod in m onths, by firm size, region, and i ndustr y, 2009 among Covered Workers Percentage of Covered Workers with a Waiting Period, average in firms with Waiting Period Waiting Period (months) firm size all small firms (3–199 Workers) 80%* 2.5* all large firms (200 or more Workers) 70* 2.0* section three regioN northeast 64%* 2.1 midwest 74 1.8* south 74 2.1 West 81* 2.7* iNDusTry 3 agriculture/mining/Construction 81% 2.9 manufacturing 67 2.3 Employee Coverage, Eligibility, and Participation transportation/Communications/utilities 62 1.8* Wholesale 88* 2.1 retail 93* 2.8* finance 64 2.1 service 71 2.1 state/local Government 69 1.7* health Care 87* 1.9* All firms 74% 2.2 source: kaiser/hret survey of employer-sponsored health Benefits, 2009. * estimate is statistically different from estimate for all other firms not in the indicated size, region, or industry category (p.05). e x h i B i t 3. 8 distr ibution of Covered Workers with the following Waiting Per iods for Coverage, 2009 ALL SMALL FIRMS 3−199 WORKERS * 20% 26% 10% 37% 7% ALL LARGE FIRMS 200 OR MORE 30% 36% 12% 16% 6% WORKERS * ALL FIRMS 26% 33% 12% 23% 6% 0% 10% 20% 30% 40% 50% 60% 70% 80% 90% 100% source: NO WAITING 2 MONTHS kaiser/hret survey of employer-sponsored health Benefits, 2009. PERIOD 3 MONTHS 1 MONTH 4 OR MORE MONTHS * distributions are statistically different between all large firms and all small firms (p.05). 54 t h e k a i s e r fa m i ly f o u n d at i o n - a n d - h e a lt h r e s e a r C h e d u C at i o n a l t r u s t
  • 69.
    60% $4,8 2 4 Employer Health Benefits $ 13,375 2009 annual surVey Types of Plans Offered section 4 2009
  • 70.
    Employer Health Benefits 2 0 0 8 A n n u a l s u r ve y typeS of planS offereD m osT firms ThaT offer healTh benefiTs offer only one Type of healTh plan (86%) (s ee TexT b ox ). l arger firms are more likely To offer more Than one Type of healTh plan . e mployers are mosT likely To offer Their workers a ppo or pos plan and are leasT likely To offer a convenTional plan .  Eighty-six percent of firms offering health benefits  About four in five (80%) covered workers in firms offer only one type of health plan. Large firms (200 offering health benefits work in a firm that offers one or more workers) are more likely to offer more than or more PPOs, 44% work in firms that offer one or one plan type than small firms (3–199 workers): more HMOs, 28% work in firms that offer one or 45% of large firms do so, compared to 13% of small more HDHP/SOs, 19% work in firms that offer one firms (Exhibit 4.1). or more POS plans, and 5% work in firms that offer one or more conventional plans (Exhibit 4.4).  Just over half (53%) of covered workers are employed in a firm that offers more than one health section four plan type. Sixty-eight percent of covered workers The survey asks firms how many plans of each given in large firms (200 or more workers) are employed type they offer. However, we do not know if each by a firm that offers more than one plan type; plan type is offered to all covered workers at the the comparable percentage for covered workers firm. For example, some workers might be offered employed in small firms (3–199 workers) is 23% one type of plan at one location, while workers at (Exhibit 4.2). another location are offered a different type of plan. 4 Types of Plans Offered 56 t h e k a i s e r fa m i ly f o u n d at i o n - a n d - h e a lt h r e s e a r C h e d u C at i o n a l t r u s t
  • 71.
    Employer Health Benefits 2 0 0 9 An n u a l s u r ve y e x h i B i t 4.1 among fir ms o ffering health Benefits, Percentage that o ffer one, two, or three or m ore Plan types, by fir m size, 2009 ‡ 1% 1% 100% 5% 9% 12% 14% 13% 90% 29% 80% 34% 36% 70% 39% 60% 50% 43% 87% 86% 40% section four 30% 61% 47% 55% 20% 28% 10% 0% 4 ALL SMALL FIRMS 200 999 1,000 4,999 5,000 OR MORE ALL LARGE FIRMS ALL FIRMS 3 199 WORKERS * WORKERS* WORKERS* WORKERS* 200 OR MORE WORKERS * Types of Plans Offered source: THREE OR MORE PLAN TYPES kaiser/hret survey of employer-sponsored health Benefits, 2009. TWO PLAN TYPES ONE PLAN TYPE * distribution is statistically different from distribution for all other firms not in the indicated size category (p.05). ‡ although firms may offer more than one of each plan type, the survey asks how many are offered among the following types: conventional, hmo, PPo, Pos, and hdhP/so. note: the survey asks firms how many plans of each given type they offer. however, we do not know if each plan type is offered to all covered workers at the firm. for example, some workers might be offered one type of plan at one location, while at another location they are offered a different type of plan. 57 t h e k a i s e r fa m i ly f o u n d at i o n - a n d - h e a lt h r e s e a r C h e d u C at i o n a l t r u s t
  • 72.
    Employer Health Benefits 2 0 0 9 A n n u a l s u r ve y e x h i B i t 4. 2 among firms o ffering health Benefits, Percentage of Covered Wor kers in fir ms o ffer ing one, two, or three or m ore Plan types, by firm size, 2009 ‡ 2% 100% 7% 16% 90% 19% 20% 28% 40% 80% 37% 70% 41% 33% 60% 40% 50% 40% 41% 77% section four 30% 56% 47% 43% 20% 32% 10% 20% 4 0% ALL SMALL FIRMS 200 999 1,000 4,999 5,000 OR MORE ALL LARGE FIRMS ALL FIRMS 3 199 WORKERS * WORKERS* WORKERS WORKERS* 200 OR MORE WORKERS * Types of Plans Offered source: THREE OR MORE PLAN TYPES kaiser/hret survey of employer-sponsored health Benefits, 2009. TWO PLAN TYPES ONE PLAN TYPE * distribution is statistically different from distribution for all other firms not in the indicated size category (p.05). ‡ although firms may offer more than one of each plan type, the survey asks how many are offered among the following types: conventional, hmo, PPo, Pos, and hdhP/so. note: the survey asks firms how many plans of each given type they offer. however, we do not know if each plan type is offered to all covered workers at the firm. for example, some workers might be offered one type of plan at one location, while at another location they are offered a different type of plan. 58 t h e k a i s e r fa m i ly f o u n d at i o n - a n d - h e a lt h r e s e a r C h e d u C at i o n a l t r u s t
  • 73.
    Employer Health Benefits 2 0 0 9 An n u a l s u r ve y e x h i B i t 4.3 among fir ms o ffering health Benefits, Percentage of fir ms that o ffer the following Plan types, by fir m size, 2009 Conventional hmo PPo Pos hdhP/so firm sizes 200–999 Workers 2% 28%* 79%* 18%* 18%* 1,000–4,999 Workers 4 38* 88* 13* 24* 5,000 or more Workers 7 57* 93* 16* 35* All small firms (3–199 Workers) 4% 19%* 42%* 37%* 11%* All large firms (200 or more Workers) 3% 33%* 82%* 16%* 21%* All firms 4% 19% 44% 36% 12% source: kaiser/hret survey of employer-sponsored health Benefits, 2009. section four * estimate is statistically different within plan type from estimate for all other firms not in the indicated size category (p.05). note: the survey asks firms how many plans of each given type they offer. however, we do not know if each plan type is offered to all covered workers at the firm. for example, some workers might be offered one type of plan at one location, while workers at another location are offered a different type of plan. e x h i B i t 4.4 4 among fir ms o ffering health Benefits, Percentage of Covered Wor kers in fir ms that o ffer the Types of Plans Offered following Plan types, by firm size, 2009 Conventional hmo PPo Pos hdhP/so firm sizes 200–999 Workers 2% 32%* 84% 15% 18%* 1,000–4,999 Workers 4 42 89* 11* 27 5,000 or more Workers 7 71* 93* 19 41* All small firms (3–199 Workers) 3% 20%* 59%* 23%* 20%* All large firms (200 or more Workers) 6% 56%* 90%* 17%* 33%* All firms 5% 44% 80% 19% 28% source: kaiser/hret survey of employer-sponsored health Benefits, 2009. * estimate is statistically different within plan type from estimate for all other firms not in the indicated size category (p.05). note: the survey asks firms how many plans of each given type they offer. however, we do not know if each plan type is offered to all covered workers at the firm. for example, some workers might be offered one type of plan at one location, while workers at another location are offered a different type of plan. 59 t h e k a i s e r fa m i ly f o u n d at i o n - a n d - h e a lt h r e s e a r C h e d u C at i o n a l t r u s t
  • 75.
    60% $4,8 2 4 Employer Health Benefits $ 13,375 2009 annual surVey Market Shares of Health Plans section 5 2009
  • 76.
    Employer Health Benefits 2 0 0 9 A n n u a l s u r ve y M a r k e t S h a r e S o f h e a lt h p l a n S e nrollmenT remains highesT in ppo s , wiTh 3 in 5 covered workers enrolled in This plan Type , followed by hmo s , pos plans , hdhp/so s , and convenTional plans .  Sixty percent of covered workers are enrolled in  Enrollment in HDHP/SOs is highest among PPOs, followed by HMOs (20%), POS plans workers in the Midwest (14%), and lowest among (10%), HDHP/SOs (8%), and conventional plans workers in the Northeast (5%) (Exhibit 5.2). (1%). The distribution of health plan enrollment in  Enrollment in HDHP/SOs held steady at 8% of 2009 did not change from last year (Exhibit 5.1). covered workers in 2009 (Exhibit 5.1).  Market Shares of Health Plans Plan enrollment patterns differ across regions.  Enrollment in HDHP/SOs is higher among  Compared to other regions, HMO enrollment workers in small firms (3–199 workers) than continues to be significantly higher in the West large firms (200 or more workers) (13% vs. 6%) (31%) and significantly lower in the Midwest (Exhibit 5.2). (10%) (Exhibit 5.2).  HDHP/SO enrollment is lower among workers  As in 2008, workers in the Midwest (66%) and in agriculture/mining/construction firms (5%) South (64%) are more likely to be enrolled in and transportation/communications/utilities PPO plans than workers in other regions; workers firms (4%) than among workers in other in the West (48%) are less likely to be enrolled in industries (Exhibit 5.2). a PPO (Exhibit 5.2). 5 section five 62 t h e k a i s e r fa m i ly f o u n d at i o n - a n d - h e a lt h r e s e a r C h e d u C at i o n a l t r u s t
  • 77.
    Employer Health Benefits 2 0 0 9 An n u a l s u r ve y e x h i B i t 5.1 distr ibution of health Plan enrollment for Covered Wor kers, by Plan type, 1988–2009 1988 73% 16% 11% 1993 46% 21% 26% 7% 1996 27% 31% 28% 14% 1999 10% 28% 39% 24% 2000* 8% 29% 42% 21% 2001* 7% 24% 46% 23% 2002* 4% 27% 52% 18% Market Shares of Health Plans 2003 5% 24% 54% 17% 2004 5% 25% 55% 15% 2005* 3% 21% 61% 15% 2006 3% 20% 60% 13% 4% 2007 3% 21% 57% 13% 5% 2008* 2% 20% 58% 12% 8% 1% 20% 60% 10% 8% 5 2009 0% 20% 40% 60% 80% 100% section five source: CONVENTIONAL kaiser/hret survey of employer-sponsored health Benefits, 1999–2008; kPmG survey of employer- HMO sponsored health Benefits, 1993, 1996; the health insurance association of america (hiaa), 1988. PPO POS * distribution is statistically different from the previous year shown (p.05). no statistical tests were HDHP/SO conducted for years prior to 1999. no statistical tests are conducted between 2005 and 2006 due to the addition of hdhP/so as a new plan type in 2006. note: information was not obtained for Pos plans in 1988. a portion of the change in plan type enrollment for 2005 is likely attributable to incorporating more recent Census Bureau estimates of the number of state and local government workers and removing federal workers from the weights. see the survey design and methods section from the 2005 kaiser/hret survey of employer-sponsored health Benefits for additional information. 63 t h e k a i s e r fa m i ly f o u n d at i o n - a n d - h e a lt h r e s e a r C h e d u C at i o n a l t r u s t
  • 78.
    Employer Health Benefits 2 0 0 9 A n n u a l s u r ve y e x h i B i t 5. 2 distribution of health Plan enrollment for Covered Workers, by firm size, region, and industr y, 2009 Conventional hmo PPo Pos hdhP/so firm size 3–24 Workers 3% 16% 43%* 30%* 9% 25–49 Workers 2 20 45* 17 16* 50–199 Workers 2 15* 57 12 14* 200–999 Workers 1* 19 63 10 7 1,000–4,999 Workers 1 18 67* 5* 8 5,000 or more Workers 1 25* 64* 5* 5* All small firms (3–199 Workers) 2% 16%* 49%* 19%* 13%* All large firms (200 or more Workers) 1% 22%* 65%* 6%* 6%* Market Shares of Health Plans regioN northeast 1% 24% 58% 11% 5%* midwest 2 10* 66* 9 14* south 1 18 64* 10 7 West 2 31* 48* 11 8 iNDusTry agriculture/mining/Construction 1% 17% 55% 23%* 5%* manufacturing 1* 19 64 7* 9 transportation/Communications/ 2 22 67 5* 4* 5 utilities Wholesale 1* 11* 64 14 11 retail 1 17 56 15 11 section five finance 1 20 59 8 12 service 2 20 58 11 9 state/local Government 2 26 59 6* 7 health Care 1 23 59 8 8 All firms 1% 20% 60% 10% 8% source: kaiser/hret survey of employer-sponsored health Benefits, 2009. * estimate is statistically different within plan type from estimate for all other firms not in the indicated size, region, or industry category (p.05). 64 t h e k a i s e r fa m i ly f o u n d at i o n - a n d - h e a lt h r e s e a r C h e d u C at i o n a l t r u s t
  • 79.
    60% $4,8 2 4 Employer Health Benefits $ 13,375 2009 annual surVey Worker and Employer Contributions for Premiums section 6 2009
  • 80.
    Employer Health Benefits 2 0 0 9 A n n u a l s u r ve y Wo r k e r a n D e M p loy e r Co n t r i B u t i o n S f o r p r e M i uM S p remium conTribuTions by covered workers averaged 17% for single coverage and 27% for family coverage , similar To The percenTages reporTed in 2008 for boTh single and family coverage . 1 T he average monThly worker conTribuTions are $65 for single coverage and $293 for family coverage .  In 2009, covered workers on average contribute  From 2008 to 2009, the average annual worker 17% of the premium for single coverage and 27% contribution for covered workers in large firms of the premium for family coverage (Exhibit 6.1). (200 or more workers) increased significantly These percentages have remained stable over the last from $769 to $854 for workers with single several years. coverage (Exhibit 6.6). The average annual worker contribution remained stable from 2008  Worker and Employer Contributions for Premiums The average monthly worker contributions for to 2009 for covered workers with single and single and family coverage were similar to the family coverage in small firms (3–199 workers) amounts reported in 2008. (Exhibits 6.6 and 6.7).  The average monthly worker contributions of  There is a great deal of variation above and below $65 for single coverage and $293 for family the average worker contribution to premiums for coverage are statistically unchanged from both single and family coverage. the $60 and $280 reported in 2008 (Exhibit 6.2). However, since 1999, the average worker  Thirty-seven percent of covered workers contribution has more than doubled for both contribute annually at least $935 (120% of single and family coverage. Annually, the average the average worker contribution) for single worker contribution is $779 for single coverage coverage, while 41% of covered workers have and $3,515 for family coverage (Exhibit 6.5). an annual worker contribution of less than $623 (80% of the average worker contribution)  Workers enrolled in HDHP/SOs contribute a (Exhibit 6.14). lower amount annually than the overall average worker contribution for both single ($540  For family coverage, 28% of covered workers compared to $779) and family coverage ($2,672 contribute annually at least $4,218 (120% of 6 compared to $3,515). Workers enrolled in POS the average worker contribution), while 43% plans contribute a larger amount annually ($4,146) of covered workers have an annual worker than the overall average worker contribution for contribution of less than $2,812 (80% of the section six family coverage ($3,515) (Exhibit 6.5). average worker contribution) (Exhibit 6.14).  Workers in small firms (3–199 workers) contribute  The majority of covered workers are employed by an annual amount of $625 for single coverage, a firm that contributes at least half of the premium which is significantly less than the $854 contributed (Exhibit 6.15). by workers in large firms (200 or more workers) (Exhibit 6.9). In contrast, workers in small firms  Eighteen percent of workers with single coverage with family coverage contribute significantly more and 6% of workers with family coverage work annually than workers with family coverage in large for a firm that pays 100% of the premium firms ($4,204 vs. $3,182) (Exhibit 6.10). (Exhibit 6.15). noTe: 1 estimates for premiums, worker contributions to premiums, and employer contributions to premiums presented in section 6 do not include contributions made by the employer to health savings accounts or health reimbursement arrangements. see section 8 for estimates of employer contributions to hsas and hras. 66 t h e k a i s e r fa m i ly f o u n d at i o n - a n d - h e a lt h r e s e a r C h e d u C at i o n a l t r u s t
  • 81.
    Employer Health Benefits 2 0 0 9 An n u a l s u r ve y  Covered workers in small firms (3–199 workers)  Workers with family coverage in firms that are are more likely to work for a firm that pays partially or completely self-funded contribute a 100% of the premium than workers in large significantly lower percentage of the premium firms (200 or more workers). In small firms, than those in firms that are fully insured (23% 39% of covered workers have an employer vs. 33%) (Exhibit 6.19).2 Among large firms that pays the full premium for single coverage, (200 or more workers) the difference between compared to 8% of covered workers in large contributions for workers in self-insured plans firms (Exhibit 6.16). For family coverage, 14% compared to workers in fully insured plans is percent of covered workers in small firms have an 23% compared to 27%. employer that pays the full premium for family coverage, compared to 2% of covered workers in  For family coverage, workers in firms with large firms (Exhibit 6.17). a higher proportion of lower-wage workers (35% or more earn $23,000 or less annually) Worker and Employer Contributions for Premiums  Thirty percent of covered workers in small firms contribute a greater percentage of the premium (3–199 workers) work in a firm where they must than those in firms with a lower proportion contribute more than 50% of the premium for of lower-wage workers (fewer than 35% earn family coverage, compared to 4% of covered $23,000 or less annually) (35% vs. 26%) workers in large firms (Exhibit 6.17). (Exhibit 6.19).  The percentage of the premium paid by covered  Workers with family coverage in firms that workers varies by several firm characteristics. have at least some union workers contribute a significantly lower percentage of the premium  For single coverage, workers in firms that are than those in firms without any union workers partially or completely self-funded contribute (21% vs. 30%) (Exhibit 6.19). a greater percentage of the premium than those in firms that are fully insured (18% vs. 15%)  Workers with family coverage in firms that (Exhibit 6.18). This difference, however, largely employ a younger workforce (35% or more reflects differences in worker contributions workers are 26 years old or less) contribute a between small and large firms for single coverage significantly higher percentage of the premium more generally. than those in firms that employ an older workforce (less than 35% of the workers are 26 6 years old or less) (33% vs. 27%) (Exhibit 6.19). section six noTe: 2 for definitions of self-funded and fully insured plans, see the introduction to section 10. 67 t h e k a i s e r fa m i ly f o u n d at i o n - a n d - h e a lt h r e s e a r C h e d u C at i o n a l t r u s t
  • 82.
    Employer Health Benefits 2 0 0 9 A n n u a l s u r ve y e x h i B i t 6. 1 average Percentage of Premium Paid by Covered Workers for single and family Coverage, 1999–2009* 50% 45% 40% 35% 30% 28% 28% 28% 27% 27% 27% 27% 27% 26% 26% 26% 25% 20% 15% 16% 16% 16% 16% 16% 16% 16% 17% Worker and Employer Contributions for Premiums 14% 14% 14% 10% 5% 0% 1999 2000 2001 2002 2003 2004 2005 2006 2007 2008 2009 source: FAMILY COVERAGE kaiser/hret survey of employer-sponsored health Benefits, 1999–2009. SINGLE COVERAGE *tests found no statistical difference from estimate for previous year shown (p.05). 6 section six 68 t h e k a i s e r fa m i ly f o u n d at i o n - a n d - h e a lt h r e s e a r C h e d u C at i o n a l t r u s t
  • 83.
    Employer Health Benefits 2 0 0 9 An n u a l s u r ve y e x h i B i t 6.2 average m onthly Worker Premium Contributions Paid by Covered Wor kers for single and family Coverage, 1999–2009 $500 $450 $400 $350 $293 $300 $273* $280 $248* $250 $222* $226 $201* $200 $178* $149* $129 $135 Worker and Employer Contributions for Premiums $150 $100 $52 $58* $60 $65 $39* $42 $47 $51 $50 $27 $28 $30 $0 1999 2000 2001 2002 2003 2004 2005 2006 2007 2008 2009 source: FAMILY COVERAGE kaiser/hret survey of employer-sponsored health Benefits, 1999–2009. SINGLE COVERAGE * estimate is statistically different from estimate for the previous year shown (p.05). 6 section six 69 t h e k a i s e r fa m i ly f o u n d at i o n - a n d - h e a lt h r e s e a r C h e d u C at i o n a l t r u s t
  • 84.
    Employer Health Benefits 2 0 0 9 A n n u a l s u r ve y e x h i B i t 6. 3 average annual Worker and employer Contr ibutions to Premiums and total Premiums for single Coverage, 1999–2009 1999 $318 $1,878 $2,196 2000 $334 $2,137* $2,471* 2001 $355 $2,334* $2,689* 2002 $466* $2,617* $3,083* 2003 $508 $2,875* $3,383* 2004 $558 $3,136* $3,695* 2005 $610 $3,413* $4,024* 2006 $627 $3,615* $4,242* Worker and Employer Contributions for Premiums 2007 $694* $3,785 $4,479* 2008 $721 $3,983 $4,704* 2009 $779 $4,045 $4,824 $0 $500 $1,000 $1,500 $2,000 $2,500 $3,000 $3,500 $4,000 $4,500 $5,000 source: WORKER CONTRIBUTION kaiser/hret survey of employer-sponsored health Benefits, 1999–2009. EMPLOYER CONTRIBUTION * estimate is statistically different from estimate for the previous year shown (p.05). 6 section six 70 t h e k a i s e r fa m i ly f o u n d at i o n - a n d - h e a lt h r e s e a r C h e d u C at i o n a l t r u s t
  • 85.
    Employer Health Benefits 2 0 0 9 An n u a l s u r ve y e x h i B i t 6.4 average annual Worker and employer Contr ibutions to Premiums and total Premiums for family Coverage, 1999–2009 1999 $1,543 $4,247 $5,791 2000 $1,619 $4,819* $6,438* 2001 $1,787* $5,269* $7,061* 2002 $2,137* $5,866* $8,003* 2003 $2,412* $6,657* $9,068* 2004 $2,661* $7,289* $9,950* 2005 $2,713 $8,167* $10,880* $2,973* $8,508* $11,480* Worker and Employer Contributions for Premiums 2006 2007 $3,281* $8,824 $12,106* 2008 $3,354 $9,325* $12,680* 2009 $3,515 $9,860* $13,375* $0 $2,000 $4,000 $6,000 $8,000 $10,000 $12,000 $14,000 source: WORKER CONTRIBUTION kaiser/hret survey of employer-sponsored health Benefits, 1999–2009. EMPLOYER CONTRIBUTION * estimate is statistically different from estimate for the previous year shown (p.05). 6 section six 71 t h e k a i s e r fa m i ly f o u n d at i o n - a n d - h e a lt h r e s e a r C h e d u C at i o n a l t r u s t
  • 86.
    Employer Health Benefits 2 0 0 9 A n n u a l s u r ve y e x h i B i t 6. 5 average annual firm and Worker Premium Contr ibutions and total Premiums for Covered Workers for single and family Coverage, by Plan type, 2009 HMO SINGLE $817 $4,061 $4,878 FAMILY $3,685 $9,785 $13,470 PPO SINGLE $806 $4,116 $4,922 FAMILY $3,470 $10,249* $13,719 POS SINGLE $741 $4,093 $4,835 FAMILY $4,146* $8,929* $13,075 Worker and Employer Contributions for Premiums HDHP/SO $540* SINGLE $3,446* $3,986* FAMILY $2,672* $8,411* $11,083* ALL PLANS SINGLE $779 $4,045 $4,824 FAMILY $3,515 $9,860 $13,375 $0 $2,000 $4,000 $6,000 $8,000 $10,000 $12,000 $14,000 source: WORKER CONTRIBUTION kaiser/hret survey of employer-sponsored health Benefits, 2009. EMPLOYER CONTRIBUTION * estimate is statistically different from all Plans estimate by coverage type (p.05). 6 section six 72 t h e k a i s e r fa m i ly f o u n d at i o n - a n d - h e a lt h r e s e a r C h e d u C at i o n a l t r u s t
  • 87.
    Employer Health Benefits 2 0 0 9 An n u a l s u r ve y e x h i B i t 6.6 average annual Worker Contributions for Covered Wor kers with single Coverage, by fir m size, 1999–2009 $1,000 $900 $854* $800 $759* $769 $689 $700 $638* $600 $578 $536 $624 $625 $495* $561 $500 $556 $513 $515 $380 $450 $400 $363 $334 $406* Worker and Employer Contributions for Premiums $300 $306 $286 $280 $200 $100 $0 1999 2000 2001 2002 2003 2004 2005 2006 2007 2008 2009 source: ALL SMALL FIRMS kaiser/hret survey of employer-sponsored health Benefits, 1999–2009. 3 199 WORKERS ALL LARGE FIRMS 200 OR MORE WORKERS * estimate is statistically different from estimate for the previous year shown (p.05). 6 section six 73 t h e k a i s e r fa m i ly f o u n d at i o n - a n d - h e a lt h r e s e a r C h e d u C at i o n a l t r u s t
  • 88.
    Employer Health Benefits 2 0 0 9 A n n u a l s u r ve y e x h i B i t 6. 7 average annual Worker Contributions for Covered Wor kers with family Coverage, by fir m size, 1999–2009 $5,000 $4,236* $4,101 $4,204 $4,000 $3,550 $3,382* $3,170 $2,970 $3,000 $2,647* $3,182 $2,982 $2,254* $2,831 $2,658 $1,940 $2,487 $1,831 $2,340* $2,000 $2,146* $1,893* Worker and Employer Contributions for Premiums $1,551 $1,398 $1,453 $1,000 $0 1999 2000 2001 2002 2003 2004 2005 2006 2007 2008 2009 source: ALL SMALL FIRMS kaiser/hret survey of employer-sponsored health Benefits, 1999–2009. 3 199 WORKERS ALL LARGE FIRMS 200 OR MORE WORKERS * estimate is statistically different from estimate for the previous year shown (p.05). 6 section six 74 t h e k a i s e r fa m i ly f o u n d at i o n - a n d - h e a lt h r e s e a r C h e d u C at i o n a l t r u s t
  • 89.
    Employer Health Benefits 2 0 0 9 An n u a l s u r ve y e x h i B i t 6.8 average annual Worker Premium Contributions Paid by Covered Wor kers for single and family Coverage, by firm size, 1999–2009 single Coverage family Coverage all small firms all large firms all small firms all large firms (3–199 Workers) (200 or more Workers) (3–199 Workers) (200 or more Workers) 1999 $286 $334 $1,831* $1,398* 2000 $280* $363* $1,940* $1,453* 2001 $306* $380* $2,254* $1,551* 2002 $406* $495* $2,647* $1,893* 2003 $450 $536 $2,970* $2,146* 2004 $513 $578 $3,382* $2,340* 2005 $556 $638 $3,170* $2,487* Worker and Employer Contributions for Premiums 2006 $515* $689* $3,550* $2,658* 2007 $561* $759* $4,236* $2,831* 2008 $624* $769* $4,101* $2,982* 2009 $625* $854* $4,204* $3,182* source: kaiser/hret survey of employer-sponsored health Benefits, 1999–2009. * estimate is statistically different between all small firms and all large firms within year (p.05). 6 section six 75 t h e k a i s e r fa m i ly f o u n d at i o n - a n d - h e a lt h r e s e a r C h e d u C at i o n a l t r u s t
  • 90.
    Employer Health Benefits 2 0 0 9 A n n u a l s u r ve y e x h i B i t 6. 9 average annual firm and Worker Premium Contr ibutions and total Premiums for Covered Workers for single Coverage, by Plan type and fir m size, 2009 Worker employer total Premium Contribution Contribution hmo all small firms (3–199 Workers) $714 $3,828 $4,542 all large firms (200 or more Workers) $855 $4,148 $5,003 ppo all small firms (3–199 Workers) $619* $4,329* $4,948 all large firms (200 or more Workers) $878* $4,035* $4,913 pos all small firms (3–199 Workers) $677 $4,146 $4,824 Worker and Employer Contributions for Premiums all large firms (200 or more Workers) $845 $4,007 $4,853 hDhp/so all small firms (3–199 Workers) $457* $3,420 $3,877 all large firms (200 or more Workers) $622* $3,472 $4,094 All plANs all small firms (3–199 Workers) $625* $4,092 $4,717 all large firms (200 or more Workers) $854* $4,022 $4,876 source: kaiser/hret survey of employer-sponsored health Benefits, 2009. * estimates are statistically different within plan type between all small firms and all large firms (p.05). 6 section six 76 t h e k a i s e r fa m i ly f o u n d at i o n - a n d - h e a lt h r e s e a r C h e d u C at i o n a l t r u s t
  • 91.
    Employer Health Benefits 2 0 0 9 An n u a l s u r ve y e x h i B i t 6.1 0 average annual firm and Worker Premium Contr ibutions and total Premiums for Covered Wor kers for family Coverage, by Plan type and fir m size, 2009 Worker employer total Premium Contribution Contribution hmo all small firms (3–199 Workers) $5,039* $7,216* $12,256* all large firms (200 or more Workers) $3,214* $10,679* $13,893* ppo all small firms (3–199 Workers) $4,100* $9,292* $13,392 all large firms (200 or more Workers) $3,231* $10,613* $13,844 pos all small firms (3–199 Workers) $4,647* $8,200* $12,847 Worker and Employer Contributions for Premiums all large firms (200 or more Workers) $3,348* $10,091* $13,439 hDhp/so all small firms (3–199 Workers) $2,920 $7,339* $10,259* all large firms (200 or more Workers) $2,430 $9,455* $11,885* All plANs all small firms (3–199 Workers) $4,204* $8,493* $12,696* all large firms (200 or more Workers) $3,182* $10,522* $13,704* source: kaiser/hret survey of employer-sponsored health Benefits, 2009. * estimates are statistically different within plan type between all small firms and all large firms (p.05). 6 section six 77 t h e k a i s e r fa m i ly f o u n d at i o n - a n d - h e a lt h r e s e a r C h e d u C at i o n a l t r u s t
  • 92.
    Employer Health Benefits 2 0 0 9 A n n u a l s u r ve y e x h i B i t 6. 11 average m onthly and annual Worker Premium Contr ibutions Paid by Covered Wor kers for single and family Coverage, by Plan type and fir m size, 2009 monthly annual single Coverage family Coverage single Coverage family Coverage hmo all small firms (3–199 Workers) $59 $420* $714 $5,039* all large firms (200 or more Workers) 71 268* 855 3,214* All firm sizes $68 $307 $817 $3,685 ppo all small firms (3–199 Workers) $52* $342* $619* $4,100* all large firms (200 or more Workers) 73* 269* 878* 3,231* All firm sizes $67 $289 $806 $3,470 Worker and Employer Contributions for Premiums pos all small firms (3–199 Workers) $56 $387* $677 $4,647* all large firms (200 or more Workers) 70 279* 845 3,348* All firm sizes $62 $346 $741 $4,146 hDhp/so all small firms (3–199 Workers) $38* $243 $457* $2,920 all large firms (200 or more Workers) 52* 202 622* 2,430 All firm sizes $45 $223 $540 $2,672 All plANs all small firms (3–199 Workers) $52* $350* $625* $4,204* all large firms (200 or more Workers) 71* 265* 854* 3,182* All firm sizes $65 $293 $779 $3,515 source: 6 kaiser/hret survey of employer-sponsored health Benefits, 2009. section six * estimates are statistically different within plan type between all small firms and all large firms (p.05). 78 t h e k a i s e r fa m i ly f o u n d at i o n - a n d - h e a lt h r e s e a r C h e d u C at i o n a l t r u s t
  • 93.
    Employer Health Benefits 2 0 0 9 An n u a l s u r ve y e x h i B i t 6.1 2 average m onthly and annual Worker Premium Contr ibutions Paid by Covered Wor kers for single and family Coverage, by Plan type and region, 2009 monthly annual single Coverage family Coverage single Coverage family Coverage hmo northeast $87* $283 $1,043* $3,390 midwest 66 262 796 3,142 south 66 318 795 3,822 West 57 329 685 3,950 All regioNs $68 $307 $817 $3,685 ppo northeast $78* $277 $941* $3,319 midwest 71 278 847 3,330 Worker and Employer Contributions for Premiums south 63 300 751 3,596 West 61 296 728 3,550 All regioNs $67 $289 $806 $3,470 pos northeast $79 $334 $946 $4,007 midwest 65 272* 777 3,262* south 58 382 698 4,588 West 49 358 591 4,296 All regioNs $62 $346 $741 $4,146 hDhp/so northeast $47 $227 $559 $2,730 midwest 49 198 588 2,375 south 51 250 606 2,999 West 30* 223 354* 2,681 All regioNs $45 $223 $540 $2,672 6 All plANs section six northeast $79* $282 $946* $3,381 midwest 67 264* 799 3,174* south 62 308 743 3,699 West 56* 307 667* 3,682 All regioNs $65 $293 $779 $3,515 source: kaiser/hret survey of employer-sponsored health Benefits, 2009. * estimate is statistically different within plan type from estimate for all other firms not in the indicated region (p.05). 79 t h e k a i s e r fa m i ly f o u n d at i o n - a n d - h e a lt h r e s e a r C h e d u C at i o n a l t r u s t
  • 94.
    Employer Health Benefits 2 0 0 9 A n n u a l s u r ve y e x h i B i t 6. 13 average m onthly Worker Premium Contr ibutions Paid by Covered Wor kers for single and family Coverage, by Plan type, 1999–2009 1999 2000 2001 2002 2003 2004 2005 2006 2007 2008 2009 single Coverage hmo $28 $26 $32 $38 $42 $46 $47 $49 $59 $59 $68 PPo 27 29 29 39* 44 48 50 53 60* 61 67* Pos 27 28 29 40* 41 45 61* 53 52 72 62 hdhP/so ^ ^ ^ ^ ^ ^ ^ 47 43 39 45 All plANs $27 $28 $30 $39* $42 $47 $51 $52 $58* $60 $65 family Coverage hmo $124 $131 $150 $164 $179 $223* $217 $257* $276 $282 $307 PPo 128 141 153 188* 210* 224 220 243* 270* 279 289 Pos 141 136 143 180* 206 218 271* 269 305 311 346 Worker and Employer Contributions for Premiums hdhP/so ^ ^ ^ ^ ^ ^ ^ 187 238 234 223 All plANs $129 $135 $149* $178* $201* $222* $226 $248* $273* $280 $293 source: kaiser/hret survey of employer-sponsored health Benefits, 1999–2009. * estimate is statistically different from estimate for the previous year shown (p.05). ^ information was not obtained for hdhP/sos prior to 2006. e x h i B i t 6. 14 distr ibution of Worker Premium Contr ibutions for single and family Coverage r elative to the average annual Worker Premium Contr ibution, 2009 single Coverage family Coverage 6 Premium range, Percent Covered Premium range, Percent Covered dollar amount Workers in range dollar amount Workers in range section six less than $623 41% less than $2,812 43% $623 to $779 11% $2,812 to $3,515 15% $779 to $935 11% $3,515 to $4,218 13% $935 or more 37% $4,218 or more 28% source: kaiser/hret survey of employer-sponsored health Benefits, 2009. note: the average annual worker contribution is $779 for single coverage and $3,515 for family coverage. the worker contribution distribution is relative to the average single or family worker contribution. for example, $623 is 80% of the average single worker contribution and $935 is 120% of the average single worker contribution. the same break points relative to the average are used for the distribution for family coverage. 80 t h e k a i s e r fa m i ly f o u n d at i o n - a n d - h e a lt h r e s e a r C h e d u C at i o n a l t r u s t
  • 95.
    Employer Health Benefits 2 0 0 9 An n u a l s u r ve y e x h i B i t 6.1 5 distr ibution of Percentage of Premium Paid by Covered Wor kers for single and family Coverage, 2001–2009 SINGLE COVERAGE 2001 32% 50% 15% 3% 2002* 24% 58% 13% 5% 2003* 24% 57% 17% 3% 2004* 21% 56% 21% 2% 2005 21% 57% 19% 3% 2006 23% 56% 18% 2% 2007 20% 56% 21% 2% 2008 20% 59% 19% 2% 2009* 18% 58% 22% 1% Worker and Employer Contributions for Premiums FAMILY COVERAGE 2001 14% 44% 27% 15% 2002* 9% 46% 29% 16% 2003* 8% 47% 31% 14% 2004* 7% 44% 36% 13% 2005* 9% 46% 32% 13% 2006 9% 42% 37% 12% 2007* 6% 47% 31% 15% 2008 7% 46% 33% 14% 2009 6% 48% 33% 12% 0% 20% 40% 60% 80% 100% source: 0% kaiser/hret survey of employer-sponsored health Benefits, 2001–2009. GREATER THAN 0%, LESS THAN OR EQUAL TO 25% * distribution is statistically different within coverage type from distribution GREATER THAN 25%, LESS THAN OR EQUAL TO 50% 6 GREATER THAN 50% for the previous year shown (p.05). section six 81 t h e k a i s e r fa m i ly f o u n d at i o n - a n d - h e a lt h r e s e a r C h e d u C at i o n a l t r u s t
  • 96.
    Employer Health Benefits 2 0 0 9 A n n u a l s u r ve y e x h i B i t 6. 16 distr ibution of Percentage of Premium Paid by Covered Wor kers for single Coverage, by fir m size, 2001–2009 ALL SMALL FIRMS 3 199 WORKERS 2001 57% 25% 13% 5% 2002* 45% 35% 13% 8% 2003 45% 35% 14% 6% 2004 42% 35% 17% 5% 2005 41% 36% 18% 6% 2006 43% 38% 14% 4% 2007 44% 36% 16% 4% 2008 40% 40% 16% 5% 2009 39% 40% 19% 3% Worker and Employer Contributions for Premiums ALL LARGE FIRMS 200 OR MORE 2001 19% 63% 16% 2% WORKERS 2002* 14% 69% 14% 4% 2003* 14% 67% 18% 1% 2004* 11% 65% 23% 1% 2005 12% 67% 20% 1% 2006 13% 66% 20% 1% 2007* 9% 66% 23% 2% 2008 10% 68% 20% 1% 2009* 8% 67% 24% 1% 0% 20% 40% 60% 80% 100% source: 0% kaiser/hret survey of employer-sponsored health Benefits, 2001–2009. GREATER THAN 0%, LESS THAN OR EQUAL TO 25% 6 * distribution is statistically different within size category from distribution GREATER THAN 25%, LESS THAN OR EQUAL TO 50% GREATER THAN 50% for the previous year shown (p.05). section six 82 t h e k a i s e r fa m i ly f o u n d at i o n - a n d - h e a lt h r e s e a r C h e d u C at i o n a l t r u s t
  • 97.
    Employer Health Benefits 2 0 0 9 An n u a l s u r ve y e x h i B i t 6.1 7 distr ibution of Percentage of Premium Paid by Covered Wor kers for family Coverage, by fir m size, 2001–2009 ALL SMALL FIRMS 3 199 WORKERS 2001 27% 18% 25% 30% 2002* 18% 23% 28% 31% 2003 15% 28% 26% 31% 2004* 15% 17% 39% 28% 2005* 18% 22% 37% 23% 2006 17% 20% 38% 24% 2007* 13% 25% 25% 37% 2008* 13% 27% 31% 30% 2009 14% 28% 28% 30% Worker and Employer Contributions for Premiums ALL LARGE FIRMS 200 OR MORE 2001 7% 57% 28% 8% WORKERS 2002 5% 57% 29% 9% 2003* 4% 57% 33% 6% 2004 4% 56% 34% 6% 2005 5% 57% 30% 7% 2006* 5% 54% 36% 5% 2007* 3% 58% 34% 5% 2008 4% 56% 34% 6% 2009* 2% 58% 36% 4% 0% 20% 40% 60% 80% 100% source: 0% kaiser/hret survey of employer-sponsored health Benefits, 2001–2009. GREATER THAN 0%, LESS THAN OR EQUAL TO 25% * distribution is statistically different within size category from distribution GREATER THAN 25%, LESS THAN OR EQUAL TO 50% 6 GREATER THAN 50% for the previous year shown (p.05). section six 83 t h e k a i s e r fa m i ly f o u n d at i o n - a n d - h e a lt h r e s e a r C h e d u C at i o n a l t r u s t
  • 98.
    Employer Health Benefits 2 0 0 9 A n n u a l s u r ve y e x h i B i t 6. 18 average Percentage of Premiums Paid by Covered Wor kers for single Coverage, by fir m Charac teristics, 2009 all large firms all small firms (200 or more all firms (3–199 Workers) Workers) Wage level few Workers are lower-Wage (less than 35% earn 13%* 18% 16%* $23,000 a year or less) many Workers are lower-Wage (35% or more earn 20%* 19% 20%* $23,000 a year or less) unions firm has at least some union Workers 8%* 17% 16% firm does not have any union Workers 15%* 19% 17% Worker and Employer Contributions for Premiums Age less than 35% of Workers are 26 years old or less 14% 18% 17% 35% or more Workers are 26 years old or less 15% 21% 19% funding Arrangement fully insured 14% 18% 15%* self-funded 15% 18% 18%* source: kaiser/hret survey of employer-sponsored health Benefits, 2009. * estimates are statistically different from each other within firm size category (p.05). 6 section six 84 t h e k a i s e r fa m i ly f o u n d at i o n - a n d - h e a lt h r e s e a r C h e d u C at i o n a l t r u s t
  • 99.
    Employer Health Benefits 2 0 0 9 An n u a l s u r ve y e x h i B i t 6.1 9 average Percentage of Premium Paid by Covered Wor kers for family Coverage, by fir m Charac ter istics, 2009 all large firms all small firms (200 or more all firms (3–199 Workers) Workers) Wage level few Workers are lower-Wage (less than 35% earn 33%* 23%* 26%* $23,000 a year or less) many Workers are lower-Wage (35% or more earn 46%* 29%* 35%* $23,000 a year or less) unions firm has at least some union Workers 26% 21%* 21%* firm does not have any union Workers 35% 26%* 30%* Worker and Employer Contributions for Premiums Age less than 35% of Workers are 26 years old or less 34% 23%* 27%* 35% or more Workers are 26 years old or less 41% 29%* 33%* funding Arrangement fully insured 36% 27%* 33%* self-funded 29% 23%* 23%* source: kaiser/hret survey of employer-sponsored health Benefits, 2009. * estimates are statistically different from each other within firm size category (p.05). 6 section six 85 t h e k a i s e r fa m i ly f o u n d at i o n - a n d - h e a lt h r e s e a r C h e d u C at i o n a l t r u s t
  • 100.
    Employer Health Benefits 2 0 0 9 A n n u a l s u r ve y e x h i B i t 6. 20 average Percentage of Premium Paid by Covered Workers for single and family Coverage, by Plan type and firm size, 2009 single Coverage family Coverage hmo all small firms (3–199 Workers) 18% 42%* all large firms (200 or more Workers) 18 23* All firm sizes 18% 28% ppo all small firms (3–199 Workers) 13%* 33%* all large firms (200 or more Workers) 19* 24* All firm sizes 17% 26% pos Worker and Employer Contributions for Premiums all small firms (3–199 Workers) 15% 36%* all large firms (200 or more Workers) 18 25* All firm sizes 16% 32% hDhp/so all small firms (3–199 Workers) 12% 28%* all large firms (200 or more Workers) 15 21* All firm sizes 14% 25% All plANs all small firms (3–199 Workers) 14%* 35%* all large firms (200 or more Workers) 18* 24* All firm sizes 17% 27% source: 6 kaiser/hret survey of employer-sponsored health Benefits, 2009. * estimates are statistically different within plan type between all small firms and all large firms (p.05). section six 86 t h e k a i s e r fa m i ly f o u n d at i o n - a n d - h e a lt h r e s e a r C h e d u C at i o n a l t r u s t
  • 101.
    Employer Health Benefits 2 0 0 9 An n u a l s u r ve y e x h i B i t 6.2 1 average Percentage of Premium Paid by Covered Workers for single and family Coverage, by Plan type, 1999–2009 1999 2000 2001 2002 2003 2004 2005 2006 2007 2008 2009 single Coverage hmo 16% 14% 18% 16% 17% 16% 16% 15% 17% 16% 18% PPo 13 14 13 16* 16 16 15 15 17 16 17 Pos 15 14 13 16* 16 16 19 16 14 18 16 hdhP/so ^ ^ ^ ^ ^ ^ ^ 18 15 11 14 All plANs 14% 14% 14% 16% 16% 16% 16% 16% 16% 16% 17% family Coverage hmo 28% 26% 29% 27% 26% 29% 26% 28% 28% 26% 28% PPo 26 27 26 29* 28 27 25 26 27 27 26 Pos 28 26 25 28 28 28 31 30 32 31 32 Worker and Employer Contributions for Premiums hdhP/so ^ ^ ^ ^ ^ ^ ^ 25 27 29 25 All plANs 27% 26% 26% 28% 27% 28% 26% 27% 28% 27% 27% source: kaiser/hret survey of employer-sponsored health Benefits, 1999–2009. * estimate is statistically different from estimate for the previous year shown (p.05). ^ information was not obtained for hdhP/sos prior to 2006. 6 section six 87 t h e k a i s e r fa m i ly f o u n d at i o n - a n d - h e a lt h r e s e a r C h e d u C at i o n a l t r u s t
  • 102.
    Employer Health Benefits 2 0 0 9 A n n u a l s u r ve y e x h i B i t 6. 22 average Percentage of Premium Paid by Covered Workers for single and family Coverage, by Plan type and region, 2009 single Coverage family Coverage hmo northeast 21%* 25% midwest 17 23* south 17 29 West 16 33 All regioNs 18% 28% ppo northeast 19% 23%* midwest 18 25 south 16 28 Worker and Employer Contributions for Premiums West 16 28 All regioNs 17% 26% pos northeast 20% 30% midwest 17 26 south 15 37 West 14 31 All regioNs 16% 32% hDhp/so northeast 14% 27% midwest 15 21 south 15 26 West 9* 26 All regioNs 14% 25% 6 All plANs northeast 19%* 25%* section six midwest 17 24* south 16 29 West 15 30 All regioNs 17% 27% source: kaiser/hret survey of employer-sponsored health Benefits, 2009. * estimate is statistically different within plan type from estimate for all other firms not in the indicated region (p.05). 88 t h e k a i s e r fa m i ly f o u n d at i o n - a n d - h e a lt h r e s e a r C h e d u C at i o n a l t r u s t
  • 103.
    Employer Health Benefits 2 0 0 9 An n u a l s u r ve y e x h i B i t 6.2 3 average Percentage of Premium Paid by Covered Wor kers, by Plan type and i ndustr y, 2009 single Coverage family Coverage hmo agriculture/mining/Construction nsd nsd manufacturing 18% 28% transportation/Communications/utilities 15 21 Wholesale nsd nsd retail 24 49* finance 19 29 service 17 31 state/local Government 11* 19* health Care 14 20* All iNDusTries 18% 28% Worker and Employer Contributions for Premiums ppo agriculture/mining/Construction 18% 31% manufacturing 19 24 transportation/Communications/utilities 16 20* Wholesale 24* 32* retail 21 32* finance 20 27 service 16 27 state/local Government 11* 23 health Care 13* 24 All iNDusTries 17% 26% pos agriculture/mining/Construction nsd nsd manufacturing 16% 26% transportation/Communications/utilities nsd nsd Wholesale nsd nsd 6 retail nsd nsd finance nsd nsd section six service 13 31 state/local Government nsd nsd health Care 13 38 All iNDusTries 16% 32% Continued on next page 89 t h e k a i s e r fa m i ly f o u n d at i o n - a n d - h e a lt h r e s e a r C h e d u C at i o n a l t r u s t
  • 104.
    Employer Health Benefits 2 0 0 9 A n n u a l s u r ve y e x h i B i t 6. 23 Continued from previous page average Percentage of Premium Paid by Covered Wor kers, by Plan type and i ndustr y, 2009 single Coverage family Coverage hDhp/so agriculture/mining/Construction nsd nsd manufacturing 18% 21% transportation/Communications/utilities nsd nsd Wholesale nsd nsd retail nsd nsd finance 10 22 service 12 26 state/local Government nsd nsd health Care 11 30 All iNDusTries 14% 25% Worker and Employer Contributions for Premiums All plANs agriculture/mining/Construction 19% 33% manufacturing 19 25 transportation/Communications/utilities 16 20* Wholesale 23* 31 retail 22* 36* finance 18 27 service 16 28 state/local Government 10* 21* health Care 13* 25 All iNDusTries 17% 27% source: kaiser/hret survey of employer-sponsored health Benefits, 2009. 6 * estimate is statistically different within plan type from estimate for all other firms not in the indicated industry (p.05). nsd: not sufficient data. section six 90 t h e k a i s e r fa m i ly f o u n d at i o n - a n d - h e a lt h r e s e a r C h e d u C at i o n a l t r u s t
  • 105.
    60% $4,8 2 4 Employer Health Benefits $ 13,375 2009 annual surVey Employee Cost Sharing section 7 2009
  • 106.
    Employer Health Benefits 2 0 0 9 A n n u a l s u r ve y e M p loy e e Co S t S h a r i n g in addiTion To any required premium conTribuTions , covered workers may face cosT sharing for The medical services ThaT They use . c osT sharing for medical services can Take a varieTy of forms , including deducTibles ( an amounT ThaT musT be paid before some or all ser vices are covered ), copaymenTs ( fixed dollar amounTs ), and / or coinsurance ( a percenTage of The charge for ser vices ). T he Type and level of cosT sharing ofTen varies by The Type of plan in which The worker is enrolled . c osT sharing may also vary by The Type of service received such as office visiTs , hospiTalizaTions , or prescripTion drugs . T he cosT sharing amounTs reporTed here are for covered workers using services provided in - neTwork by parTicipaTing providers . p lan enrollees receiving services from providers ThaT do noT parTicipaTe in plan neTworks ofTen musT pay higher deducTibles , copaymenTs , or coinsurance , and may be responsible for charges ThaT exceed plan allowable amounTs . we also would noTe ThaT we do noT collecT informaTion on all of The plan provisions and limiTs ThaT affecT enrollee ouT - of - pockeT liabiliTy. a lThough we have increased The number of survey quesTions abouT cosT - sharing liabiliTy, we cannoT reasonably wiTh The framework of This sur vey capTure all of The complex cosT - sharing requiremenTs in modern plans , par Ticularly Those for ancillar y ser vices ( such as durable medical equipmenT or physical Therapy ) or ThaT vary across differenT seTTings ( such as Tiered neTworks ). geNerAl ANNuAl DeDuC Tibles POS plans, and 66% of workers in PPOs are  A general annual deductible is an amount that must in plans that require cost sharing for hospital be paid by the enrollee before all or most services admissions (Exhibit 7.2). The percentages are are covered by their health plan. The likelihood of similar for family coverage. having a deductible varies by plan type.  Deductibles vary greatly by plan type and firm size.  Workers in HMOs are least likely to have a For most plan types, the deductible levels for single Employee Cost Sharing general annual deductible for single coverage. and family coverage are similar to the amounts Eighty-four percent of workers in HMOs with reported in 2008. single coverage do not have a general annual  From 2008 to 2009, the average annual deductible, compared to 38% of workers in POS deductible for workers in HMOs increased plans and 26% of workers in PPOs (Exhibit 7.1). from $503 to $699 for single coverage (Exhibit The percentages are similar for family coverage. 7.5) and from $1,053 to $1,524 for family There has been no change in the percentage of coverage (Exhibit 7.12). For each of the other workers without a general annual deductible plan types, there is no statistically significant 7 since 2008; however, for POS plans, since 2007, the percentage of workers without a deductible increase from 2008 to 2009 for single or family coverage. Since 2006, the earliest year for which decreased from 52% to 38% for workers with we have comparable deductible data, the average section seven single coverage. deductible for workers with PPOs has increased  Workers without a general annual plan from $473 in 2006 to $634 in 2009 for single deductible often have other forms of cost sharing coverage (Exhibit 7.5) and, for aggregate family for medical services. For workers without a deductibles, from $1,034 in 2006 to $1,488 in general annual deductible for single coverage, 2009 (Exhibit 7.12). 68% of workers in HMOs, 71% of workers in 92 t h e k a i s e r fa m i ly f o u n d at i o n - a n d - h e a lt h r e s e a r C h e d u C at i o n a l t r u s t
  • 107.
    Employer Health Benefits 2 0 0 9 An n u a l s u r ve y  For PPOs, POS plans, and HDHP/SOs, the  The percentage of workers with deductibles of $1,000 average annual deductibles among those workers or more for single coverage continues to increase. with a deductible for single coverage are $634,  From 2006 to 2009, the percentage of covered $1,061, and $1,838, respectively (Exhibit 7.5). workers with a deductible of $1,000 or more  Deductibles are generally higher for covered for single coverage has more than doubled, workers in plans sponsored by small firms (3–199 from 10% to 22%. Workers in small firms workers) than covered workers in large firms (200 (3–199 workers) are more likely to have a general or more workers) (Exhibit 7.3). annual deductible of $1,000 or more for single coverage than workers in large firms (200 or  For family coverage, the majority of workers with more workers) (40% vs. 13%) (Exhibit 7.6). general annual deductibles have an aggregate In the past year, for workers in large firms, the deductible, meaning all family members’ out- percentage has grown from 9% in 2008 to 13% of-pocket expenses count toward meeting the in 2009, while there has been no significant deductible amount. Among those with a general increase in the percentage of workers in small annual deductible for family coverage, the firms with high deductibles (Exhibit 7.7). percentage of covered workers with an aggregate general annual deductible ranges from 62% for  The majority of covered workers with a deductible PPOs to 89% for HDHP/SOs. are in plans where the deductible does not have to be met before certain services, such as physician  The average amounts for workers with an office visits, preventive care, or prescription drugs, aggregate deductible for family coverage are are covered. $1,524 for HMOs, $1,488 for PPOs, $2,191 for POS plans, and $3,626 for HDHP/SOs  Roughly three-quarters of covered workers with (Exhibit 7.11). general plan deductibles in PPOs and POS plans and over four-fifths in HMOs are enrolled in  The other type of family deductible, a separate plans where the deductible does not have to be per-person deductible, requires each family met before physician office visits for primary care member to meet a separate per-person deductible are covered and about 90% of covered workers in amount before the plan covers expenses for that HMOs, PPOs, POS plans, and HDHP/SOs do member. Most plans with separate per-person not have to meet the deductible before preventive family deductibles consider the deductible met care is covered (Exhibit 7.16). if a prescribed number of family members each reach their separate deductible amounts.  Similarly, among workers with a general annual deductible, almost 90% of covered workers in  For covered workers in health plans that have HMOs and about 90% of workers in PPOs and Employee Cost Sharing separate per-person general annual deductible POS plans are enrolled in plans where the general amounts for family coverage, the average plan annual deductible does not have to be met before deductible amounts are $686 for HMOs, $633 prescription drugs are covered (Exhibit 7.16). for PPOs, $1,050 for POS plans, and $2,091 for HDHP/SOs (Exhibit 7.11). Most covered h o s p i TA l C o s T s h A r i N g workers in plans with a separate general annual  We continue to examine and sometimes modify deductible for family coverage have a limit to the questions on hospital and outpatient surgery the number of family members required to meet cost sharing because this can be a complex the separate deductible amounts (Exhibit 7.14). Among those workers in plans with a limit on the component of health benefit plans. As in past 7 years, we collected information on the cost- number of family members, the average number sharing provisions for hospital admissions and section seven of family members required to meet the separate outpatient surgery that is in addition to any deductible amounts is three for PPOs and two for general annual plan deductible. However, for HMOs, POS plans, and HDHP/SOs. the 2009 survey, in order to better capture the 93 t h e k a i s e r fa m i ly f o u n d at i o n - a n d - h e a lt h r e s e a r C h e d u C at i o n a l t r u s t
  • 108.
    Employer Health Benefits 2 0 0 9 A n n u a l s u r ve y prevalence of combinations of cost sharing, workers with cost sharing for each outpatient the survey was changed to ask a series of yes or surgery episode, the average coinsurance is 19%, no questions. Previously, the question asked the average copayment is $110, and the average respondents to select one response from a list of separate annual outpatient surgery deductible is types of cost sharing, such as separate deductibles, $500 (Exhibit 7.19). copayments, coinsurance, and per diem payments CosT shAriNg for physiCiAN offiCe visiTs (for hospitalization only). Due to the change in question format, the distribution of workers  The majority of covered workers are enrolled with types of cost sharing does not equal 100% as in health plans that require cost sharing for an workers may face a combination of types of cost in-network physician office visit, in addition to any sharing. In addition, the average copayment and general annual deductible.1 coinsurance rate for hospital admissions include  The most common form of physician office workers that may have a combination of types of visit cost sharing for in-network services is cost sharing. copayments. Seventy-seven percent of covered  Whether or not a worker has a general annual workers have a copayment for a physician office deductible, most workers face additional types of visit and 14% have coinsurance. Workers cost sharing when admitted to a hospital, such as a in HMOs, PPOs, and POS plans are much copayment, coinsurance, or a per diem charge. more likely to have copayments than workers in HDHP/SOs (Exhibit 7.20). The majority  The majority of workers have copayments or of workers in HDHP/SOs have coinsurance coinsurance when they are admitted to a hospital, (44%) or no cost sharing (39%) for physician whether or not the worker has a general annual office visits after the deductible is met deductible (Exhibit 7.17). Fifty-one percent (Exhibit 7.20). of covered workers have coinsurance and 19% have copayments for hospital admissions. Lower  Among covered workers with a copayment for percentages of workers have per day (per diem) in-network physician office visits, the average payments (5%), a separate hospital deductible copayment is $20 for primary care and $28 for (5%), or both copayments and coinsurance specialty physicians (Exhibit 7.21). In 2008, (8%), while 22% have no cost sharing for the average copayments were $19 for primary hospital admissions. For hospital admissions, care and $26 for specialty care. While the the average coinsurance rate is 18%, the average increases between 2008 and 2009 are small, they copayment is $234 per hospital admission, are statistically significant. Fifty-six percent of the average per diem charge is $179, and the covered workers have a copayment of $15 or average separate hospital deductible is $862 $20 for a primary care office visit (Exhibit 7.22). Employee Cost Sharing (Exhibit 7.19). For specialty care office visits, 32% of covered workers have copayments of $20 or $25  The cost-sharing provisions for outpatient surgery (Exhibit 7.23). are similar to those for hospital admissions, as most workers have coinsurance or copayments.  Fourteen percent of covered workers pay Fifty-three percent of covered workers have coinsurance and an additional 4% of covered coinsurance and 20% have copayments for an workers have both a copay and coinsurance, or outpatient surgery episode. In addition, 2% either copayments or coinsurance, whichever is have a separate annual deductible for outpatient greater (Exhibit 7.20). The average coinsurance 7 surgery, and 6% have both copayments and rate for a visit with a primary care physician is coinsurance, while 24% have no cost sharing for 18% (Exhibit 7.21). section seven an outpatient surgery (Exhibit 7.18). For covered noTe: 1 in 2009, the survey includes cost sharing for in-network services only. see the 2007 survey for information on out-of-network office visit cost sharing. 94 t h e k a i s e r fa m i ly f o u n d at i o n - a n d - h e a lt h r e s e a r C h e d u C at i o n a l t r u s t
  • 109.
    Employer Health Benefits 2 0 0 9 An n u a l s u r ve y ouT-of-poCkeT mAximum AmouNTs  For covered workers with out-of-pocket maximums,  Most covered workers are in a plan that partially or there is wide variation in spending limits. totally limits the cost sharing that a plan enrollee  Forty-two percent of workers with an out-of- must pay in a year. These limits are generally pocket maximum for single coverage have an out- referred to as out-of-pocket maximum amounts. of-pocket maximum of less than $2,000, while Enrollee cost sharing such as deductibles, office visit 26% have an out-of-pocket maximum of $3,000 cost sharing, or spending on prescription drugs may or more (Exhibit 7.28). or may not apply to the out-of-pocket maximum. Therefore, the survey asks what types of out-of-  Like deductibles, some plans have an aggregate pocket expenses plans count when determining out-of-pocket maximum amount for family whether a covered worker has met the plan out-of- coverage that applies to cost sharing for all family pocket maximum. When a plan does not count members, while others have a per-person out-of- certain types of spending, it effectively increases the pocket maximum that limits the amount of cost amount a worker may pay out-of-pocket. sharing that the family must pay on behalf of each family member. For covered workers with  Nineteen percent of covered workers enrolled in an aggregate out-of-pocket maximum for family single or family coverage are in a plan that does not coverage, 39% have an out-of-pocket maximum limit the amount of cost sharing enrollees have to of less than $4,000 (Exhibit 7.30). Among pay (Exhibit 7.26). workers with separate per-person out-of-pocket  Covered workers in HMOs are more likely to be limits for family coverage, 90% have out-of- enrolled in a plan that does not limit the amount pocket maximums of less than $4,000 of cost sharing (41%) than workers in PPOs (Exhibit 7.31). (14%) or POS plans (19%) (Exhibit 7.26). The  As noted above, covered workers with an out-of- percentage of workers without an out-of-pocket pocket maximum may be enrolled in a plan where maximum has not statistically changed in the not all spending counts toward the out-of-pocket past year. maximum, potentially exposing workers to higher  Covered workers without an out-of-pocket spending. maximum, however, may not have large cost-  Among workers enrolled in PPO plans with an sharing responsibilities. For example, 94% out-of-pocket maximum for single or family of covered workers in HMOs with no out-of- coverage, 34% are in plans that do not count pocket maximum for single coverage have no spending for the general annual deductible general annual deductible, and less than 1% have toward the out-of-pocket limit (Exhibit 7.27). coinsurance for a hospital admission or for each Employee Cost Sharing outpatient surgery episode.  It is more common for covered workers to be in plans that do not count prescription drug  HSA-qualified HDHPs are required by law to cost sharing toward the out-of-pocket limit. have an out-of-pocket maximum of no more For example, 85% of workers in PPOs and than $5,800 for single coverage and $11,600 for 78% in HMOs are in plans that do not count family coverage in 2009. HDHP/HRAs have no prescription drug spending towards the out-of- such requirement, and among workers enrolled pocket maximum (Exhibit 7.27). in these plans, 10% have no out-of-pocket maximum for single or family coverage. 7 section seven 95 t h e k a i s e r fa m i ly f o u n d at i o n - a n d - h e a lt h r e s e a r C h e d u C at i o n a l t r u s t
  • 110.
    Employer Health Benefits 2 0 0 9 A n n u a l s u r ve y e x h i B i t 7. 1 Percentage of Covered Wor kers With no G eneral annual health Plan d educ tible for single and family Coverage, by Plan type and fir m size, 2009 single Coverage family Coverage hmo 200–999 Workers 82% 82% 1,000–4,999 Workers 85 85 5,000 or more Workers 91* 91* All small firms (3–199 Workers) 73%* 71%* All large firms (200 or more Workers) 88%* 88%* All firm sizes 84% 84% ppo 200–999 Workers 27% 27% 1,000–4,999 Workers 30 30 5,000 or more Workers 24 24 All small firms (3–199 Workers) 26% 26% All large firms (200 or more Workers) 26% 26% All firm sizes 26% 26% pos 200–999 Workers 40% 40% 1,000–4,999 Workers 70* 70* 5,000 or more Workers 31 31 All small firms (3–199 Workers) 37% 37% All large firms (200 or more Workers) 42% 41% All firm sizes 38% 39% source: kaiser/hret survey of employer-sponsored health Benefits, 2009. Employee Cost Sharing * estimate is statistically different within plan type from estimate for all other firms not in the indicated size category (p.05). note: hdhP/sos are not shown because all covered workers in these plans face a minimum deductible. in hdhP/hra plans, as defined by the survey, the minimum deductible is $1,000 for single coverage and $2,000 for family coverage. in hsa-qualified hdhPs, the legal minimum deductible for 2009 is $1,150 for single coverage and $2,300 for family coverage. average general annual health plan deductibles for PPos, Pos plans, and hdhP/sos are for in-network services. 7 section seven 96 t h e k a i s e r fa m i ly f o u n d at i o n - a n d - h e a lt h r e s e a r C h e d u C at i o n a l t r u s t
  • 111.
    Employer Health Benefits 2 0 0 9 An n u a l s u r ve y e x h i B i t 7.2 among Covered Workers with no G eneral annual health Plan deduc tible for single and family Coverage, Percentage Who have the following types of Cost shar ing, by Plan type, 2009 ‡ single Coverage family Coverage separate Cost sharing for a hospital Admission hmo 68% 67% PPo 66 66 Pos 71 71 separate Cost sharing for an outpatient surgery episode hmo 63% 62% PPo 65 65 Pos 75 75 source: kaiser/hret survey of employer-sponsored health Benefits, 2009. ‡ separate cost sharing for each hospital admission includes the following types: separate annual deductible, copayment, coinsurance, and/or a charge per day (per diem). Cost sharing for each outpatient surgery episode includes the following types: separate annual deductible, copayment, and/or coinsurance. note: hdhP/sos are not shown because all covered workers in these plans face a deductible. in hdhP/hra plans, as defined by the survey, the minimum deductible is $1,000 for single coverage and $2,000 for family coverage. in hsa-qualified hdhPs, the legal minimum deductible for 2009 is $1,150 for single coverage and $2,300 for family coverage. average general annual health plan deductibles for PPos and Pos plans are for in-network services. Employee Cost Sharing 7 section seven 97 t h e k a i s e r fa m i ly f o u n d at i o n - a n d - h e a lt h r e s e a r C h e d u C at i o n a l t r u s t
  • 112.
    Employer Health Benefits 2 0 0 9 A n n u a l s u r ve y e x h i B i t 7. 3 among Covered Workers with a G eneral annual health Plan deduc tible for single Coverage, average d educ tible, by Plan type and fir m size, 2009 single Coverage hmo all small firms (3–199 Workers) $900* all large firms (200 or more Workers) 528* All firm sizes $699 ppo all small firms (3–199 Workers) $1,040* all large firms (200 or more Workers) 478* All firm sizes $634 pos all small firms (3–199 Workers) $1,268 all large firms (200 or more Workers) 695 All firm sizes $1,061 hDhp/so all small firms (3–199 Workers) $2,037* all large firms (200 or more Workers) 1,642* All firm sizes $1,838 source: kaiser/hret survey of employer-sponsored health Benefits, 2009. * estimates are statistically different within plan type between all small firms and all large firms (p.05). note: average general annual health plan deductibles for PPos, Pos plans, and hdhP/sos are for in-network services. Employee Cost Sharing 7 section seven 98 t h e k a i s e r fa m i ly f o u n d at i o n - a n d - h e a lt h r e s e a r C h e d u C at i o n a l t r u s t
  • 113.
    Employer Health Benefits 2 0 0 9 An n u a l s u r ve y e x h i B i t 7.4 among Covered Workers with a G eneral annual health Plan deduc tible for single Coverage, average d educ tible, by Plan type and region, 2009 single Coverage hmo northeast nsd midwest nsd south $741 West nsd All regioNs $699 ppo northeast $464* midwest 609 south 673 West 736 All regioNs $634 pos northeast nsd midwest $974 south 878 West 1,340 All regioNs $1,061 hDhp/so northeast $1,936 midwest 1,911 south 1,732 West 1,807 All regioNs $1,838 Employee Cost Sharing source: kaiser/hret survey of employer-sponsored health Benefits, 2009. * estimate is statistically different from estimate for all other firms not in the indicated region (p.05). nsd: not sufficient data. note: average general annual health plan deductibles for PPos, Pos plans, and hdhP/sos are for in-network services. 7 section seven 99 t h e k a i s e r fa m i ly f o u n d at i o n - a n d - h e a lt h r e s e a r C h e d u C at i o n a l t r u s t
  • 114.
    Employer Health Benefits 2 0 0 9 A n n u a l s u r ve y e x h i B i t 7. 5 among Covered Workers with a G eneral annual health Plan deduc tible for single Coverage, average d educ tible, by Plan type, 2006–2009 $2,000 $1,838 $1,812 $1,715 $1,729 $1,500 $1,061 $1,000 $752 $699* $634 $621 $560* $553 $503 $473 $461 $500 $401 $352 $0 HMO PPO POS HDHP/SO source: 2006 kaiser/hret survey of employer-sponsored health Benefits, 2006–2009. 2007 2008 * estimate is statistically different from estimate for the previous year shown by plan type (p.05). 2009 note: average general annual health plan deductibles for PPos, Pos plans, and hdhP/sos are for in-network services. Employee Cost Sharing 7 section seven 100 t h e k a i s e r fa m i ly f o u n d at i o n - a n d - h e a lt h r e s e a r C h e d u C at i o n a l t r u s t
  • 115.
    Employer Health Benefits 2 0 0 9 An n u a l s u r ve y e x h i B i t 7.6 Percentage of Covered Wor kers enrolled in a Plan with a h igh G eneral annual deduc tible for single Coverage, By firm size, 2009 100% 80% 60% 40% 40% 22% 20% 16% 13% 7% 3% 0% PERCENTAGE OF COVERED WORKERS PERCENTAGE OF COVERED WORKERS WITH A SINGLE DEDUCTIBLE OF $1,000 OR MORE* WITH A SINGLE DEDUCTIBLE OF $2,000 OR MORE* source: ALL SMALL FIRMS 3 199 WORKERS kaiser/hret survey of employer-sponsored health Benefits, 2009. ALL LARGE FIRMS 200 OR MORE WORKERS * estimate is statistically different between all small firms and all large firms within category (p.05). ALL FIRMS note: these estimates include workers enrolled in hdhP/so and other plan types. Because we do not collect information on the attributes of conventional plans, to be conservative, we assumed that workers in conventional plans do not have a deductible of $1,000 or more. Because of the low enrollment in conventional plans, the impact of this assumption is minimal. average general annual health plan deductibles for PPos, Pos plans, and hdhP/sos are for in-network services. Employee Cost Sharing 7 section seven 101 t h e k a i s e r fa m i ly f o u n d at i o n - a n d - h e a lt h r e s e a r C h e d u C at i o n a l t r u s t
  • 116.
    Employer Health Benefits 2 0 0 9 A n n u a l s u r ve y e x h i B i t 7. 7 Percentage of Covered Wor kers enrolled in a Plan with a G eneral annual d educ tible of $1,000 or m ore for single Coverage, By firm size, 2006–2009 50% 40% 40% 35%* 30% 21%* 22%* 20% 18%* 16% 12%* 10% 13%* 10% 9% 8% 6% 0% 2006 2007 2008 2009 source: ALL SMALL FIRMS 3 199 WORKERS kaiser/hret survey of employer-sponsored health Benefits, 2006–2009. ALL LARGE FIRMS 200 OR MORE WORKERS * estimate is statistically different from estimate for the previous year shown (p.05). ALL FIRMS note: these estimates include workers enrolled in hdhP/so and other plan types. Because we do not collect information on the attributes of conventional plans, to be conservative, we assumed that workers in conventional plans do not have a deductible of $1,000 or more. Because of the low enrollment in conventional plans, the impact of this assumption is minimal. average general annual health plan deductibles for PPos, Pos plans, and hdhP/sos are for in-network services. Employee Cost Sharing 7 section seven 102 t h e k a i s e r fa m i ly f o u n d at i o n - a n d - h e a lt h r e s e a r C h e d u C at i o n a l t r u s t
  • 117.
    Employer Health Benefits 2 0 0 9 An n u a l s u r ve y e x h i B i t 7.8 among Covered Workers With a G eneral annual health Plan deduc tible for single PPo Coverage, distr ibution of d educ tibles, 2006–2009 2006 62% 26% 8% 4% 2007* 64% 24% 10% 2% 2008* 52% 30% 13% 4% 2009 48% 32% 14% 6% 0% 10% 20% 30% 40% 50% 60% 70% 80% 90% 100% source: $1 $499 kaiser/hret survey of employer-sponsored health Benefits, 2006–2009. $500 $999 $1,000 $1,999 * distribution is statistically different from distribution for the previous year shown (p.05). $2,000 OR MORE note: deductibles for PPo plans are for in-network services. e x h i B i t 7.9 among Covered Workers With a G eneral annual health Plan deduc tible for single Pos Coverage, distr ibution of d educ tibles, 2006–2009 2006 38% 44% 16% 1% 2007* 50% 26% 19% 5% Employee Cost Sharing 2008* 33% 32% 25% 10% 2009* 29% 24% 29% 18% 0% 10% 20% 30% 40% 50% 60% 70% 80% 90% 100% source: $1 $499 7 kaiser/hret survey of employer-sponsored health Benefits, 2006–2009. $500 $999 $1,000 $1,999 section seven * distribution is statistically different from distribution for the previous year shown (p.05). $2,000 OR MORE note: deductibles for Pos plans are for in-network services. 103 t h e k a i s e r fa m i ly f o u n d at i o n - a n d - h e a lt h r e s e a r C h e d u C at i o n a l t r u s t
  • 118.
    Employer Health Benefits 2 0 0 9 A n n u a l s u r ve y e x h i B i t 7. 10 distr ibution of type of G eneral annual deduc tible for Covered Wor kers with family Coverage, by Plan type and firm size, 2009 separate amount no deductible aggregate amount per Person hmo all small firms (3–199 Workers)* 71% 25% 3% all large firms (200 or more Workers)* 88 7 4 All firm sizes 84% 12% 4% ppo all small firms (3–199 Workers) 26% 45% 29% all large firms (200 or more Workers) 26 46 28 All firm sizes 26% 46% 28% pos all small firms (3–199 Workers) 37% 44% 19% all large firms (200 or more Workers) 41 32 26 All firm sizes 39% 39% 22% hDhp/so all small firms (3–199 Workers) na 85% 15% all large firms (200 or more Workers) na 92 8 All firm sizes NA 89% 11% source: kaiser/hret survey of employer-sponsored health Benefits, 2009. * distributions are statistically different between all small firms and all large firms within plan type (p.05). na: not applicable. all covered workers in hdhP/sos face a general annual deductible. in hdhP/hra plans, as defined by the survey, the minimum deductible is $1,000 for single coverage and $2,000 for family coverage. in hsa-qualified hdhPs, the legal minimum Employee Cost Sharing deductible for 2009 is $1,150 for single coverage and $2,300 for family coverage. note: the survey distinguished between plans that have an aggregate deductible amount in which all family members’ out-of-pocket expenses count toward the deductible and plans that have a separate amount for each family member, typically with a limit on the number of family members required to reach that amount. among workers with a general annual deductible, 74% of workers in hmos have an aggregate deductible, 62% in PPos have an aggregate deductible, and 64% in Pos plans have an aggregate deductible. average general annual health plan deductibles for PPos, Pos plans, and hdhP/sos are for in-network services. 7 section seven 104 t h e k a i s e r fa m i ly f o u n d at i o n - a n d - h e a lt h r e s e a r C h e d u C at i o n a l t r u s t
  • 119.
    Employer Health Benefits 2 0 0 9 An n u a l s u r ve y e x h i B i t 7.1 1 among Covered Wor kers with a G eneral annual health Plan deduc tible, average deduc tibles for family Coverage, by d educ tible type, Plan type, and fir m size, 2009 aggregate amount separate amount per Person hmo all small firms (3–199 Workers) nsd nsd all large firms (200 or more Workers) $1,089 $600 All firm sizes $1,524 $686 ppo all small firms (3–199 Workers) $2,596* $904* all large firms (200 or more Workers) 1,077* 527* All firm sizes $1,488 $633 pos all small firms (3–199 Workers) $2,566* nsd all large firms (200 or more Workers) 1,387* $841 All firm sizes $2,191 $1,050 hDhp/so all small firms (3–199 Workers) $4,037* nsd all large firms (200 or more Workers) 3,258* $1,973 All firm sizes $3,626 $2,091 source: kaiser/hret survey of employer-sponsored health Benefits, 2009. * estimates are statistically different within plan and deductible type between all small firms and all large firms (p.05). nsd: not sufficient data. note: average general annual health plan deductibles for PPos, Pos plans, and hdhP/sos are for in-network services. the Employee Cost Sharing survey distinguished between plans that have an aggregate deductible amount in which all family members’ out-of-pocket expenses count toward the deductible and plans that have a separate amount for each family member, typically with a limit on the number of family members required to reach that amount. 7 section seven 105 t h e k a i s e r fa m i ly f o u n d at i o n - a n d - h e a lt h r e s e a r C h e d u C at i o n a l t r u s t
  • 120.
    Employer Health Benefits 2 0 0 9 A n n u a l s u r ve y e x h i B i t 7. 12 among Covered Workers with a G eneral annual health Plan deduc tible for family Coverage, average aggregate d educ tible, by Plan type, 2006–2009 $4,000 $3,596 $3,626 $3,511 $3,559 $3,500 $3,000 $2,500 $2,191 $2,000 $1,860 $1,524* $1,488 $1,500 $1,344* $1,359 $1,040 $1,227 $1,053 $1,034 $1,000 $751 $759 $500 $0 HMO PPO POS HDHP/SO source: 2006 kaiser/hret survey of employer-sponsored health Benefits, 2006–2009. 2007 2008 * estimate is statistically different from estimate for the previous year shown by plan type (p.05). 2009 note: average general annual health plan deductibles for PPos, Pos plans, and hdhP/sos are for in-network services. Employee Cost Sharing 7 section seven 106 t h e k a i s e r fa m i ly f o u n d at i o n - a n d - h e a lt h r e s e a r C h e d u C at i o n a l t r u s t
  • 121.
    Employer Health Benefits 2 0 0 9 An n u a l s u r ve y e x h i B i t 7.1 3 among Covered Workers With a G eneral annual health Plan deduc tible for family Coverage, distr ibution of d educ tibles, by Plan type and deduc tible type, 2009 $1–$499 $500–$999 $1,000–$1,999 $2,000 or more hmo aggregate amount 7% 22% 33% 38% separate amount 46% 13% 36% 5% ppo aggregate amount 12% 30% 35% 23% separate amount 46% 34% 12% 8% pos aggregate amount 3% 18% 30% 49% separate amount 43% 12% 15% 30% hDhp/so‡ aggregate amount 0% 0% 0% 100% separate amount 0% 0% 40% 60% source: kaiser/hret survey of employer-sponsored health Benefits, 2009. ‡ By definition, 100% of covered workers in hdhP/sos with an aggregate deductible have a family deductible of $2,000 or more. note: average general annual health plan deductibles for PPos, Pos plans, and hdhP/sos are for in-network services. the survey distinguished between plans that have an aggregate deductible amount in which all family members’ out-of-pocket expenses count toward the deductible and plans that have a separate amount for each family member, typically with a limit on the number of family members required to reach that amount. Employee Cost Sharing 7 section seven 107 t h e k a i s e r fa m i ly f o u n d at i o n - a n d - h e a lt h r e s e a r C h e d u C at i o n a l t r u s t
  • 122.
    Employer Health Benefits 2 0 0 9 A n n u a l s u r ve y e x h i B i t 7. 14 among Covered Wor kers With a s eparate per Person G eneral annual health Plan deduc tible for family Coverage, distribution of m aximum number of family m embers r equired to m eet the d educ tible, by Plan type, 2009 HMO 80% 20% 1% PPO 42% 42% 1% 14% POS 47% 14% 2% 37% HDHP/SO 72% 14% 14% 0% 10% 20% 30% 40% 50% 60% 70% 80% 90% 100% source: TWO kaiser/hret survey of employer-sponsored health Benefits, 2009. THREE FOUR OR MORE WITH SPECIFIED LIMIT note: average general annual health plan deductibles for PPos, Pos plans, and NO LIMIT hdhP/sos are for in-network services. the survey distinguished between plans that have an aggregate deductible amount in which all family members’ out-of-pocket expenses count toward the deductible and plans that have a separate amount for each family member, typically with a limit on the number of family members required to reach that amount. Employee Cost Sharing 7 section seven 108 t h e k a i s e r fa m i ly f o u n d at i o n - a n d - h e a lt h r e s e a r C h e d u C at i o n a l t r u s t
  • 123.
    Employer Health Benefits 2 0 0 9 An n u a l s u r ve y e x h i B i t 7.1 5 among Covered Workers With an aggregate G eneral annual health Plan deduc tible for family Coverage, distribution of aggregate d educ tibles, by Plan type, 2006–2009 $1–$499 $500–$999 $1,000–$1,999 $2,000 or more hmo 2006 27% 42% 23% 7% 2007 22 48 23 8 2008* 31 26 20 23 2009* 7 22 33 38 ppo 2006 20% 42% 27% 12% 2007* 14 49 25 12 2008* 11 38 32 19 2009* 12 30 35 23 pos 2006 12% 26% 45% 18% 2007* 32 13 29 25 2008 23 14 24 39 2009* 3 18 30 49 source: kaiser/hret survey of employer-sponsored health Benefits, 2006–2009. * distribution is statistically different from distribution for the previous year shown (p.05). note: By definition, 100% of covered workers in hdhP/sos with an aggregate deductible have a family deductible of $2,000 or more. average general annual health plan deductibles for PPos and Pos plans are for in-network services. the survey distinguished between plans that have an aggregate deductible amount in which all family members’ out-of-pocket expenses count toward the deductible and plans that have a separate amount for each family member, typically with a limit on the number of family members required to reach that amount. Employee Cost Sharing 7 section seven 109 t h e k a i s e r fa m i ly f o u n d at i o n - a n d - h e a lt h r e s e a r C h e d u C at i o n a l t r u s t
  • 124.
    Employer Health Benefits 2 0 0 9 A n n u a l s u r ve y e x h i B i t 7. 16 among Covered Workers with a G eneral annual health Plan deduc tible, Percentage with Coverage for the following s er vices Without having to first m eet the deduc tible, by Plan type, 2009 hmo PPo Pos hdhP/so Physician office Visits for Primary Care 84% 74% 74% na Preventive Care 92% 88% 87% 92% Prescription drugs 88% 93% 91% 71%§ source: kaiser/hret survey of employer-sponsored health Benefits, 2009. note: these questions are asked of firms with a deductible for single or family coverage. average general annual health plan deductibles for PPos, Pos plans, and hdhP/sos are for in-network services. na: not applicable. information for Physician office Visits is not collected for hdhP/sos. § Percentage is for covered workers in hdhP/hras only. Both hdhP/hras and hsa-qualified hdhPs were asked about preventive benefits, but only hdhP/hras were asked about prescription drugs. hsa-qualified hdhPs are required by law to apply the plan deductible to nearly all services. e x h i B i t 7. 17 distr ibution of Covered Wor kers With s eparate Cost sharing for a hospital admission in addition to any G eneral annual deduc tible, by Plan type, 2009 separate Cost sharing for a hospital Admission hmo PPo Pos hdhP/so§ All plANs separate annual deductible for hospitalizations 6% 3% 10% 0%* 5% Copayment and/or Coinsurance Copayment 44* 12* 31* 3* 19 Employee Cost Sharing Coinsurance 14* 65* 37* 52 51 Both Copayment and Coinsurance‡ 8 11 7 1* 8 Charge Per day 9* 3* 13 1* 5 none 29 18 21 43* 22 source: kaiser/hret survey of employer-sponsored health Benefits, 2009. 7 * estimate is statistically different from all Plans estimate (p.05). ‡ this includes enrollees who are required to pay the higher amount of either the copayment or coinsurance under the plan. section seven note: as in past years, we collected information on the cost-sharing provisions for hospital admissions that are in addition to any general annual plan deductible. however, for the 2009 survey, in order to better capture the prevalence of combinations of cost sharing, the survey was changed to ask a series of yes or no questions. Previously, the question asked respondents to select one response from a list of types of cost sharing, such as separate deductibles, copayments, coinsurance, and per diem payments (for hospitalization only). due to the change in question format, the distribution of workers with types of cost sharing does not equal 100% as workers may face a combination of types of cost sharing. less than 1% of covered workers have an “other” type of cost sharing for a hospital admission. § information on separate deductibles for hospital admissions was collected only for hdhP/hras because federal regulations for hsa-qualified hdhPs make it unlikely these plans would have a separate deductible for specific services. 110 t h e k a i s e r fa m i ly f o u n d at i o n - a n d - h e a lt h r e s e a r C h e d u C at i o n a l t r u s t
  • 125.
    Employer Health Benefits 2 0 0 9 An n u a l s u r ve y e x h i B i t 7.1 8 distr ibution of Covered Wor kers With s eparate Cost sharing for an outpatient surger y in addition to any G eneral annual deduc tible, by Plan type, 2009 separate Cost sharing for an outpatient surgery hmo PPo Pos hdhP/so§ All plANs separate annual deductible for outpatient surgery 4% 2% 1% 1% 2% Copayment and/or Coinsurance Copayment 45* 11* 39* 3* 20 Coinsurance 18* 68* 35* 51 53 Both Copayment and Coinsurance‡ 3* 7 10 1* 6 none 33* 19* 23 46* 24 source: kaiser/hret survey of employer-sponsored health Benefits, 2009. * estimate is statistically different from all Plans estimate (p.05). ‡ this includes enrollees who are required to pay the higher amount of either the copayment or coinsurance under the plan. note: as in past years, we collected information on the cost-sharing provisions for outpatient surgery that are in addition to any general annual plan deductible. however, for the 2009 survey, in order to better capture the prevalence of combinations of cost sharing, the survey was changed to ask a series of yes or no questions. Previously, the question asked respondents to select one response from a list of types of cost sharing, such as separate deductibles, copayments, coinsurance, and per diem payments (for hospitalization only). due to the change in question format, the distribution of workers with types of cost sharing does not equal 100% as workers may face a combination of types of cost sharing. less than 1% of covered workers have an “other” type of cost sharing for an outpatient surgery. § information on separate deductibles for outpatient surgery was collected only for hdhP/hras because federal regulations for hsa-qualified hdhPs make it unlikely these plans would have a separate deductible for specific services. Employee Cost Sharing 7 section seven 111 t h e k a i s e r fa m i ly f o u n d at i o n - a n d - h e a lt h r e s e a r C h e d u C at i o n a l t r u s t
  • 126.
    Employer Health Benefits 2 0 0 9 A n n u a l s u r ve y e x h i B i t 7. 19 among Covered Wor kers With s eparate Cost sharing for a hospital admission or outpatient surger y in addition to any G eneral annual deduc tible, average Cost shar ing, by Plan type, 2009* average average Charge Copayment Coinsurance Per day separate Cost sharing for a hospital Admission hmo $247 17% $216 PPo 217 18 136 Pos 256 18 183 hdhP/so nsd 18 nsd All plANs $234 18% $179 separate Cost sharing for an outpatient surgery hmo $104 17% na PPo 113 19 na Pos 116 19 na hdhP/so nsd 18 na All plANs $110 19% NA source: kaiser/hret survey of employer-sponsored health Benefits, 2009. * tests found no statistical differences between plan type estimates and estimates for all plans (p.05). nsd: not sufficient data. na: not applicable. the survey did not offer “Charge Per day” (per diem) as a response option for questions about separate cost sharing for each outpatient surgery episode. note: the average separate annual deductible for hospital admission is $862 and the average separate deductible for outpatient surgery is $500. By plan type, in most cases there were too few observations to present the average estimates. the average amounts include workers that may have a combination of types of cost sharing. all Plans estimates are weighted by workers in firms that reported cost sharing. see the survey design and methods section for more information on weighting. Employee Cost Sharing 7 section seven 112 t h e k a i s e r fa m i ly f o u n d at i o n - a n d - h e a lt h r e s e a r C h e d u C at i o n a l t r u s t
  • 127.
    Employer Health Benefits 2 0 0 9 An n u a l s u r ve y e x h i B i t 7.2 0 i n addition to any Plan d educ tible, Percentage of Covered Wor kers With the following types of Cost shar ing for Physician o ffice Visits, by Plan type, 2009 Both Copay Copay only Coinsurance only no Cost sharing none of the above and Coinsurance‡ hmo* 94% 2% 2% 2% 0% PPo* 77 16 5 3 1 Pos* 89 6 4 1 1 hdhP/so* 14 44 2 39 2 All plANs 77% 14% 4% 5% 1% source: kaiser/hret survey of employer-sponsored health Benefits, 2009. * distribution is statistically different from all Plans distribution (p.05). ‡ this includes enrollees who are required to pay the higher amount of either the copayment or coinsurance under the plan. note: in 2009, the survey includes cost sharing for in-network services only. see the 2007 survey for information on out-of- network office visit cost sharing. in 2009, in order to better capture the percentage of workers with no cost sharing, the “no cost sharing” response was distinguished from the “other” response. e x h i B i t 7.2 1 among Covered Workers with Copayments and/or Coinsurance for i n-net wor k Physician o ffice Visits, average Copayments and Coinsurance, by Plan type, 2009 hmo PPo Pos hdhP/so All plANs in-Network office visits average Copay for Primary Care Physician $18* $21 $21 $22 $20 Employee Cost Sharing office Visit average Copay for specialist Physician $26* $28 $31* $29 $28 office Visit average Coinsurance for Primary Care nsd 18% nsd 18% 18% Physician office Visit source: kaiser/hret survey of employer-sponsored health Benefits, 2009. 7 section seven * estimate is statistically different from all Plans estimate (p.05). nsd: not sufficient data. note: the survey asks respondents if the plan has cost sharing for in-network office visits. if the respondent indicates the plan has a copayment for office visits, we assume the plan has a copayment for both primary and specialty care visits. the survey does not allow for a respondent to report that a plan has a copayment for primary care visits and coinsurance for visits with a specialist physician. 113 t h e k a i s e r fa m i ly f o u n d at i o n - a n d - h e a lt h r e s e a r C h e d u C at i o n a l t r u s t
  • 128.
    Employer Health Benefits 2 0 0 9 A n n u a l s u r ve y e x h i B i t 7. 22 among Covered Workers With Copayments for a Physician o ffice Visit with a Primar y Care Physician, distribution of Copayments, by Plan type, 2004–2009 $5 Per Visit $10 Per Visit $15 Per Visit $20 Per Visit $25 Per Visit $30 Per Visit other hmo 2004 3% 28% 40% 22% 3% 3% 1% 2005* 5 23 34 27 6 4 1 2006 3 21 37 25 8 5 2 2007* 3 20 25 34 13 4 1 2008* 6 16 29 30 11 5 3 2009 5 11 29 31 13 8 3 ppo 2004 1% 17% 35% 28% 11% 4% 3% 2005* 1 16 25 34 15 5 4 2006 1 12 25 35 17 7 3 2007* 2 11 24 35 19 7 2 2008 1 11 22 34 21 8 3 2009* 1 11 18 34 23 11 2 pos 2004 3% 17% 34% 36% 8% 1% 1% 2005* 2 16 35 30 11 6 1 2006* 2 22 26 27 16 6 1 2007* 2 10 36 25 15 6 5 2008* 2 14 19 27 21 12 7 2009* 1 8 14 39 21 12 4 hDhp/so‡ 2007 7% 1% 12% 38% 13% 19% 12% 2008 0 2 17 33 9 18 21 Employee Cost Sharing 2009 1 4 24 29 11 29 4 All plANs 2004 1% 19% 37% 27% 9% 3% 3% 2005* 2 17 29 32 12 5 3 2006 2 15 28 32 15 6 3 2007 2 14 25 34 17 7 2 2008 2 13 23 33 18 8 4 7 2009* 2 10 21 34 20 11 2 section seven source: kaiser/hret survey of employer-sponsored health Benefits, 2004–2009. * distribution is statistically different from distribution for the previous year shown (p.05). ‡ there are insufficient data to report the results from the 2006 survey. information was not obtained for hdhP/sos prior to 2006. note: Copayments for PPo, Pos, and hdhP/so plans are for in-network providers. the survey has asked specifically about copayments for primary care physicians since 2005. in 2004, the survey question did not specify primary or specialist physician. 114 t h e k a i s e r fa m i ly f o u n d at i o n - a n d - h e a lt h r e s e a r C h e d u C at i o n a l t r u s t
  • 129.
    Employer Health Benefits 2 0 0 9 An n u a l s u r ve y e x h i B i t 7.2 3 among Covered Workers With Copayments for a Physician o ffice Visit with a specialty Care Physician, distribution of Copayments, by Plan type, 2006-2009 $5 Per $10 Per $15 Per $20 Per $25 Per $30 Per $35 Per $40 Per other Visit Visit Visit Visit Visit Visit Visit Visit hmo 2006 3% 14% 20% 20% 17% 13% 5% 5% 4% 2007* 2 11 12 26 22 14 5 7 2 2008* 2 13 14 18 20 16 5 5 7 2009* 3 6 17 15 17 18 7 9 8 ppo 2006 1% 9% 15% 25% 20% 15% 6% 5% 5% 2007 1 8 13 24 18 16 8 7 4 2008* 1 7 14 21 17 15 9 9 8 2009* 1 8 10 20 14 15 11 11 11 pos 2006 2% 13% 13% 17% 18% 17% 8% 5% 8% 2007* 7 6 10 21 19 16 6 6 9 2008* 1 7 8 14 13 21 11 9 17 2009 1 4 5 17 11 25 6 14 17 hDhp/so‡ 2007 0% 7% 5% 23% 7% 18% 5% 21% 15% 2008 0 2 11 18 4 27 3 9 28 2009 1 4 11 18 8 23 15 11 9 All plANs 2006 2% 10% 15% 22% 19% 16% 6% 5% 5% 2007 2 8 12 24 20 16 6 7 5 2008* 1 9 13 18 17 16 8 8 10 Employee Cost Sharing 2009* 1 7 11 18 14 17 10 11 11 source: kaiser/hret survey of employer-sponsored health Benefits, 2006–2009. * distribution is statistically different from distribution for the previous year shown (p.05). ‡ there are insufficient data to report the results from the 2006 survey. note: Copayments for PPo, Pos, and hdhP/so plans are for in-network providers. information on copayments for specialty physician office visits was not obtained prior to 2006. the survey asks respondents if the plan has cost sharing for in-network 7 office visits. if the respondent indicates the plan has a copayment for office visits, we assume the plan has a copayment for both section seven primary and specialty care visits. the survey does not allow for a respondent to report that a plan has a copayment for primary care visits and coinsurance for visits with a specialist physician. 115 t h e k a i s e r fa m i ly f o u n d at i o n - a n d - h e a lt h r e s e a r C h e d u C at i o n a l t r u s t
  • 130.
    Employer Health Benefits 2 0 0 9 A n n u a l s u r ve y e x h i B i t 7. 24 among Covered Workers in hmos with a Copayment for a Physician o ffice Visit, Percentage with Var ious Copayments, 1999–2008 $5 Per Visit $10 Per Visit $15 Per Visit $20 Per Visit other 1999 23% 60% 12% 1% 3% 2000* 22 54 16 3 6 2001* 15 56 22 3 4 2002* 7 52 27 11 3 2003* 4 35 37 12 12 2004* 3 28 40 22 7 2005* 5 23 34 27 11 2006 3 21 37 25 15 2007* 3 20 25 34 18 2008* 6 16 29 30 19 2009 5 11 29 31 24 source: kaiser/hret survey of employer-sponsored health Benefits, 1999–2009. * distribution is statistically different from distribution for the previous year shown (p.05). note: the survey has asked specifically about copayments for primary care physicians since 2005. Prior to 2005, the survey question did not specify primary or specialist physician. e x h i B i t 7. 25 among Covered Workers With Coinsurance for Physician o ffice Visits, distr ibution of average Coinsurance r ates, by Plan type, 2009* Employee Cost Sharing Coinsurance rates 10% or 15% 20% or 25% 30% or 35% 40% or 45% other PPo 31% 64% 2% 1% 1% hdhP/so 30 65 5 0 1 All plANs 32% 64% 2% 1% 1% source: 7 kaiser/hret survey of employer-sponsored health Benefits, 2009. section seven * tests found no statistical difference for plan type distribution compared to all Plans distribution (p.05). note: Coinsurance rates for hmo and Pos plans are not shown because there is not sufficient data as only 2% or 6% of covered workers, respectively, face coinsurance for office visits. 116 t h e k a i s e r fa m i ly f o u n d at i o n - a n d - h e a lt h r e s e a r C h e d u C at i o n a l t r u s t
  • 131.
    Employer Health Benefits 2 0 0 9 An n u a l s u r ve y e x h i B i t 7.2 6 Percentage of Covered Workers Without an annual out- of-Pocket m aximum for single and family Coverage, by Plan type, 2009 single Coverage family Coverage hmo 41%* 41%* PPo 14* 14* Pos 19 19 hdhP/so na na All plANs 19% 19% source: kaiser/hret survey of employer-sponsored health Benefits, 2009. * estimate is statistically different from all Plans estimate (p.05). na: not applicable. hsa-qualified hdhPs are required to have an annual maximum out-of-pocket liability of no more than $5,800 for single coverage and $11,600 for family coverage in 2009. hdhP/hras have no such requirement, and the percentage of covered workers in hdhP/hras with “no limit” for annual out-of-pocket maximum for single and family coverage is 10% and 10%, respectively. e x h i B i t 7.2 7 among Covered Workers with an annual out- of-Pocket m aximum, Percentage Whose spending for Var ious s er vices d oes not Count towards the out- of-Pocket m aximum, 2009 hmo PPo Pos hdhP/so‡ General annual Plan deductible 30% 34% 20% 13% Employee Cost Sharing any additional Plan deductibles nsd 29% nsd nsd Physician office Visit Copayments 51% 75% 51% nsd Physician office Visit Coinsurance nsd 8% nsd 8% Prescription drug Cost sharing 78% 85% 60% 53% source: kaiser/hret survey of employer-sponsored health Benefits, 2009. 7 ‡ among hdhP/so plans, questions other than “overall plan deductible” were asked only of hdhP/hras and not of hsa- section seven qualified hdhPs. hsa-qualified hdhPs are required to apply most cost sharing to the out-of-pocket maximum. When hdhP/ hras are considered exclusively, among covered workers with an annual out-of-pocket maximum, the percentage whose out- of-pocket maximum does not include certain services is as follows: any additional plan deductibles is nsd, office visit copayments is nsd, office visit coinsurance is 8%, and prescription drug cost sharing is 55%. nsd: not sufficient data. note: this series of questions is asked if the plan has an out-of-pocket maximum for single or family coverage. 117 t h e k a i s e r fa m i ly f o u n d at i o n - a n d - h e a lt h r e s e a r C h e d u C at i o n a l t r u s t
  • 132.
    Employer Health Benefits 2 0 0 9 A n n u a l s u r ve y e x h i B i t 7. 28 among Covered Workers with an out- of-Pocket m aximum for single Coverage, distr ibution of out- of-Pocket m aximums, by Plan type, 2009 HMO* 8% 12% 36% 18% 7% 20% PPO 6% 20% 17% 21% 11% 25% POS 5% 22% 20% 17% 12% 23% 1% HDHP/SO* 8% 9% 15% 18% 49% ALL PLANS 6% 18% 18% 21% 11% 26% 0% 20% 40% 60% 80% 100% source: $999 OR LESS kaiser/hret survey of employer-sponsored health Benefits, 2009. $1,000 $1,499 $1,500 $1,999 * distribution is statistically different from all Plans distribution (p.05). $2,000 $2,499 note: distributions are among covered workers facing a specified limit for out-of-pocket $2,500 $2,999 maximum amounts. hsa-qualified hdhPs are required by law to have an out-of-pocket $3,000 OR MORE maximum of no more than $5,800 for single coverage and $11,600 for family coverage in 2009. WITH A SPECIFIED LIMIT Employee Cost Sharing 7 section seven 118 t h e k a i s e r fa m i ly f o u n d at i o n - a n d - h e a lt h r e s e a r C h e d u C at i o n a l t r u s t
  • 133.
    Employer Health Benefits 2 0 0 9 An n u a l s u r ve y e x h i B i t 7.2 9 distr ibution of type of out- of-Pocket m aximum for Covered Workers with family Coverage, by Plan type and fir m size, 2009* separate amount no limit aggregate amount per Person hmo all small firms (3–199 Workers) 37% 55% 8% all large firms (200 or more Workers) 42 44 15 All firm sizes 41% 47% 13% ppo all small firms (3–199 Workers) 17% 58% 25% all large firms (200 or more Workers) 13 62 25 All firm sizes 14% 61% 25% pos all small firms (3–199 Workers) 19% 60% 22% all large firms (200 or more Workers) 20 52 28 All firm sizes 19% 57% 24% hDhp/so‡ all small firms (3–199 Workers) 4% 88% 8% all large firms (200 or more Workers) 3 90 6 All firm sizes 3% 89% 7% All firms all small firms (3–199 Workers) 19% 61% 20% all large firms (200 or more Workers) 20 59 21 All firm sizes 19% 60% 21% source: Employee Cost Sharing kaiser/hret survey of employer-sponsored health Benefits, 2009. * tests found no statistical differences between distributions for all small firms and all large firms within plan type (p.05). ‡ hsa-qualified hdhPs are required by law to have an annual maximum out-of-pocket liability of no more than $5,800 for single coverage and $11,600 for family coverage in 2009. When they are excluded from the calculation, the distribution of type of out-of-pocket maximum for hdhP/hras only is as follows: all small firms – not sufficient data; all large firms – 8% no limit, 82% aggregate amount, and 10% separate amount per Person; all firm sizes – 10% no limit, 79% aggregate amount, and 11% separate amount per Person. note: the survey distinguished between plans that have a family aggregate out-of-pocket maximum that applies to spending by any covered person in the family or a separate per person out-of-pocket maximum that applies to spending by each family 7 member or a limited number of family members. among workers with an out-of-pocket maximum, 78% of workers in hmos have an aggregate out-of-pocket maximum, 71% in PPos have an aggregate out-of-pocket maximum, 70% in Pos plans have section seven an aggregate out-of-pocket maximum and 74% in all Plans have an aggregate out-of-pocket maximum. 119 t h e k a i s e r fa m i ly f o u n d at i o n - a n d - h e a lt h r e s e a r C h e d u C at i o n a l t r u s t
  • 134.
    Employer Health Benefits 2 0 0 9 A n n u a l s u r ve y e x h i B i t 7. 30 among Covered Workers with an aggregate out- of-Pocket m aximum for family Coverage, distr ibution of out- of-Pocket m aximums, by Plan type, 2009 HMO* 5% 16% 31% 19% 7% 22% PPO 8% 13% 20% 18% 11% 29% POS 4% 17% 21% 10% 15% 33% 1% HDHP/SO* 7% 10% 11% 21% 50% ALL PLANS 6% 13% 19% 18% 12% 31% 0% 20% 40% 60% 80% 100% source: $1,999 OR LESS kaiser/hret survey of employer-sponsored health Benefits, 2009. $2,000 $2,999 $3,000 $3,999 * distribution is statistically different from all Plans distribution (p.05). $4,000 $4,999 note: distributions are among covered workers facing a specified limit for out-of-pocket maximum $5,000 $5,999 amounts. hsa-qualified hdhPs are required by law to have an out-of-pocket maximum of no more $6,000 OR MORE than $5,800 for single coverage and $11,600 for family coverage in 2009. the survey distinguished WITH A SPECIFIED LIMIT between plans that have a family aggregate out-of-pocket maximum that applies to spending by any covered person in the family or a separate per person out-of-pocket maximum that applies to spending by each family member or a limited number of family members. Employee Cost Sharing 7 section seven 120 t h e k a i s e r fa m i ly f o u n d at i o n - a n d - h e a lt h r e s e a r C h e d u C at i o n a l t r u s t
  • 135.
    Employer Health Benefits 2 0 0 9 An n u a l s u r ve y e x h i B i t 7.3 1 among Covered Workers with a s eparate per Person out- of-Pocket m aximum for family Coverage, distr ibution of out- of-Pocket m aximums, by Plan type, 2009 HMO 52% 28% 14% 5% PPO 42% 34% 15% 4% 3% 1% 1% POS* 51% 25% 4% 3% 18% 1% HDHP/SO* 20% 34% 17% 24% 4% ALL PLANS 44% 34% 11% 4% 3%3% 0% 20% 40% 60% 80% 100% source: $1,999 OR LESS kaiser/hret survey of employer-sponsored health Benefits, 2009. $2,000 $2,999 $3,000 $3,999 * distribution is statistically different from all Plans distribution (p.05). $4,000 $4,999 note: distributions are among covered workers facing a specified limit for out-of-pocket maximum $5,000 $5,999 amounts. the survey distinguished between plans that have a family aggregate out-of-pocket maximum $6,000 OR MORE that applies to spending by any covered person in the family or a separate per person out-of-pocket WITH A SPECIFIED LIMIT maximum that applies to spending by each family member or a limited number of family members. e x h i B i t 7.3 2 among Covered Workers with a s eparate per Person out- of-Pocket m aximum for family Coverage, distr ibution of m aximum number of family m embers r equired to m eet the m aximum, by Plan type, 2009 Employee Cost Sharing HMO 60% 25% 15% 1% PPO 47% 40% 13% POS 45% 35% 2% 18% HDHP/SO* 71% 9% 6% 14% 1% 7 ALL PLANS 48% 37% 14% section seven 0% 20% 40% 60% 80% 100% source: TWO kaiser/hret survey of employer-sponsored health Benefits, 2009. THREE FOUR OR MORE WITH A SPECIFIED LIMIT * distribution is statistically different from all Plans distribution (p.05). NO LIMIT note: the survey distinguished between plans that have a family aggregate out-of-pocket maximum that applies to spending by any covered person in the family or a separate out-of-pocket maximum that applies to spending by each family member or a limited number of family members. 121 t h e k a i s e r fa m i ly f o u n d at i o n - a n d - h e a lt h r e s e a r C h e d u C at i o n a l t r u s t
  • 137.
    60% $4,8 2 4 Employer Health Benefits $ 13,375 2009 annual surVey High-Deductible Health Plans with Savings Option section 8 2009
  • 138.
    Employer Health Benefits 2 0 0 9 A n n u a l s u r ve y h i g h - D e D u C t i B l e h e a lt h p l a n S W i t h S av i n g S o p t i o n c hanges in law over The pasT few years have permiTTed The esTablishmenT of new Types of savings arrangemenTs for healTh care . T he Two mosT common are healTh reimbursemenT arrangemenTs (hra s ) and healTh savings accounTs (hsa s ). hra s and hsa s are boTh financial accounTs ThaT workers or Their family members can use To pay for healTh care services . T hese savings arrangemenTs are ofTen ( or, in The case of hsa s , always ) paired wiTh healTh plans wiTh high deducTibles . T he survey TreaTs high - deducTible plans ThaT can be paired wiTh a savings opTion as a disTincT plan Type —h igh -d educTible h ealTh p lan wiTh s avings o pTion (hdhp/so)— even if The plan would oTherwise be considered a ppo, hmo, pos plan , or convenTional healTh plan . s pecifically for The survey, hdhp/so s are defined as (1) healTh plans wiTh a deducTible of aT leasT $1,000 for single coverage and $2,000 for family coverage 1 offered wiTh an hra ( referred To as hdhp/hra s ); or (2) high - deducTible healTh plans ThaT meeT The federal legal requiremenTs To permiT an enrollee To esTablish and conTribuTe To an hsa ( referred To as hsa- qualified hdhps ). 2 p e r C e N TA g e o f f i r m s o f f e r i N g  Enrollment in HDHP/SOs remained at 8% of hDhp/hr As AND hsA-QuAlifieD hDhps, covered workers in 2009 (Exhibit 8.4). AND eNrollmeNT  Three percent of covered workers are enrolled  Twelve percent of firms offering health benefits offer in HDHP/HRAs and 6% are enrolled in an HDHP/HRA, an HSA-qualified HDHP, or both HSA-qualified HDHPs (Exhibit 8.4). Nine in 2009, a similar percentage to last year. Among percent of covered workers in small firms (3-199 firms offering health benefits, 2% offer an HDHP/ workers) are enrolled in HSA-qualified HDHPs, HRA and 10% offer an HSA-qualified HDHP compared to 4% of workers in large firms (200 or (Exhibit 8.1). more workers) (Exhibit 8.5).  Firms with 1,000 or more workers are more plAN DeDuCTibles likely to offer an HDHP/SO than smaller firms. High-Deductible Health Plans with Savings Option  As expected, workers enrolled in HDHP/SOs have Twenty-eight percent of firms with 1,000 or more workers offer an HDHP/SO compared to higher deductibles than workers enrolled in HMOs, 11% of firms with 3 to 199 workers or 18% of PPOs, or POS plans. firms with 200-999 workers (Exhibit 8.2).  The average general annual deductible for single  The percentage of firms with 1,000 or more coverage is $1,690 for HDHP/HRAs and $1,922 workers offering an HDHP/SO increased in for HSA-qualified HDHPs (Exhibit 8.6). These 2009 to 28% from 22% in 2008 (Exhibit 8.3). averages are similar to the amounts reported in 2008. noTe: 1 there is no legal requirement for the minimum deductible in a plan offered with an hra. the survey defines a high-deductible plan as a plan with a deductible of at least $1,000 for single coverage and $2,000 for family coverage. federal law requires a deductible of at least $1,150 for single coverage and $2,300 for family coverage for hsa-qualified hdhPs in 2009. see the text Box for more information on hsa-qualified hdhPs and hdhP/hras. 8 2 the definitions of hdhP/sos do not include other consumer-driven plan options, such as arrangements that combine an hra with a lower-deductible health plan or arrangements in which an insurer (rather than the employer as in the case of hras or the enrollee as in the case of hsas) establishes an account for each enrollee. other arrangements may be included in future s ection eig ht surveys as the market evolves. 124 t h e k a i s e r fa m i ly f o u n d at i o n - a n d - h e a lt h r e s e a r C h e d u C at i o n a l t r u s t
  • 139.
    Employer Health Benefits 2 0 0 9 An n u a l s u r ve y Health Reimbursement Arrangements (HRAs) care. An individual may establish an HSA if he or are medical care reimbursement plans established she is covered by a “qualified health plan” which by employers that can be used by employees to is a plan with a high deductible (i.e., a deductible pay for health care. HRAs are funded solely by of at least $1,150 for single coverage and $2,300 employers. Employers typically commit to make for family coverage in 2009) that also meets other a specified amount of money available in the HRA requirements. Employers can encourage their for premiums and medical expenses incurred employees to create HSAs by offering an HDHP by employees or their dependents. HRAs are that meets the federal requirements. Employers accounting devices, and employers are not required in some cases also may assist their employees by to expend funds until an employee incurs expenses identifying HSA options, facilitating applications, that would be covered by the HRA. Unspent or negotiating favorable fees from HSA vendors. funds in the HRA usually can be carried over to Both employers and employees can contribute the next year (sometimes with a limit). Employees to an HSA, up to the statutory cap of $3,000 cannot take their HRA balances with them if they for single coverage and $5,950 for family leave their job, although an employer can choose coverage in 2009. Employee contributions to to make the remaining balance available to former the HSA are made on a pre-income tax basis, employees to pay for health care. and some employers arrange for their employees HRAs often are offered along with a high- to fund their HSAs through payroll deductions. deductible health plan (HDHP). In such cases, Employers are not required to contribute to HSAs the employee pays for health care first from his established by their employees but, if they elect to do so, their contributions are not taxable to or her HRA and then out-of-pocket until the the employee. Interest and other earnings on health plan deductible is met. Sometimes certain amounts in an HSA are not taxable. Withdrawals preventive services or other services such as from the HSA by the account owner to pay for prescription drugs are paid for by the plan before qualified health care expenses are not taxed. The the employee meets the deductible. savings account is owned by the individual who Health Savings Accounts (HSAs) are savings creates the account, so employees retain their HSA accounts created by individuals to pay for health balances if they leave their job. 1 see u.s. department of the treasury, Health Savings Accounts, available at http://www.treas.gov/press/releases/hp975.htm. High-Deductible Health Plans with Savings Option  There is wide variation in the average general deductible is satisfied), or (2) a per-person amount annual deductible amounts for single coverage. that applies to each family member (typically with a Forty-two percent of workers with single coverage limit on the number of family members that would in HDHP/HRAs have a deductible between be required to meet the deductible amount). $1,000 and $1,499, and 6% have a deductible  The average aggregate deductibles for workers of $3,000 or more. For workers with single with family coverage are $3,422 for HDHP/ coverage in HSA-qualified plans, 27% of workers HRAs and $3,734 for HSA-qualified HDHPs have a deductible between $1,150 and $1,499, (Exhibit 8.6). and 10% are in a plan with a deductible of $3,000 or more (Exhibit 8.9).  Forty-three percent of workers in HDHP/HRAs are in plans with an aggregate family deductible  Most workers in HDHP/HRAs (94%) and HSA- between $2,000 and $2,999, while 18% are qualified HDHPs (90%) do not have to meet the enrolled in plans with an aggregate family general annual deductible before preventive care deductible of $5,000 or more. Twenty-seven is covered (Exhibit 8.12). percent of workers in HSA-qualified HDHPs  Since 2006, the survey has collected information are in plans with an aggregate family deductible on two types of family deductibles. The survey asks between $2,300 and $2,999, while 26% are employers whether the family deductible amount enrolled in plans with an aggregate family 8 is (1) an aggregate amount (i.e., the out-of-pocket deductible of $5,000 or more (Exhibit 8.11). s ection ei ght expenses of all family members are counted until the 125 t h e k a i s e r fa m i ly f o u n d at i o n - a n d - h e a lt h r e s e a r C h e d u C at i o n a l t r u s t
  • 140.
    Employer Health Benefits 2 0 0 9 A n n u a l s u r ve y ouT-of-poCkeT mAximum AmouNTs Worker CoNTribuTioNs To premiums  HSA-qualified HDHPs are legally required to have  The average annual worker contributions to a maximum annual out-of-pocket liability of no premiums for workers enrolled in HDHP/ more than $5,800 for single coverage and $11,600 HRAs are $734 for single coverage and $3,067 for family coverage in 2009. HDHP/HRAs have no for family coverage. The worker contribution in similar requirement. HDHP/HRAs for family coverage is significantly less than worker contribution for family coverage  The average annual out-of-pocket maximum for in plans that are not HDHP/SOs (Exhibit 8.8). single coverage is $3,035 for HDHP/HRAs3 and $2,976 for HSA-quali.fied HDHPs (Exhibit 8.6).  The average annual worker contributions to premiums for workers in HSA-qualified plans are  As with deductibles, the survey asks employers $438 for single coverage and $2,453 for family whether the family out-of-pocket maximum coverage. The average contributions for single liability is (1) an aggregate amount that applies and family coverage for workers in HSA-qualified to spending by any covered person in the family, HDHPs are significantly less than the average or (2) a separate per person amount that applies premium contributions made by covered workers in to spending by each family member or a limited plans that are not HDHP/SOs (Exhibit 8.8). number of family members. The survey also asks whether spending by enrollees on various services e m p loye r Co N T r i b u T i o N s counts towards meeting the plan out-of-pocket To p r e m i u m s A N D s Av i N g s o p T i o N s maximum.  Employers contribute to HDHP/SOs in two ways:  Among covered workers with family coverage through their contributions toward the premium whose out-of-pocket maximum is an aggregate for the health plan and through their contributions amount that applies to spending by any covered (if any, in the case of HSAs) to the savings account person in the family, the average annual amounts option (i.e., the HRAs or HSAs themselves). are $6,441 for HDHP/HRAs and $5,842 for  Looking just at the annual employer HSA-qualified HDHPs (Exhibit 8.6). contributions to premiums, covered workers premiums in HDHP/HRAs on average receive employer contributions of $3,540 for single coverage and  In 2009, the average annual premiums for $9,157 for family coverage. The amount for HDHP/HRAs are $4,274 for single coverage and single coverage is lower than the average amount $12,223 for family coverage. The HDHP/HRA contributed by employers for single coverage for premium amounts for covered workers with single workers who are not enrolled in HDHP/SOs High-Deductible Health Plans with Savings Option and family coverage are lower than the average (Exhibit 8.8). premiums for single and family coverage for workers in plans that are not HDHP/SOs  The average annual employer contributions to (Exhibit 8.8). premiums for workers in HSA-qualified HDHPs are $3,391 for single coverage and $7,943 for  The average annual premium for workers in HSA- family coverage. These amounts are lower than qualified HDHPs is $3,829 for single coverage and the average contributions for single or family $10,396 for family coverage. These amounts are coverage for workers in plans that are not lower than the average single and family premium HDHP/SOs (Exhibit 8.8). for workers in plans that are not HDHP/SOs (Exhibit 8.8). noTe: 8 3 the average out-of-pocket maximum for hdhP/hras is calculated for plans with an out-of-pocket maximum. about 10% of covered workers in hdhP/hras with single coverage or family coverage are in plans that reported having no limit on out-of-pocket expenses. s ection eig ht 126 t h e k a i s e r fa m i ly f o u n d at i o n - a n d - h e a lt h r e s e a r C h e d u C at i o n a l t r u s t
  • 141.
    Employer Health Benefits 2 0 0 9 An n u a l s u r ve y  When looking at employer contributions to the  Employer contributions to savings account options savings option, on average, workers enrolled (i.e., the HRAs and HSAs themselves) for their in HDHP/HRAs receive an annual employer employees can be added to their health plan contribution to their HRA of $1,052 for single premium contributions to calculate total employer coverage and $2,073 for family coverage contributions toward HDHP/SOs. (Exhibit 8.8).  For HDHP/HRAs, the average annual total  In looking at employer contributions to HRAs, employer contribution for covered workers is we note that some HRAs are structured in such $4,592 for workers with single coverage and a way that employers may not actually spend $11,230 for workers with family coverage. The the whole amount that they make available to average total employer contribution amounts for their employees’ HRAs.4 Amounts committed single and family coverage in HDHP/HRAs is to an employee’s HRA that are not used by the higher than the average amount that employers employee generally roll over and can be used in contribute towards single and family coverage in future years, but any balance may revert back to health plans that are not HDHP/SOs (Exhibit the employer if the employee leaves his or her 8.8). job. Thus, the employer contribution amounts to  For HSA-qualified HDHPs, the average annual HRAs that we capture in the survey may exceed total employer contribution for covered workers the amount that employers will actually spend. is $4,079 for single coverage and $9,070 for  Workers enrolled in HSA-qualified HDHPs on workers with family coverage. The average average receive an annual employer contribution to total employer contribution amount for family their HSA of $688 for single coverage and $1,126 coverage in HSA-qualified HDHPs is lower than for family coverage (Exhibit 8.8). the average amount that employers contribute towards family coverage in health plans that are  In looking at employer contributions to not HDHP/SOs. The total amount contributed HSAs, we note that not all employers make for workers in HSA-qualified HDHPs for single contributions towards HSAs established by their coverage is similar to that contributed for workers employees. Twenty-nine percent of employers not in HDHP/SOs (Exhibit 8.8). offering single or family coverage through HSA- qualified HDHPs do not make contributions hsA-QuAlifieD hDhps towards the HSAs that their workers establish iN smAll AND lArge firms (covering 31% of covered workers enrolled in  There are some differences between the plan HSA-qualified HDHPs for single or family attributes of HSA-qualified HDHPs offered to coverage). High-Deductible Health Plans with Savings Option covered workers in small firms (3–199 workers)  The average HSA contributions reported above and large firms (200 or more workers). As we note include the portion of covered workers whose above, however, although the number of responding employer contribution to the HSA is zero. When employers offering HSA-qualified HDHPs has those firms that do not contribute to the HSA grown over the past several years, it is still relatively are excluded from the calculation, the average small, so we may see some rather large swings from employer contribution for covered workers is year to year for some statistics, particularly when $1,000 for single coverage and $1,640 for family subgroups are compared. It will be important to coverage. watch these relationships over time to see if the differences persist. noTe: 4 in the survey, we ask, “up to what dollar amount does your firm promise to contribute each year to an employee’s hra or health reimbursement arrangement for single coverage?” We refer to the amount that the employer commits to make available to an hra as a contribution for ease of discussion. as discussed, hras are notional accounts, and employers are not required to actually transfer funds until an employee incurs expenses. thus, employers may not expend the entire amount that they commit to make 8 available to their employees through an hra. s ection ei ght 127 t h e k a i s e r fa m i ly f o u n d at i o n - a n d - h e a lt h r e s e a r C h e d u C at i o n a l t r u s t
  • 142.
    Employer Health Benefits 2 0 0 9 A n n u a l s u r ve y  There is not a significant difference between the fuTure plANs percentage of small and large employers making  Firms indicate some interest in offering contributions to the HSAs of their workers (71% HDHP/HRAs and HSA-qualified HDHPs and 66%, respectively, for both single and family in the next year. coverage) (Exhibit 8.7).  Five percent of firms not currently offering an  For workers in firms that contribute to the HSAs HDHP/HRA report that they are “very likely” of their employers, workers with HSA-qualified to offer an HDHP/HRA in the next year, and HDHPs in small firms receive higher average another 15% of such firms report they are contributions from their employers to their HSAs “somewhat likely” to do so. Among firms not than workers in large firms. Covered workers in currently offering an HSA-qualified HDHP, 6% small firms with HSA-qualified HDHPs have report that they are “very likely” to do so in the average contributions by their employers to their next year and another 16% of such firms report HSAs of $1,319 for single coverage and $2,077 they are “somewhat likely” to do so (Exhibit 8.20). for family coverage, compared with average contributions for workers with HSA-qualified HDHPs in large firms of $619 for single coverage and $1,121 for family coverage (Exhibit 8.7).  Workers in HSA-qualified HDHPs in small firms face significantly higher deductibles for single coverage ($2,083) and family coverage ($4,034) than workers with HSA-qualified HDHPs in large firms, where deductibles average $1,710 for single coverage and $3,361 for an aggregate deductible for family coverage (Exhibit 8.7).  The maximum out-of-pocket liability for family coverage for workers in HSA-qualified HDHPs is higher for workers in large firms ($6,417) than for workers in smaller firms ($5,396) (Exhibit 8.7). High-Deductible Health Plans with Savings Option 8 s ection eig ht 128 t h e k a i s e r fa m i ly f o u n d at i o n - a n d - h e a lt h r e s e a r C h e d u C at i o n a l t r u s t
  • 143.
    Employer Health Benefits 2 0 0 9 An n u a l s u r ve y e x h i B i t 8.1 among fir ms o ffer ing health B enefits, Percentage that o ffer an hdhP/hr a and/or an hsa- Qualified hdhP, 2005–2009 50% 40% 30% 20% 13% 12% 11% 10% 10% 10% 6%* 7% 7% 3% 3% 4% 2% 1% 2% 2% 0% HDHP/HRA HSA QUALIFIED HDHP EITHER HDHP/HRA OR HSA QUALIFIED HDHP ‡ source: 2005 kaiser/hret survey of employer-sponsored health Benefits, 2005–2009. 2006 2007 * estimate is statistically different from estimate for the previous year shown (p.05). 2008 ‡ the 2009 estimate includes 0.1% of all firms offering health benefits that offer both an hdhP/hra and an hsa-qualified 2009 hdhP. the comparable percentages for 2005, 2006, 2007, and 2008 are 0.3%, 0.4%, 0.2%, and 0.3%, respectively. e x h i B i t 8.2 among fir ms o ffering health Benefits, Percentage that o ffer an hdhP/so, by fir m size, 2009 50% 40% High-Deductible Health Plans with Savings Option 30% 28% 20% 18% 11% 10% 0% 3 199 WORKERS* 200 999 WORKERS* 1,000 OR MORE WORKERS* source: kaiser/hret survey of employer-sponsored health Benefits, 2009. * estimate is statistically different from estimate for all other firms not in the indicated size category (p.05). note: the 2009 estimates include 0.1% of all firms offering health benefits that offer both an hdhP/hra and an hsa-qualified hdhP. 8 s ection ei ght 129 t h e k a i s e r fa m i ly f o u n d at i o n - a n d - h e a lt h r e s e a r C h e d u C at i o n a l t r u s t
  • 144.
    Employer Health Benefits 2 0 0 9 A n n u a l s u r ve y e x h i B i t 8. 3 among firms o ffering health Benefits, Percentage that o ffer an hdhP/so, by firm size, 2005–2009 50% 40% 30% 28%* 22% 20% 18% 17%* 18% 15% 13% 11% 13%* 10% 10% 10% 7% 4% 4% 5% 0% 3 199 WORKERS 200 999 WORKERS 1,000 OR MORE WORKERS source: 2005 kaiser/hret survey of employer-sponsored health Benefits, 2005–2009. 2006 2007 * estimate is statistically different from estimate for previous year shown (p.05). 2008 note: the 2009 estimate includes 0.1% of all firms offering health benefits that offer both an hdhP/hra and an 2009 hsa-qualified hdhP. the comparable percentages for 2005, 2006, 2007, and 2008 are 0.3%, 0.4%, 0.2%, and 0.3%, respectively. e x h i B i t 8. 4 Percentage of Covered Workers enrolled in an hdhP/hra or hsa- Qualified hdhP, 2006–2009 50% High-Deductible Health Plans with Savings Option 40% 30% 20% 10% 8%* 8% 6% 5% 3% 3% 3% 3% 4%* 4% 2% 2% 0% HDHP/HRA HSA QUALIFIED HDHP HDHP/SO source: 2006 kaiser/hret survey of employer-sponsored health Benefits, 2006–2009. 2007 2008 * estimate is statistically different from estimate for the previous year shown (p.05). 2009 8 s ection eig ht 130 t h e k a i s e r fa m i ly f o u n d at i o n - a n d - h e a lt h r e s e a r C h e d u C at i o n a l t r u s t
  • 145.
    Employer Health Benefits 2 0 0 9 An n u a l s u r ve y e x h i B i t 8.5 Percentage of Covered Workers enrolled in an hdhP/hra or hsa- Qualified hdhP, by firm size, 2009 50% 40% 30% 20% 13% 10% 9% 8% 6% 6% 3% 3% 3% 4% 0% HDHP/HRA HSA QUALIFIED HDHP* HDHP/SO* source: ALL SMALL FIRMS 3 199 WORKERS kaiser/hret survey of employer-sponsored health Benefits, 2009. ALL LARGE FIRMS 200 OR MORE WORKERS ALL FIRMS * estimates are statistically different between all small firms and all large firms within category (p.05). e x h i B i t 8.6 hdhP/hr a and hsa- Qualified hdhP features for Covered Wor kers, 2009 hDhp/hrA hsA-Qualified hDhp Annual plan Averages for: single family single family Premium $4,274 $12,223 $3,829 $10,396 Worker Contribution to Premium $734 $3,067 $438 $2,453 High-Deductible Health Plans with Savings Option General annual deductible‡ $1,690 $3,422 $1,922 $3,734 out-of-Pocket maximum liability‡ $3,035 $6,441 $2,976 $5,842 firm Contribution to the hra or hsa§ $1,052 $2,073 $688 $1,126 source: kaiser/hret survey of employer-sponsored health Benefits, 2009. ‡ ten percent of workers enrolled in hdhP/hras have employers that reported no out-of-pocket maximum for single coverage and family coverage. these workers are excluded from the hdhP/hra out-of-pocket maximum liability calculation. the deductible and out-of- pocket maximum averages shown for both hdhP/hras and hsa-qualified hdhPs for family coverage are for covered workers whose firms report that they face an aggregate amount. among covered workers in hdhP/hras, 19% are in plans whose family deductible is a separate per person amount and 11% are in a plan where the family out-of-pocket maximum is a separate per person amount. among covered workers in hsa-qualified hdhPs, the percentages are 7% for deductibles and 6% for out-of-pocket maximums. § When those firms that do not contribute to the hsa (29% for single and family coverage) are excluded from the calculation, the average firm contribution to the hsa for covered workers is $1,000 for single coverage and $1,640 for family coverage. for hdhP/hras, we refer to the amount that the employer commits to make available to an hra as a contribution for ease of discussion. hras are notional accounts, and employers are not required to actually transfer funds until an employee incurs expenses. thus, employers may not expend the entire amount that they commit to make available to their employees through an hra. therefore, the employer contribution amounts to hras that we capture in the survey may exceed the amount that employers will actually spend. 8 s ection ei ght 131 t h e k a i s e r fa m i ly f o u n d at i o n - a n d - h e a lt h r e s e a r C h e d u C at i o n a l t r u s t
  • 146.
    Employer Health Benefits 2 0 0 9 A n n u a l s u r ve y e x h i B i t 8. 7 hsa- Qualified hdhP features for Covered Wor kers, by fir m size, 2009 Annual plan Averages for: single Coverage family Coverage premium all small firms (3–199 Workers) $3,921 $10,170 all large firms (200 or more Workers) 3,706 10,694 All firm sizes $3,829 $10,396 Worker Contribution to premium all small firms (3–199 Workers) $426 $2,888* all large firms (200 or more Workers) 454 1,881* All firm sizes $438 $2,453 Deductible‡ all small firms (3–199 Workers) $2,083* $4,034* all large firms (200 or more Workers) 1,710* 3,361* All firm sizes $1,922 $3,734 out-of-pocket maximum liability‡ all small firms (3–199 Workers) $2,812 $5,396* all large firms (200 or more Workers) 3,193 6,417* All firm sizes $2,976 $5,842 percentage of firms Contributing to hsA all small firms (3–199 Workers) 71% 71% all large firms (200 or more Workers) 66 66 All firm sizes 71% 71% firm Contribution to hsA, Among Workers with a Contribution all small firms (3–199 Workers) $1,319* $2,077* all large firms (200 or more Workers) 619* 1,121* High-Deductible Health Plans with Savings Option All firm sizes $1,000 $1,640 firm Contribution to hsA§ all small firms (3–199 Workers) $868* $1,364* all large firms (200 or more Workers) 450* 815* All firm sizes $688 $1,126 source: kaiser/hret survey of employer-sponsored health Benefits, 2009. * estimates are statistically different within plan feature between all small firms and all large firms (p.05). ‡ the deductible and out-of-pocket maximum averages shown for family coverage are for covered workers whose firms report that they face an aggregate amount. among covered workers in hsa-qualified hdhPs, 7% are in plans whose family deductible is a separate per person amount and 6% are in a plan where the family out-of-pocket maximum is a separate per person amount. § includes workers in firms that do not contribute to the hsa. 8 s ection eig ht 132 t h e k a i s e r fa m i ly f o u n d at i o n - a n d - h e a lt h r e s e a r C h e d u C at i o n a l t r u s t
  • 147.
    Employer Health Benefits 2 0 0 9 An n u a l s u r ve y e x h i B i t 8.8 average annual Premiums and Contr ibutions to savings accounts for Covered Workers in hdhP/hr as or hsa- Qualified hdhPs, Compared to all non-hdhP/so Plans, 2009 hDhp/hrA hsA-Qualified hDhp Non-hDhp/so plans§ single family single family single family Total Annual premium $4,274* $12,223* $3,829* $10,396* $4,902 $13,591 Worker Contribution to Premium $734 $3,067* 438* $2,453* $801 $3,595 firm Contribution to Premium $3,540* $9,157 $3,391* $7,943* $4,101 $9,996 Annual firm Contribution to the hrA $1,052 $2,073 $688 $1,126 na na or hsA‡ Total Annual firm Contribution $4,592* $11,230* $4,079 $9,070* $4,101 $9,996 (firm share of Premium Plus firm Contribution to hra or hsa) Total Annual Cost $5,325* $14,296 $4,517* $11,523* $4,902 $13,591 (total Premium Plus firm Contribution to hra or hsa, if applicable) source: kaiser/hret survey of employer-sponsored health Benefits, 2009. * estimate is statistically different from estimate for all non-hdhP/so Plans (p.05). ‡ When those firms that do not contribute to the hsa (29% for single and family coverage) are excluded from the calculation, the average firm contribution to the hsa for covered workers is $1,000 for single coverage and $1,640 for family coverage. for hdhP/hras, we refer to the amount that the employer commits to make available to an hra as a contribution for ease of discussion. hras are notional accounts, and employers are not required to actually transfer funds until an employee incurs expenses. thus, employers may not expend the entire amount that they commit to make available to their employees through an hra. therefore, the employer contribution amounts to hras that we capture in the survey may High-Deductible Health Plans with Savings Option exceed the amount that employers will actually spend. § in order to compare costs for hdhP/sos to all other plans that are not hdhP/sos, we created composite variables excluding hdhP/so data. na: not applicable. note: Values shown in the table may not equal the sum of their component parts. the averages presented in the table are aggregated at the firm level and then averaged, which is methodologically more appropriate than adding the averages. this is relevant for total annual Premium, total annual firm Contribution, and total annual Cost. 8 s ection ei ght 133 t h e k a i s e r fa m i ly f o u n d at i o n - a n d - h e a lt h r e s e a r C h e d u C at i o n a l t r u s t
  • 148.
    Employer Health Benefits 2 0 0 9 A n n u a l s u r ve y e x h i B i t 8. 9 distribution of Covered Workers with the following General annual deduc tible amounts for single Coverage, hsa- Qualified hdhPs and hdhP/hras, 2009 HDHP/HRA 42% 23% 30% 6% HSA QUALIFIED HDHP 27% 26% 36% 10% HDHP/SO 33% 25% 34% 9% 0% 10% 20% 30% 40% 50% 60% 70% 80% 90% 100% source: $1,000 $1,499 kaiser/hret survey of employer-sponsored health Benefits, 2009. $1,500 $1,999 $2,000 $2,999 note: the minimum annual deductible for workers enrolled in hsa-qualified hdhPs is $1,150 in 2009 $3,000 OR MORE according to federal regulation. therefore, the distribution for hsa-qualified hdhPs starts at $1,150. e x h i B i t 8. 10 among Covered Workers, distribution of type of G eneral annual deduc tible for family Coverage, hdhP/hr as and hsa- Qualified hdhPs, 2009 aggregate amount separate amount per Person hdhP/hra 81% 19% hsa-Qualified hdhP 93 7 hDhp/so 89% 11% High-Deductible Health Plans with Savings Option source: kaiser/hret survey of employer-sponsored health Benefits, 2009. note: the survey distinguished between plans that have an aggregate deductible amount in which all family members’ out-of-pocket expenses count toward the deductible, and plans that have a separate amount for each family member, typically with a limit on the number of family members required to reach that amount. 8 s ection eig ht 134 t h e k a i s e r fa m i ly f o u n d at i o n - a n d - h e a lt h r e s e a r C h e d u C at i o n a l t r u s t
  • 149.
    Employer Health Benefits 2 0 0 9 An n u a l s u r ve y e x h i B i t 8.1 1 distribution of Covered Workers with the following aggregate family deduc tible amounts, hdhP/hras and hsa- Qualified hdhPs, 2009 HDHP/HRA 18% 25% 22% 18% 18% HSA QUALIFIED HDHP 13% 14% 31% 16% 26% HDHP/SO 14% 19% 28% 16% 23% 0% 10% 20% 30% 40% 50% 60% 70% 80% 90% 100% source: $2,000 $2,499 kaiser/hret survey of employer-sponsored health Benefits, 2009. $2,500 $2,999 $3,000 $3,999 note: the survey distinguished between family deductibles that are an aggregate amount in which all family $4,000 $4,999 members’ out-of-pocket expenses count toward the deductible, and plans that have a separate amount for each $5,000 OR MORE family member, typically with a limit on the number of family members required to reach that amount. the minimum annual family deductible for workers enrolled in hsa-qualified hdhP is $2,300 in 2009 according to federal regulation. therefore, the distribution for hsa-qualified hdhPs starts at $2,300. e x h i B i t 8.1 2 Percentage of Covered Wor kers with Coverage for the following s er vices Without having to first m eet the d educ tible, hdhP/hr as and hsa- Qualified hdhPs, by B enefit type, 2009 hdhP/hra hsa-Qualified hdhP hdhP/so Preventive Care 94% 90% 92% Prescription drugs 71% na na High-Deductible Health Plans with Savings Option source: kaiser/hret survey of employer-sponsored health Benefits, 2009. na: not applicable. firms with either hdhP/hras or hsa-qualified hdhPs were asked about preventive benefits, but only firms with hdhP/hras were asked about prescription drugs. hsa-qualified hdhPs are required by law to apply the plan deductible to nearly all services. 8 s ection ei ght 135 t h e k a i s e r fa m i ly f o u n d at i o n - a n d - h e a lt h r e s e a r C h e d u C at i o n a l t r u s t
  • 150.
    Employer Health Benefits 2 0 0 9 A n n u a l s u r ve y e x h i B i t 8. 13 Percentage of Covered Workers in Par tially or Completely self-funded hdhP/hras and hsa-Qualified hdhPs, 2009 100% 90% 80% 70% 61% 60% 50% 48% 40% 40% 30% 20% 10% 0% HDHP/HRA HSA QUALIFIED HDHP HDHP/SO source: kaiser/hret survey of employer-sponsored health Benefits, 2009. note: for definitions of self-funded and fully insured Plans, see the introduction to section 10. e x h i B i t 8. 14 distr ibution of Covered Workers with the following annual employer Contr ibutions to their hr a or hsa, for single Coverage, 2009 High-Deductible Health Plans with Savings Option HDHP/HRA 7% 20% 21% 4% 15% 32% 1% HSA QUALIFIED HDHP 31% 13% 13% 9% 7% 26% 0% 10% 20% 30% 40% 50% 60% 70% 80% 90% 100% source: $0 kaiser/hret survey of employer-sponsored health Benefits, 2009. $1 $399 $400 $599 note: for single coverage, 29% of employers offering hsa-qualified hdhPs (covering 31% $600 $799 of workers enrolled in these plans) do not make contributions towards the hsas that their $800 $999 workers establish. $1,000 $1,199 $1,200 OR MORE 8 s ection eig ht 136 t h e k a i s e r fa m i ly f o u n d at i o n - a n d - h e a lt h r e s e a r C h e d u C at i o n a l t r u s t
  • 151.
    Employer Health Benefits 2 0 0 9 An n u a l s u r ve y e x h i B i t 8.1 5 distr ibution of Covered Workers with the following annual employer Contr ibutions to their hr a or hsa, for family Coverage, 2009 HDHP/HRA 11% 16% 27% 19% 8% 18% HSA QUALIFIED HDHP 31% 29% 11% 6% 9% 6% 8% 0% 10% 20% 30% 40% 50% 60% 70% 80% 90% 100% source: $0 kaiser/hret survey of employer-sponsored health Benefits, 2009. $1 $999 $1,000 $1,499 note: for family coverage, 29% of employers offering hsa-qualified hdhPs (covering 31% $1,500 $1,999 of workers enrolled in these plans) do not make contributions towards the hsas that their $2,000 $2,499 workers establish. $2,500 $2,999 $3,000 OR MORE e x h i B i t 8.1 6 distr ibution of firm Contributions to the hr a for single and family Coverage relative to the average annual firm Contribution to the hr a, 2009 single Coverage family Coverage Premium range, Percent Covered Premium range, Percent Covered dollar amount Workers in range dollar amount Workers in range less than $841 49% less than $1,659 50% High-Deductible Health Plans with Savings Option $841 to $1,052 19% $1,659 to $2,073 20% $1,052 to $1,262 7% $2,073 to $2,488 4% $1,262 or more 25% $2,488 or more 27% source: kaiser/hret survey of employer-sponsored health Benefits, 2009. note: the average annual firm contribution to the hra is $1,052 for single coverage and $2,073 for family coverage. the hra account contribution distribution is relative to the average single or family account contribution. for example, $841 is 80% of the average single hra account contribution and $1,262 is 120% of the average single hra account contribution. the same break points relative to the average are used for the distribution for family coverage. 8 s ection ei ght 137 t h e k a i s e r fa m i ly f o u n d at i o n - a n d - h e a lt h r e s e a r C h e d u C at i o n a l t r u s t
  • 152.
    Employer Health Benefits 2 0 0 9 A n n u a l s u r ve y e x h i B i t 8. 17 distr ibution of firm Contributions to the hsa for single and family Coverage relative to the average annual firm Contribution to the hsa, 2009 single Coverage family Coverage Percent Covered Percent Covered Contribution range Contribution range Workers in range Workers in range less than $550 55% less than $901 55% $550 to $688 5% $901 to $1,126 9% $688 to $826 6% $1,126 to $1,352 6% $826 or more 33% $1,352 or more 30% source: kaiser/hret survey of employer-sponsored health Benefits, 2009. note: the average annual firm contribution to the hsa is $688 for single coverage and $1,126 for family coverage. the distribution includes workers in firms who do not make any contribution. the hsa account contribution distribution is relative to the average single or family account contribution. for example, $550 is 80% of the average single hsa account contribution and $826 is 120% of the average single hsa account contribution. the same break points relative to the average are used for the distribution for family coverage. High-Deductible Health Plans with Savings Option 8 s ection eig ht 138 t h e k a i s e r fa m i ly f o u n d at i o n - a n d - h e a lt h r e s e a r C h e d u C at i o n a l t r u s t
  • 153.
    Employer Health Benefits 2 0 0 9 An n u a l s u r ve y e x h i B i t 8.1 8 distr ibution of Covered Wor kers in hdhP/hr as and hsa- Qualified hdhPs With the following types of Cost shar ing in addition to the G eneral annual deduc tible, 2009 hsa-Qualified separate Cost sharing for a hospital Admission hdhP/hra hdhP/so§ hdhP deductible 0% na 0% Copayment and/or Coinsurance Copayment 4 3% 3 Coinsurance 69 43 52 Both Copay and Coinsurance‡ 1 1 1 Charge Per day 1 2 1 none 26 52 43 separate Cost sharing for an outpatient surgery episode deductible 2% na 1% Copayment and/or Coinsurance Copayment 3 3% 3 Coinsurance 62 44 51 Both Copay and Coinsurance‡ 1 0 1 none 34 52 46 separate Cost sharing for physician office visits Copayment only 30% 6% 14% Coinsurance only 56 36 44 Both Copayment and Coinsurance‡ 3 2 2 none 10 54 39 source: High-Deductible Health Plans with Savings Option kaiser/hret survey of employer-sponsored health Benefits, 2009. ‡ this includes enrollees who are required to pay the higher amount of either the copayment or coinsurance under the plan. § information on separate deductibles for hospital admissions or outpatient surgery was collected for hdhP/hras only. na: not applicable. information on separate annual deductibles for hospital admissions or outpatient surgery was not collected for hsa-qualified hdhPs because federal regulations make it unlikely the plan would have a separate deductible for specific services. note: as in past years, we collected information on the cost-sharing provisions for hospital admissions that are in addition to any general annual plan deductible. however, for the 2009 survey, in order to better capture the prevalence of combinations of cost sharing, the survey was changed to ask a series of yes or no questions. Previously, the question asked respondents to select one response from a list of types of cost sharing, such as separate deductibles, copayments, coinsurance, and per diem payments (for hospitalization only). due to the change in question format, the distribution of workers with types of cost sharing does not equal 100% as workers may face a combination of types of cost sharing. less than 1% of covered workers in hdhP/sos have an “other” type of cost sharing for a hospital admission, 0% have an “other” type of cost sharing for an outpatient surgery, and 2% have an “other” type of cost sharing for physician office visits. 8 s ection ei ght 139 t h e k a i s e r fa m i ly f o u n d at i o n - a n d - h e a lt h r e s e a r C h e d u C at i o n a l t r u s t
  • 154.
    Employer Health Benefits 2 0 0 9 A n n u a l s u r ve y e x h i B i t 8. 19 among firms o ffering hdhP/sos, employer opinions on outcomes and reasons for o ffering hdhP/sos, 2009 all large firms all small firms (200 or more all firms (3–199 Workers) Workers) most successful outcome encourage employees to be better health care consumers 17% 37% 27% Controlling health care costs/lower costs 56 43 49 too early to tell 6 5 6 has not been successful 6 3 4 Providing employees with more choice 1 1 1 other 13 10 11 don't know 1 1 1 biggest challenge* administration 6% 2% 4% Building participation 6 9 7 educating/communicating with employees regarding 45 78 61 benefit employee cannot afford deductible 16 5 10 none 6 1 3 other 22 4 13 don't know 1 1 1 how satisfied are employees Very satisfied 35% 41% 38% somewhat satisfied 44 44 44 High-Deductible Health Plans with Savings Option somewhat dissatisfied 10 6 8 Very dissatisfied 6 1 3 don't know 6 8 7 primary reason for offering* save on health care costs 84% 60% 72% to offer a lower cost alternative as a choice 8 8 8 employee request 2 6 4 employee retention/health care trend 1 3 2 encourage employees to be more responsible for health 1 17 9 care costs other 5 6 6 don't know 1 1 1 source: 8 kaiser/hret survey of employer-sponsored health Benefits, 2009. s ection eig ht * distributions for all small firms and all large firms are statistically different (p.05). 140 t h e k a i s e r fa m i ly f o u n d at i o n - a n d - h e a lt h r e s e a r C h e d u C at i o n a l t r u s t
  • 155.
    Employer Health Benefits 2 0 0 9 An n u a l s u r ve y e x h i B i t 8.2 0 among fir ms not Currently o ffering an hdhP/hr a or hsa- Qualified hdhP, distr ibution of fir ms r epor ting the likelihood of o ffering an hdhP/hr a or hsa- Qualified hdhP in the nex t year, by fir m size, 2009* somewhat not not Very likely don’t know likely too likely at all likely offer hDhp/hrA‡ 3–199 Workers 5% 16% 19% 60% 1% 200–999 Workers 7 14 25 54 1 1,000–4,999 Workers 10 12 25 53 1 5,000 or more Workers 11 14 20 55 1 All firms 5% 15% 19% 59% 1% offer hsA-Qualified hDhp‡ 3–199 Workers 5% 16% 23% 54% 1% 200–999 Workers 6 14 32 47 1 1,000–4,999 Workers 8 15 29 47 1 5,000 or more Workers 9 19 21 50 1 All firms 6% 16% 24% 54% 1% source: kaiser/hret survey of employer-sponsored health Benefits, 2009. * tests found no statistically different distributions between firm size category and all other firms (p.05). ‡ among firms not currently offering this type of hdhP/so. High-Deductible Health Plans with Savings Option 8 s ection ei ght 141 t h e k a i s e r fa m i ly f o u n d at i o n - a n d - h e a lt h r e s e a r C h e d u C at i o n a l t r u s t
  • 157.
    60% $4,8 2 4 Employer Health Benefits $ 13,375 2009 annual surVey Prescription Drug Benefits section 9 2009
  • 158.
    section nine Employer Health Benefits 2 0 0 9 A n n u a l s u r ve y 9 preSCription Drug BenefitS Prescription Drug Benefits virTually all covered workers have coverage for prescripTion drugs . m ore Than Three in four covered workers are in plans wiTh Three or more cosT - sharing Tiers for prescripTion drugs . c opaymenTs raTher Than coinsurance conTinue To be The dominanT form of cosT sharing for prescripTion drugs . presCripTioN Drug beNefiTs  Among workers covered by plans with three or more  As in prior years, nearly all (98%) covered workers tiers of cost sharing for prescription drugs, a large in employer-sponsored plans have a prescription majority face copayments rather than coinsurance drug benefit. for the first three tiers (Exhibit 9.3). The percentages differ slightly across drug types because  A large majority of covered workers (89%) in 2009 some plans have copayments for some drug tiers have some sort of tiered cost-sharing formula for and coinsurance for other drug tiers. prescription drugs (Exhibit 9.1). Cost-sharing tiers involve a health plan placing a drug on a  For covered workers in plans with three or more formulary or preferred drug list; generally classifying of cost sharing for prescription drugs, the average those drugs as generic, preferred brand-name, or drug copayments for first-tier drugs ($10), nonpreferred brand-name, and assigning different second-tier drugs ($27), and third-tier drugs cost sharing to each category. Over the past years, ($46) are consistent with the amounts reported an increasing number of plans have created a fourth in 2008 (Exhibit 9.4). tier of drug cost sharing, which may be used for  For covered workers in plans with three or lifestyle drugs or expensive biologics. more tiers of cost sharing for prescription drugs  Seventy-eight percent of covered workers are who face coinsurance rather than copayments, enrolled in plans with three, four, or more tiers coinsurance levels average 20% for first-tier drugs, of cost sharing for prescription drugs, a similar 26% for second-tier drugs, and 37% for third- percentage to last year (77%) (Exhibit 9.1). The tier drugs, also similar to the percentages reported prevalence of three or more tiers of cost sharing has in 2008 (Exhibit 9.4). increased from 69% of workers in 2004.  This year, 11% of workers are in a plan that has  HDHP/SOs have a different cost-sharing pattern four or more tiers of cost sharing for prescription from other plan types. Only 43% of covered drugs (Exhibit 9.1). For covered workers in plans workers in HDHP/SOs are in a plan with three with four cost-sharing tiers, 41% face a copayment or more tiers of cost sharing for prescription for fourth-tier drugs and 29% face coinsurance drugs. Fifteen percent of covered workers in (Exhibit 9.3). HDHP/SOs are in plans that apply the same  The average copayment for a fourth-tier drug is cost-sharing structure regardless of the type of $85 and the average coinsurance is 31% (Exhibit drug, and an additional 29% are in plans that 9.4). These amounts are not statistically different pay 100% of prescription costs once the plan from the amounts reported in 2008. deductible is met (Exhibit 9.2).  Twelve percent of covered workers are in a plan that has two tiers for prescription drug cost sharing (Exhibit 9.1). Similar to workers in plans with other cost-sharing tiers, copayments are more common than coinsurance for workers in plans with two tiers (Exhibit 9.5). The average copayment for the first tier is $10, and the average copayment for the second tier is $26 (Exhibit 9.6). 144 t h e k a i s e r fa m i ly f o u n d at i o n - a n d - h e a lt h r e s e a r C h e d u C at i o n a l t r u s t
  • 159.
    section nine Employer Health Benefits 2 0 0 9 An n u a l s u r ve y 9 Prescription Drug Benefits  Five percent of covered workers are covered by plans in which cost sharing is the same regardless of the Generic drugs: A drug product that is no longer type of drug chosen (Exhibit 9.1). Among these covered by patent protection and thus may be covered workers, 40% have copayments and 57% produced and/or distributed by multiple drug have coinsurance (Exhibit 9.7). The vast majority companies. of covered workers in HDHP/SOs with the same Preferred drugs: Drugs included on a formulary cost sharing regardless of the type of drug face or preferred drug list; for example, a brand-name coinsurance rather than copayments (83% vs. 7%) drug without a generic substitute. for prescriptions (Exhibit 9.7). Nonpreferred drugs: Drugs not included on a  For those workers with the same cost sharing formulary or preferred drug list; for example, a regardless of the type of drug, the average brand-name drug with a generic substitute. copayment is $15 and the average coinsurance is 22% (Exhibit 9.8). Fourth-tier drugs: New types of cost-sharing arrangements that typically build additional  Twelve percent of covered workers with drug layers of higher copayments or coinsurance for coverage face a separate drug deductible, in addition specifically identified types of drugs, such as to any general annual deductible the plan may have lifestyle drugs or biologics. (Exhibit 9.9). The average separate annual drug deductible is $108. Brand-name drugs: Generally, a drug product that is covered by a patent and is thus  As in 2008, ten percent of covered workers with manufactured and sold exclusively by one firm. drug coverage have a separate annual out-of-pocket Cross-licensing occasionally occurs, allowing an maximum that applies to prescription drugs additional firm to market the drug. After the (Exhibit 9.10). The average annual separate out-of- patent expires, multiple firms can produce the pocket maximum is $1,912. drug product, but the brand name or trademark remains with the original manufacturer’s product. 145 t h e k a i s e r fa m i ly f o u n d at i o n - a n d - h e a lt h r e s e a r C h e d u C at i o n a l t r u s t
  • 160.
    section nine Employer Health Benefits 2 0 0 9 A n n u a l s u r ve y e x h i B i t 9. 1 distr ibution of Covered Workers facing different Cost-shar ing for mulas for Prescr iption drug 9 B enefits, 2000–2009 Prescription Drug Benefits 2000 27% 49% 22% 2% 2001 * 41% 41% 18% 1% 2002 * 55% 30% 13% 1% 2003 * 63% 23% 13% 2% 2004 ‡ 3% 65% 20% 10% 1% 2005 * 4% 70% 15% 8% 2% 2006 5% 69% 16% 8% 2% 2% 2007 ‡ 7% 68% 16% 6% 1% 2008 * 7% 70% 15% 4% 3% 1% 2009 * 11% 67% 12% 5% 3% 3% 0% 10% 20% 30% 40% 50% 60% 70% 80% 90% 100% source: FOUR OR MORE TIERS kaiser/hret survey of employer-sponsored health Benefits, 2000-2009. THREE TIERS TWO TIERS * distribution is statistically different from distribution for the previous year shown (p.05). PAYMENT IS THE SAME ‡ no statistical tests are conducted between 2003 and 2004 or between 2006 and 2007 due REGARDLESS OF TYPE OF DRUG to the addition of a new category. NO COST SHARING AFTER DEDUCTIBLE IS MET note: fourth-tier drug cost sharing information was not obtained prior to 2004. OTHER 146 t h e k a i s e r fa m i ly f o u n d at i o n - a n d - h e a lt h r e s e a r C h e d u C at i o n a l t r u s t
  • 161.
    section nine Employer Health Benefits 2 0 0 9 An n u a l s u r ve y e x h i B i t 9.2 distr ibution of Covered Workers facing different Cost-shar ing for mulas for Prescr iption drug B enefits, by Plan type, 2009 9 Prescription Drug Benefits 1% HMO* 10% 66% 15% 6% 3% 1% PPO* 12% 69% 11% 4% 3% 2% POS* 7% 70% 17% 3% 1% HDHP/SO* 7% 36% 8% 15% 29% 5% ALL PLANS 11% 67% 12% 5% 3% 3% 0% 10% 20% 30% 40% 50% 60% 70% 80% 90% 100% source: FOUR OR MORE TIERS kaiser/hret survey of employer-sponsored health Benefits, 2009. THREE TIERS TWO TIERS * distribution is statistically different from all Plans distribution (p.05). PAYMENT IS THE SAME REGARDLESS OF TYPE OF DRUG NO COST SHARING AFTER DEDUCTIBLE IS MET OTHER 147 t h e k a i s e r fa m i ly f o u n d at i o n - a n d - h e a lt h r e s e a r C h e d u C at i o n a l t r u s t
  • 162.
    section nine Employer Health Benefits 2 0 0 9 A n n u a l s u r ve y e x h i B i t 9. 3 among Wor kers with three, four, or m ore tiers of Cost sharing, distribution of Covered Workers with the following types of Cost shar ing for Prescr iption drugs, by drug and Plan type, 2009 9 Prescription Drug Benefits Plan Pays either entire Cost some Copay Coinsurance first-Tier Drugs, often Called generic Drugs Copay or after any other only only Coinsurance‡ deductibles amount are met hmo* 92% 4% 2% 1% 3% PPo 84 7 3 1 6 Pos* 92 3 2 3 0 hdhP/so* 83 9 1 4 2 All plANs 86% 6% 2% 1% 4% Copay or second-Tier Drugs, often Called preferred Coinsurance Drugs Plus any differences§ hmo* 87% 4% 6% 0% 4% PPo 76 10 6 1 9 Pos* 91 3 2 1 3 hdhP/so* 76 15 2 1 6 All plANs 79% 9% 6% 1% 7% Third-Tier Drugs, often Called Nonpreferred Drugs hmo* 81% 6% 6% 1% 7% PPo 71 11 8 1 10 Pos* 87 6 2 0 4 hdhP/so* 74 15 4 1 7 All plANs 75% 10% 7% 1% 9% fourth-Tier Drugs hmo* 51% 15% 3% 4% 27% PPo 44 27 2 2 25 Pos nsd nsd nsd nsd nsd hdhP/so nsd nsd nsd nsd nsd All plANs 41% 29% 2% 2% 25% source: kaiser/hret survey of employer-sponsored health Benefits, 2009. * distribution is statistically different from all Plans distribution within drug type (p.05). ‡ this includes enrollees who are required to pay the higher amount of either the copayment or coinsurance under the plan. § Category includes workers who pay a copayment or coinsurance plus the difference between the cost of the prescription and the cost of a comparable generic drug. nsd: not sufficient data. note: these distributions do not include the 3% of covered workers whose employers report “none of the above” to the survey question about the type of prescription drug cost-sharing formula. for definitions of Generic, Preferred, nonpreferred, and fourth-tier drugs, see the introduction to section 9. 148 t h e k a i s e r fa m i ly f o u n d at i o n - a n d - h e a lt h r e s e a r C h e d u C at i o n a l t r u s t
  • 163.
    section nine Employer Health Benefits 2 0 0 9 An n u a l s u r ve y e x h i B i t 9.4 among Covered Workers with three, four, or m ore tiers of Prescr iption Cost shar ing, average Copayments and average Coinsurance, 2000–2009 9 Prescription Drug Benefits 2000 2001 2002 2003 2004 2005 2006 2007 2008 2009 Average Copayments first-tier drugs, often Called Generic $8 $8 $9 $9* $10* $10 $11* $11 $10 $10 second-tier drugs, often Called Preferred $15 $16* $18* $20* $22* $23* $25* $25 $26 $27 third-tier drugs, often Called nonpreferred $29 $28 $32* $35* $38* $40* $43* $43 $46* $46 fourth-tier drugs ^ ^ ^ ^ $59 $74 $59 $71* $75 $85 Average Coinsurance first-tier drugs, often Called Generic 18% 18% 18% 18% 18% 19% 19% 21% 21% 20% second-tier drugs, often Called Preferred nsd 23% 24% 23% 25% 27% 26% 26% 25% 26% third-tier drugs, often Called nonpreferred 28% 33% 40% 34%* 34% 38% 38% 40% 38% 37% fourth-tier drugs ^ ^ ^ ^ 30% 43%* 42% 36% 28% 31% source: kaiser/hret survey of employer-sponsored health Benefits, 2000–2009. * estimate is statistically different from estimate for the previous year shown (p.05). ^ fourth-tier drug copayment or coinsurance information was not obtained prior to 2004. nsd: not sufficient data. 149 t h e k a i s e r fa m i ly f o u n d at i o n - a n d - h e a lt h r e s e a r C h e d u C at i o n a l t r u s t
  • 164.
    section nine Employer Health Benefits 2 0 0 9 A n n u a l s u r ve y e x h i B i t 9. 5 among Workers with two tiers of Cost sharing for Prescription drugs, distribution of Covered Workers 9 with the following types of Cost sharing for Prescription drugs, by drug and Plan type, 2009 Prescription Drug Benefits Plan Pays either entire Cost some Copay Coinsurance first-Tier Drugs, often Called generic Drugs Copay or after any other only only Coinsurance‡ deductibles amount are met hmo* 95% 3% 1% 0% 2% PPo 72 8 7 9 3 Pos* 95 0 0 5 1 hdhP/so nsd nsd nsd nsd nsd All plANs 75% 10% 5% 8% 2% Copay or second-Tier Drugs, often Called preferred either some Copay Coinsurance Coinsurance Drugs Copay or other only only Plus Coinsurance‡ amount difference§ hmo* 90% 3% 1% 0% 7% PPo 51 25 10 1 13 Pos* 81 6 0 0 13 hdhP/so nsd nsd nsd nsd nsd All plANs 61% 24% 6% 1% 9% source: kaiser/hret survey of employer-sponsored health Benefits, 2009. * distribution is statistically different from all Plans distribution within drug type (p.05). ‡ this includes enrollees who are required to pay the higher amount of either the copayment or coinsurance under the plan. § Category includes workers who pay a copayment or coinsurance plus the difference between the cost of the prescription and the cost of a comparable generic drug. nsd: not sufficient data. note: these distributions do not include the 3% of covered workers whose employers report “none of the above” to the survey question about the type of prescription drug cost-sharing formula. for definitions of Generic and Preferred drugs, see the introduction to section 9. 150 t h e k a i s e r fa m i ly f o u n d at i o n - a n d - h e a lt h r e s e a r C h e d u C at i o n a l t r u s t
  • 165.
    section nine Employer Health Benefits 2 0 0 9 An n u a l s u r ve y e x h i B i t 9.6 among Covered Workers with two tiers of Prescription Cost sharing, average Copayments and average Coinsurance, 2000–2009 9 Prescription Drug Benefits 2000 2001 2002 2003 2004 2005 2006 2007 2008 2009 Average Copayments first-tier drugs, often Called Generic $7 $8* $9* $9 $10 $10 $11 $10 $11 $10 second-tier drugs, often Called Preferred $14 $15* $18* $20* $22* $22 $23 $23 $24 $26 Average Coinsurance first-tier drugs, often Called Generic 19% 17% 20% 21% 17% 16% 22% 21% 19% nsd second-tier drugs, often Called Preferred 28% 25% 25% 28% 25% 24% 27% 28% 32% 28% source: kaiser/hret survey of employer-sponsored health Benefits, 2000–2009. * estimate is statistically different from estimate for the previous year shown (p.05). nsd: not sufficient data. e x h i B i t 9.7 among Workers with the same Cost sharing regardless of type of drug, distribution of Covered Workers with the following types of Cost sharing for Prescription drugs, by Plan type, 2009 either Copay Coinsurance some Copay or only only other amount Coinsurance‡ hmo nsd nsd nsd nsd PPo* 25% 69% 4% 1% Pos nsd nsd nsd nsd hdhP/so* 7 83 1 10 All plANs 40% 57% 2% 1% source: kaiser/hret survey of employer-sponsored health Benefits, 2009. * distribution is statistically different from all Plans distribution (p.05). ‡ this includes enrollees who are required to pay the higher amount of either the copayment or coinsurance under the plan. nsd: not sufficient data. note: these distributions do not include the 3% of covered workers whose employers report “none of the above” to the survey question about the type of prescription drug cost sharing formula. 151 t h e k a i s e r fa m i ly f o u n d at i o n - a n d - h e a lt h r e s e a r C h e d u C at i o n a l t r u s t
  • 166.
    section nine Employer Health Benefits 2 0 0 9 A n n u a l s u r ve y e x h i B i t 9. 8 among Covered Workers with the same Cost sharing regardless of type of drug, average Copayments 9 and average Coinsurance, 2000-2009 Prescription Drug Benefits 2000 2001 2002 2003 2004 2005 2006 2007 2008 2009 Average Copayments $8 $10* $10 $10 $14* $10* $13* $13 $15 $15 Average Coinsurance 22% 20% 23% 22% 25% 23% 23% 22% 24% 22% source: kaiser/hret survey of employer-sponsored health Benefits, 2000–2009. * estimate is statistically different from estimate for the previous year shown (p.05). e x h i B i t 9. 9 Percentage of Covered Wor kers with drug Coverage Who face a s eparate drug deduc tible, by Plan type, 2005–2009* 50% 40% 30% 20% 14% 15% 11% 12% 11% 12% 11% 10% 11% 11% 12% 10% 8% 9% 8% 7% 4% 0% HMO PPO POS ALL PLANS source: 2005 2007 2008 2009 kaiser/hret survey of employer-sponsored health Benefits, 2005–2009. * tests found no statistical difference from estimate for the previous year shown (p.05). note: information on hdhP/sos was not collected prior to 2008 because, due to federal regulations, it is unlikely a plan would have a separate deductible for prescription drugs. in 2009, information on separate drug deductibles was collected for hdhP/hras only, and 4% of covered workers in hdhP/hras have a separate drug deductible. in 2007, information on whether a plan has a separate drug deductible was not imputed for one PPo and one Pos plan that cover prescription drugs. if these responses had been imputed, the prevalence of separate drug deductibles would not have changed for PPos and would have increased or decreased no more than 1% for Pos plans. Questions about separate drug deductibles were not asked in 2006. 152 t h e k a i s e r fa m i ly f o u n d at i o n - a n d - h e a lt h r e s e a r C h e d u C at i o n a l t r u s t
  • 167.
    section nine Employer Health Benefits 2 0 0 9 An n u a l s u r ve y e x h i B i t 9.1 0 Percentage of Covered Workers with drug Coverage with a separate annual out-of-Pocket limit that applies to Prescription drugs, by Plan type, 2007–2009* 9 Prescription Drug Benefits 50% 40% 30% 20% 11% 10% 11% 10% 11% 10% 10% 10% 8% 8% 6% 5% 6% 0% HMO PPO POS ALL PLANS source: 2007 kaiser/hret survey of employer-sponsored health Benefits, 2007–2009. 2008 2009 * tests found no statistical difference from estimate for the previous year shown (p.05). note: data for hdhP/sos are not included in this exhibit because hsa-qualified hdhPs are required by law to have an annual out- of-pocket limit of no more than $5,800 for single coverage and $11,600 for family coverage in 2009, making it unlikely a plan would include a separate out-of-pocket maximum for prescription drugs. as a result, only firms offering hdhP/hras were asked if the plan has a separate out-of-pocket maximum that applies to prescription drugs. among covered workers enrolled in hdhP/hras, 3% are enrolled in plans with a separate annual out-of-pocket limit that applies to prescription drugs in 2009. 153 t h e k a i s e r fa m i ly f o u n d at i o n - a n d - h e a lt h r e s e a r C h e d u C at i o n a l t r u s t
  • 169.
    60% $4,8 2 4 Employer Health Benefits $ 13,375 2009 annual surVey Plan Funding section 10 2009
  • 170.
    Employer Health Benefits 2 0 0 9 A n n u a l s u r ve y plan funDing section ten T he e mployee r eTiremenT i ncome s ecuriTy a cT (erisa) of 1974 exempTs self - funded plans from sTaTe insurance laws , including reser ve requiremenTs , mandaTed benefiTs , premium Taxes , and consumer proTecTion regulaTions . o ver one half (57%) of covered workers are in a self - funded healTh plan . b ecause larger firms have more employees over whom To spread The risk of cosTly claims , self funding is 10 more common and less risky for larger firms Than for smaller ones . Plan Funding  Slightly more than half (57%) of covered workers  A higher percentage of workers in PPOs are in are in a self-funded plan (Exhibit 10.1). The a self-funded plan (67%), compared to 48% in percentage of covered workers who are in a plan that conventional health plans, 48% in HDHP/SOs, is completely or partially self-funded has remained 40% in HMOs, and 25% in POS plans stable over the last few years, but has increase from (Exhibit 10.2). 44% in 1999. Self-Funded Plan: An insurance arrangement  As expected, covered workers in large firms (200 in which the employer assumes direct financial or more workers) are more likely to be in a self- responsibility for the costs of enrollees’ medical funded plan than workers in small firms (3–199 claims. Employers sponsoring self-funded plans workers) (77% vs. 15%) (Exhibit 10.3). The typically contract with a third-party administrator percentage of covered workers in self-funded or insurer to provide administrative services for plans increases as the number of employees the self-funded plan. In some cases, the employer increases. Forty-eight percent of workers in firms may buy stop-loss coverage from an insurer to with 200 to 999 workers are in self-funded plans, protect the employer against very large claims. compared to 80% of workers in firms with 1,000 to 4,999 workers, and 88% of workers in firms Fully Insured Plan: An insurance arrangement in with 5,000 or more workers (Exhibit 10.3). which the employer contracts with a health plan As previously mentioned, these percentages that assumes financial responsibility for the costs have changed little over the past several years of enrollees’ medical claims. (Exhibit 10.1). 156 t h e k a i s e r fa m i ly f o u n d at i o n - a n d - h e a lt h r e s e a r C h e d u C at i o n a l t r u s t
  • 171.
    Employer Health Benefits 2 0 0 9 An n u a l s u r ve y e x h i B i t 10.1 Percentage of Covered Workers in Par tially or Completely self-funded Plans, by firm size, 1999–2009* section ten 1999 2000 2001 2002 2003 2004 2005 2006 2007 2008 2009 3–199 Workers 13% 15% 17% 13% 10% 10% 13% 13% 12% 12% 15% 200–999 Workers 51 53 52 48 50 50 53 53 53 47 48 1,000–4,999 Workers 62 69 66 67 71 78 78 77 76 76 80 5,000 or more Workers 62 72 70 72 79 80 82 89 86 89 88 10 All firms 44% 49% 49% 49% 52% 54% 54% 55% 55% 55% 57% Plan Funding source: kaiser/hret survey of employer-sponsored health Benefits, 1999–2009. * tests found no statistical difference from estimate for the previous year shown (p.05). note: due to a change in the survey questionnaire, funding status was not asked of firms with conventional plans in 2006. therefore, conventional plan funding status is not included in this exhibit for 2006. for definitions of self-funded and fully insured plans, see the introduction to section 10. e x h i B i t 10.2 Percentage of Covered Workers in Par tially or Completely self-funded Plans, by Plan type, 1999–2009 1999 2000 2001 2002 2003 2004 2005 2006 2007 2008 2009 Conventional 65% 64% 65% 58% 49% 43% 53% ^ 53% 47% 48% hmo 16 23* 31* 27 29 29 32 33 34 40 40 PPo 60 63 61 61 61 64 65 63 65 64 67 Pos 42 45 42 40 44 46 36 32 34 29 25 hdhP/so ^ ^ ^ ^ ^ ^ ^ 50 41 35 48* All plANs 44% 49% 49% 49% 52% 54% 54% 55% 55% 55% 57% source: kaiser/hret survey of employer-sponsored health Benefits, 1999–2009. * estimate is statistically different from estimate for the previous year shown (p.05). ^ information was not obtained for conventional plans in 2006 and hdhP/so plans prior to 2006. note: due to a change in the survey questionnaire, funding status was not asked of firms with conventional plans in 2006. therefore, conventional plan funding status is not included in this exhibit for 2006. for definitions of self-funded and fully insured plans, see the introduction to section 10. 157 t h e k a i s e r fa m i ly f o u n d at i o n - a n d - h e a lt h r e s e a r C h e d u C at i o n a l t r u s t
  • 172.
    Employer Health Benefits 2 0 0 9 A n n u a l s u r ve y e x h i B i t 10. 3 Percentage of Covered Workers in Par tially or Completely s elf-funded Plans, by fir m size, region, and i ndustr y, 2009 section ten self-funded (employer Bears some or all of financial risk) firm size 200–999 Workers 48%* 10 1,000–4,999 Workers 80* 5,000 or more Workers 88* Plan Funding All small firms (3–199 Workers) 15%* All large firms (200 or more Workers) 77%* regioN northeast 62% midwest 58 south 63* West 40* iNDusTry agriculture/mining/Construction 35%* manufacturing 70* transportation/Communications/utilities 76* Wholesale 53 retail 40* finance 61 service 49* state/local Government 59 health Care 72* All firms 57% source: kaiser/hret survey of employer-sponsored health Benefits, 2009. * estimate is statistically different from estimate for all other firms not in the indicated size, region, or industry category (p.05). note: for definitions of self-funded and fully insured plans, see the introduction to section 10. 158 t h e k a i s e r fa m i ly f o u n d at i o n - a n d - h e a lt h r e s e a r C h e d u C at i o n a l t r u s t
  • 173.
    Employer Health Benefits 2 0 0 9 An n u a l s u r ve y e x h i B i t 10.4 Percentage of Covered Workers in Par tially or Completely self-funded Plans, by Plan type and firm size, 2009 section ten Conventional hmo PPo Pos hdhP/so 3–199 Workers nsd 6%* 21%* 5%* 18%* 200–999 Workers nsd 26* 55* 39 36 1,000–4,999 Workers nsd 50 87* 53* 81* 5,000 or more Workers nsd 61* 93* 76* 96* 10 Plan Funding All firms 48% 40% 67% 25% 48% source: kaiser/hret survey of employer-sponsored health Benefits, 2009. * estimate is statistically different from estimate for all other firms not in the indicated size category within plan type (p.05). nsd: not sufficient data. note: for definitions of self-funded and fully insured plans, see the introduction to section 10. e x h i B i t 10.5 Percentage of Covered Workers in Par tially or Completely s elf-funded hmo Plans, by fir m size, 1999–2009 1999 2000 2001 2002 2003 2004 2005 2006 2007 2008 2009 3–199 Workers 5% 4% 14% 10% 5% 4% 10% 3% 1% 10% 6% 200–999 Workers 14 13 23 16 21 18 17 29 19 22 26 1,000–4,999 Workers 22 27 32 31 37 49 50 54 44 48 50 5,000 or more Workers 19 35* 40 38 44 40 44 47 58 66 61 All hmo plANs 16% 23%* 31%* 27% 29% 29% 32% 33% 34% 40% 40% source: kaiser/hret survey of employer-sponsored health Benefits, 1999-2009. * estimate is statistically different from estimate for the previous year shown (p.05). note: for definitions of self-funded and fully insured plans, see the introduction to section 10. 159 t h e k a i s e r fa m i ly f o u n d at i o n - a n d - h e a lt h r e s e a r C h e d u C at i o n a l t r u s t
  • 174.
    Employer Health Benefits 2 0 0 9 A n n u a l s u r ve y e x h i B i t 10. 6 Percentage of Covered Workers in Par tially or Completely s elf-funded PPo Plans, by fir m size, 1999–2009 section ten 1999 2000 2001 2002 2003 2004 2005 2006 2007 2008 2009 3–199 Workers 19% 23% 23% 15% 13% 13% 18% 19% 17% 15% 21% 200–999 Workers 69 72 66 63 60 63 67 61 65 55 55 1,000–4,999 Workers 84 89 87 83 85 88 88 85 87 85 87 10 5,000 or more Workers 87 88 87 93 93 93 95 97 90* 94 93 Plan Funding All ppo plANs 60% 63% 61% 61% 61% 64% 65% 63% 65% 64% 67% source: kaiser/hret survey of employer-sponsored health Benefits, 1999–2009. * estimate is statistically different from estimate for the previous year shown (p.05). note: for definitions of self-funded and fully insured plans, see the introduction to section 10. e x h i B i t 10. 7 Percentage of Covered Workers in Par tially or Completely s elf-funded Pos Plans, by fir m size, 1999–2009 1999 2000 2001 2002 2003 2004 2005 2006 2007 2008 2009 3–199 Workers 10% 10% 10% 10% 8% 9% 9% 6% 14% 9% 5% 200–999 Workers 35 39 40 21* 42* 42 31 36 33 20 39 1,000–4,999 Workers 62 71 60 67 73 63 48 62 47 52 53 5,000 or more Workers 75 77 76 67 71 77 74 80 89 65 76 All pos plANs 42% 45% 42% 40% 44% 46% 36% 32% 34% 29% 25% source: kaiser/hret survey of employer-sponsored health Benefits, 1999-2009. * estimate is statistically different from estimate for the previous year shown (p.05). note: for definitions of self-funded and fully insured plans, see the introduction to section 10. 160 t h e k a i s e r fa m i ly f o u n d at i o n - a n d - h e a lt h r e s e a r C h e d u C at i o n a l t r u s t
  • 175.
    Employer Health Benefits 2 0 0 9 An n u a l s u r ve y e x h i B i t 10.8 Percentage of Covered Workers in Par tially or Completely s elf-funded hdhP/sos, by fir m size, 2006–2009 section ten 2006 2007 2008 2009 3–199 Workers 7% 4% 7% 18% 200–999 Workers 57 27 48 36 1,000–4,999 Workers 81 86 72 81 5,000 or more Workers 100 97 91 96 10 Plan Funding All hDhp/sos 50% 41% 35% 48%* source: kaiser/hret survey of employer-sponsored health Benefits, 2006–2009. * estimate is statistically different from estimate for the previous year shown (p.05). note: information on funding status for hdhP/sos was not collected prior to 2006. for definitions of self-funded and fully insured plans, see the introduction to section 10. 161 t h e k a i s e r fa m i ly f o u n d at i o n - a n d - h e a lt h r e s e a r C h e d u C at i o n a l t r u s t
  • 177.
    60% $4,8 2 4 Employer Health Benefits $ 13,375 2009 annual surVey Retiree Health Benefits section 11 2009
  • 178.
    Employer Health Benefits 2 0 0 9 A n n u a l s u r ve y r e t i r e e h e a lt h B e n e f i t S r eTiree healTh benefiTs are an imporTanT consideraTion for older workers making decisions abouT Their reTiremenT . h ealTh benefiTs for reTirees also provide an imporTanT supplemenT To m edicare for reTirees age 65 or older. a mong firms offering healTh benefiTs To Their workers , large firms (200 or more workers ) are much more likely Than small firms (3-199 workers ) To offer reTiree healTh benefiTs . T he percenTage of large firms offering coverage fell dramaTically from The laTe 1980 s To The early 1990 s , section eleven and has been declining slowly since .  Twenty-nine percent of large firms (200 or more  Large firms (200 or more workers) with union workers) that offer health benefits to their employees workers are significantly more likely to offer offer retiree coverage in 2009, similar to 31% in retiree health benefits than large firms without 11 2008 but down from 66% in 1988 (Exhibit 11.1). union workers—47% of all large firms with union employees that offer health benefits offer Retiree Health Benefits  The percentage of firms offering retiree health retiree health benefits, compared to 22% for all benefits varies substantially by firm size, industry, large firms with no union employees (Exhibit presence of union workers, and other factors. 11.3).  Large firms (200 or more workers) are much  Large firms (200 or more workers) with fewer more likely to offer retiree health benefits than younger workers (less than 35% of workers are 26 small firms (3–199 workers). Among firms that years old or less) are significantly more likely to offer health benefits, 29% of large firms offer offer retiree health benefits than large firms with retiree health benefits, compared to just 5% of a higher proportion of younger workers (35% small firms (Exhibit 11.2). or more workers are 26 years old or less)—31%  Among large firms (200 or more workers) that versus 15% (Exhibit 11.3). offer health benefits, state and local governments,  Among firms offering health benefits, virtually all and firms in the transportation, communications, large firms (200 or more workers) that offer retiree and utilities industry category are more likely health benefits offer them to early retirees under the than large firms in other industries to offer retiree age of 65 (92%). A lower percentage (68%) of large health benefits (Exhibit 11.2). In contrast, large firms offering retiree health benefits offer them to firms in the retail, wholesale, service, and health Medicare-age retirees (Exhibit 11.4). care industries are less likely to offer retiree health benefits when compared to large firms in other industries. 164 t h e k a i s e r fa m i ly f o u n d at i o n - a n d - h e a lt h r e s e a r C h e d u C at i o n a l t r u s t
  • 179.
    Employer Health Benefits 2 0 0 9 An n u a l s u r ve y e x h i B i t 11.1 among all large firms (200 or m ore Workers) o ffer ing health B enefits to ac tive Wor kers, Percentage of firms o ffering retiree health B enefits, 1988–2009* 100% 90% 80% 70% 66% 60% section eleven 50% 46% 40% 40% 40% 38% 40% 36% 35% 37% 36% 36% 35% 33% 33% 31% 30% 29% 20% 10% 0% 1988 1991 1993 1995 1998 1999 2000 2001 2002 2003 2004 2005 2006 2007 2008 2009 11 Retiree Health Benefits source: kaiser/hret survey of employer-sponsored health Benefits, 1999–2009; kPmG survey of employer-sponsored health Benefits, 1991, 1993, 1995, 1998; the health insurance association of america (hiaa), 1988. * tests found no statistical difference from estimate for the previous year shown (p.05). no statistical tests are conducted for years prior to 1999. 165 t h e k a i s e r fa m i ly f o u n d at i o n - a n d - h e a lt h r e s e a r C h e d u C at i o n a l t r u s t
  • 180.
    Employer Health Benefits 2 0 0 9 A n n u a l s u r ve y e x h i B i t 11. 2 among firms offering health Benefits to active Workers, Percentage of firms offering retiree health Benefits, by firm size, region, and industr y, 2009 all small firms all large firms (3–199 Workers) (200 or more Workers) firm size 3–199 Workers 5% — 200–999 Workers — 24%* section eleven 1,000–4,999 Workers — 39* 5,000 or more Workers — 49* regioN northeast 7% 27% midwest 6 28 south 4 33 11 West 3 26 Retiree Health Benefits iNDusTry agriculture/mining/Construction 2%* 34% manufacturing 5 30 transportation/Communications/utilities nsd 50* Wholesale 3 18* retail 0* 12* finance 9 41 service 4 22* state/local Government nsd 81* health Care 1* 20* All firms 5% 29% source: kaiser/hret survey of employer-sponsored health Benefits, 2009. * estimate is statistically different within small or large firm category from estimate for all other firms not in the indicated size, region, or industry category (p.05). nsd: not sufficient data. 166 t h e k a i s e r fa m i ly f o u n d at i o n - a n d - h e a lt h r e s e a r C h e d u C at i o n a l t r u s t
  • 181.
    Employer Health Benefits 2 0 0 9 An n u a l s u r ve y e x h i B i t 11.3 among all large firms (200 or m ore Workers) o ffer ing health B enefits to ac tive Wor kers, Percentage of firms o ffering retiree health B enefits, by fir m Charac ter istics, 2009 WAGE LEVEL* FEW WORKERS ARE LOWER WAGE LESS THAN 35% EARN $23,000 A YEAR OR LESS 32% MANY WORKERS ARE LOWER WAGE 35% OR MORE EARN $23,000 A YEAR OR LESS 19% PART TIME WORKERS* FEW WORKERS ARE PART TIME LESS THAN 35% WORK PART TIME 33% section eleven MANY WORKERS ARE PART TIME 35% OR MORE WORK PART TIME 13% UNIONS* FIRM HAS AT LEAST SOME UNION WORKERS 47% FIRM DOES NOT HAVE ANY UNION WORKERS 22% AGE* LESS THAN 35% OF WORKERS 31% 11 ARE 26 YEARS OLD OR LESS 35% OR MORE WORKERS ARE 26 YEARS OLD OR LESS 15% Retiree Health Benefits 0% 10% 20% 30% 40% 50% source: kaiser/hret survey of employer-sponsored health Benefits, 2009. * estimates are statistically different from each other within category (p.05). e x h i B i t 11.4 among all large fir ms (200 or m ore Wor kers) o ffering health Benefits to ac tive Workers and o ffer ing retiree Coverage, Percentage of fir ms o ffer ing health B enefits to ear ly and m edicare - age r etirees, 1999–2009 100% 98%* 96% 96% 94% 94% 93% 93% 92% 93% 92% 90% 89% 81% 80% 76% 76% 78% 75% 77% 75% 71% 73% 71% 70% 68% 60% 50% 40% 30% 20% 10% 0% 1999 2000 2001 2002 2003 2004 2005 2006 2007 2008 2009 1999 2000 2001 2002 2003 2004 2005 2006 2007 2008 2009 OFFER HEALTH BENEFITS TO EARLY RETIREES OFFER HEALTH BENEFITS TO MEDICARE AGE RETIREES source: kaiser/hret survey of employer-sponsored health Benefits, 1999–2009. * estimate is statistically different from estimate for the previous year shown (p.05). early retirees: Workers retiring before age 65. 167 t h e k a i s e r fa m i ly f o u n d at i o n - a n d - h e a lt h r e s e a r C h e d u C at i o n a l t r u s t
  • 182.
    Employer Health Benefits 2 0 0 9 A n n u a l s u r ve y e x h i B i t 11. 5 among all large firms (200 or more Workers) offering health Benefits to active Workers and offering retiree Coverage, Percentage of firms offering retiree health Benefits to early and medicare -age retirees, by firm size, region, and industr y, 2009 Percentage of large Percentage of large employers offering employers offering retiree health Benefits retiree health Benefits to early retirees to medicare-age retirees firm size section eleven 200–999 Workers 88%* 61%* 1,000–4,999 Workers 95 75 5,000 or more Workers 97* 85* regioN northeast 88% 73% midwest 97* 67 11 south 88 64 West 99* 75 Retiree Health Benefits iNDusTry agriculture/mining/Construction nsd nsd manufacturing 93% 74% transportation/Communications/utilities 92 64 Wholesale nsd nsd retail nsd nsd finance 95 68 service 88 70 state/local Government 100* 73 health Care nsd nsd All lArge firms (200 or more Workers) 92% 68% source: kaiser/hret survey of employer-sponsored health Benefits, 2009. * estimate is statistically different from estimate for all other large firms not in the indicated size, region, or industry category (p.05). early retirees: Workers retiring before age 65. nsd: not sufficient data. 168 t h e k a i s e r fa m i ly f o u n d at i o n - a n d - h e a lt h r e s e a r C h e d u C at i o n a l t r u s t
  • 183.
    60% $4,8 2 4 Employer Health Benefits $ 13,375 2009 annual surVey Wellness Programs and Health Risk Assessments section 12 2009
  • 184.
    Employer Health Benefits 2 0 0 9 A n n u a l s u r ve y W e l l n e S S p r o g r a M S a n D h e a lt h r i S k a S S e S S M e n t S e mployers play a significanT role in healTh insurance coverage — sponsoring healTh benefiTs for abouT 159 million nonelderly people in a merica 1 — and many firms also provide wellness programs To Their employees . as in 2008, The sur vey included several quesTions on The wellness programs offered To employees , incenTives for parTicipaTion in wellness programs , and employer opinions of wellness programs . T his year ’s sur vey included new quesTions on The financial incenTives provided if employees compleTe a healTh risk assessmenT . WellNess beNefiTs  Among firms offering health benefits and at least  In an effort to improve health and lower costs, some one wellness program, 81% of employers report employers and health plans offer wellness programs. that most of the wellness benefits they offer are Wellness programs may range from classes in provided through the health plan (Exhibit 12.3).3 section twelve nutrition or healthy living to a wellness newsletter. There is a significant difference between small firms (3–199 workers) and large firms (200 or  Fifty-eight percent of firms offering health more workers) in the percentage reporting that benefits offer at least one of the following most wellness programs are provided by the wellness programs: weight loss programs, gym health plan (83% vs. 60%) (Exhibit 12.3). membership discounts or on-site exercise  In order to encourage participation in wellness facilities, smoking cessation program, personal 12 health coaching, classes in nutrition or healthy programs, firms may offer financial incentives to employees who participate.4 living, web-based resources for healthy living, Wellness Programs and Health Risk Assessments or a wellness newsletter.2 The offer rate for each  Ten percent of firms offering health benefits offer type of wellness benefit included in the survey gift cards, travel, merchandise, or cash to workers is presented in Exhibit 12.1 and Exhibit 12.2. who participate in wellness programs, and large Forty-eight percent of firms offering health firms (200 or more workers) are more likely to insurance and wellness benefits offer the benefits offer these incentives than small firms (3–199 to spouses or dependents (Exhibit 12.3). workers) (27% vs. 9%) (Exhibit 12.4).  The percentage of large firms (200 or more  Very few firms offering health benefits offer the workers) offering at least one wellness program following incentives to workers who participate increased from 88% in 2008 to 93% in 2009, in wellness programs: a smaller share of the while the percentage of small firms (3–199 premium (4%) or a lower deductible (1%). workers) did not statistically increase. Among firms that offer a high-deductible plan paired with a HRA or HSA, 1% of firms offer workers who participate in wellness programs higher HSA or HRA contributions than employees who do not participate (Exhibit 12.4). noTes: 1 kaiser family foundation, kaiser Commission on medicaid and the uninsured, the uninsured: a Primer, october 2008. 2 in 2009, respondents were given the option to report “other” types of wellness programs. if those firms that responded “other” are included, the percentage offering at least one wellness benefit is 60 percent. 3 the survey asks firms offering at least one wellness program if most of the wellness benefits are provided by the health plan or by the firm. 4 We modified the survey instrument this year so that firms that offer only web-based resources or a wellness newsletter are not asked questions about any financial incentives provided. 170 t h e k a i s e r fa m i ly f o u n d at i o n - a n d - h e a lt h r e s e a r C h e d u C at i o n a l t r u s t
  • 185.
    Employer Health Benefits 2 0 0 9 An n u a l s u r ve y  Firms sometimes use methods such as health fairs  Among firms offering an HDHP/SO and wellness or health claims that identify health risks to identify benefits, 10% report that their decision to offer a individuals and encourage participation in wellness wellness program was related to their decision to programs. offer a high-deductible health plan.  Twenty percent of firms offering health benefits  Among firms offering health benefits, almost two- and wellness programs use health fairs to identify thirds (63%) of employers think offering wellness individuals and encourage participation in programs is effective in improving the health of wellness programs. About 15% of firms report the firm’s employees. Among those firms offering the use of claims to identify individuals and health coverage, 51% of employers think offering encourage wellness participation (Exhibit 12.5). wellness programs is effective in reducing their The percentage of firms using claims to identify firm’s health care costs. Large firms (200 or more individuals with health risks to encourage their workers) are more likely than small firms (3–199 participation in wellness programs increased from workers) to think offering wellness programs is 6% in 2008 to 15% in 2009. effective improving health (80% vs. 61%) or section twelve in reducing health care costs (71% vs. 49%)  Large firms (200 or more workers) are more likely (Exhibit 12.7). than small firms (3–199 workers) to use health fairs or claims information to encourage wellness h e A lT h r i s k A s s e s s m e N T s participation. Forty-six percent of large firms  Some firms give their employees the option of (200 or more workers) offering health benefits completing a health risk assessment to identify and wellness benefits use health fairs to encourage potential health risks. Health risk assessments participation in wellness programs, compared to generally include questions on medical history, 12 18% of small firms (3–199 workers). Thirty-five health status, and lifestyle. Wellness Programs and Health Risk Assessments percent of large firms (200 or more workers) offering health benefits and wellness benefits  Overall, 16% of firms offering health use claims to identify individuals and encourage benefits offer health risk assessments to their participation in wellness, compared to 13% of employees. Fifty-five percent of large firms small firms (3–199 workers) (Exhibit 12.5). (200 or more workers) provide the option, compared to 14% of small firms (3–199  Among firms offering health benefits and wellness workers) (Exhibit 12.8). programs, 20% of employers report their primary reason for offering wellness programs is to improve  Thirty-eight percent of firms that offer health the health of employees and reduce absenteeism. risk assessments use them as a method to identify Thirty-six percent of employers offering health individuals and encourage their participation benefits and wellness programs state their primary in wellness programs. Sixty-one percent of reason is that the benefits were part of the health large firms (200 or more workers) use health plan. Large firms (200 or more workers) are more risk assessments to encourage participation in likely than small firms (3–199 workers) to report wellness programs, compared to 33% of small that reducing health care costs (28% vs. 9%) or firms (3–199 workers) (Exhibit 12.8). improving the health of employees and reducing absenteeism (32% vs. 19%) was a primary reason for offering wellness (Exhibit 12.6).5 noTe: 5 less than 1% of firms reported “don’t know” when asked their primary reason for offering wellness programs. 171 t h e k a i s e r fa m i ly f o u n d at i o n - a n d - h e a lt h r e s e a r C h e d u C at i o n a l t r u s t
  • 186.
    Employer Health Benefits 2 0 0 9 A n n u a l s u r ve y  This year we added additional questions on the  Employers were also asked if employees have to take financial incentives that firms offer to encourage the health risk assessment during open enrollment employees to complete health risk assessments. or during another specified time frame.  Of those firms offering health insurance that offer  The majority of firms offering health benefits health risk assessments, 11% offer a financial and health risk assessments (67%) report there incentive to employees who complete a health is no specified time frame in which a health risk assessment, with large firms (200 or more risk assessment must be taken by an employee. workers) more likely than small firms (3–199 Nineteen percent of firms indicate health workers) to do so (34% vs. 7%) (Exhibit 12.8). risk assessments must be taken during open enrollment, and 13% of firms report there is no  The survey asked those firms that reported specified time frame during which employees offering financial incentives about some specific must take the assessment (Exhibit 12.10). types of incentives they may offer. Among those large firms (200 or more workers) that reported offering financial incentives to employees who section twelve complete a health risk assessment, 27% of firms reported that employees pay a smaller share of the premium, 7% reported employees have a smaller deductible, and only 2% reported employees have a lower coinsurance rate (Exhibit 12.9).6  Among all firms that reported offering health 12 risk assessments, 11% of firms reported that they offer gift cards, travel, merchandise, or cash to Wellness Programs and Health Risk Assessments employees that complete a health risk assessment. Twenty-seven percent of large firms (200 or more workers) offer this incentive, compared to 8% of small firms (3–199 workers) (Exhibit 12.8).7 noTes: 6 there is insufficient data to report the percentage of small firms with specific financial incentives for health risk assessments. 7 five percent of firms that said no to offering a financial incentive said that they offer gift cards, travel, merchandise, or cash to employees who complete a health risk assessment. 172 t h e k a i s e r fa m i ly f o u n d at i o n - a n d - h e a lt h r e s e a r C h e d u C at i o n a l t r u s t
  • 187.
    Employer Health Benefits 2 0 0 9 An n u a l s u r ve y e x h i B i t 12.1 among firms offering health Benefits, Percentage offering a Particular Wellness Program to their employees, by firm size, region, and industr y, 2009 Gym membership Web-based smoking Personal discounts or resources Wellness Cessation health on-site for healthy newsletter Program Coaching exercise living facilities firm size 3–24 Workers 23%* 26%* 29%* 32%* 8%* 25–199 Workers 40* 37 51* 42 23* 200–999 Workers 58* 58* 76* 60* 33* 1,000–4,999 Workers 75* 66* 82* 52* 39* 5,000 or more Workers 73* 75* 87* 65* 55* All small firms (3–199 Workers) 27%* 28%* 34%* 34%* 12%* All large firms (200 or more Workers) 63%* 61%* 79%* 59%* 36%* section twelve regioN northeast 44%* 40% 35% 46% 14% midwest 27 30 45 34 20 south 20 16* 32 38 8* West 25 37 34 24 9 iNDusTry 12 agriculture/mining/Construction 19% 15%* 36% 39% 10% Wellness Programs and Health Risk Assessments manufacturing 21 53* 55* 42 8 transportation/Communications/utilities 40 37 36 41 12 Wholesale 69* 70* 21 76* 21 retail 9* 41 23 19* 10 finance 24 16 52 27 19 service 32 21* 37 34 11 state/local Government 24 16 24 22 11 health Care 22 61* 26 30 30 All firms 28% 30% 36% 35% 13% source: kaiser/hret survey of employer-sponsored health Benefits, 2009. * estimate is statistically different within type of wellness program from estimate for all other firms not in the indicated size, region, or industry category (p.05). note: the offer rates for additional types of wellness programs are presented in exhibit 12.2. 173 t h e k a i s e r fa m i ly f o u n d at i o n - a n d - h e a lt h r e s e a r C h e d u C at i o n a l t r u s t
  • 188.
    Employer Health Benefits 2 0 0 9 A n n u a l s u r ve y e x h i B i t 12. 2 among firms offering health Benefits, Percentage offering a Particular Wellness Program to their employees, by firm size, region, and industr y, 2009 offer at least Classes in Weight loss one specified other Wellness nutrition/ Programs Wellness Program healthy living Program‡ firm size 3–24 Workers 22%* 16%* 52%* 9%* 25–199 Workers 31 27 72* 19* 200–999 Workers 50* 45* 92* 34* 1,000–4,999 Workers 57* 55* 95* 46* 5,000 or more Workers 64* 47* 97* 39* All small firms (3–199 Workers) 24%* 19%* 57%* 11%* All large firms (200 or more Workers) 53%* 47%* 93%* 36%* regioN section twelve northeast 36% 15% 58% 6%* midwest 26 21 57 17 south 18 14 55 11 West 23 32 64 14 iNDusTry agriculture/mining/Construction 24% 3%* 54% 15% 12 manufacturing 39 37 71 6* transportation/Communications/utilities 27 27 59 14 Wellness Programs and Health Risk Assessments Wholesale 63* 19 87* 4* retail 15 15 52 7 finance 18 15 57 9 service 18 23 55 15 state/local Government 12 13 32 12 health Care 57* 35 69 12 All firms 25% 20% 58% 12% source: kaiser/hret survey of employer-sponsored health Benefits, 2009. * estimate is statistically different within type of wellness program from estimate for all other firms not in the indicated size, region, or industry category (p.05). ‡ includes the following wellness programs: weight loss programs, gym membership discounts or on-site exercise facilities, smoking cessation program, personal health coaching, classes in nutrition or healthy living, web-based resources for healthy living, or a wellness newsletter. in 2009, respondents were given the option to reply that they offer another type of wellness benefit. if those that responded “other” are included in the percentage of firms offering at least one wellness benefit, the percentage is 60%. note: the offer rates for additional types of wellness programs are presented in exhibit 12.1. 174 t h e k a i s e r fa m i ly f o u n d at i o n - a n d - h e a lt h r e s e a r C h e d u C at i o n a l t r u s t
  • 189.
    Employer Health Benefits 2 0 0 9 An n u a l s u r ve y e x h i B i t 12.3 among firms offering health Benefits, Percentage of firms With the following features of Wellness Benefits, by firm size and region, 2009 Wellness Benefits offered most Wellness Benefits to spouses or dependents are Provided By the health Plan firm size 3–24 Workers 41%* 85% 25–199 Workers 59* 78 200–999 Workers 70* 62* 1,000–4,999 Workers 67* 57* 5,000 or more Workers 69* 54* All small firms (3–199 Workers) 46%* 83%* All large firms (200 or more Workers) 69%* 60%* regioN northeast 60% 90% midwest 42 79 section twelve south 65* 78 West 24* 80 All firms 48% 81% source: 12 kaiser/hret survey of employer-sponsored health Benefits, 2009. Wellness Programs and Health Risk Assessments * estimate is statistically different from estimate for all other firms not in the indicated size or region (p.05). note: the survey asks firms offering at least one wellness program if most of the wellness benefits are provided by the health plan or by the firm. 175 t h e k a i s e r fa m i ly f o u n d at i o n - a n d - h e a lt h r e s e a r C h e d u C at i o n a l t r u s t
  • 190.
    Employer Health Benefits 2 0 0 9 A n n u a l s u r ve y e x h i B i t 12. 4 among firms offering health and Wellness Benefits, Percentage of firms that offer specific incentives to employees Who Par ticipate in Wellness Programs, by firm size and region, 2009 Workers Pay receive Gift Workers have receive higher smaller Cards, travel, smaller hra or hsa Percentage merchandise, deductible Contributions‡ of the Premium or Cash firm size 3–24 Workers 5% 1% nsd 8% 25–199 Workers 1 0 1% 12 200–999 Workers 6 2 6* 25* 1,000–4,999 Workers 11* 1 5 29* 5,000 or more Workers 12* 3 8* 32* All small firms (3–199 Workers) 4% 1% 1%* 9%* All large firms (200 or more Workers) 8% 2% 6%* 27%* regioN section twelve northeast 1% 1% 6% 10% midwest 1 1 1 25* south 12 2 1 7 West 2 1 1 1* All firms 4% 1% 1% 10% 12 source: Wellness Programs and Health Risk Assessments kaiser/hret survey of employer-sponsored health Benefits, 2009. * estimate is statistically different within type of incentive from estimate for all other firms not in the indicated size or region (p.05). ‡ only firms that offer an hdhP/hra or hsa-qualified hdhP were asked if participating employees receive higher contributions as an incentive to participate in wellness programs. nsd: not sufficient data. 176 t h e k a i s e r fa m i ly f o u n d at i o n - a n d - h e a lt h r e s e a r C h e d u C at i o n a l t r u s t
  • 191.
    Employer Health Benefits 2 0 0 9 An n u a l s u r ve y e x h i B i t 12.5 among firms offering health Benefits and Wellness Programs, Percentage that use specific methods to identify individuals and encourage Par ticipation in Wellness Programs, by firm size, region, and industr y, 2009 use of Claims health risk health fairs to identify assessments‡ health risks firm size 3–24 Workers 18% 15% nsd 25–199 Workers 18 10 49% 200–999 Workers 39* 29* 56* 1,000–4,999 Workers 60* 45* 67* 5,000 or more Workers 59* 56* 73* All small firms (3–199 Workers) 18%* 13%* 33%* All large firms (200 or more Workers) 46%* 35%* 61%* regioN section twelve northeast 8%* 6%* 40% midwest 27 27 56 south 21 25 35 West 24 4* 15* iNDusTry agriculture/mining/Construction 13% 46% nsd manufacturing 11 5* 55% 12 transportation/Communications/utilities 28 20 59 Wellness Programs and Health Risk Assessments Wholesale 6* 4* 78* retail 47 4* 39 finance 18 7 48 service 16 11 26 state/local Government 41* 25 52 health Care 50 42 86* All firms 20% 15% 38% source: kaiser/hret survey of employer-sponsored health Benefits, 2009. * estimate is statistically different from all firms not in the indicated size, region, or industry category (p.05). ‡ a firm’s use of health risk assessments to encourage participation in wellness is asked only of firms who offer employees the option to take a health risk assessment. a health risk assessment includes questions on medical history, health status, and lifestyle, and is designed to identify the health risks of the person being assessed. nsd: not sufficient data. 177 t h e k a i s e r fa m i ly f o u n d at i o n - a n d - h e a lt h r e s e a r C h e d u C at i o n a l t r u s t
  • 192.
    Employer Health Benefits 2 0 0 9 A n n u a l s u r ve y e x h i B i t 12. 6 among firms offering health Benefits and Wellness Programs, Percentage of firms repor ting the following as the firm’s Primar y reason for offering Wellness Programs, by firm size, 2009 50% 40% 37% 36% 32% 30% 28% 19% 20% 20% 17% 18% 18% 15% 15% 15% 9% 10% 10% 7% 0% IMPROVE THE HEALTH REDUCE HEALTH IMPROVE EMPLOYEE PART OF THE HEALTH OTHER OF EMPLOYEES/REDUCE CARE COSTS* MORALE AND PLAN* section twelve ABSENTEEISM* PRODUCTIVITY source: ALL SMALL FIRMS (3–199 WORKERS) kaiser/hret survey of employer-sponsored health Benefits, 2009. ALL LARGE FIRMS (200 OR MORE WORKERS) ALL FIRMS * estimate is statistically different between all small firms and all large firms within category (p.05). 12 note: less than 1% percent of firms reported “don’t know” to the question about their primary reason for offering wellness. Wellness Programs and Health Risk Assessments e x h i B i t 12. 7 among firms offering health Benefits and Wellness Programs, Percentage of firms that think offering Wellness Programs is effective at improving health or reducing Costs, 2009 effective in improving the effective in reducing the health of employees firm's health Care Costs firm size 3–24 Workers 55%* 45% 25–199 Workers 74 59 200–999 Workers 80* 70* 1,000–4,999 Workers 81* 73* 5,000 or more Workers 79* 75* All small firms (3–199 Workers) 61%* 49%* All large firms (200 or more Workers) 80%* 71%* All firms 63% 51% source: kaiser/hret survey of employer-sponsored health Benefits, 2009. * estimate is statistically different from estimate for all other firms not in the indicated size category (p.05). note: six percent of firms responded “don’t know” to whether they think offering wellness programs is effective in improving the health of employees. ten percent said “don’t know” to whether they think wellness programs are effective in reducing health care costs. 178 t h e k a i s e r fa m i ly f o u n d at i o n - a n d - h e a lt h r e s e a r C h e d u C at i o n a l t r u s t
  • 193.
    Employer Health Benefits 2 0 0 9 An n u a l s u r ve y e x h i B i t 12.8 among fir ms o ffer ing health B enefits, Percentage of firms that o ffer employees health r isk assessments, o ffer i ncentives to Complete assessments, and use assessments to i ncrease Wellness Par ticipation, by firm size and r egion, 2009 employees that offer employees offer financial use health risk Complete health option incentives assessments risk assessment to Complete to employees to increase receive Gift health risk Who Complete Wellness Cards, travel, assessment an assessment‡ Participation‡ merchandise, or Cash‡ firm size 3–24 Workers 11%* nsd nsd nsd 25–199 Workers 23* 13% 49% 17%* 200–999 Workers 49* 29* 56* 25* 1,000–4,999 Workers 65* 40* 67* 30* 5,000 or more Workers 75* 48* 73* 34* section twelve All small firms (3–199 Workers) 14%* 7%* 33%* 8%* All large firms (200 or more Workers) 55%* 34%* 61%* 27%* regioN northeast 6%* 23%* 40% 18% midwest 21 11 56 15 south 17 13 35 8 West 18 5 15* 6 12 Wellness Programs and Health Risk Assessments All firms 16% 11% 38% 11% source: kaiser/hret survey of employer-sponsored health Benefits, 2009. * estimate is statistically different from estimate for all other firms not in the indicated size or region (p.05). ‡ among firms offering employees the option to complete a health risk assessment. nsd: not sufficient data. note: a health risk assessment includes questions on medical history, health status, and lifestyle, and is designed to identify the health risks of the person being assessed. 179 t h e k a i s e r fa m i ly f o u n d at i o n - a n d - h e a lt h r e s e a r C h e d u C at i o n a l t r u s t
  • 194.
    Employer Health Benefits 2 0 0 9 A n n u a l s u r ve y e x h i B i t 12. 9 among large firms (200 or more Workers) offering financial incentives for health risk assessments, Percentage of firms that offer the following incentives to Complete assessments, by firm size and region, 2009* Workers Pay Workers Workers smaller Percentage have smaller have lower of the Premium deductible Coinsurance firm size 200–999 Workers 28% 9% 3% 1,000–4,999 Workers 25 3 1 5,000 or more Workers 28 8 2 regioN northeast 31% 5% 5% midwest 29 7 2 south 26 5 1 West 20 15 0 section twelve All large firms (200 or more Workers) 27% 7% 2% source: kaiser/hret survey of employer-sponsored health Benefits, 2009. 12 * tests found no statistically significant differences (p.05). note: a health risk assessment includes questions on medical history, health status, and lifestyle, and is designed to identify the health risks of the person being assessed. there is insufficient data to report the percentage of small firms with specific Wellness Programs and Health Risk Assessments financial incentives for health risk assessments. e x h i B i t 12. 10 among firms offering health Benefits and health risk assessments, distribution of firms repor ting the following in terms of When employees must take health risk assessments, by firm size, 2009 ALL SMALL FIRMS 3 199 WORKERS * 21% 11% 67% ALL LARGE FIRMS 200 OR MORE WORKERS * 8% 26% 66% ALL FIRMS 19% 13% 67% 0% 10% 20% 30% 40% 50% 60% 70% 80% 90% 100% source: DURING OPEN ENROLLMENT kaiser/hret survey of employer-sponsored health Benefits, 2009. ANOTHER SPECIFIED TIME FRAME NO SPECIFIED TIME FRAME * distributions for all small firms and all large firms are statistically different (p.05). 180 t h e k a i s e r fa m i ly f o u n d at i o n - a n d - h e a lt h r e s e a r C h e d u C at i o n a l t r u s t
  • 195.
    60% $4,8 2 4 Employer Health Benefits $ 13,375 2009 annual surVey Employer and Health Plan Practices, and Employer Opinions section 13 2009
  • 196.
    Employer Health Benefits 2 0 0 9 A n n u a l s u r ve y e M p lo y e r a n D h e a lt h p l a n p r a C t i C e S , a n D e M p lo y e r o p i n i o n S e mployers play a significanT role in healTh insurance coverage — sponsoring healTh benefiTs for abouT Employer and Health Plan Practices, and Employer Opinions 159 million nonelderly people in a merica 1— so Their aTTiTudes , knowledge, and experiences are imporTanT facTors in healTh policy discussions . e mployers were asked how They view differenT approaches To conTaining cosT increases and how They plan To change Their healTh benefiT plans in The near fuTure . T he survey also collecTed informaTion on employer healTh plan pracTices , such as uTilizaTion managemenT and lifeTime benefiT maximums . q uesTions were also included on incenTives for employees To refuse coverage , or elecT single raTher Than family coverage . e m p loye r o p i N i o N s o N Co s T  Each year we ask employers whether they expect to C o N TA i N m e N T A N D l i k e ly C h A N g e s change the employee premium contributions, cost i N h e A lT h b e N e f i T s sharing, or eligibility for health benefits in the next  All firms, including those that offer and do not offer year. health benefits, were asked to rate how effective  Forty-three percent of large firms (200 or more several different strategies would be in reducing the workers) say that they are “very likely” to increase growth of health insurance costs. Few firms rate the amount employees pay for health insurance any of the suggested strategies as “very effective” at in the next year, compared to 20% of small firms controlling costs (between 13% and 23% of firms, (3–199 workers) (Exhibit 13.2). depending on the strategy). About one-third of 13 firms (between 31% and 36%) report that each of  Some firms also report that they are “very likely” the approaches we asked about would be “somewhat to increase employee cost sharing next year, sec tio n thir teen effective” at controlling cost growth. with 16% saying that they are “very likely” to increase deductibles, 15% saying that they are  Similar percentages of employers report that “very likely” to increase office visit copayments or consumer-driven health plans (16%), higher coinsurance, and 14% saying that they are “very employee cost sharing (13%), or tighter managed likely” to increase the amount that employees care restrictions (13%) would be “very effective” pay for prescription drugs (Exhibit 13.2). These in reducing the growth of health care costs. responses vary little between small firms (3–199 Twenty-three percent of employers report disease workers) and large firms (200 or more workers). management is “very effective” (Exhibit 13.1). The percentage of large firms who report that There are no statistically significant differences they are very likely to increase deductibles between small firms (3–199 workers) and large increased from 9% in 2008 to 15% in 2009. firms (200 or more workers) in the percentage that report that strategies are “very effective.”  As observed in previous years, small percentages of employers report that they are likely to restrict eligibility or drop coverage altogether. Four percent of firms say that they are “very likely” to restrict eligibility for benefits in the next year. About two percent of firms say that they are “very likely” to drop coverage in the next year (Exhibit 13.2). These percentages are not statistically different from the percentages reported in 2008, and do not vary by small and large firms. noTe: 1 kaiser family foundation, kaiser Commission on medicaid and the uninsured, the uninsured: a Primer, october 2008. 182 t h e k a i s e r fa m i ly f o u n d at i o n - a n d - h e a lt h r e s e a r C h e d u C at i o n a l t r u s t
  • 197.
    Employer Health Benefits 2 0 0 9 An n u a l s u r ve y e m p loye r’s r e s p o N s e eNrollmeNT iNCeNTives Employer and Health Plan Practices, and Employer Opinions To The eCoNomiC DoWNTurN  Firms may require employees to contribute different  To gauge employer responses to the economic amounts for coverage depending on whether downturn, a couple of questions were included on employees have an alternative source of coverage, whether employers have reduced their benefits or or may provide incentives for employees to enroll increased cost sharing due to the downturn. in single rather than family coverage or turn down coverage completely.  Twenty-one percent of employers report reducing the scope of health benefits or increasing cost  Sixteen percent of firms that offer coverage sharing and 15% report increasing the amount vary the contribution they make toward family employees pay for coverage in response to the coverage based on whether an employee’s family economic downturn. More large firms than member has the option of obtaining insurance small firms report increasing the share of the from another source, such as another employer premium that the employee pays (22% vs. 15%) (Exhibit 13.7). The survey asks firms that do (Exhibit 13.3). not vary the contribution whether or not they are likely to do so in the future. Few firms say mArkeT TurNover they are “very likely” (2%) or “somewhat likely”  About every other year, we ask firms that offer (11%) to adopt such an approach in the next two health insurance if they have shopped for a new years. (Exhibit 13.8). insurance carrier or a new health plan.  Eighteen percent of firms provide additional  Sixty-two percent of firms that offer health compensation or benefits to employees if they insurance have shopped for a new health plan or elect not to participate in the health plan (Exhibit 13 insurance carrier in the past year (Exhibit 13.4). 13.7). One-in-ten firms are “very likely” or sec tio n thir teen Small firms (3–199 workers) were more likely “somewhat likely” to adopt this approach in the to have shopped than large firms (200 or more next two years (Exhibit 13.8). workers) (63% vs. 48%). Among those firms  A small percentage of firms (4%) provide that shopped in the past year, 20% changed their additional compensation or benefits to employees insurance carrier and 31% changed the type of if they elect single rather than family coverage health plan (Exhibit 13.5). Among firms that (Exhibit 13.7). Only 1% are “very likely” and shopped, small firms were more likely to have 6% are “somewhat likely” to adopt this approach changed the type of health plan than large firms in the next two years (Exhibit 13.8). (31% vs. 20%).  W o r k - s i T e h e A lT h A N D s A f e T y We also asked all firms that offer health benefits, what, in addition to cost, is the most important  New to the survey this year were two questions factor in your decision to choose a particular plan. for firms with 1,000 or more employees regarding on-site health clinics. These questions were asked of  A considerable percentage of firms (58%) all firms surveyed, including those that do not offer reported that, in addition to cost, they consider health benefits. the quality of providers in networks to be the most important factor when choosing a particular  Among both firms that offer health benefits health plan, with 59% of small firms (3–199 and those that do not, 20% of firms with 1,000 workers), compared to 43% of large firms (200 or or more workers reported that they have an more workers) reporting this factor. Large firms on-site health clinic for employees at any of their (33%) were more likely to report that the size of locations. Of those firms with an on-site health the network is the most important factor than clinic, 79% reported that employees can receive small firms (17%). Relatively few firms reported treatment for non-work related illness at the their most important factor as administrator or on-site clinic (Exhibit 13.9). carrier (4%), wellness programs (1%), or other factors (15%) (Exhibit 13.6). 183 t h e k a i s e r fa m i ly f o u n d at i o n - a n d - h e a lt h r e s e a r C h e d u C at i o n a l t r u s t
  • 198.
    Employer Health Benefits 2 0 0 9 A n n u a l s u r ve y  Many firms offer injury prevention programs, such  Health plans may also include case management as worker safety or ergonomics information. services for individuals with large claims. Case management is the coordination of care for those  Overall, 39% of firms offer an injury prevention with high claims to improve quality of care and to program. The majority of large firms (200 or lower costs. more workers) have injury prevention programs Employer and Health Plan Practices, and Employer Opinions (64%) compared to 38% of small firms (3–199  Thirty-seven percent of firms report that their workers) (Exhibit 13.9). Firms with at least some largest health plan has case management for large union workers are significantly more likely than claims. Large firms (200 or more workers) are firms without any union workers to offer an more likely to report case management services injury prevention program (71% vs. 38%). than small firms (3–199 workers) (82% vs. 35%) (Exhibit 13.10). u T i l i z AT i o N m A N A g e m e N T  lifeTime mAximums Some health plans require pre-admission certification prior to obtaining certain services, such  The majority of covered workers are in plans with a as inpatient hospital care, outpatient surgery, or limit on the amount of benefits a plan will pay for imaging services. an employee over his or her lifetime.  The majority of firms (55%) report that their  Overall, 59% of covered workers are in plans largest health plan requires pre-admission with a lifetime maximum on benefits (Exhibit certification for inpatient hospital care, with large 13.11). The percentage of covered workers with firms (200 or more workers) more likely to report no lifetime maximum limit is not statistically their largest plan has this requirement than small different between 2009 and 2007, the last time firms (3–199 workers) (72% vs. 54%). Fifty- the question was asked. Forty-three percent of nine percent of firms report that pre-admission covered workers have a specified limit of two certification is required by their largest health million dollars or more, a statistically significant plan for outpatient surgery, and 42% report pre- increase from 32% of covered workers in 2007. 13 admission certification is required for imaging  The majority of covered workers in HMO (69%) services, such as MRIs, CAT scans, or PET scans sec tio n thir teen and POS plans (52%) have no lifetime maximum (Exhibit 13.10). on benefits paid for by the plan, and about one- third of workers in PPOs (31%) and HDHP/SOs (32%) have no limit (Exhibit 13.12). 184 t h e k a i s e r fa m i ly f o u n d at i o n - a n d - h e a lt h r e s e a r C h e d u C at i o n a l t r u s t
  • 199.
    Employer Health Benefits 2 0 0 9 An n u a l s u r ve y e x h i B i t 13.1 among Both firms offering and not offering health Benefits, distribution of firms’ opinions on the effectiveness of the following strategies to Contain health insurance Costs, by firm size, 2009 Very somewhat not too not at all don’t effective effective effective effective know Employer and Health Plan Practices, and Employer Opinions Tighter managed Care restrictions* all small firms (3–199 Workers) 13% 33% 20% 25% 9% all large firms (200 or more Workers) 9% 40% 32% 16% 2% All firms 13% 34% 20% 25% 8% Consumer-Driven health plans (ex: high-Deductible plan Combined with a health savings Account)* all small firms (3–199 Workers) 16% 35% 20% 23% 6% all large firms (200 or more Workers) 19% 33% 28% 17% 4% All firms 16% 35% 20% 22% 6% higher employee Cost sharing* all small firms (3–199 Workers) 13% 36% 17% 28% 5% all large firms (200 or more Workers) 14% 35% 27% 22% 2% All firms 13% 36% 18% 28% 5% Disease management programs* all small firms (3–199 Workers) 23% 30% 19% 23% 5% all large firms (200 or more Workers) 26% 43% 22% 8% 2% 13 All firms 23% 31% 19% 22% 5% sec tio n thir teen source: kaiser/hret survey of employer-sponsored health Benefits, 2009. * distributions are statistically different between all small firms and all large firms within category (p.05). 185 t h e k a i s e r fa m i ly f o u n d at i o n - a n d - h e a lt h r e s e a r C h e d u C at i o n a l t r u s t
  • 200.
    Employer Health Benefits 2 0 0 9 A n n u a l s u r ve y e x h i B i t 13. 2 among firms offering health Benefits, distribution of firms repor ting the likelihood of making the following Changes in the next year, by firm size, 2009 Very somewhat not too not at all don’t Employer and Health Plan Practices, and Employer Opinions likely likely likely likely know increase the Amount employees pay for health insurance* all small firms (3–199 Workers) 20% 20% 13% 46% 1% all large firms (200 or more Workers) 43% 23% 16% 17% 1% All firms 21% 20% 14% 44% 1% increase the Amount employees pay for Deductibles* all small firms (3–199 Workers) 16% 19% 18% 46% 1% all large firms (200 or more Workers) 15% 25% 27% 33% 1% All firms 16% 20% 18% 46% 1% increase the Amount employees pay for office visit Copays or Coinsurance* all small firms (3–199 Workers) 15% 25% 18% 42% 1% all large firms (200 or more Workers) 11% 23% 30% 35% 2% All firms 15% 25% 19% 41% 1% increase the Amount employees pay for prescription Drugs* all small firms (3–199 Workers) 14% 23% 19% 44% 1% all large firms (200 or more Workers) 9% 24% 30% 35% 2% All firms 14% 23% 19% 43% 1% 13 restrict employees’ eligibility for Coverage* all small firms (3–199 Workers) 4% 5% 7% 83% 1% sec tio n thir teen all large firms (200 or more Workers) 1% 5% 12% 81% 1% All firms 4% 5% 8% 83% 1% Drop Coverage entirely* all small firms (3–199 Workers) 2% 6% 6% 86% 1% all large firms (200 or more Workers) 1% 1% 2% 96% 1% All firms 2% 6% 6% 86% 1% offer hDhp/hrA‡ all small firms (3–199 Workers) 5% 16% 19% 60% 1% all large firms (200 or more Workers) 8% 14% 24% 54% 1% All firms 5% 15% 19% 59% 1% offer hsA-Qualified hDhp‡ all small firms (3–199 Workers) 5% 16% 23% 54% 1% all large firms (200 or more Workers) 7% 14% 31% 47% 1% All firms 6% 16% 24% 54% 1% source: kaiser/hret survey of employer-sponsored health Benefits, 2009. * distributions are statistically different between all small firms and all large firms within category (p.05). ‡ among firms not currently offering this type of hdhP/so. 186 t h e k a i s e r fa m i ly f o u n d at i o n - a n d - h e a lt h r e s e a r C h e d u C at i o n a l t r u s t
  • 201.
    Employer Health Benefits 2 0 0 9 An n u a l s u r ve y e x h i B i t 13.3 among firms offering health Benefits, Percentage of firms that report they made the following Changes as a result of the economic downturn, by firm size and region, 2009 reduced scope increased of health Benefits Employer and Health Plan Practices, and Employer Opinions the Worker's share or increased Cost of the Premium sharing firm size 200–999 Workers 23% 22%* 1,000–4,999 Workers 19 21 5,000 or more Workers 21 19 All small firms (3–199 Workers) 21% 15%* All large firms (200 or more Workers) 22% 22%* regioN northeast 31% 15% midwest 22 18 south 22 16 West 10* 12 All firms 21% 15% source: kaiser/hret survey of employer-sponsored health Benefits, 2009. * estimate is statistically different from estimate for all other firms not in the indicated size or region (p.05). 13 sec tio n thir teen 187 t h e k a i s e r fa m i ly f o u n d at i o n - a n d - h e a lt h r e s e a r C h e d u C at i o n a l t r u s t
  • 202.
    Employer Health Benefits 2 0 0 9 A n n u a l s u r ve y e x h i B i t 13. 4 Percentage of firms offering health Benefits that shopped for a new Plan or health insurance Carrier in the Past year, by firm size, 2009 100% Employer and Health Plan Practices, and Employer Opinions 80% 63% 62% 60% 53% 40% 38% 32% 20% 0% 3 199 200 999 1,000 4,999 5,000 OR ALL FIRMS WORKERS* WORKERS WORKERS* MORE WORKERS* source: kaiser/hret survey of employer-sponsored health Benefits, 2009. 13 * estimate is statistically different within category from estimate for firms not in the indicated size category (p.05). sec tio n thir teen 188 t h e k a i s e r fa m i ly f o u n d at i o n - a n d - h e a lt h r e s e a r C h e d u C at i o n a l t r u s t
  • 203.
    Employer Health Benefits 2 0 0 9 An n u a l s u r ve y e x h i B i t 13.5 among firms offering health Benefits that shopped for a new Plan or insurance Carrier, Percentage reporting that they Changed insurance Carrier and/or health Plan type in the Past year, by firm size, 2009 Employer and Health Plan Practices, and Employer Opinions 50% 45% 40% 35%* 35% 31%* 31% 30% 25% 23% 20% 21% 20% 20%* 20%* 20% 18%* 15% 10% 5% 0% CHANGED INSURANCE CARRIER CHANGED HEALTH PLAN TYPE source: 3 199 WORKERS kaiser/hret survey of employer-sponsored health Benefits, 2009. 200 999 WORKERS 1,000 4,999 WORKERS 13 * estimate is statistically different within category from estimate for firms not in the indicated size 5,000 OR MORE WORKERS category (p.05). ALL FIRMS sec tio n thir teen 189 t h e k a i s e r fa m i ly f o u n d at i o n - a n d - h e a lt h r e s e a r C h e d u C at i o n a l t r u s t
  • 204.
    Employer Health Benefits 2 0 0 9 A n n u a l s u r ve y e x h i B i t 13. 6 among firms o ffering health Benefits, Percentage of fir ms r epor ting the following as the m ost i mpor tant fac tor in the firm’s d ecision to Choose a Par ticular Plan, in addition to Cost, by firm size, 2009 Employer and Health Plan Practices, and Employer Opinions 100% 90% 80% 70% 60% 59% 58% 50% 43% 40% 33% 30% 20% 17% 18% 15% 15% 13% 10% 8% 4% 4% 3% 2% 3% 13 0% 1% 1% 1% QUALITY OF PROVIDERS ADMINSTRATOR/ SIZE WELLNESS OTHER DON'T KNOW IN NETWORKS* CARRIER* OF NETWORK* PROGRAMS sec tio n thir teen source: ALL SMALL FIRMS 3 199 WORKERS kaiser/hret survey of employer-sponsored health Benefits, 2009. ALL LARGE FIRMS 200 OR MORE WORKERS * estimate is statistically different between all small firms and all large firms within category (p.05). ALL FIRMS 190 t h e k a i s e r fa m i ly f o u n d at i o n - a n d - h e a lt h r e s e a r C h e d u C at i o n a l t r u s t
  • 205.
    Employer Health Benefits 2 0 0 9 An n u a l s u r ve y e x h i B i t 13.7 among firms offering health Benefits, Percentage of firms reporting the use of the following Contribution approaches for health Benefits, 2009* 50% Employer and Health Plan Practices, and Employer Opinions 40% 30% 20% 18% 19% 18% 17% 16% 10% 10% 4% 3% 4% 0% VARY CONTRIBUTION ADDITIONAL COMPENSATION ADDITIONAL COMPENSATION FOR FAMILY COVERAGE OR BENEFITS PROVIDED IF EMPLOYEES OR BENEFITS PROVIDED IF EMPLOYEES IF FAMILY MEMBER HAS ELECT NOT TO PARTICIPATE ELECT SINGLE RATHER OTHER INSURANCE OPTION IN FIRM'S HEALTH BENEFITS THAN FAMILY COVERAGE source: ALL SMALL FIRMS 3 199 WORKERS kaiser/hret survey of employer-sponsored health Benefits, 2009. 13 ALL LARGE FIRMS 200 OR MORE WORKERS * tests found no statistical differences between all small and all large firms (p.05). ALL FIRMS sec tio n thir teen 191 t h e k a i s e r fa m i ly f o u n d at i o n - a n d - h e a lt h r e s e a r C h e d u C at i o n a l t r u s t
  • 206.
    Employer Health Benefits 2 0 0 9 A n n u a l s u r ve y e x h i B i t 13. 8 among firms offering health Benefits, distribution of firms repor ting the likelihood of adopting the following Contribution approaches for health Benefits in the next two years, 2009 Very somewhat not too not at all Employer and Health Plan Practices, and Employer Opinions likely likely likely likely vary Contribution for family Coverage if family member has other insurance Coverage option* all small firms (3–199 Workers) 2% 10% 22% 66% all large firms (200 or more Workers) 2% 17% 31% 50% All firms 2% 11% 23% 65% Additional Compensation or benefits provided if employees elect Not to participate in firm's health benefits all small firms (3–199 Workers) 3% 7% 20% 70% all large firms (200 or more Workers) 2% 9% 26% 63% All firms 3% 7% 20% 70% Additional Compensation or benefits provided if employees elect single rather Than family Coverage* all small firms (3–199 Workers) 1% 6% 16% 78% all large firms (200 or more Workers) 1% 5% 27% 68% All firms 1% 6% 16% 77% source: 13 kaiser/hret survey of employer-sponsored health Benefits, 2009. sec tio n thir teen * distributions are statistically different between all small firms and all large firms within category (p.05). 192 t h e k a i s e r fa m i ly f o u n d at i o n - a n d - h e a lt h r e s e a r C h e d u C at i o n a l t r u s t
  • 207.
    Employer Health Benefits 2 0 0 9 An n u a l s u r ve y e x h i B i t 13.9 among offering and non-offering firms, Percentage With the following on-site health and safety Programs, by firm size, region, and industr y, 2009 at on-site Clinic, employees Employer and Health Plan Practices, and Employer Opinions offers injury offers on-site Can receive Prevention health Clinic treatment Program for non-Work- related illness‡ firm size 3–24 Workers na na 36%* 25–199 Workers na na 50* 200–999 Workers na na 60* 1,000–4,999 Workers 18%* 76% 72* 5,000 or more Workers 25* 82 79* All small firms (3–199 Workers) NA NA 38%* All large firms (200 or more Workers) 20% 79% 64%* regioN northeast 20% 84% 38% midwest 29* 74 36 south 19 82 37 West 12* nsd 43 iNDusTry agriculture/mining/Construction nsd nsd 58%* 13 manufacturing 22% nsd 42 sec tio n thir teen transportation/Communications/utilities 9* nsd 77* Wholesale 9* nsd 57 retail 12 nsd 30 finance 21 nsd 10* service 18 83% 35 state/local Government 28 nsd 39 health Care 53* 74 34 All firms 20% 79% 39% source: kaiser/hret survey of employer-sponsored health Benefits, 2009. * estimate is statistically different from all firms not in the indicated size, region, or industry category (p.05). ‡ among firms that have an on-site health clinic at any of their locations. na: only firms with 1,000 or more workers were asked about on-site health clinics. nsd: not sufficient data. 193 t h e k a i s e r fa m i ly f o u n d at i o n - a n d - h e a lt h r e s e a r C h e d u C at i o n a l t r u s t
  • 208.
    Employer Health Benefits 2 0 0 9 A n n u a l s u r ve y e x h i B i t 13. 10 Percentage of firms with the following utilization management Provisions in their largest health Plan, By firm size, region, and industr y, 2009 Pre-admission Pre-admission Pre-admission Case Employer and Health Plan Practices, and Employer Opinions Certification Certification Certification management for inpatient for outpatient for imaging for large Claims hospital Care surgery firm size 3–24 Workers 53% 60% 41% 31%* 25–199 Workers 60 56 46 49* 200–999 Workers 70* 57 46 79* 1,000–4,999 Workers 75* 55 44 90* 5,000 or more Workers 77* 54 48 95* All small firms (3–199 Workers) 54%* 59% 42% 35%* All large firms (200 or more Workers) 72%* 57% 46% 82%* regioN northeast 49% 58 55 40% midwest 62 63 40 43 south 68* 63 44 38 West 39* 49 29 26 iNDusTry agriculture/mining/Construction 65% 63% 60% 52% manufacturing 58 58 41 33 13 transportation/Communications/ 51 55 63 63* utilities sec tio n thir teen Wholesale 53 56 71* 28 retail 22* 62 39 19* finance 64 65 28 36 service 55 55 29* 33 state/local Government 91* 88* 83* 30 health Care 73 57 57 66* All firms 55% 59% 42% 37% source: kaiser/hret survey of employer-sponsored health Benefits, 2009. * estimate for utilization management for inpatient hospital care, outpatient surgery, imaging, or case management is statistically different from all other firms not in the indicated size, region, or industry category (p.05). 194 t h e k a i s e r fa m i ly f o u n d at i o n - a n d - h e a lt h r e s e a r C h e d u C at i o n a l t r u s t
  • 209.
    Employer Health Benefits 2 0 0 9 An n u a l s u r ve y e x h i B i t 13.1 1 distribution of Covered Workers by maximum lifetime Benefit Payable to an employee with single Coverage, by Plan type, 2004–2009 less than $1,000,000 $1,000,000–$1,999,999 $2,000,000 or more no limit Employer and Health Plan Practices, and Employer Opinions hmo 2004 1% 10% 15% 75% 2007 0% 9% 15% 76% 2009* 1% 5% 25% 69% ppo 2004 1% 33% 31% 35% 2007* 1% 27% 38% 33% 2009* 1% 20% 49% 31% pos 2004 2% 21% 15% 63% 2007* 0% 20% 27% 53% 2009 1% 18% 29% 52% hDhp/so‡ 2007 0% 13% 54% 33% 2009* 1% 5% 62% 32% All plANs 2004 1% 24% 25% 49% 2007* 1% 22% 32% 45% 2009* 1% 16% 43% 41% 13 sec tio n thir teen source: kaiser/hret survey of employer-sponsored health Benefits, 2004–2009. * distribution is statistically different from distribution for the previous year shown (p.05). ‡ information was not obtained for hdhP/sos prior to 2006. 195 t h e k a i s e r fa m i ly f o u n d at i o n - a n d - h e a lt h r e s e a r C h e d u C at i o n a l t r u s t
  • 210.
    Employer Health Benefits 2 0 0 9 A n n u a l s u r ve y e x h i B i t 13. 12 distribution of Covered Workers by maximum lifetime Benefit Payable to an employee with single Coverage, by Plan type and firm size, 2009 less than $1,000,000 – $2,000,000 or no limit Employer and Health Plan Practices, and Employer Opinions $1,000,000 $1,999,999 more hmo* all small firms (3–199 Workers) 0% 4% 11% 84% all large firms (200 or more Workers) 1 6 30 63 All hmo plans 1% 5% 25% 69% ppo all small firms (3–199 Workers) 1% 17% 47% 36% all large firms (200 or more Workers) 1 21 49 30 All ppo plans 1% 20% 49% 31% pos all small firms (3–199 Workers) 1% 12% 31% 56% all large firms (200 or more Workers) 0 27 26 47 All pos plans 1% 18% 29% 52% hDhp/so all small firms (3–199 Workers) 1% 2% 61% 36% all large firms (200 or more Workers) 0 8 64 28 All hDhp/sos 1% 5% 62% 32% 13 All plANs* all small firms (3–199 Workers) 1% 12% 39% 48% sec tio n thir teen all large firms (200 or more Workers) 1 18 45 37 All firms 1% 16% 43% 41% source: kaiser/hret survey of employer-sponsored health Benefits, 2009. * distributions are statistically different between all small firms and all large firms (p.05). 196 t h e k a i s e r fa m i ly f o u n d at i o n - a n d - h e a lt h r e s e a r C h e d u C at i o n a l t r u s t
  • 212.
    -and- The Henry J. Kaiser Family Foundation Health Research Educational Trust Headquarters 2400 Sand Hill Road 1 North Franklin Street Menlo Park, CA 94025 Chicago, IL 60606 Phone 650-854-9400 Fax 650-854-4800 Phone 312-422-2600 Fax 312-422-4568 Washington Offices and www.hret.org Barbara Jordan Conference Center 1330 G Street, NW Washington, DC 20005 Phone 202-347-5270 Fax 202-347-5274 www.kff.org This publication (#7936) is available on the Kaiser Family Foundation’s website at www.kff.org. Multiple copies may be obtained from HRET by calling 1-800-242-2626 (order #097520). September 2009