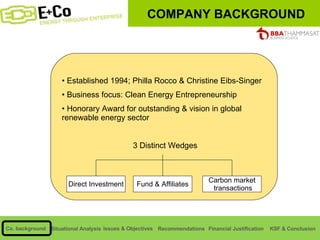
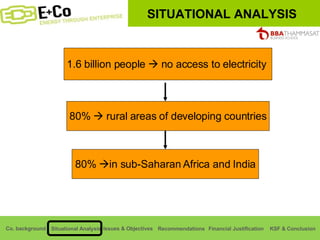
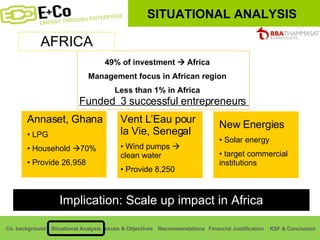
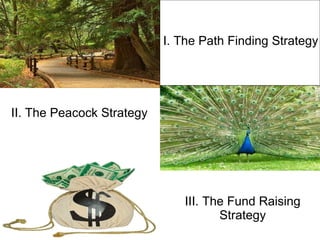
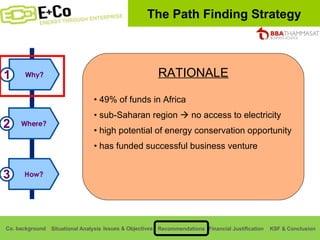
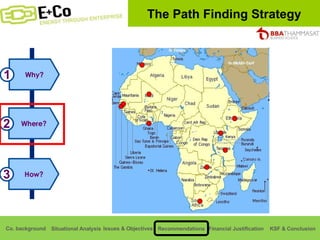
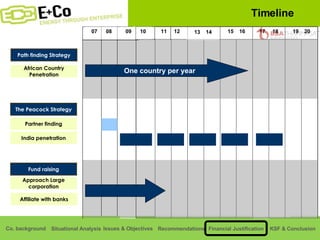
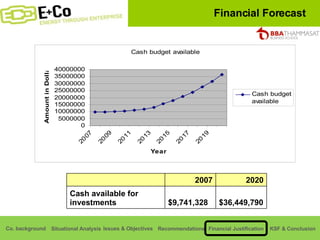
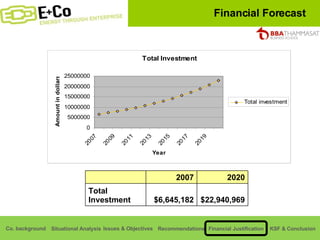
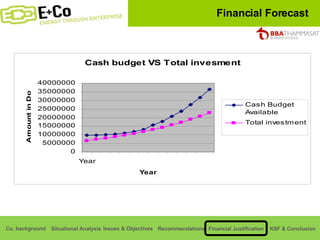
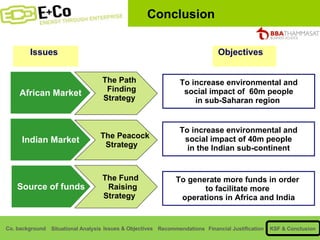
Thammasat Consulting Group Visaruth Taveeruchana Phornthep Thakral Chatree Wangpanitkul Nattapon Lertpraival
 
COMPANY BACKGROUND Established 1994; Philla Rocco & Christine Eibs-Singer Business focus: Clean Energy Entrepreneurship Honorary Award for outstanding & vision in global renewable energy sector 3 Distinct Wedges Direct Investment Fund & Affiliates Carbon market transactions
SITUATIONAL ANALYSIS 1.6 billion people    no access to electricity  80%    rural areas of developing countries 80%   in sub-Saharan Africa and India
Funded  3 successful entrepreneurs  AFRICA Annaset, Ghana LPG Household   70% Provide 26,958 Vent L’Eau pour la Vie, Senegal Wind pumps    clean water Provide 8,250 New Energies Solar energy target commercial institutions Implication: Scale up impact in Africa SITUATIONAL ANALYSIS 49% of investment    Africa Management focus in African region Less than 1% in Africa
Implication: Target India population    1,1 billion people 17% of world population 72.22% of the people live in more than 550,000 villages  high rate of coal consumption Percent of the population under the poverty line :  22%  INDIA SITUATIONAL ANALYSIS
Current sources of funds, Grants    social investors, donors, and charitable organizations Capital investments    E+Co. managed accounts, funds & affiliates Financial limitations  Implication: Increase source and amount of funds SITUATIONAL ANALYSIS
ISSUES & OBJECTIVES ISSUES African Market  Source of Funds Indian Market Where we want to be in 2020 Where  we are A company that assist and fund clean energy entrepreneurship  Providing 3.6 mn people with modern energy service investing in 138 companies To achieve higher impact on the environment through clean energy entrepreneurship  Provide 100 million people with access to modern energy service targeting to invest in 2000 companies
Issues Objectives African Market Indian Market Source of funds To increase environmental and social impact of  60m people  in sub-Saharan region  To increase environmental and social impact of  40m people  in the Indian sub-continent To generate more funds in order  to facilitate more  operations in Africa and India ISSUES & OBJECTIVES
II. The Peacock Strategy I. The Path Finding Strategy III. The Fund Raising Strategy
The Path Finding Strategy
The Path Finding Strategy Why? 1 Where? 2 How? 3 49% of funds in Africa sub-Saharan region    no access to electricity high potential of energy conservation opportunity has funded successful business venture RATIONALE
Why? 1 Where? 2 How? 3 The Path Finding Strategy
Why? 1 Where? 2 How? 3 Country Mozambique Burkina Faso Malawi Pop. w/o electricity in mil. CRITERIA FOR COUNRTY SELECTION Madagascar Kenya Morocco Cameroon Political Stability Rural Poverty (GNI in $) Rwanda 1 2 3 4 5 6 7 8 Nigeria Zimbabwe 9 10 17 11 15 11 9 13 29 8 73 8 0.55 0.31 0.3 -0.1 -0.14 -0.5 -0.86 -1.35 -1.49 -1.62 The Path Finding Strategy 530 - 1,250 less than 530 Less than 530 less than 530 530-1250 3000-9130 less than 530 less than 530 less than 530 less than 530
Why? 1 Where? 2 How? 3 Leverage competencies Marketing strategy Past experience with annaset, Vent L’Eau pour la Vie & new energies leverage on the training experience of the above companies  Organize seminars & entrepreneur toolkit    encourage & stimulate interest Key message “ Think Business, Think Green” The Path Finding Strategy
Why? 1 Where? 2 How? 3 Leverage competencies Marketing strategy Past experience with annaset, Vent L’Eau pour la Vie & new energies leverage on the training experience of the above companies  Organize seminars & entrepreneur toolkit    encourage & stimulate interest Key message “ Think Business, Think Green” The Path Finding Strategy Prioritization of countries Invest in 810 new enterprise in 14years
The Peacock Strategy
Population    1.1 billion people
17% of world population
72.22% of the people live in more than 550,000 villages  With 22% below poverty line
55% of population don’t have electricity!!!
Coal provides 70% of Indian electricity
Mining    environmental damage, including pollution of water, depletion of water supply, destruction of land, harm to health and safety, ,major greenhouse gas and leads to more global warming.  IMPLICATION: Focus on reducing coal as an energy Why Where 1 2 How 3 The Peacock Strategy
Why Where 1 2 How 3 Region Middle West North Population density/Km meter CRITERIA FOR REGION SELECTION Population w/o electricity  (in million) Coal consumption (million tons) East South 341 208 441 302 82 140 64 107 129 62 107 49 81 439 170 The Peacock Strategy 1 2 3
Why Where 1 2 How 3 COAL CURRENTLY, Unhealthy huge emission of Carbon dioxide Non-renewable energy environmental damaging x BIO-MASS FUEL BRIQUETTES The Peacock Strategy
Why Where 1 2 How 3 BIO-MASS FUEL BRIQUETTES RATIONALE A briquette (or briquet) is a block of flammable matter  which is used as fuel to start and maintain a fire.  replacement for oil & coal renewable source of energy help reduce carbon content in air Eco friendly, non polluting and economical  100% natural available from agricultural waste The Peacock Strategy
Why Where 1 2 How 3 Aggressive strategies    financial & HR constraints Proposed JV with ETC Energy RATIONALE Goal congruence Financial and human resource assistance Same size allow flexibility Larger scope of operation The Peacock Strategy
Why Where 1 2 How 3 Aggressive strategies    financial & HR constraints Proposed JV with ETC Energy RATIONALE Goal congruence Financial and human resource assistance Same size allow flexibility Larger scope of operation Assist, train, and help local entrepreneurs  implement a business model for Briquette usage Ease the Financial & HR constraints Invest in 1009 enterprise in 14 years  The Peacock Strategy
The Fund Raising  Strategy
The Fund Raising Strategy Current Strategy Extended Strategy Funds, Partnership and financial institutions Receive Grants & Capital Investments Greenpeace Intl., Citigroup foundation, Bill & Melinda Gates foundation + Approach more foundations To Receive more funds from more foundations Government organizations, terrapass funds etc.
Current Strategy Extended Strategy Interest Revenue increase funds for entrepreneur increase in number of successful entrepreneurs leads to snowballing effect The Fund Raising Strategy
Current Strategy Extended Strategy Approach large corporations Shell (Oil) BP (Oil and energy) Vodafone (telecommunications) General Motors (Automobiles) Home Dep. (Furniture) Value Proposition CSR image    reputation & brand Competitive Advantage Enhance employee relationship Advertisement Strong relationship with community The Fund Raising Strategy
Current Strategy Extended Strategy Affiliate with Banks Target banks worldwide access to large funds Example: HSBC, JP Morgan, Bank of Amercia  The Fund Raising Strategy
Carbon dioxide offset    396 million tons Reforested land    3309 hectares; 6.6million trees Providing countless Households with clean water Kerosene Displaced    6 million liters
 
19  20 17  18 15  16 11  12 Path finding Strategy Partner finding The Peacock Strategy African Country Penetration Approach Large corporation India penetration Fund raising 07  08 09  10 13  14 Affiliate with banks One country per year Timeline
Financial Forecast $36,449,790  $9,741,328  Cash available for investments 2020 2007  
Financial Forecast $22,940,969 $6,645,182 Total Investment 2020 2007  
Financial Forecast
Key Success Factors Attraction of  entrepreneurs Negotiation Skill
Conclusion Issues African Market Indian Market Source of funds Objectives To increase environmental and social impact of  60m people  in sub-Saharan region  To increase environmental and social impact of 40m people  in the Indian sub-continent To generate more funds in order  to facilitate more  operations in Africa and India The Path  Finding  Strategy The Peacock  Strategy The Fund  Raising  Strategy
 
Thank you Q&A
Slide Navigator Company Background Situational Analysis Issues and Objectives Recommendations The Path Finding Strategy The Peacock Strategy The Fund Raising Strategy Financial Justification KSF Conclusion Strengths Weaknesses Opportunities Threats
Slide Navigator Risk Factors Why not carbon? Risk of 12 year strategic plan Other Joint Venture Sources and Citation IS Assumption Average seed investment Average loans Loan payment assumption No. of Enterprise
Strengths Proven successful business model Learning culture E+co’s enterprise model was “technology neutral”
Weaknesses Limited pool of resources Small identified pool of entrepreneurs
Opportunities La Espranza hydroelectric project Partners carbon
Threats
Risk Factors Limited pool of entrepreneurs focusing on energy-related business Large corporations do not sponsor us High failure rate of new entrepreneurs Economic Crisis: entrepreneurs are dependant on economic and political stability
Why not carbon? Trading of carbon credits does not reduce the overall emission of carbon Past history have invested a lot of money with La Esparenza but only impacted 194 households Limited resources both financially and human resource
Risk of 12 year strategic plan Uncontrollable factors Disasters Political instability Economic instability
Other Joint Venture Stern Fisher
Sources and Citation http://www.worldcoal.org/pages/content/index.asp?PageID=402 http://www.ruralpovertyportal.org/english/regions/asia/ind/index.htm
IS Assumption Revenue: Contributions – last yr contribution + 10% growth   - Contribution from large corporations + 10% growth Program revenue - % of investments in programs Interest income – Cash 2.7% (from annual report)   - Loans 8.6% - Dividend yield 6.3% Other income – Remain constant Expense: Program service - % of investments in programs Management and general – Constant growth of 10% Grant procurement - % of contribution Other expense – Remain constant
Average seed investment 15012 Equity 109988 Debt 125000 Average investment per enterprise 118 Total no. of investment 14721633 Total amount of investment 12% 1768000 Equity Investment 88% 12953633 Debt Investment From 1998 to 2006
Loan receivable schedule 0 27765 25637 2128 25637 5 25637 27765 23673 4093 49310 4 49310 27765 21858 5907 71168 3 71168 27765 20183 7582 91352 2 91352 27765 18636 9129 109988 1 Ending Balance Total Pmt Principal pmt Interest pmt Beginning Balance             Loans receivable schedule Average loans($109988, 5 years, 8.3%) :
Loan payment assumption Loans payment (5yr, 6.5%)
No. of Enterprises 224 1956 2020 10% per year 102 million Total Customers 15% Growth of customer base 15000 Customers of new enterprise 26000 No. of customers per old enterprise 203 138 Culmulative No. of enterprise 65 New enterprise 2007 2006 With Recommendation:
No. of Enterprise 2020 48 524 46 million Total Customers 10% per year 15% Growth of customer base 26000 No. of customers per enterprise 152 138 Culmulative No. of enterprise 14 New enterprise 2007 2006 Without Recommendation:
Cost estimation Contribution from large  corporations Funds from large corporations $  22,724,275  Promotional marketing activities Expenses $  185,898,844  Loans given out Capex

2008 1st Place

  • 1.
    Thammasat Consulting GroupVisaruth Taveeruchana Phornthep Thakral Chatree Wangpanitkul Nattapon Lertpraival
  • 2.
  • 3.
    COMPANY BACKGROUND Established1994; Philla Rocco & Christine Eibs-Singer Business focus: Clean Energy Entrepreneurship Honorary Award for outstanding & vision in global renewable energy sector 3 Distinct Wedges Direct Investment Fund & Affiliates Carbon market transactions
  • 4.
    SITUATIONAL ANALYSIS 1.6billion people  no access to electricity 80%  rural areas of developing countries 80%  in sub-Saharan Africa and India
  • 5.
    Funded 3successful entrepreneurs AFRICA Annaset, Ghana LPG Household  70% Provide 26,958 Vent L’Eau pour la Vie, Senegal Wind pumps  clean water Provide 8,250 New Energies Solar energy target commercial institutions Implication: Scale up impact in Africa SITUATIONAL ANALYSIS 49% of investment  Africa Management focus in African region Less than 1% in Africa
  • 6.
    Implication: Target Indiapopulation  1,1 billion people 17% of world population 72.22% of the people live in more than 550,000 villages high rate of coal consumption Percent of the population under the poverty line : 22% INDIA SITUATIONAL ANALYSIS
  • 7.
    Current sources offunds, Grants  social investors, donors, and charitable organizations Capital investments  E+Co. managed accounts, funds & affiliates Financial limitations Implication: Increase source and amount of funds SITUATIONAL ANALYSIS
  • 8.
    ISSUES & OBJECTIVESISSUES African Market Source of Funds Indian Market Where we want to be in 2020 Where we are A company that assist and fund clean energy entrepreneurship Providing 3.6 mn people with modern energy service investing in 138 companies To achieve higher impact on the environment through clean energy entrepreneurship Provide 100 million people with access to modern energy service targeting to invest in 2000 companies
  • 9.
    Issues Objectives AfricanMarket Indian Market Source of funds To increase environmental and social impact of 60m people in sub-Saharan region To increase environmental and social impact of 40m people in the Indian sub-continent To generate more funds in order to facilitate more operations in Africa and India ISSUES & OBJECTIVES
  • 10.
    II. The PeacockStrategy I. The Path Finding Strategy III. The Fund Raising Strategy
  • 11.
  • 12.
    The Path FindingStrategy Why? 1 Where? 2 How? 3 49% of funds in Africa sub-Saharan region  no access to electricity high potential of energy conservation opportunity has funded successful business venture RATIONALE
  • 13.
    Why? 1 Where?2 How? 3 The Path Finding Strategy
  • 14.
    Why? 1 Where?2 How? 3 Country Mozambique Burkina Faso Malawi Pop. w/o electricity in mil. CRITERIA FOR COUNRTY SELECTION Madagascar Kenya Morocco Cameroon Political Stability Rural Poverty (GNI in $) Rwanda 1 2 3 4 5 6 7 8 Nigeria Zimbabwe 9 10 17 11 15 11 9 13 29 8 73 8 0.55 0.31 0.3 -0.1 -0.14 -0.5 -0.86 -1.35 -1.49 -1.62 The Path Finding Strategy 530 - 1,250 less than 530 Less than 530 less than 530 530-1250 3000-9130 less than 530 less than 530 less than 530 less than 530
  • 15.
    Why? 1 Where?2 How? 3 Leverage competencies Marketing strategy Past experience with annaset, Vent L’Eau pour la Vie & new energies leverage on the training experience of the above companies Organize seminars & entrepreneur toolkit  encourage & stimulate interest Key message “ Think Business, Think Green” The Path Finding Strategy
  • 16.
    Why? 1 Where?2 How? 3 Leverage competencies Marketing strategy Past experience with annaset, Vent L’Eau pour la Vie & new energies leverage on the training experience of the above companies Organize seminars & entrepreneur toolkit  encourage & stimulate interest Key message “ Think Business, Think Green” The Path Finding Strategy Prioritization of countries Invest in 810 new enterprise in 14years
  • 17.
  • 18.
    Population  1.1 billion people
  • 19.
    17% of worldpopulation
  • 20.
    72.22% of thepeople live in more than 550,000 villages With 22% below poverty line
  • 21.
    55% of populationdon’t have electricity!!!
  • 22.
    Coal provides 70%of Indian electricity
  • 23.
    Mining  environmental damage, including pollution of water, depletion of water supply, destruction of land, harm to health and safety, ,major greenhouse gas and leads to more global warming. IMPLICATION: Focus on reducing coal as an energy Why Where 1 2 How 3 The Peacock Strategy
  • 24.
    Why Where 12 How 3 Region Middle West North Population density/Km meter CRITERIA FOR REGION SELECTION Population w/o electricity (in million) Coal consumption (million tons) East South 341 208 441 302 82 140 64 107 129 62 107 49 81 439 170 The Peacock Strategy 1 2 3
  • 25.
    Why Where 12 How 3 COAL CURRENTLY, Unhealthy huge emission of Carbon dioxide Non-renewable energy environmental damaging x BIO-MASS FUEL BRIQUETTES The Peacock Strategy
  • 26.
    Why Where 12 How 3 BIO-MASS FUEL BRIQUETTES RATIONALE A briquette (or briquet) is a block of flammable matter which is used as fuel to start and maintain a fire. replacement for oil & coal renewable source of energy help reduce carbon content in air Eco friendly, non polluting and economical 100% natural available from agricultural waste The Peacock Strategy
  • 27.
    Why Where 12 How 3 Aggressive strategies  financial & HR constraints Proposed JV with ETC Energy RATIONALE Goal congruence Financial and human resource assistance Same size allow flexibility Larger scope of operation The Peacock Strategy
  • 28.
    Why Where 12 How 3 Aggressive strategies  financial & HR constraints Proposed JV with ETC Energy RATIONALE Goal congruence Financial and human resource assistance Same size allow flexibility Larger scope of operation Assist, train, and help local entrepreneurs implement a business model for Briquette usage Ease the Financial & HR constraints Invest in 1009 enterprise in 14 years The Peacock Strategy
  • 29.
  • 30.
    The Fund RaisingStrategy Current Strategy Extended Strategy Funds, Partnership and financial institutions Receive Grants & Capital Investments Greenpeace Intl., Citigroup foundation, Bill & Melinda Gates foundation + Approach more foundations To Receive more funds from more foundations Government organizations, terrapass funds etc.
  • 31.
    Current Strategy ExtendedStrategy Interest Revenue increase funds for entrepreneur increase in number of successful entrepreneurs leads to snowballing effect The Fund Raising Strategy
  • 32.
    Current Strategy ExtendedStrategy Approach large corporations Shell (Oil) BP (Oil and energy) Vodafone (telecommunications) General Motors (Automobiles) Home Dep. (Furniture) Value Proposition CSR image  reputation & brand Competitive Advantage Enhance employee relationship Advertisement Strong relationship with community The Fund Raising Strategy
  • 33.
    Current Strategy ExtendedStrategy Affiliate with Banks Target banks worldwide access to large funds Example: HSBC, JP Morgan, Bank of Amercia The Fund Raising Strategy
  • 34.
    Carbon dioxide offset  396 million tons Reforested land  3309 hectares; 6.6million trees Providing countless Households with clean water Kerosene Displaced  6 million liters
  • 35.
  • 36.
    19 2017 18 15 16 11 12 Path finding Strategy Partner finding The Peacock Strategy African Country Penetration Approach Large corporation India penetration Fund raising 07 08 09 10 13 14 Affiliate with banks One country per year Timeline
  • 37.
    Financial Forecast $36,449,790 $9,741,328 Cash available for investments 2020 2007  
  • 38.
    Financial Forecast $22,940,969$6,645,182 Total Investment 2020 2007  
  • 39.
  • 40.
    Key Success FactorsAttraction of entrepreneurs Negotiation Skill
  • 41.
    Conclusion Issues AfricanMarket Indian Market Source of funds Objectives To increase environmental and social impact of 60m people in sub-Saharan region To increase environmental and social impact of 40m people in the Indian sub-continent To generate more funds in order to facilitate more operations in Africa and India The Path Finding Strategy The Peacock Strategy The Fund Raising Strategy
  • 42.
  • 43.
  • 44.
    Slide Navigator CompanyBackground Situational Analysis Issues and Objectives Recommendations The Path Finding Strategy The Peacock Strategy The Fund Raising Strategy Financial Justification KSF Conclusion Strengths Weaknesses Opportunities Threats
  • 45.
    Slide Navigator RiskFactors Why not carbon? Risk of 12 year strategic plan Other Joint Venture Sources and Citation IS Assumption Average seed investment Average loans Loan payment assumption No. of Enterprise
  • 46.
    Strengths Proven successfulbusiness model Learning culture E+co’s enterprise model was “technology neutral”
  • 47.
    Weaknesses Limited poolof resources Small identified pool of entrepreneurs
  • 48.
    Opportunities La Espranzahydroelectric project Partners carbon
  • 49.
  • 50.
    Risk Factors Limitedpool of entrepreneurs focusing on energy-related business Large corporations do not sponsor us High failure rate of new entrepreneurs Economic Crisis: entrepreneurs are dependant on economic and political stability
  • 51.
    Why not carbon?Trading of carbon credits does not reduce the overall emission of carbon Past history have invested a lot of money with La Esparenza but only impacted 194 households Limited resources both financially and human resource
  • 52.
    Risk of 12year strategic plan Uncontrollable factors Disasters Political instability Economic instability
  • 53.
    Other Joint VentureStern Fisher
  • 54.
    Sources and Citationhttp://www.worldcoal.org/pages/content/index.asp?PageID=402 http://www.ruralpovertyportal.org/english/regions/asia/ind/index.htm
  • 55.
    IS Assumption Revenue:Contributions – last yr contribution + 10% growth - Contribution from large corporations + 10% growth Program revenue - % of investments in programs Interest income – Cash 2.7% (from annual report) - Loans 8.6% - Dividend yield 6.3% Other income – Remain constant Expense: Program service - % of investments in programs Management and general – Constant growth of 10% Grant procurement - % of contribution Other expense – Remain constant
  • 56.
    Average seed investment15012 Equity 109988 Debt 125000 Average investment per enterprise 118 Total no. of investment 14721633 Total amount of investment 12% 1768000 Equity Investment 88% 12953633 Debt Investment From 1998 to 2006
  • 57.
    Loan receivable schedule0 27765 25637 2128 25637 5 25637 27765 23673 4093 49310 4 49310 27765 21858 5907 71168 3 71168 27765 20183 7582 91352 2 91352 27765 18636 9129 109988 1 Ending Balance Total Pmt Principal pmt Interest pmt Beginning Balance             Loans receivable schedule Average loans($109988, 5 years, 8.3%) :
  • 58.
    Loan payment assumptionLoans payment (5yr, 6.5%)
  • 59.
    No. of Enterprises224 1956 2020 10% per year 102 million Total Customers 15% Growth of customer base 15000 Customers of new enterprise 26000 No. of customers per old enterprise 203 138 Culmulative No. of enterprise 65 New enterprise 2007 2006 With Recommendation:
  • 60.
    No. of Enterprise2020 48 524 46 million Total Customers 10% per year 15% Growth of customer base 26000 No. of customers per enterprise 152 138 Culmulative No. of enterprise 14 New enterprise 2007 2006 Without Recommendation:
  • 61.
    Cost estimation Contributionfrom large corporations Funds from large corporations $ 22,724,275 Promotional marketing activities Expenses $ 185,898,844 Loans given out Capex